Article

Ecolabeling as a Policy Instrument for More Sustainable Development: The Evidence of Supply and Demand Interactions from Russia

1
Department of Economic and Mathematical Modelling, Peoples’ Friendship University of Russia (RUDN University), 6 Miklukho-Maklaya Street, 117198 Moscow, Russia
2
Economic Dynamics and Innovation Management Laboratory, V.A. Trapeznikov Institute of Control Sciences, Russian Academy of Sciences, 65 Profsoyuznaya Street, 117997 Moscow, Russia
*
Author to whom correspondence should be addressed.
Sustainability 2021, 13(17), 9581; https://doi.org/10.3390/su13179581
Submission received: 14 July 2021 / Revised: 14 August 2021 / Accepted: 19 August 2021 / Published: 25 August 2021

Abstract

:
Ecolabeling can complement more conventional policy instruments such as taxes and subsidies to stimulate more sustainable development of the economy. However, in practice, ecolabels may not always comply with legal requirements in terms of reliability, accuracy and clarity, and sometimes deliberately mislead the consumer. In Russia and many other developing countries, the problem of inaccurate information on the environmental properties of goods and services is still not recognized. The only regulatory document that currently defines the basic principles for developing and using environmental labels and declarations is the national versions of international standards ISO 14020/14021/14024/14025-Environmental Labels Package. This paper contributes to the literature in two main dimensions. It assesses the degree of prevalence of ecolabeling in the Russian market of everyday goods and the reliability and informational content of frequently used labels (supply-side research). Second, it estimates the consumers’ awareness and reaction to ecolabeled products (demand-side research). The most obvious finding to emerge from this study is that low consumer awareness keeps the level of greenwashing low, but at the same time does not stimulate eco-innovations. We suggest developing smartphone applications that allow buyers to check the compliance of ecolabels on a product with ISO standards directly during the shopping process. We propose to use this approach as a cost-effective and straightforward way to simultaneously raise consumer awareness of ecolabeling and reduce the likelihood of greenwashing.

1. Introduction

Conscious consumer behavior is essential to preventing and reducing waste and the burden on the environment. The everyday choice of products and services of millions of buyers can stimulate or draw back the sustainable development of the global economy [1,2,3,4]. In addition to assortment and price, information about the environmental properties of goods and the impact of the production of these goods on the environment is becoming an increasingly important factor of consumer choice in developed countries [5,6,7]. One of the main ways of communicating this information to the consumer is ecolabeling and eco-declarations.
It is well-known from the literature that ecolabeling can complement more conventional policy instruments such as taxes and subsidies in stimulating more sustainable development of the economy [3,8,9]. Ecolabeling increases consumer awareness and leads to the emergence of new environmentally friendly goods, technologies and production systems [6,10,11]. It is a way for firms to appeal to the consumers’ preferences for green products and an efficient instrument for the government to internalize the negative externalities through the Pigouvian tax. Unlike direct subsidies, ecolabeling does not require large budgetary expenditures. Instead, the role of the government is to guarantee transparency in the markets and fair regulation of certification systems [2]. Some scholars refer to this role as information-based environmental governance [12].
In practice, the abundance of labels and environmental declarations can reduce the understanding of the fundamental differences between products and create barriers to trust in the information provided [7,13]. Ecodeclarations may not always comply with legal requirements regarding reliability, accuracy and clarity, and sometimes deliberately mislead the consumer [14,15,16,17]. The unjustified positioning of goods and services, and sometimes entire companies, as environmentally friendly is called greenwashing (the term introduced in 1986) and has become a significant obstacle to forming sustainable patterns of consumer behavior. In 2016, the European Union adopted some regulations as a priority measure to combat greenwashing. These regulations equate misleading information in environmental declarations with unfair commercial practices [18]. Australia has a Trade Policy Act, according to which a business caught in consumer manipulation is liable to a fine of USD 1.1 million. In addition, it will be forced to disseminate truthful information about the environmental impact of its product at its own expense [19]. Another example of the fight against greenwashing can be found in the United States. The United States has introduced administrative and criminal liability for pseudo-ecological products and false information in advertising or on the label. Information accuracy is within the purview of the Federal Trade Commission (FTC). There was a well-known precedent in 2013 when PepsiCo was fined USD 9 million for publishing false information about the naturalness of its drinks and the fact that they contain additional helpful vitamins, while the vitamins in drinks were synthesized and were synthetic ingredients [20]. Canada has the Competition Act, the Consumer Packaging and Labelling Act and the Textiles Labelling Act, enabling regulatory action against companies engaging in greenwashing. In addition, in 2008, the Competition Bureau of Canada published a document called “Environmental Claims: A Guide for Industry and Advertisers” to guide how the agency would interpret instances of potential greenwashing [14].
In Russia, inaccurate information on the environmental properties of goods and services is still not recognized. The only regulatory documents that currently define the basic principles for developing and using environmental labels and declarations national versions of international standards ISO 14020/14021/14024/14025—Environmental Labels Package. However, as with all ISO standards, these standards are voluntary for use; failure to comply with their requirements may entail only minor reputational consequences for the manufacturer. In addition, the provisions of these standards for ecolabelling are not widely known to the general consumer, which minimizes the likelihood of buyers coming up with complaints to such official bodies as the Russian Federal Service for Surveillance on Consumer Rights Protection and Human Wellbeing (Rospotrebnadzor).
At the same time, speaking of the underdevelopment of protection systems against greenwashing in Russia, it would be fair to note that the degree of greenwashing in this country and its impact on the efficiency of ecolabeling as an instrument of sustainable development policy has not yet been studied. In the Russian literature, only the greenwashing problem has been noted, and the potential factors and consequences of its occurrence are studied [21]. We have not identified any quantitative estimates of the prevalence level of greenwashing in a particular group of consumer goods in the literature. In the English literature, the USA and European countries are the most analyzed. Prieto-Sandoval et al., in their systematic literature review, also conclude that there is a growing body of literature on ecolabeling in emerging Asian economies such as China and India, but they detect a research gap in other developing countries [2]. To the best of our knowledge, empirical evidence of ecolabeling as a policy instrument for sustainable development based on primary data from Russia is almost non-existent in the literature.
The previous gap recognized in the literature motivated a dual objective for our study: first, to assess the degree of prevalence of ecolabeling in the Russian market of everyday goods, its reliability and informational content (supply-side research) and, second, to determine the consumers’ awareness and reaction to ecolabeled products (demand-side research). Understanding the existing problems of ecolabeling from both sides will allow us to formulate conclusions and proposals for increasing the efficiency of government regulation in this area and turning ecolabeling into an instrument to stimulate sustainable production and consumption.
The paper is structured as follows: Section 2 presents the literature review results and systemizes the study’s theoretical framework. Then, Section 3 describes empirical research methodology for analyzing the problems in ecolabeling from the supply-side (Section 3.1) and demand-side (Section 3.2) perspectives. Section 4 presents the results of empirical research from both sides and compares them with theoretical and empirical results from other developed and developing economies. Finally, conclusions and policy applications are presented in Section 5.

2. The Theoretical Foundations and Empirical Evidence of the Problems in Ecolabeling: Literature Review

A large number of published studies describe the role of ecolabeling in consumers’ decisions and investigate the factors of consumers’ willingness-to-pay the price premium on ecolabeled goods and services. The survey of Schumacher [22] shows that approximately 50% of Europeans pay attention to ecolabels while making their everyday consumption decisions. Moreover, the influence of ecolabeling on purchasing decisions is higher depending on the consumer’s environmental awareness. The study of Harman Group (USA) demonstrated that approximately the same share of Americans (50%) is aware of at least four the most popular certifications [23]. The study of Gutierrez and co-authors [24] conducted in Philippines revealed that almost 88% of the respondents prefer eco-products, but 12.20% do not buy any eco-products because they are not ready to pay a premium price. However, most respondents experience more positive feelings in purchasing eco-products (21.4% positive answers compared to 5.4% for traditional products) because they feel they are contributing to the improvement of the environment. Rochikashvili and Bongaerts report that 62.2% of the respondents pay attention to the Blue Angel ecolabel on the packaging of indoor paint products in Germany (according to the results of their survey [6]). Another interesting finding of their survey is a very high understanding of life-cycle analysis (LCA) information among respondents (71%).
Srinivasan and Blomquist, in their study [25], found that the buyer’s age and income significantly affect their willingness to pay for ecolabeled goods. Wojnarowska and co-authors [9] interviewed 250 consumers to identify the essential factors in making a purchase decision and concluded that economic factors are more important than environmental ones. Di Martino and colleagues also used a survey to assess the various impact of pro-environmental attitude, knowledge and ecolabeling information on purchasing decisions [26]. Their results demonstrate that ecolabeling plays the most significant role in purchasing environmentally friendly products. Tully and Winer conducted a meta-analysis of over 80 studies completed in 1996 to 2012. They concluded that, on average, 60% of respondents are willing to pay a positive premium for socially responsible goods, and the willingness to pay is greater for products that are beneficial for humans (for example, organic food) than for products that are beneficial for the environment [27]. Song and co-authors [28] examined consumers’ behavior in real-life shopping environments using eye-tracking glasses technology and found that ecolabels received very little attention from consumers. The paper explains this contradiction with the results of other scholars by introducing the idea of habitual shopping and emphasizes the importance of informing consumers on the environmentally friendly features of a product well before the actual decision-making situation.
Many studies are also devoted to the problems of poor recognition and a lack of information content on ecolabels. For example, in the study of Grunert et al. [29], conducted in 6 European countries (UK, France, Germany, Spain, Sweden and Poland), they found that only 12% of responders recognize EU eco-labels, despite it being one of the oldest certification schemes and ecolabels in Europe. The study of Clemenz [13] questions the efficiency of ecolabels when they do not make any differences between abatement methods (end-of-pipe or a clean technology approach). The author concludes that ecolabels should be more specific concerning the abatement methods for which they certify. Simeone and co-authors provide empirical evidence that despite the improvements in the European legislation on labeling, the information asymmetry between producers and consumers remains high because of consumers’ lack of knowledge concerning niche certifications [30]. Van Amstel and his colleagues prove in their study [5] that one of the most significant disadvantages of ecolabels is that they cover only the planning and implementation stage of the production process. This means that the actual ecological impact of ecolabeled products is not measured and monitored. In addition, there is an information gap between the certification body and the consumer because an average consumer has no idea how certification bodies execute their audits.
A large and growing body of recent literature has investigated the role of the government in establishing ecolabeling schemes and certification systems. François-Lecompte, with co-authors, analyzed an attempt by the French authorities to introduce a mandatory system of environmental certification and the reasons for the resistance of the business community to this initiative [3]. The study showed that the risk of losing the competitiveness of a product in the market and the additional costs associated with researching the complete lifecycle of products are the main reasons for companies’ refusal to certify products and ecolabels. The scholars also emphasize that companies’ unpreparedness for certification creates the risk of cheating and manipulation. Paper [31] states that national governments are working hard to make ecolabeling and certification programs more transparent, inclusive, and impartial. While individual consumers may not be sufficiently aware of the purpose and content of ecolabels to make the right personal choices, the availability of environmental information is itself an incentive for companies to change and behave more environmentally. This stimulus is called in the paper the ”shadow of consumer”. In the paper of Sun and Zhang [17], a model has been built, based on which it is shown that the government should play a vital role in the prevention of greenwashing.
Moreover, the state penalty (fine or tax) should exceed the potential benefits of greenwashing. In addition, for the development of eco-innovation and improvement of green income levels for enterprises, the government should increase green demand by educating consumers. Zhang et al., in [15], study the impact of greenwashing in high pollution/high visibility industries on consumers’ purchasing intentions in China. They conclude that government should implement strict certification programs with ecolabels to reduce consumer skepticism about firms’ environmental claims and support the growing market of green products.
On the other hand, as noted in [14], the government’s ability to combat greenwashing is limited. First, monitoring the information space for signs of greenwashing is costly. Secondly, statements about the environmental friendliness of certain goods, services and production processes can be difficult to verify; professional expertise and laboratory research are required. Therefore, in addition to state control, the authors propose to involve financial organizations (banks, funds), environmental non-governmental organizations (NGOs) and Industry associations in the fight against greenwashing. In addition, the authors note that voluntary environmental certification systems are a realistic way to reduce greenwashing. At the same time, the paper [1] argues that self-funded voluntary ecolabel schemes can suffer from poor/slow processes and the lack of reputation, while mandatory labels (for example, danger symbols, conformity with standards, national rating schemes etc.) usually have a higher level of recognition and support of consumers.

3. Methods and Data

3.1. Analysis of the Prevalence and Information Content of Ecolabels on Everyday Goods in Russian Supermarkets (Supply Side of the Market)

At the first stage, an analysis of the literature on greenwashing was carried out and the main features of this phenomenon were identified (so-called “seven sins of greenwashing”). Furthermore, a content analysis of the standards ISO 14020/14021/14024/14025 was carried out to match the evidence of greenwashing and the requirements of standards to eliminate this phenomenon. A system of criteria was drawn up and formulated as a checklist for verifying the environmental labeling of goods for compliance with ISO 14021/14024. Requirements of ISO 14020 were not included in the checklist since they introduce basic principles only. Requirements of ISO 14025 were not considered since this standard is more related to B2B communication (Table 1).
At the second stage, a study of labeling of various groups of goods sold in the largest chain stores in Russia (“Okey”, “Auchan”, “Lenta”) was carried out. The investigation method was a personal inspection by the interviewer at various points of the retail chain in Krasnodar City (Krasnodar region, Russia [32]). The interviewers were students at the local university (Kuban State University) studying “Standardization and Certification”. This choice of interviewers is because, on the one hand, students have a general theoretical idea of the purpose of product certification and can be considered informed consumers. On the other hand, they are not experts in ecolabeling and may have the same difficulty in identifying ecolabels as the average consumer.
During the inspection, the interviewer collected information about the presence or absence of ecolabeling on the product, the type of ecolabeling, compliance of the ecolabel with the requirements of standards, the name of the manufacturer and the price of the product. The degree of compliance of the ecolabelling with the standard requirements was assessed as yes/no/partially/no information can be found. If necessary, to verify information about particular programs of voluntary environmental certification of goods, additional research was carried out on official Internet sites and other sources of information about these programs.
At the third stage of the study, a statistical analysis of the data obtained was carried out, the most common inconsistencies of ecolabeling with the requirements of ISO 14020-14025 standards (which may be signs of greenwashing) were identified.

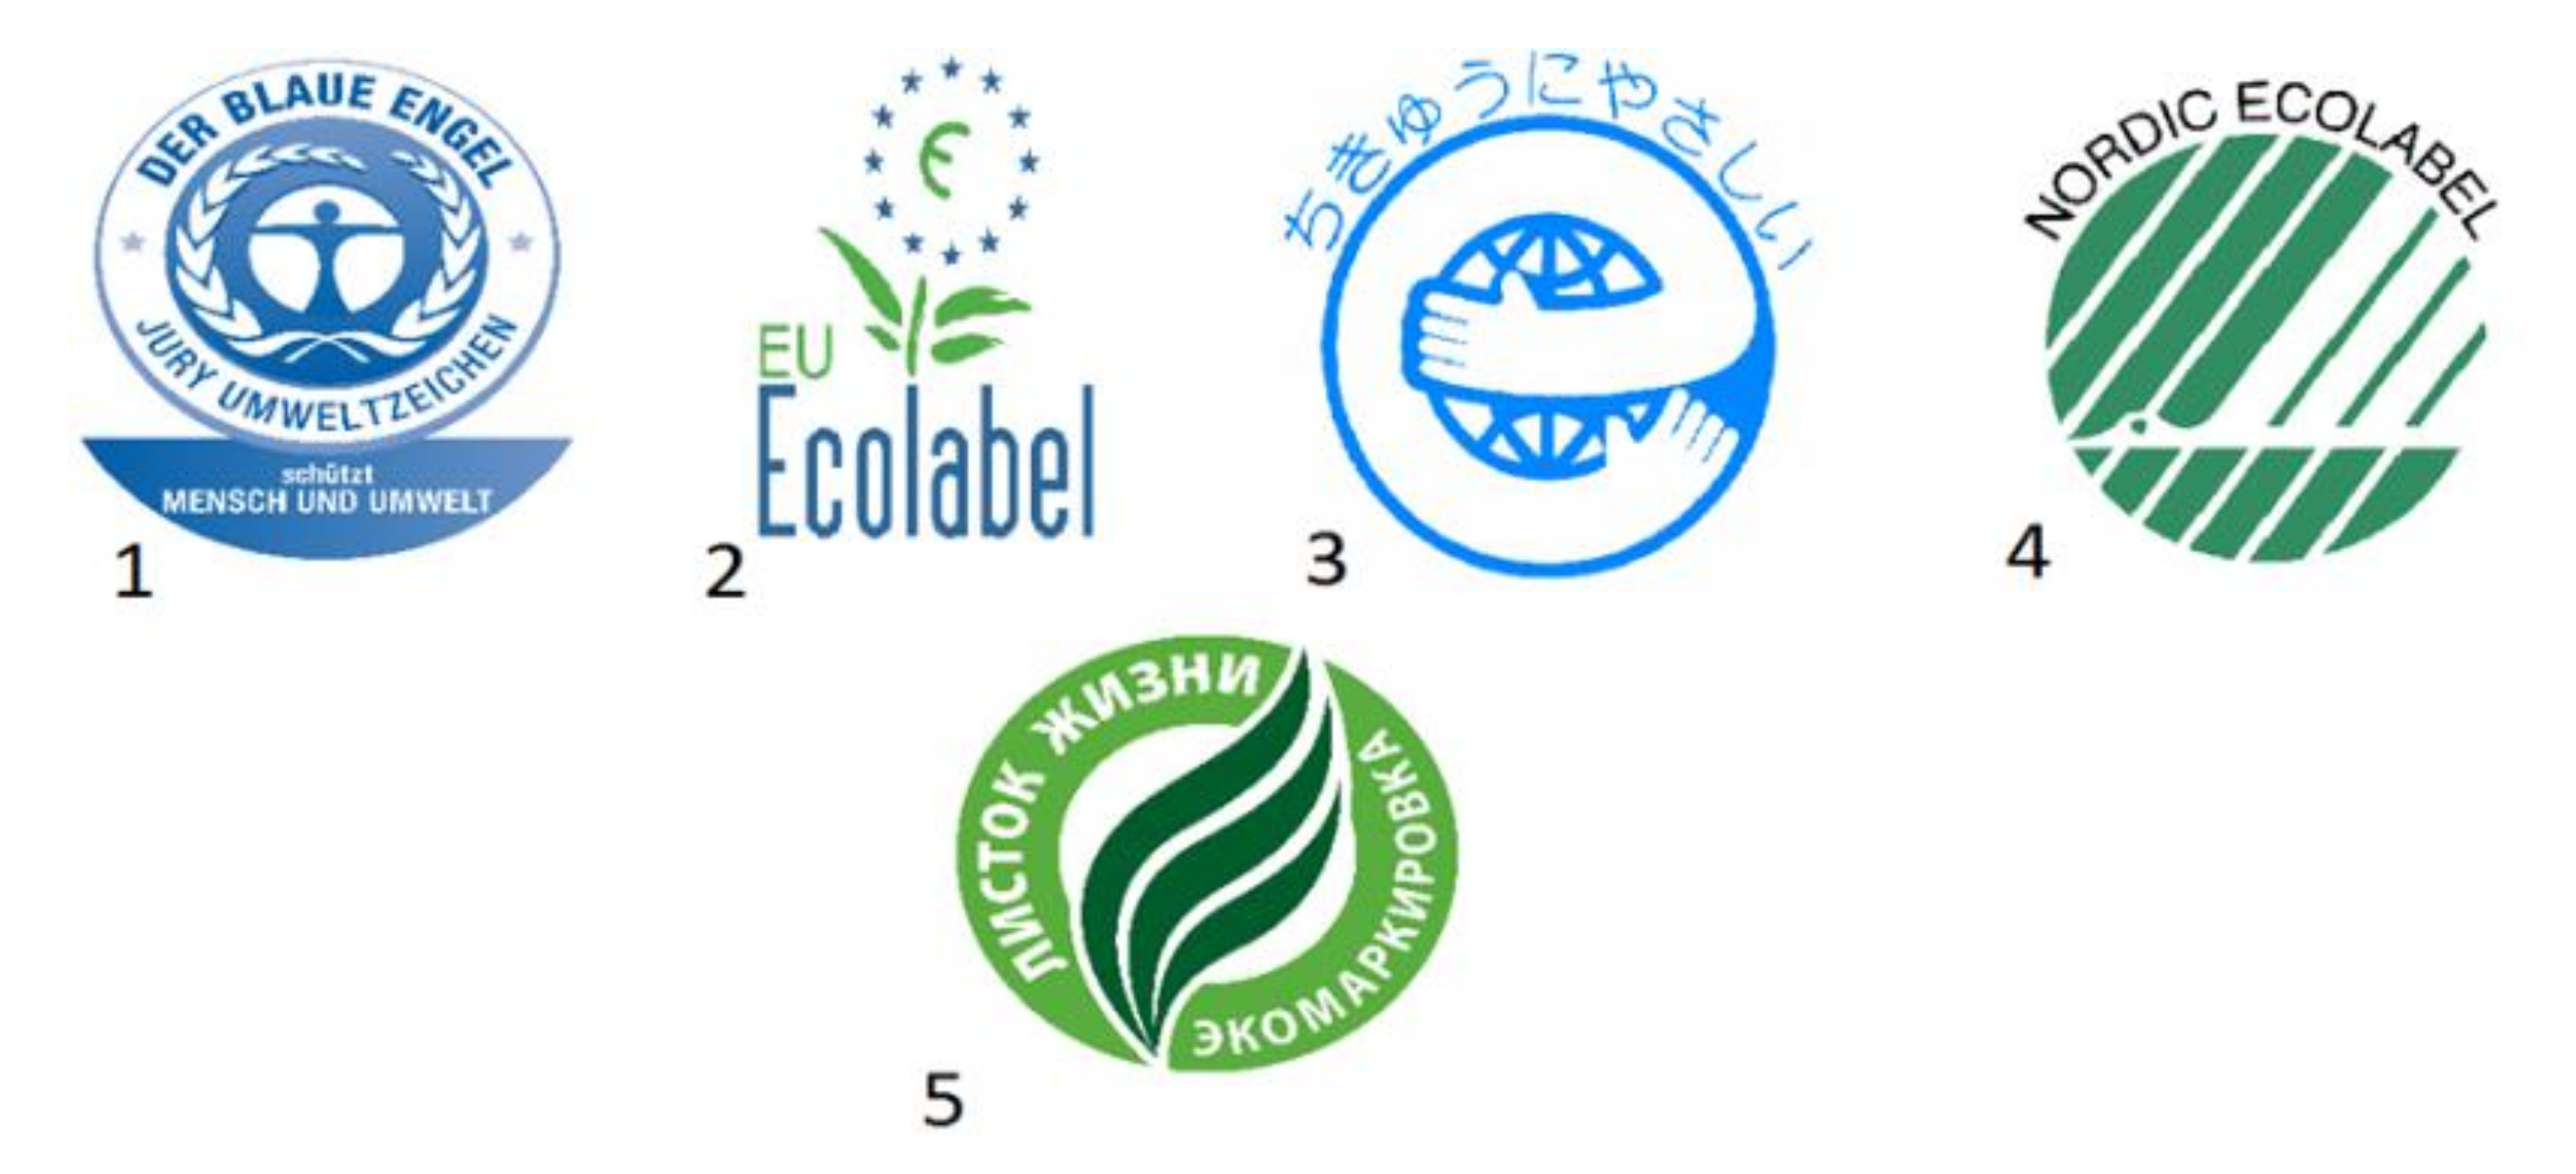
3.2. Analysis of Consumers’ Recognition and Attitude toward Ecolabels

We surveyed 250 respondents using a three-part questionnaire to assess consumer awareness and confidence in the ecolabelling system (Table 2). The first part of the questionnaire was informational and fixed the sociodemographic data of the respondent. The second part of the questionnaire aimed to determine the respondents’ recognition of the most popular ecolabels on the Russian market of everyday goods (Figure 1). We asked the respondents to answer whether they are familiar with five ecolabels, how they understand the purpose of ecolabeling, and how many other ecolabels they know, etc. (multiple choice questions). The third part of the questionnaire aimed to assess the frequency and reasons for choosing (or not choosing) ecolabeled products in everyday shopping.
The study was launched in March 2020 on a pilot group of respondents (N = 100) from Krasnodar City (Krasnodar Region, Russia). On the stage of pilot research, we used a face-to-face survey method. After processing the pilot study results and clarifying some questions of the questionnaire, the study was transformed into an online survey, extended to different age groups and regions, and continued until May of 2021. The survey results were coded and then checked for outliers and completeness of responses. After eliminating the erroneously completed questionnaires, the sample consisted of 250 respondent’s answers. The distribution of respondents by sociodemographic characteristics is presented in Table 3.
As one can see from the data in Table 3, the distribution of respondents by socio-demographic characteristics is uneven. However, this is not a drawback of the survey. Instead, the opposite is true. The predominance of women in the sample is preferable from the point of view that they play a more active role in shopping for goods of the studied categories (household chemicals, perfume and hygiene goods, food, office supplies). The predominance of young people in the sample is due to the involvement of university students in the survey. This is preferable since it is the most flexible, informed group of the population. In this context, the survey results can help assess the effectiveness of environmental disciplines taught in universities, colleges, etc. The predominance of persons with an average income level in the sample allows us to study the influence of the price elasticity of a product on consumer choice. The predominance in the sample of respondents with higher and postgraduate education is also preferable. It increases the likelihood of the respondents’ awareness of the survey topic and their more conscious participation in it.
Most notably, only two large regions of Russia are included in the sample—these are Krasnodar with the Krasnodar Region (the region where the study was initiated) and Moscow with the Moscow Region (the biggest agglomeration in Russia). Due to the weak representation of other regions in the sample, we did not conduct any studies where the region of living was a grouping variable (factor). We identified three categories of residence: (1) Moscow agglomeration (21.2%), (2) a city with a population of over one million (47.2%) and (3) a city with a population of less than a million or a rural area (31.2%).
Since the respondents’ answers were represented mainly by rank, categorical, and dichotomous variables (see Appendix A, Table A1), the Frequency Analysis and cross-tabulation (or contingency) tables were used for processing the survey results. Relations between any two dichotomous variables were assessed by 2 × 2 contingency tables, and relations between categorical data in general were assessed using r × c contingency tables, where r is the number of possible values of first categorical variable and c is the number of possible values of the second categorical variable. In order to determine whether two variables A and B (attributes or answers of respondent) are independent or related, statistics X2 was calculated by the following formula:
X 2 = i j ( n i j e i j ) 2 e i j ,
where eij—expected frequencies and nij—real frequencies of the event that there are nij respondents in the sample with i-th value of A (i = 1,…r) and j-th value of B (j = 1,…c).
Since, in the general case, statistics X2 is approximated with χ2 distribution with (r − 1) × (c − 1) degrees of freedom, the statistical significance of relationships between variables was determined by calculating χ2 criteria in Statistica 12.0 software.

4. Results and Discussion

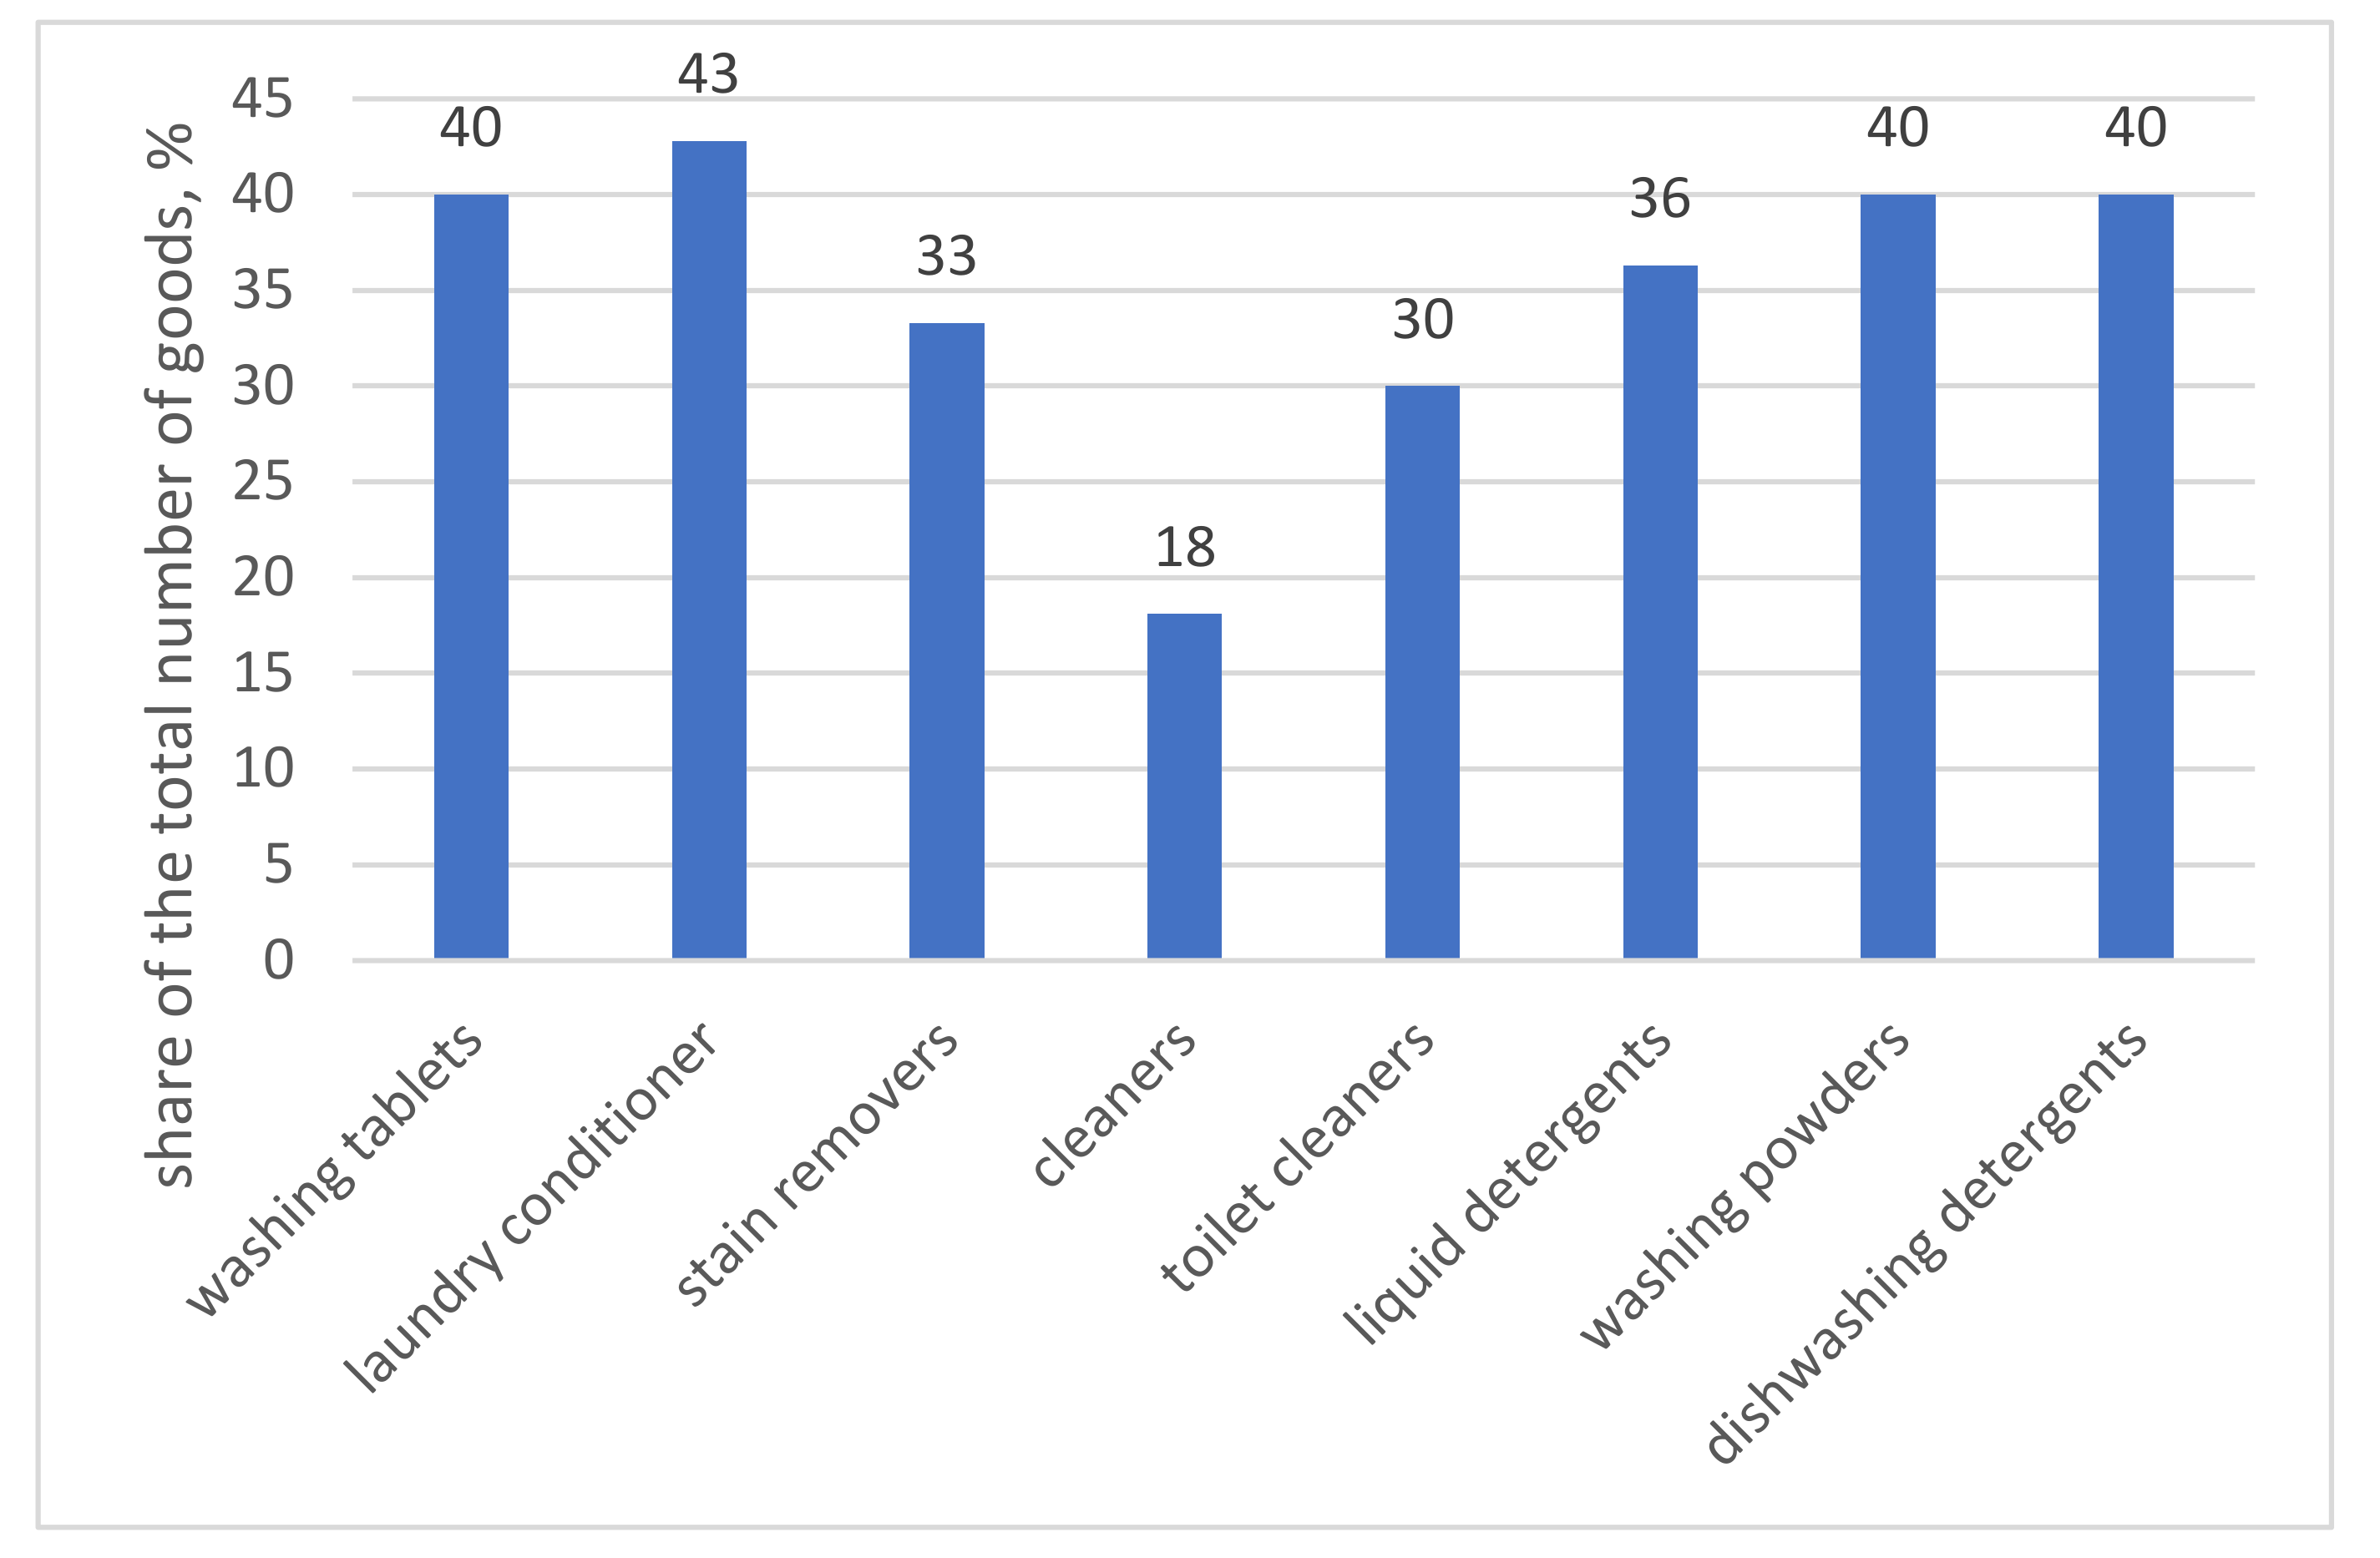
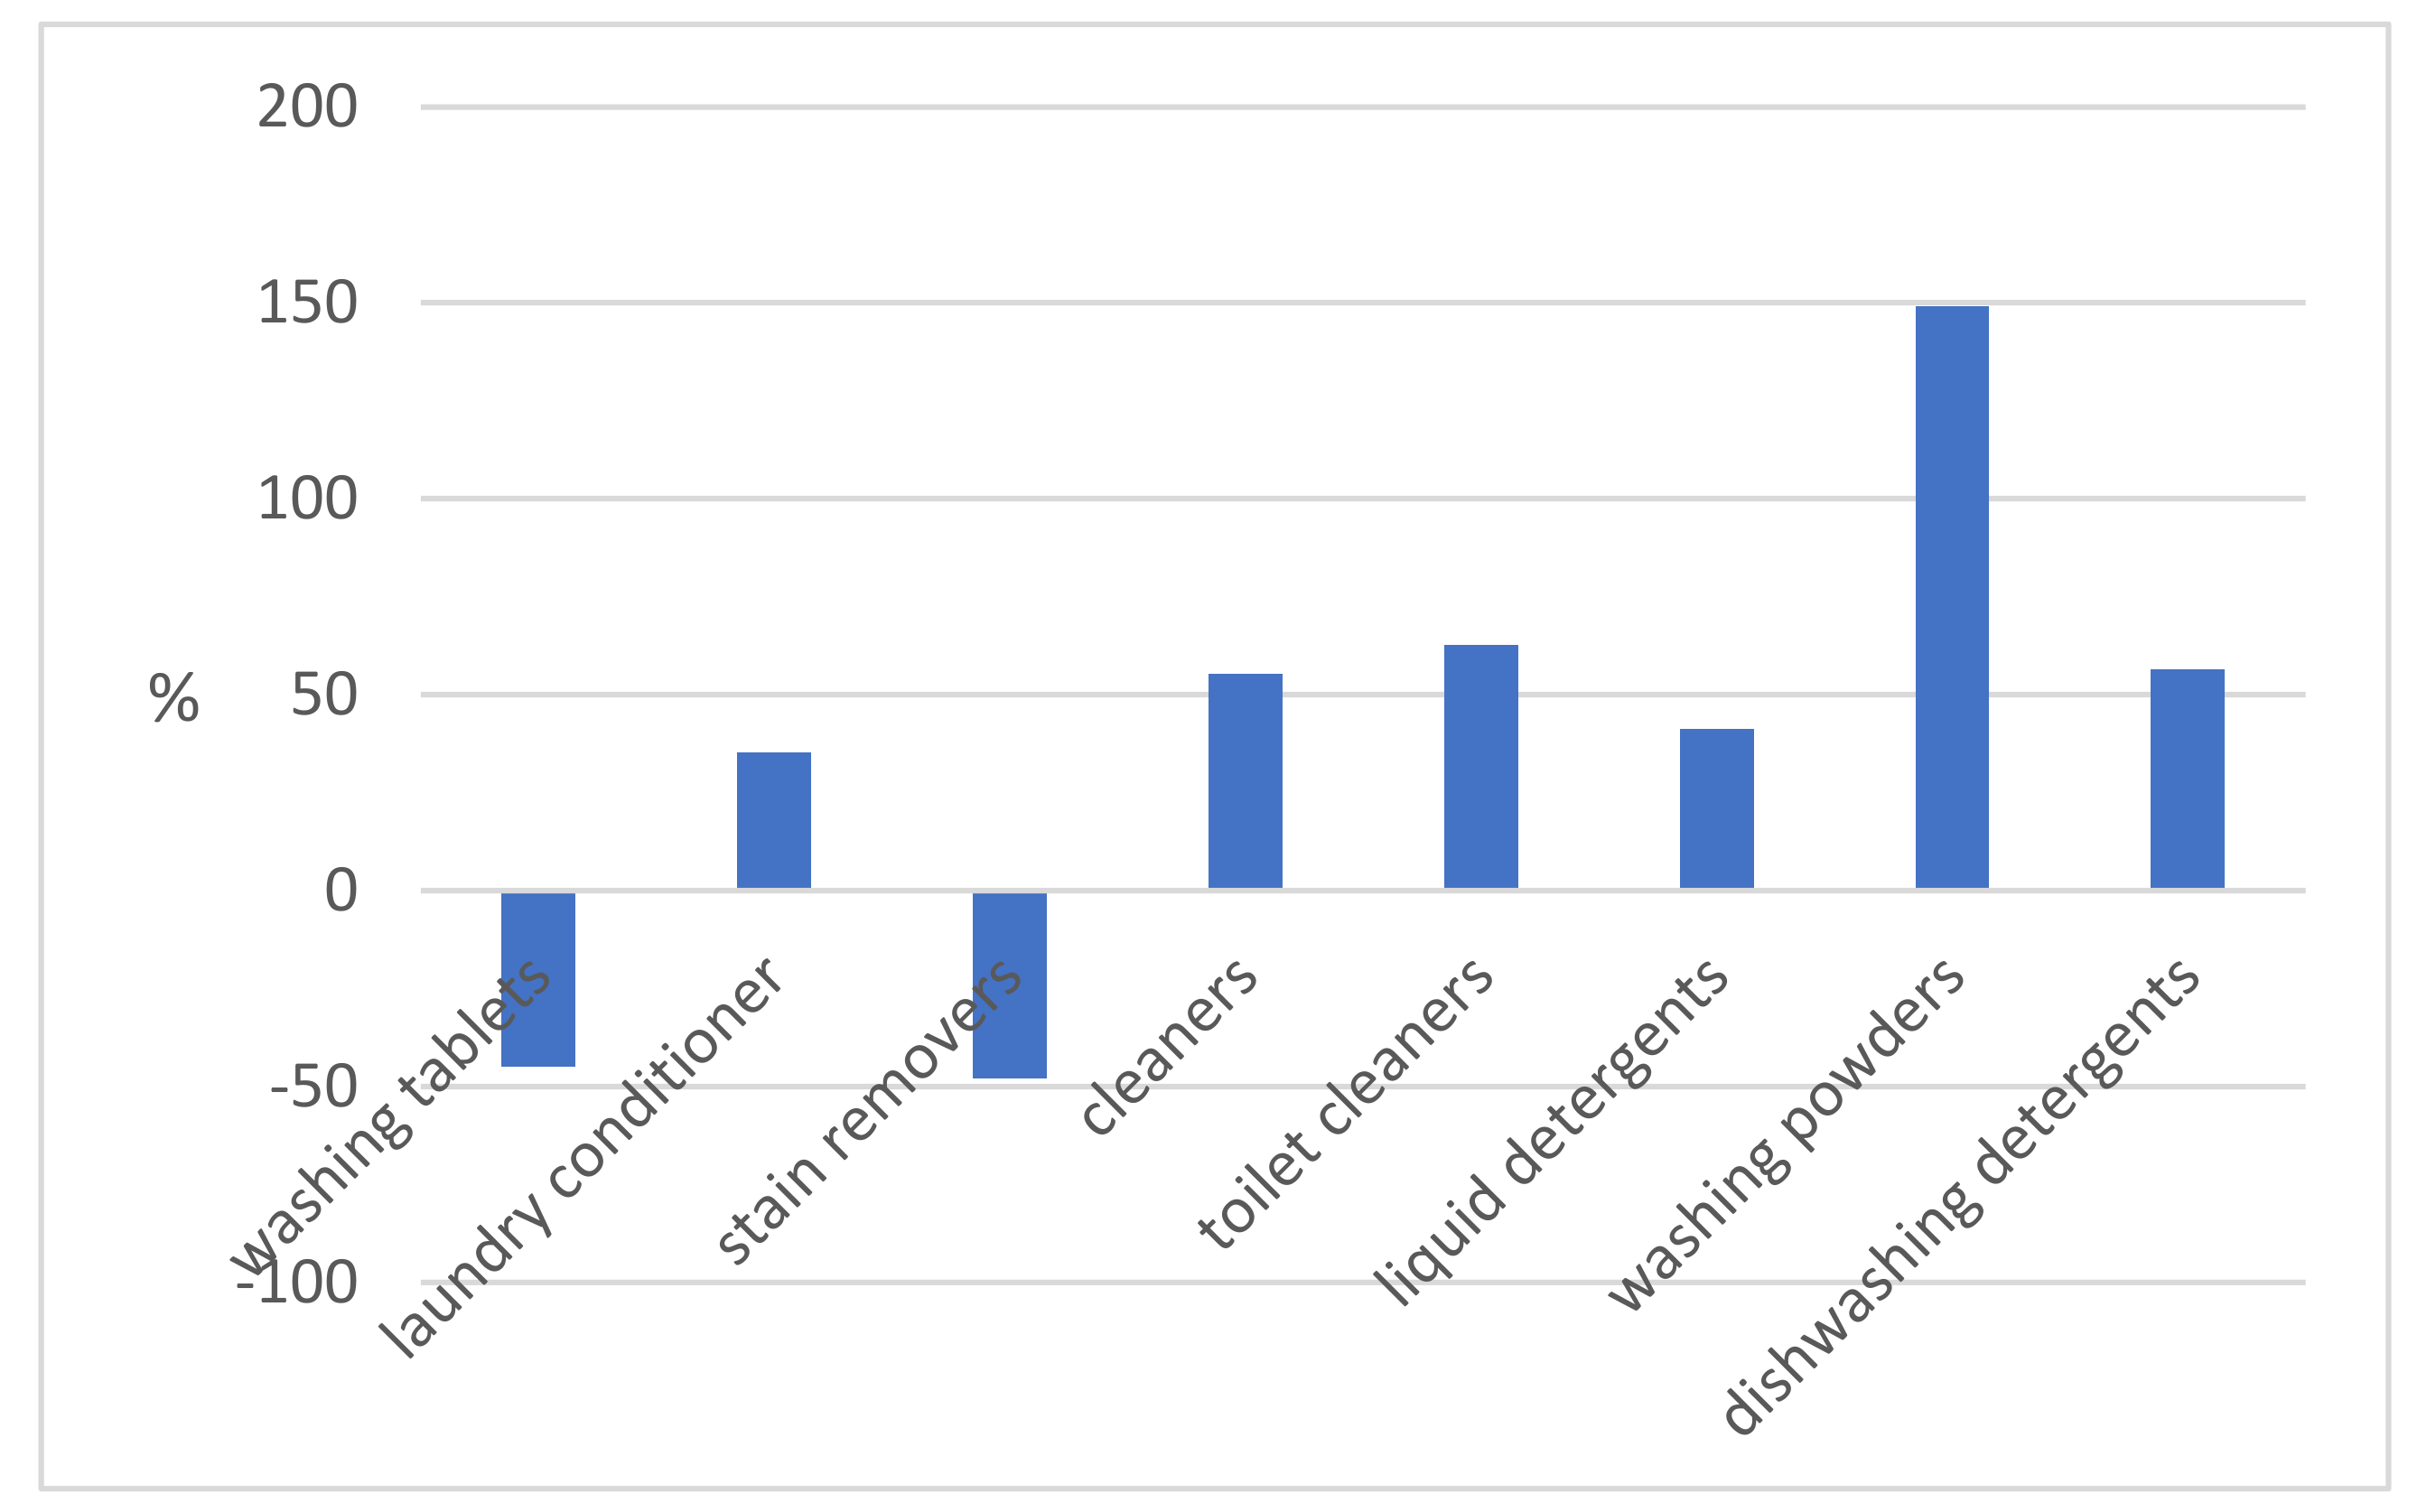
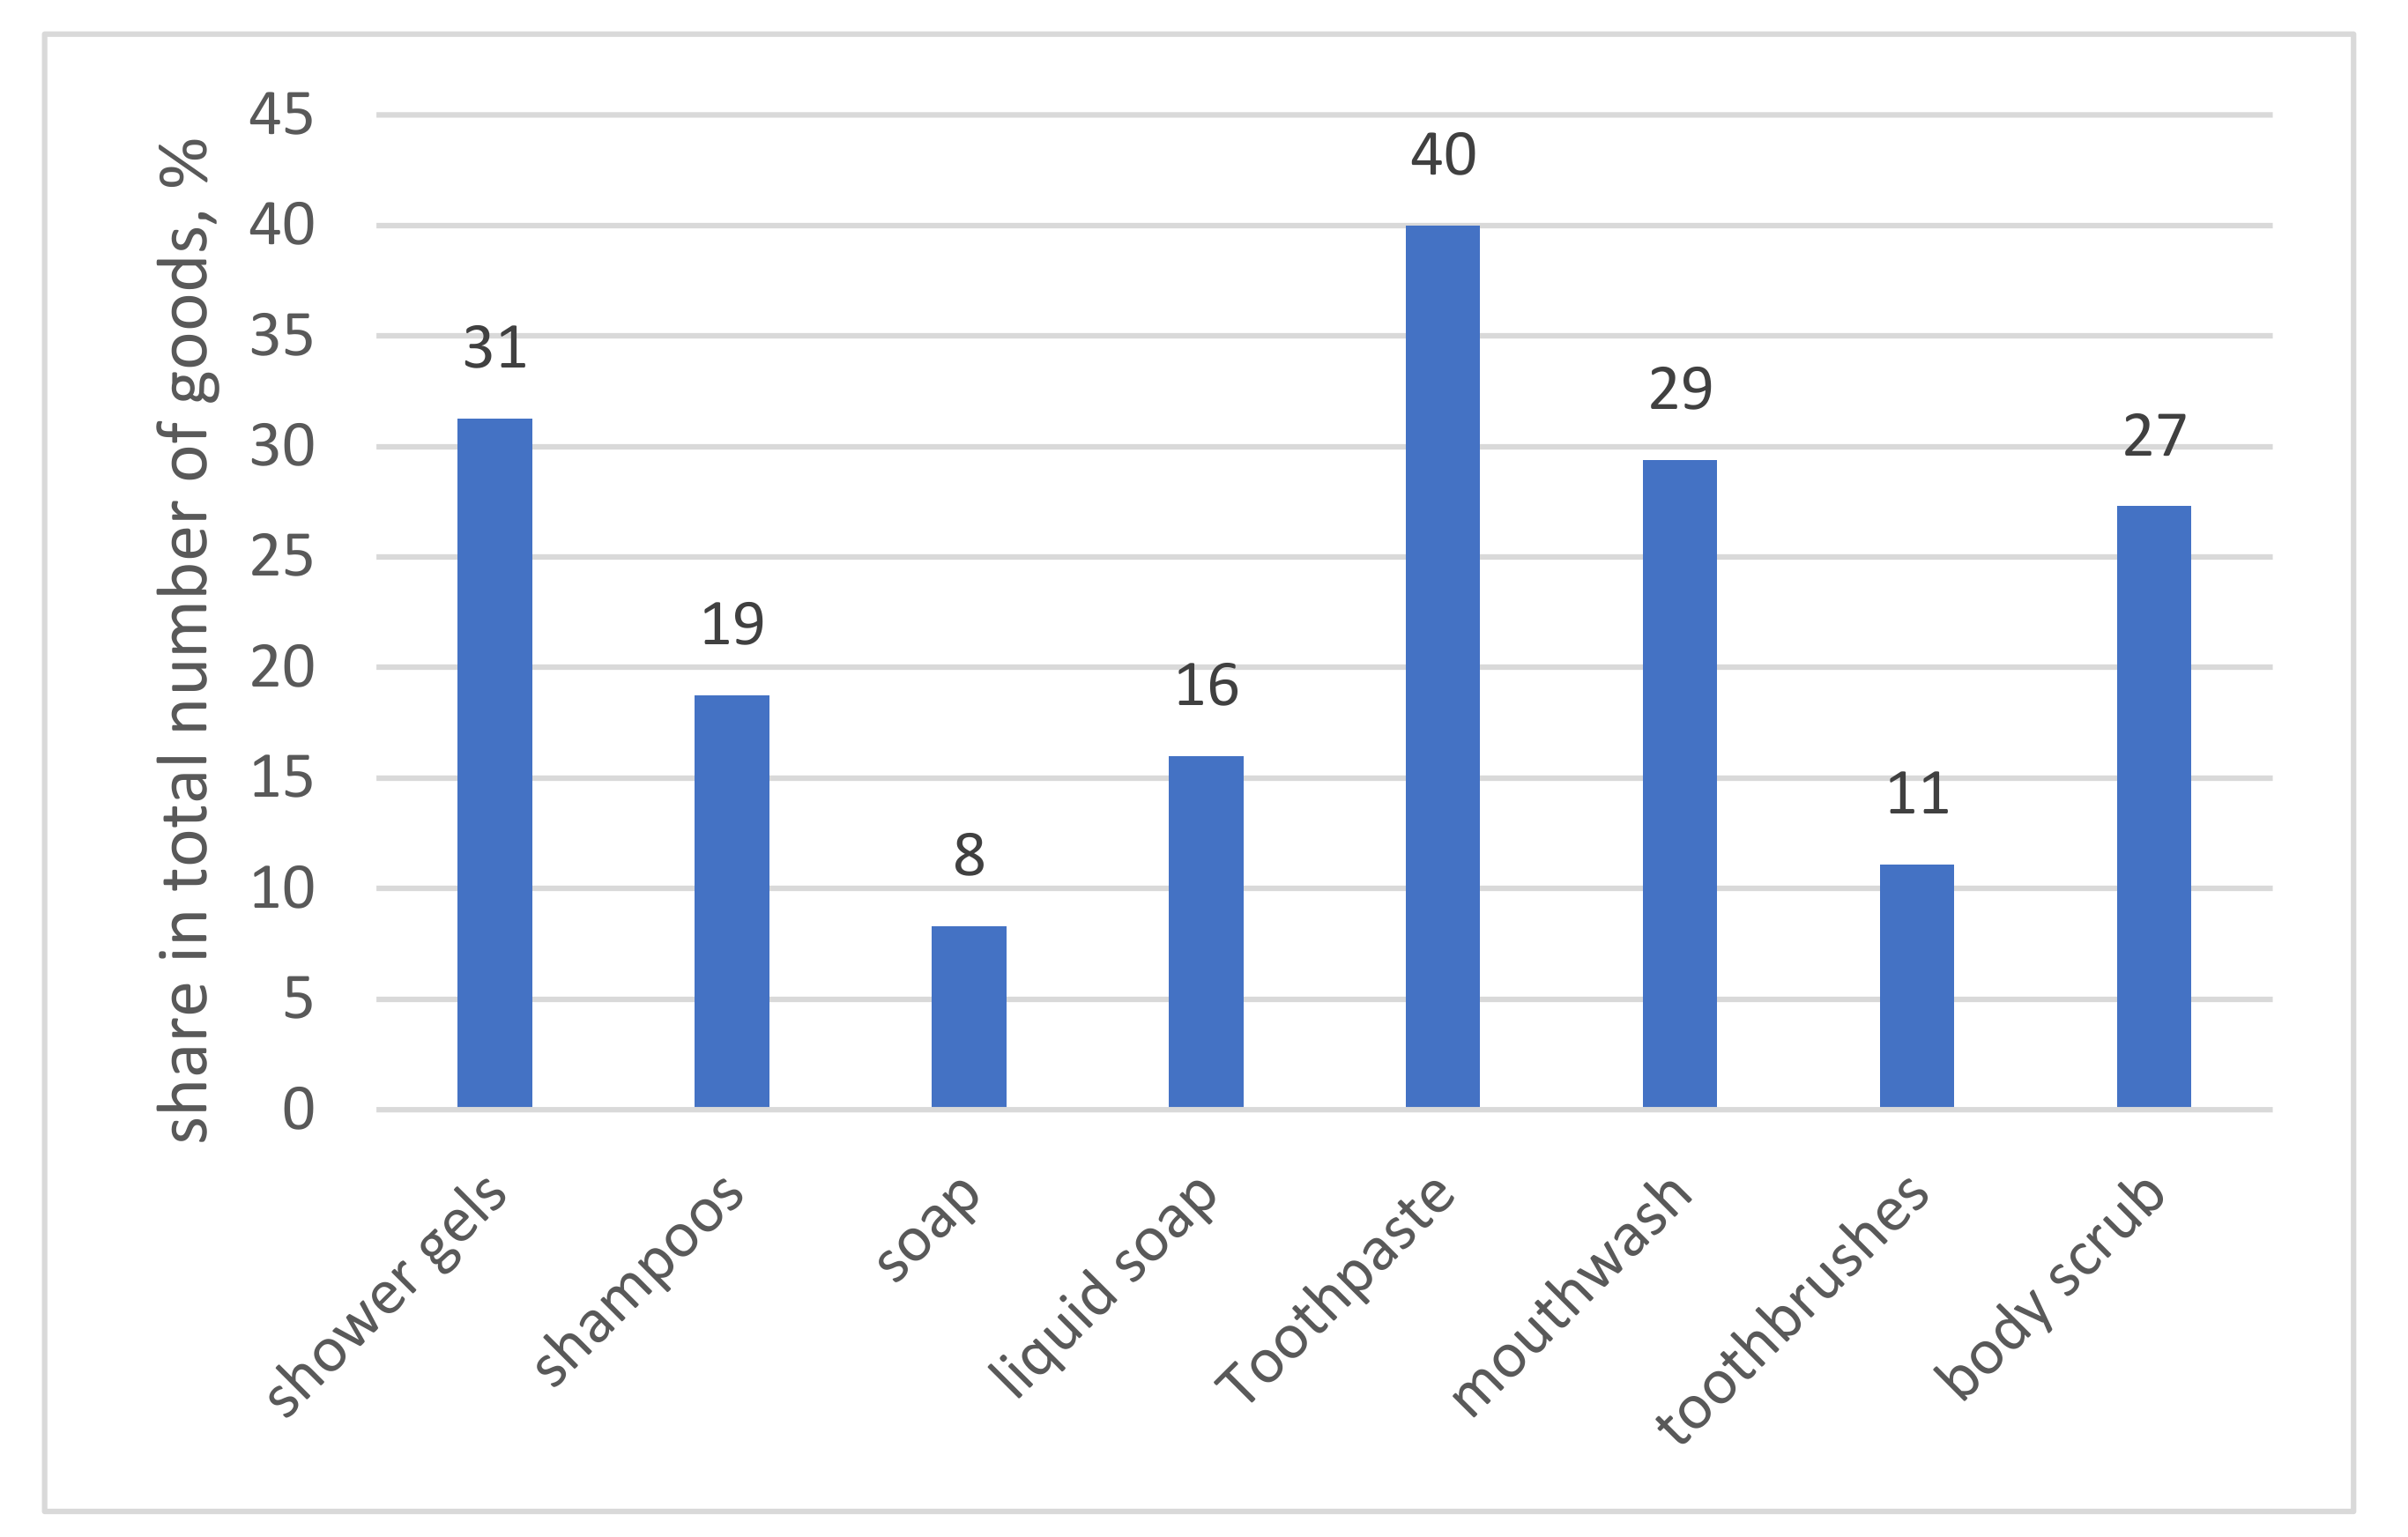
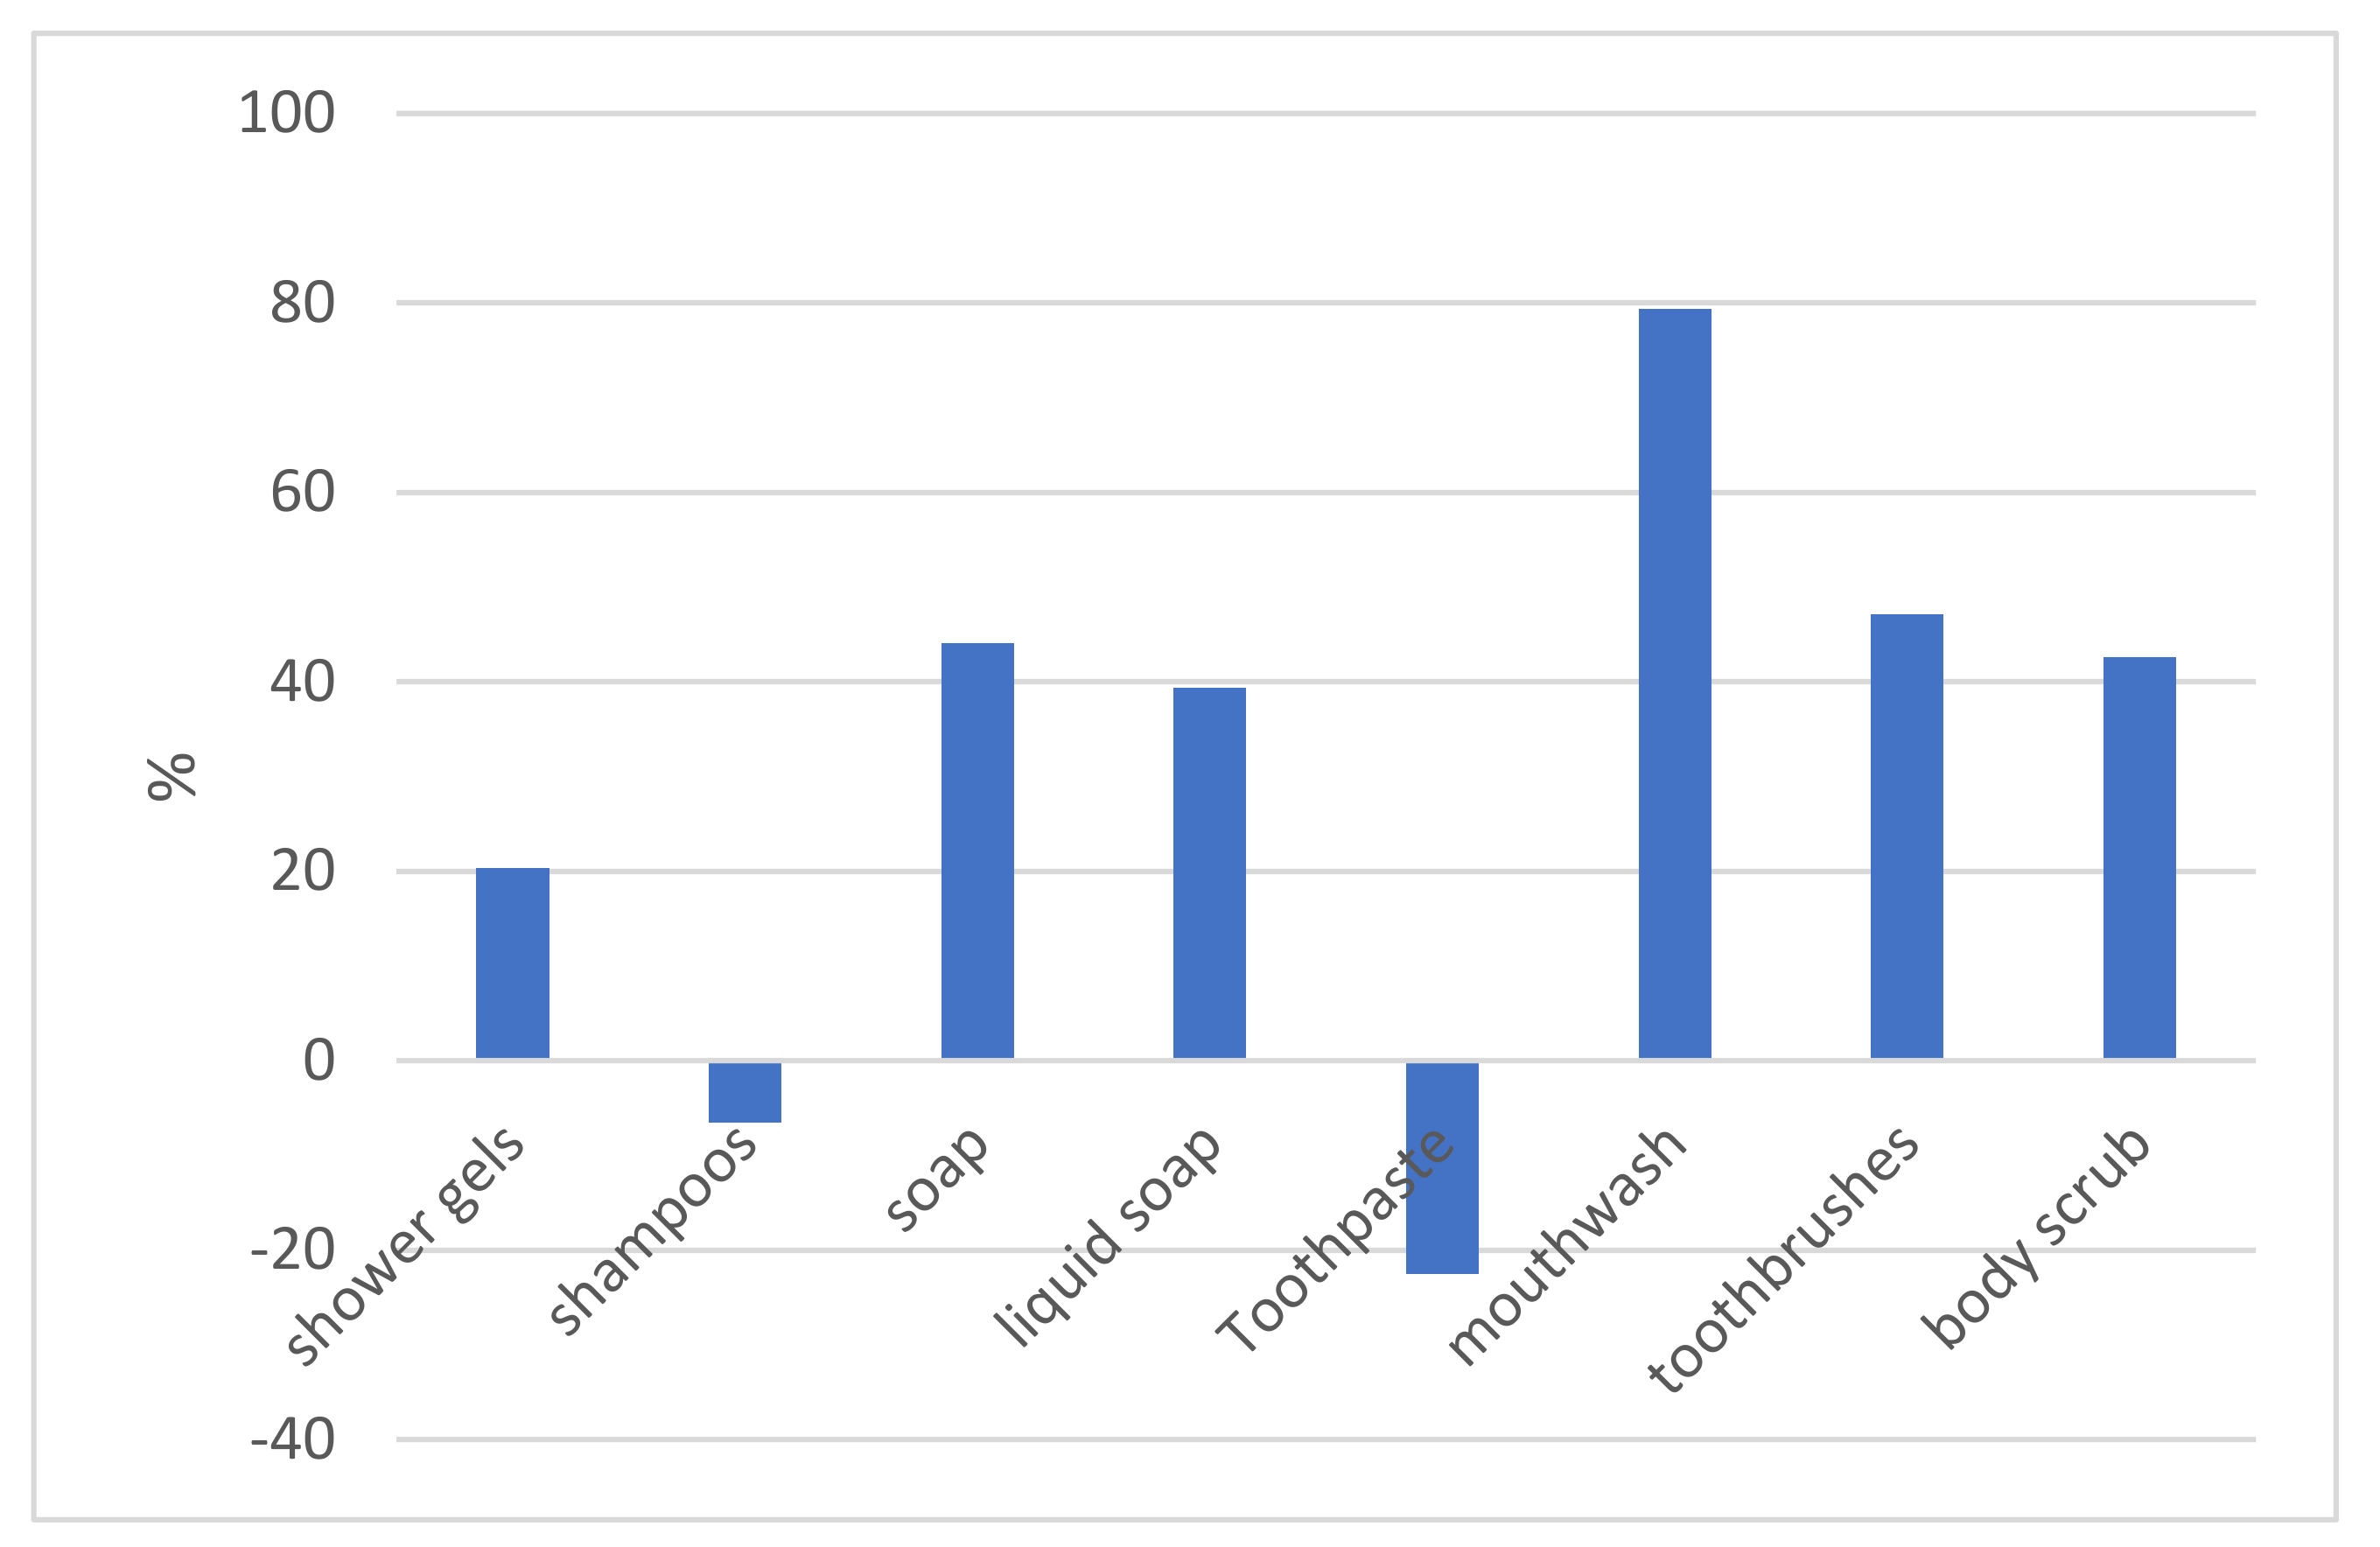
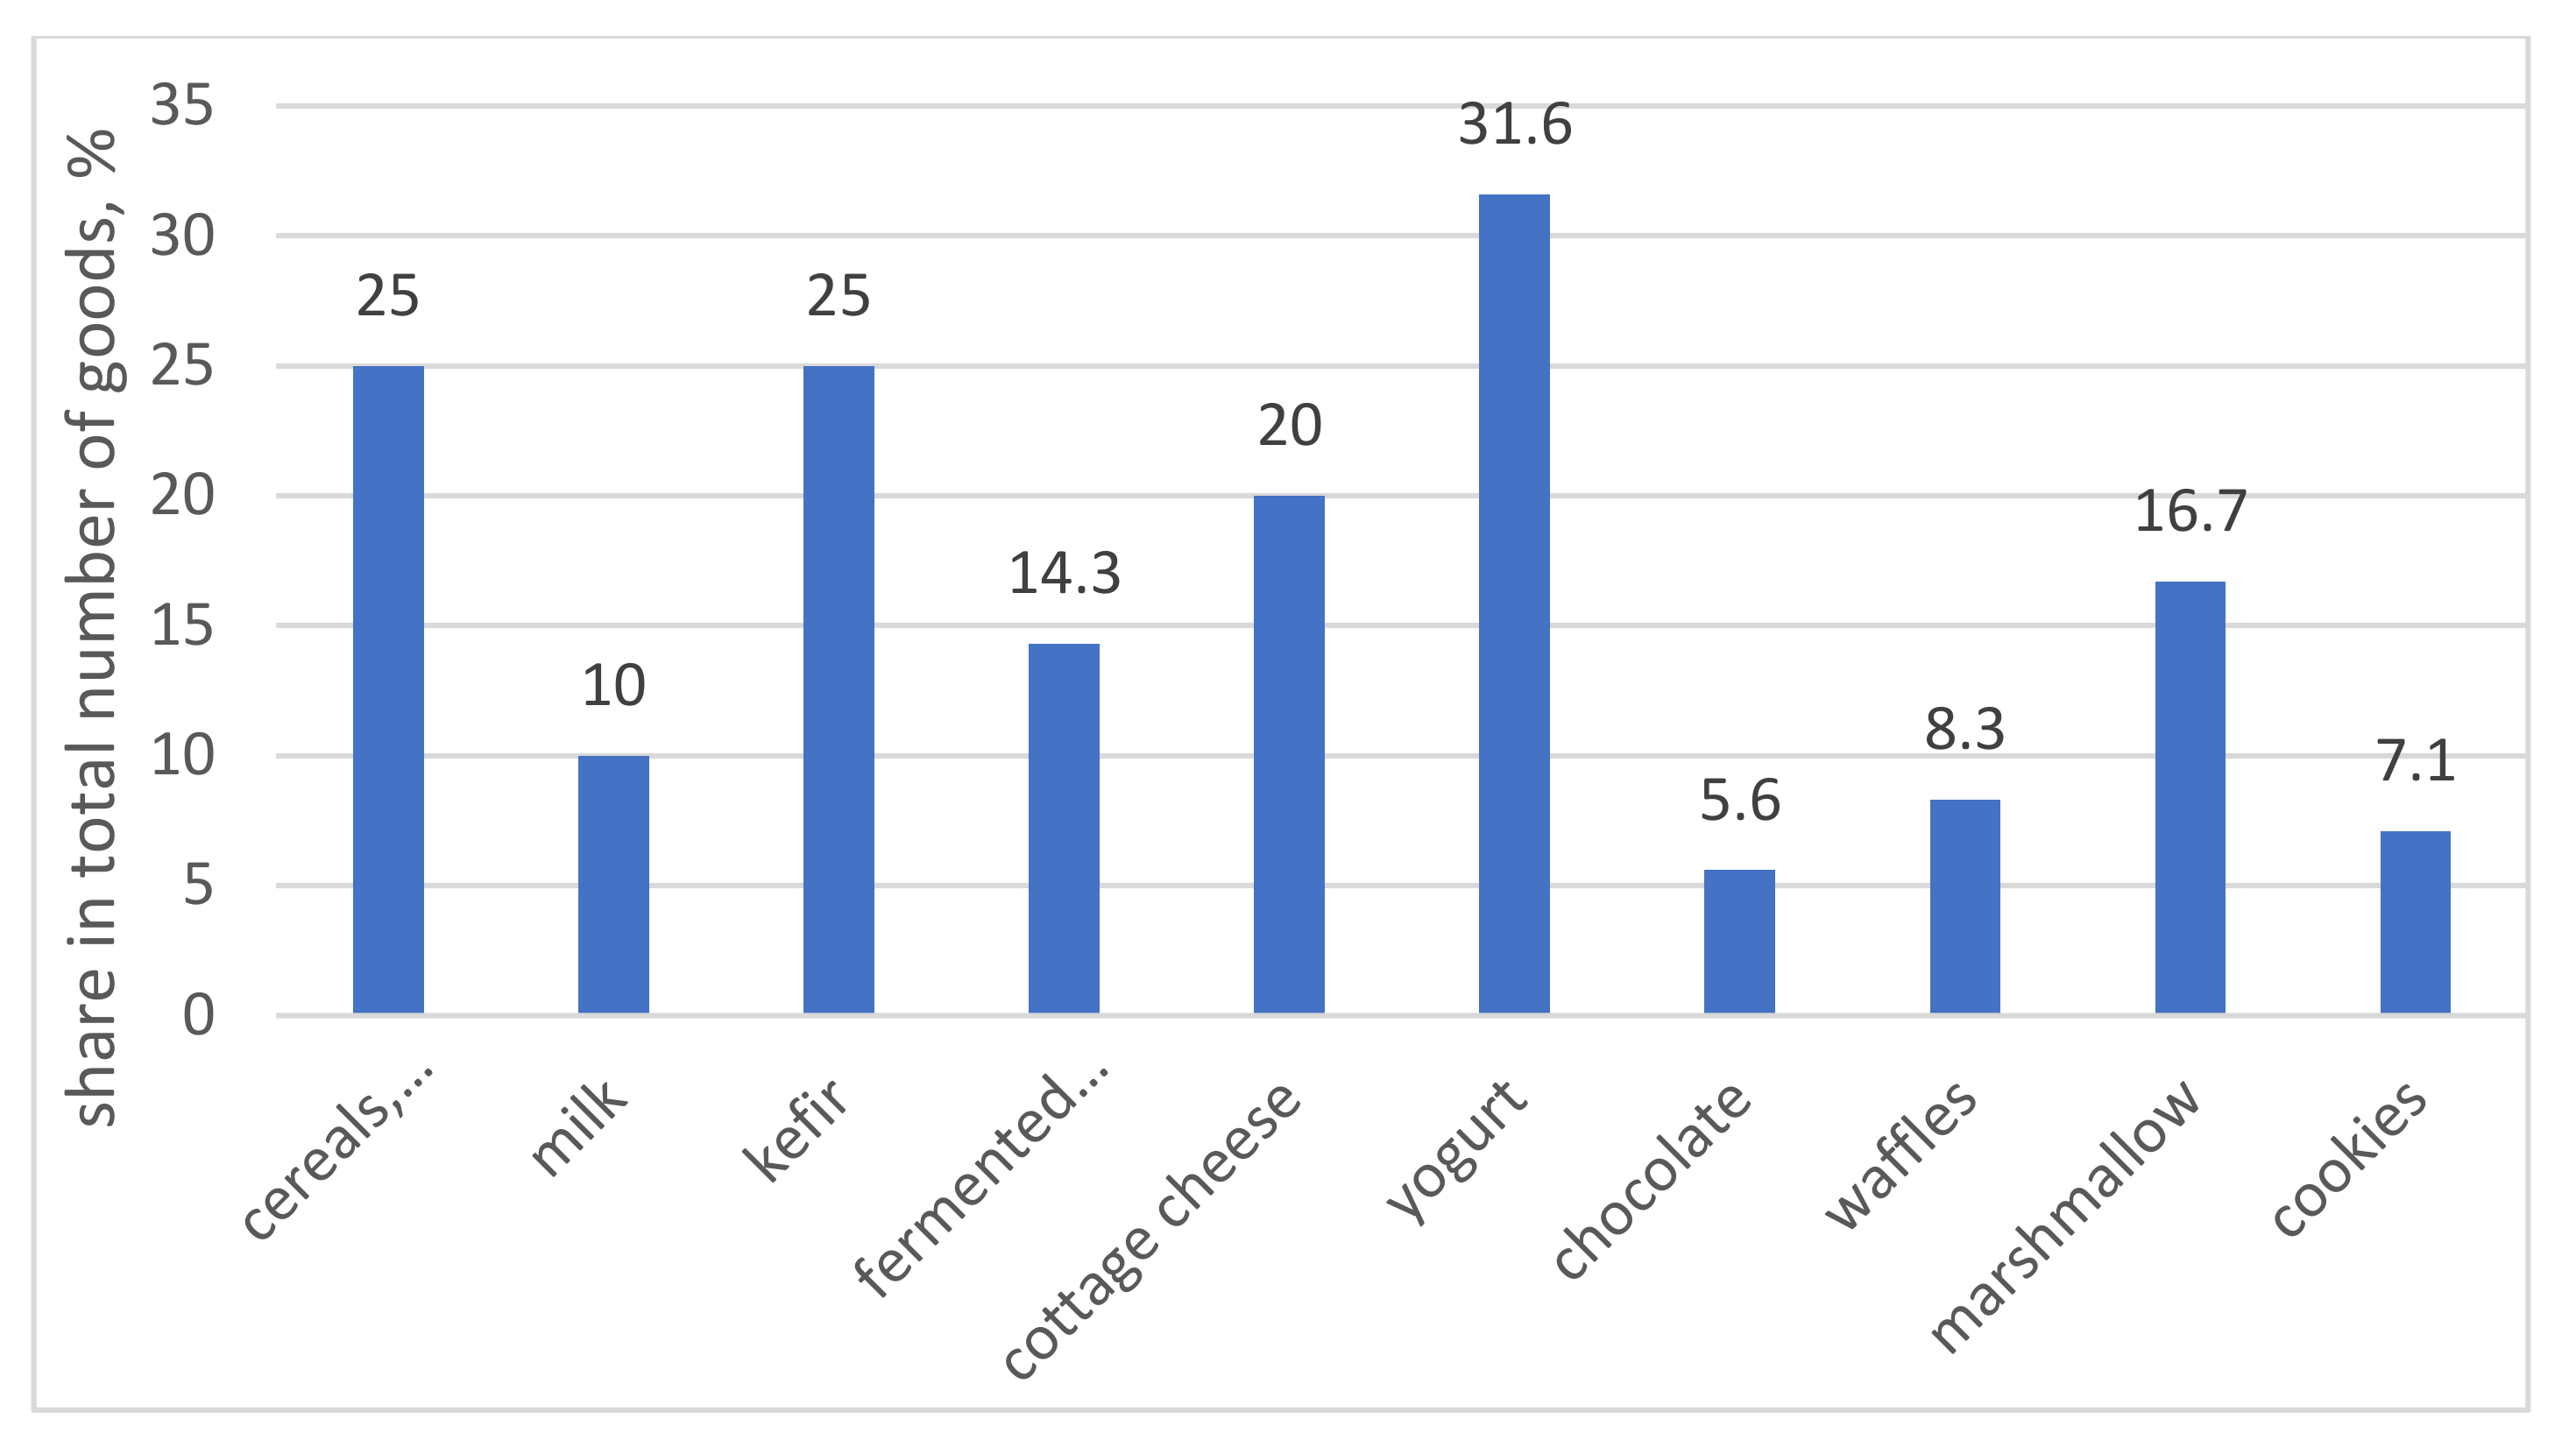
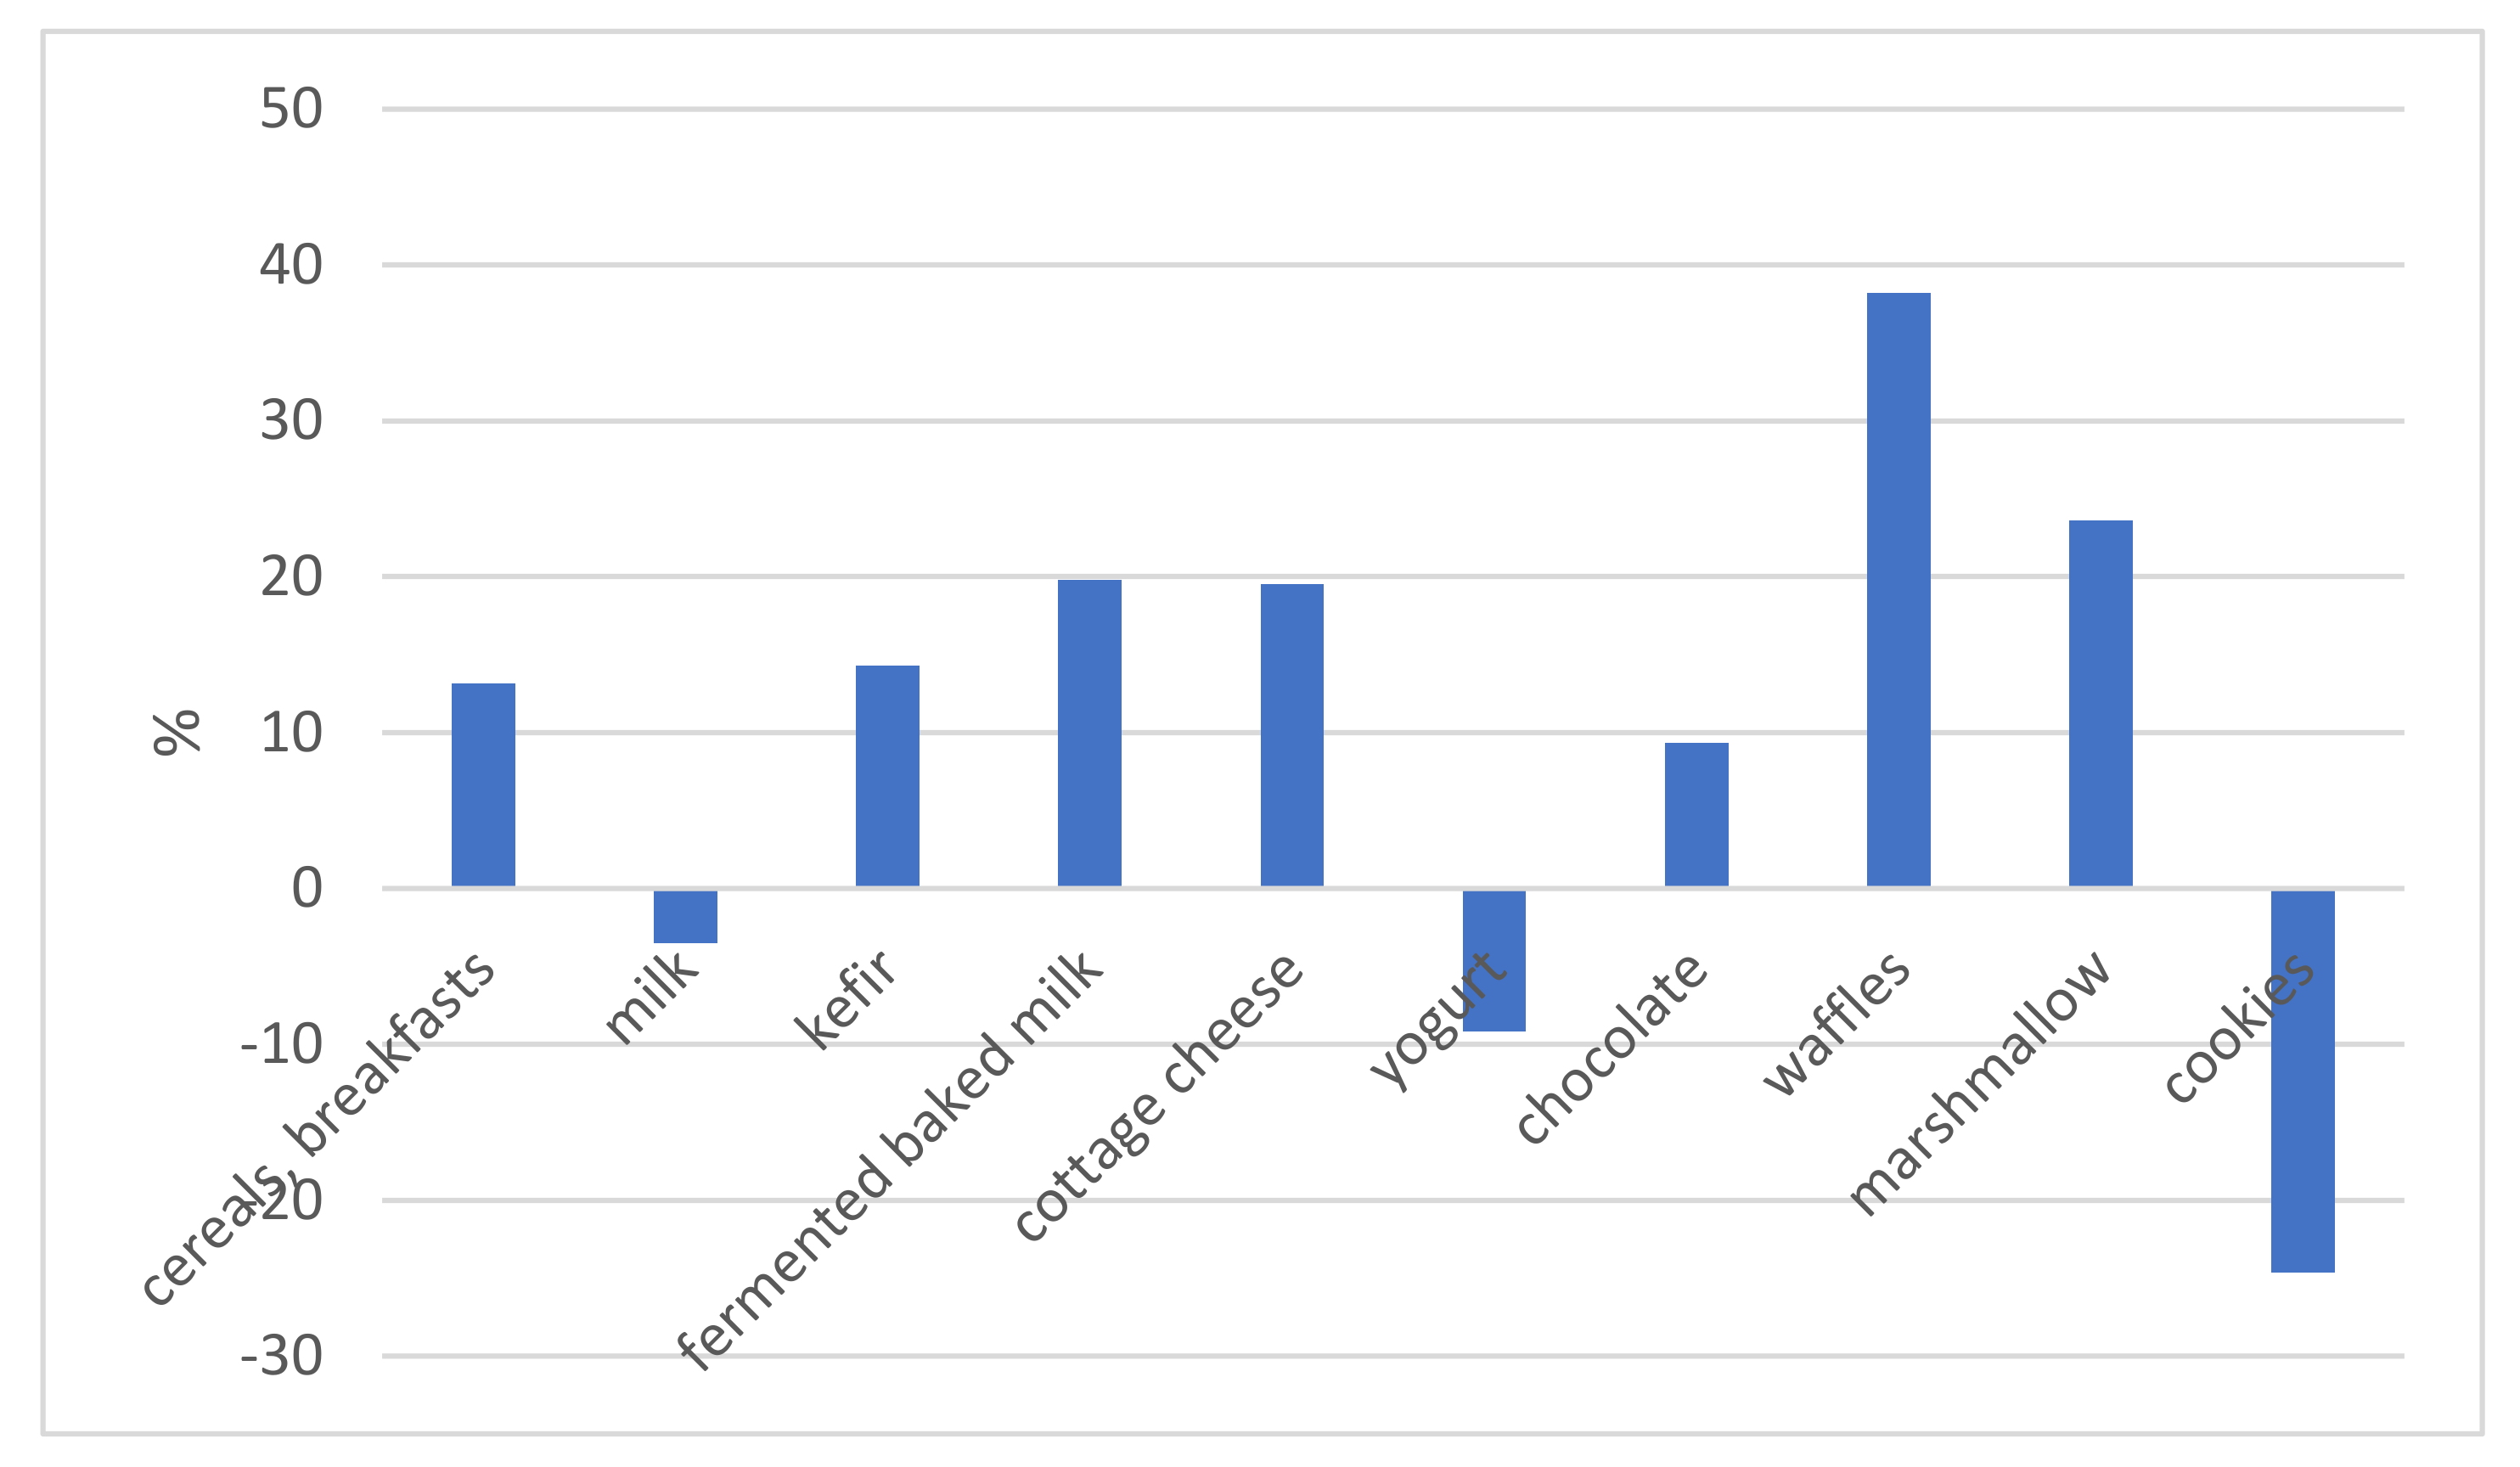
4.1. Supply-Side Study of Ecolabeled Goods in Russia

According to the inspection of goods in chain stores, we found that in the category of goods “household chemicals” (82 goods total), 30 have environmental claims, or 37%. The percentage of goods claimed by the manufacturer as environmentally friendly for different subcategories of goods in the “household chemicals” category is presented in Figure 2. The most significant percentage of products with environmental claims falls in the “laundry conditioners” group and the smallest in the “cleaners” group.
The difference in price between products with and without environmental claims per unit of product (100 grams for solid products, 100 mL for liquid products, 1 tablet for sub-category washing tablets) was not always positive (Figure 3). Therefore, for example, in the subcategory “tablets for washing” and in the subcategory “stain removers”, products that have an ecolabel are on average cheaper than their conventional counterparts are. At the same time, in the subcategories of “cleaners”, “toilet cleaners” and “dishwashing detergents”, products with ecolabels are on average 50% more expensive, and in the subcategory “washing powders”, they are on average 150% more expensive.
In the “perfume and hygiene” product category, out of 133 inspected products, only 29 (21.8%) had any environmental claims on their packaging. The distribution of the share of products with ecological claims for different subcategories of this product category is presented in Figure 4.
It is not difficult to note that the largest share of products with environmental claims is in the subcategory “toothpaste”, and the smallest in the subcategory “soap”. The most significant increase in the price per unit of products with environmental claims is observed in the mouthwash (+79%), toothbrushes (+47.15%), soap (+44.11%) and body scrub (+42.63%) subcategories. The eco-friendly products in the subcategories “shampoos” and “toothpaste” are cheaper than conventional ones (Figure 5).
In the “food” product category, out of 146 products inspected, only 24 products had environmental claims on their labels, which is 16.4%. The distribution of the share of goods with environmental claims for different subcategories of this category of goods is shown in Figure 6. The largest share of ecolabels is for yogurts, the smallest share is for chocolate, biscuits and waffles.
There is no noticeable increase in the price per unit of products positioned as environmentally friendly in the food category. For some items (packaged milk, yogurts, biscuits), ecolabeled products are cheaper than conventional products (Figure 7). The most noticeable increase in price when positioning a product as eco-friendly is in the waffles subcategory. However, we admitted that this subcategory is not representative: only one product in this category, namely waffles of the Eco-Botanica trademark, has an ecolabel.
There were no ecolabels in the office goods category (glue, paper, pencils and pens). We can highlight only Bic pens, SvetoCopy office paper and ErichKrause glue as products with environmental claims. Bic puts the “Environment” label on packages on its pens to indicate that its production system is environmentally friendly. However, we have not found any evidence of this, except for the Mobius strip sign, which says that the pens can be recycled. The SvetoCopy office paper manufacturer indicates that it has a certified environmental management system following ISO 14001. This is confirmed by the presence of a certificate on the official website of the manufacturer. The manufacturer of the ErichKrause glue marks it with a sign indicating the absence of toxic elements.
Furthermore, we checked each manufacturer’s environmental claim for compliance with environmental labels and declarations standards according to the developed checklist. The test results are presented in Table 4.
The data in Table 4 shows that, best of all, the environmental claims in the category “household chemicals” satisfy the requirement of selectivity of the criteria (Q2), the requirement for the use of unique signs (Mobius strip) (Q11) and the necessity for protection for health, safety and customer satisfaction (Q3). The product’s composition is given on the labels of 93.33% of products with environmental claims, with a direct indication of the degree of safety of all components. Moreover, 80% of products in this category do not have on their labels inappropriate statements such as “environmentally friendly”, “non-polluting”, “green”, etc. Worst of all, the information is provided on question Q7 (conformity of the product mark and the official voluntary environmental program). The lifecycle information (Q1) of the product does not appear on any label. In addition, not a single ecolabel gives information about a product’s category, in comparison with which the environmental characteristics of the product would be checked (Q5).
The ecolabels of the brands SYNERGETIC (Russia), Frosh (Germany) and BioMio (Russia) can be singled out as the most consistent with standards in the category of “household chemicals”. The products of these brands have ecolabels on their packaging that fully comply with the mark of the environmental program itself. SYNERGETIC is certified by the International Institute for Ethical and Environmental Certification (ICEA). BioMio has the Leaf of Life ecolabel, and Frosh has received the environmental label of the EcoLabel program. Domestos cleaning products have signs of greenwashing in this product category. The manufacturer claims its product is ecological. It puts a character with a code on the label with which one can check information about the product. However, when checking it, it turns out that this code belongs to a generalized category of products. Other examples would be the labeling of BioAist, Ecomatic, Mama Lemon and DUO brands that add the “ECO” mark to the names without providing sufficient justification for the sustainability of the products.
All labeling of the products in the category “perfume and hygiene” fully complies with selective criteria for providing environmental information. There is a high share of goods (93.1%) on the labels of which unique signs are used (Mobius strip). From the labels of 58.62% of products, it is possible to understand whether the product meets health, safety and consumer needs. Moreover, 55.17% of labels include an explanatory commentary to the environmental claim. The worst information is provided on positions Q1, Q7 and Q4. Data for the entire lifecycle of a product is not fully represented on any label. Only a few products in the inspected category have the environmental label of the voluntary environmental certification program. These include the Dallas (Ukraine), Corine de Farme (France) and Organic people ECO (Russia) brands. The Dallas brand has the environmental label of the Green Crane environmental certification program (Ukraine). In addition, the manufacturer has an environmental management system certified following ISO 14001, which is confirmed by checking the certificate. The brands Corine de Farme and Organic people ECO share the same eco-certification mark “ECOSERT, Cosmos Organic”, but it is difficult to confirm this. The unavailability of this information can be considered as a likely sign of greenwashing.
As a more striking example of the non-compliance of ecolabeling with ISO 14020-14024 standards, one can cite the labeling of goods of the “Clean Line” brand (Russia). Positioning their products as ecological, the manufacturer does not provide any justification for this statement.
The frequency analysis results demonstrate that all labels of goods from the category “food” fully comply with the requirement of selectivity of the criteria for which information is presented on the label. The share of brands on unique signs (Mobius strip) is relatively high (56.52%). More than half of the labels (52.17%) provide explanatory information that explains the meaning of the ecolabel and the statement. Information on the entire product lifecycle is not provided on the labels.
In the subcategory of goods “Breakfasts”, only 4life (USA) has a mark with the code of the environmental certification program “Euro-leaf”. However, it was problematic for the interviewer to check this code and the presence of a certificate through the program’s official website. In the subcategory of goods “dairy products”, the brand “Milk Legend” (Russia) can be highlighted as a good example. The labels of all dairy products of this brand meet the standards. In addition, the manufacturer’s management system (Kazminsky Dairy Plant) meets the requirements of ISO 22000 “Food safety management systems. Requirements for organizations participating in the food chain”. As negative examples, one can cite statements about the environmental friendliness of products of the brands EkoNiva (EkoNiva-APK, Russia), BioMax (Wimm-Bill-Dann, Russia), Sloboda (EFKO, Russia) and Activia (Danone, France), which are difficult to check for compliance. In the grocery subcategory, the vast majority of brands do not have any sustainability claims. The only examples are the EcoBotanica brand (TAKF OJSC, Russia) and the ArteBianca brand (ArteBianca, Russia). On the packaging of EcoBotanica products, there are no special environmental marks, but in general, the information on the packaging meets all the requirements of ISO 14020, 14021 and 14024. The packaging of the ArteBianca brand cookies reveals that the product has passed the environmental certification procedure, but there is no evidence of this. The information presented on the manufacturer’s official website contains incorrect statements such as “environmentally friendly ingredients”, which can be considered inconsistent with the requirements of ISO 14021 and as a likely sign of greenwashing.

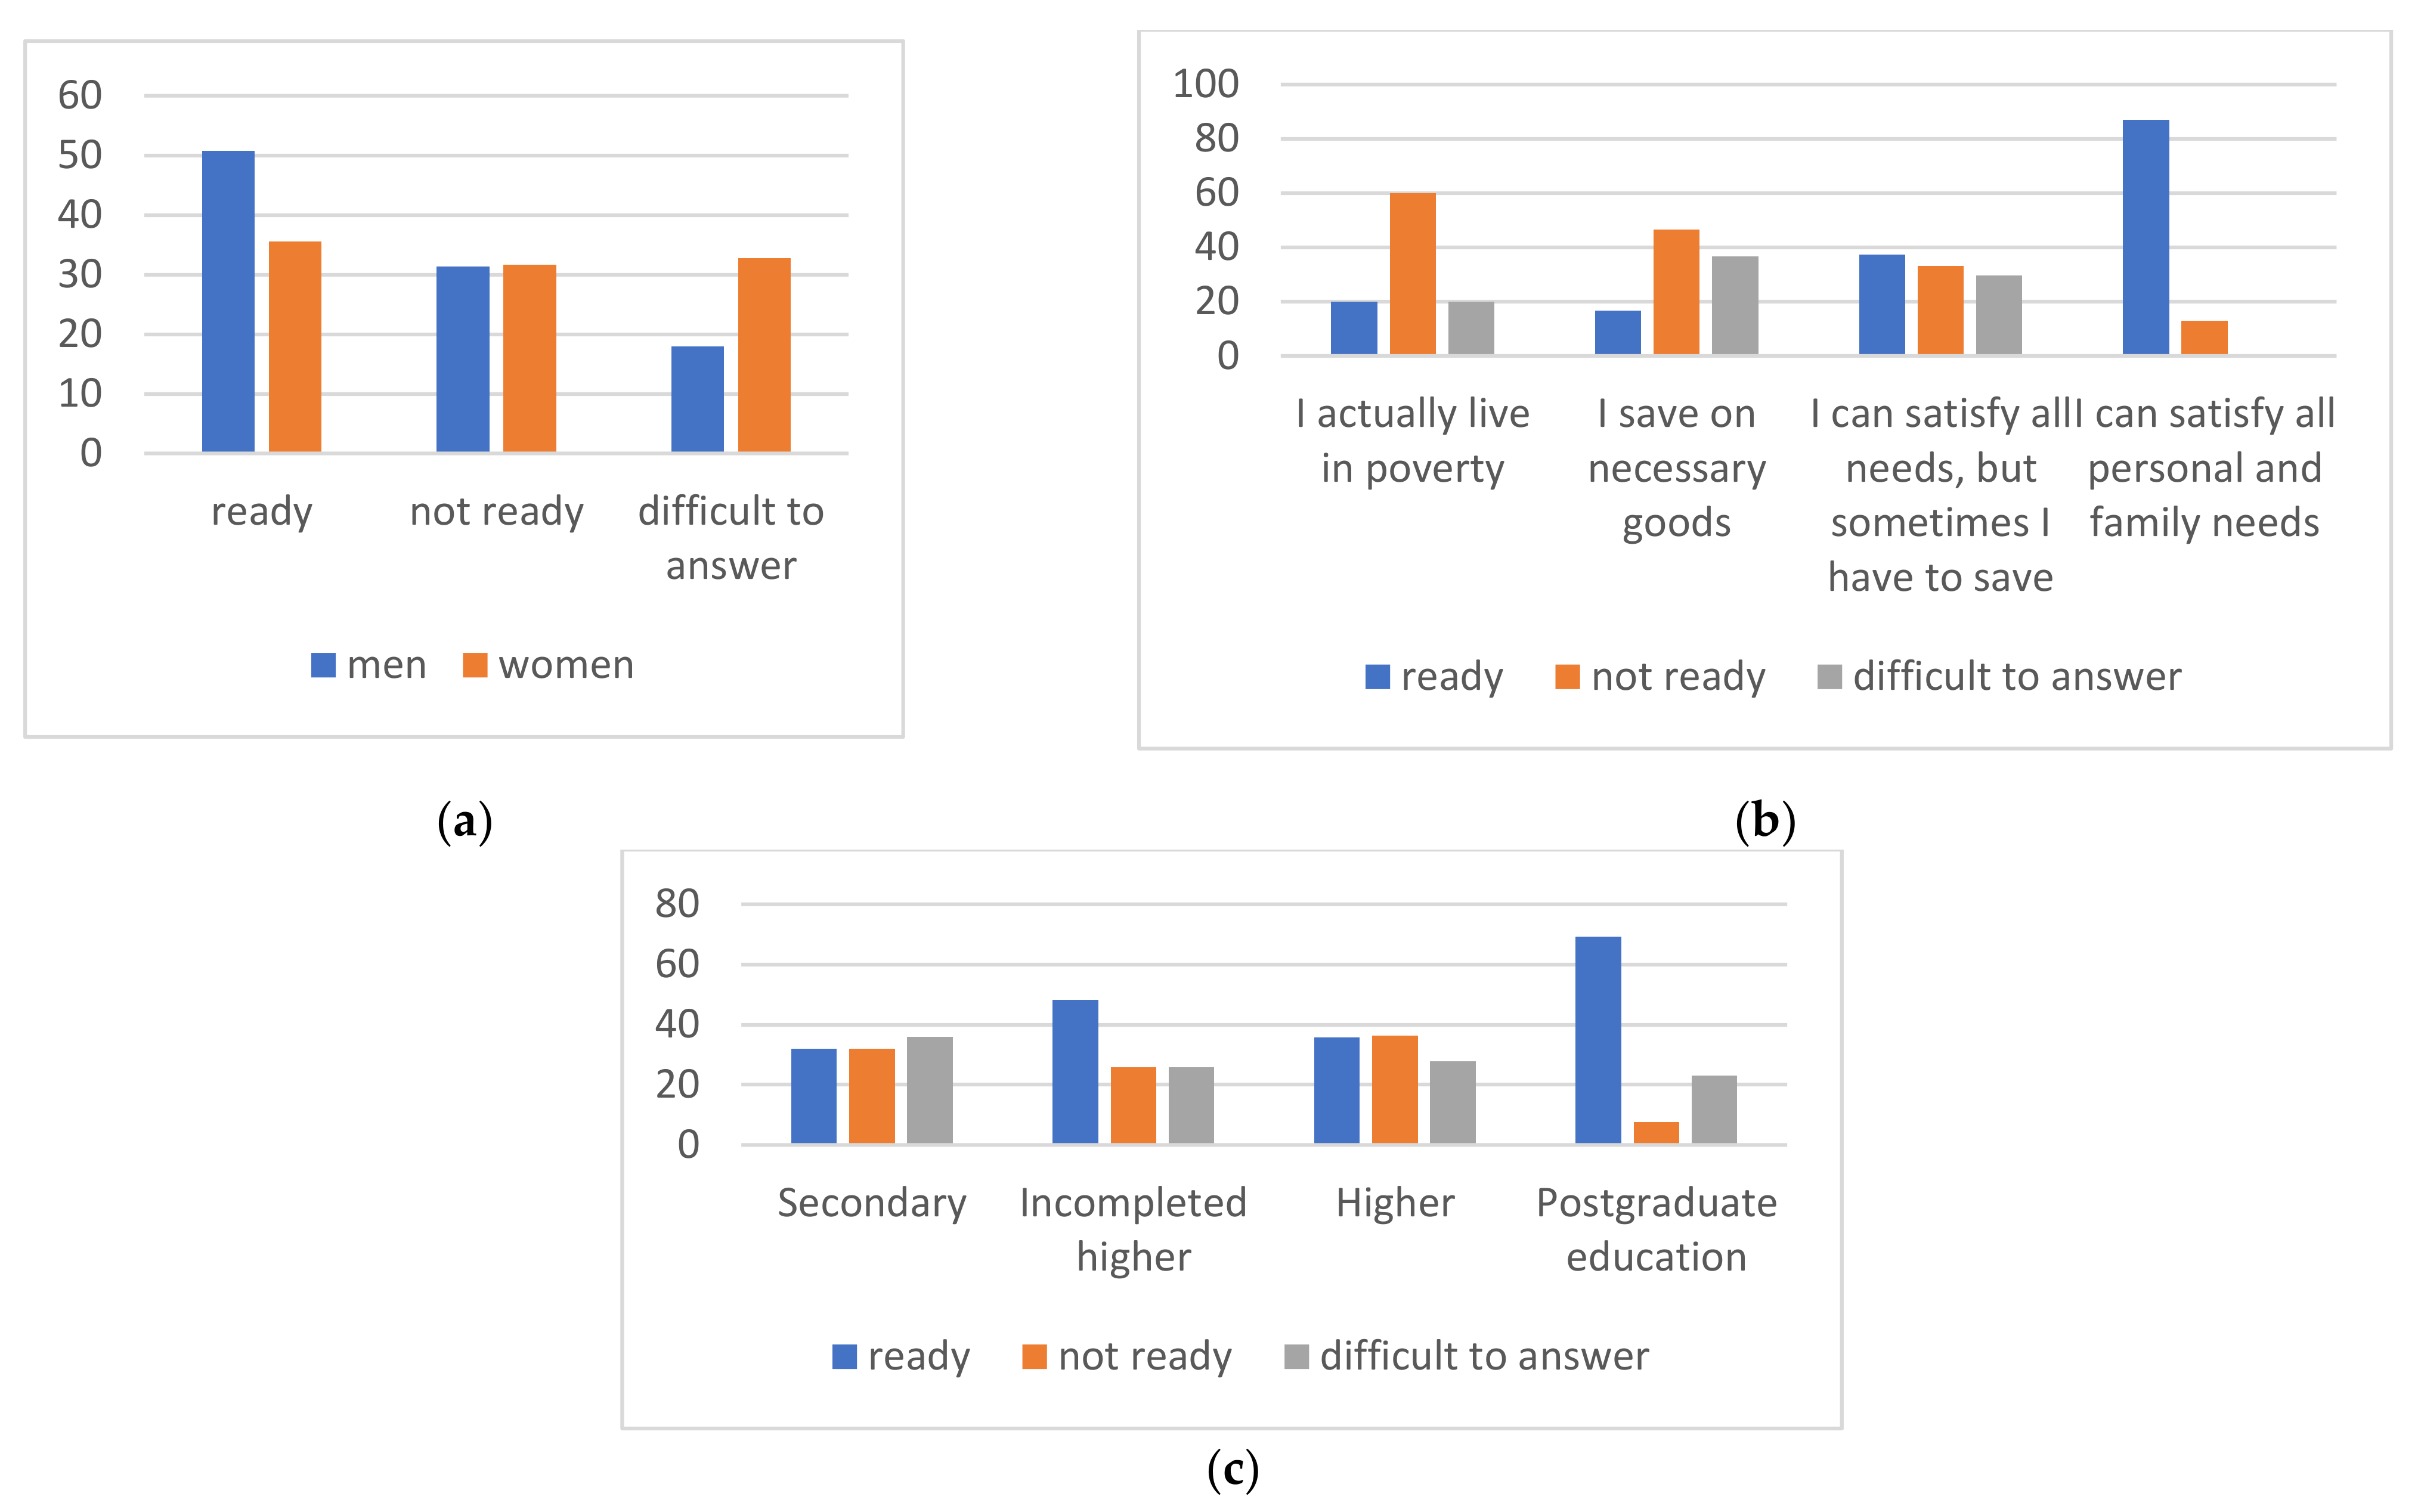
4.2. Demand-Side Study of Ecolabeled Goods in Russia (Results of the Survey)

The distribution of respondents’ answers to the questions of the second and third parts of the questionnaire is presented in Table 5.
According to the survey results, the level of theoretical awareness of Russian consumers in ecolabeling issues is quite high: 46% of respondents believe that they know what ecolabeling is, and 23.6% find it difficult to choose an answer. At the same time, 63.2% chose the correct answer to the question of what ecolabeling is. Moreover, 39.6% of respondents chose the correct answer when defining environmentally friendly products, and 48.4% of respondents gave the correct answer when determining the environmental safety of products. The correct answer about the purpose of applying eco-labeling out of the four proposed ones was chosen by 47.6% of the respondents.
However, most of the respondents (58.4%) did not recognize any of the presented images of ecolabels in practice. Only 9.2% recognized only one, 8.4% of respondents are familiar with two of the presented ecolabels, 5.2% of respondents are familiar with three labels, and 18.4% of respondents are familiar with all of them. The majority of respondents (almost 97%) believe that developing a dedicated smartphone application to check ecolabels for compliance with standards would be helpful.
Environmental safety as a factor of purchasing decisions was noted by 60% of respondents. At the same time, 38.8% of respondents never check the presence of an eco-label before buying, 54.8% of respondents check it depending on the product category, and only 6.4% always check it. Moreover, 39.6% of respondents are willing to pay more for eco-friendly goods, 31.6% are not ready to pay more for eco-friendly goods and 28.8% found it difficult to answer this question.
The calculation of cross-tabulation tables helped identify some statistically significant relationships between the sociodemographic characteristics of the respondents, their level of awareness of ecolabeling issues and consumer behavior (Table 6).
Among men, 31.34% are not ready to pay more, 50.75% are ready and 17.91% find it difficult to answer. Among women, 31.69% are not ready to pay more, 35.52% are ready and 32.79% find it difficult to answer (Figure 8a). Thus, men are more willing to pay more for ecological products. At the same time, environmental safety is not as important for men as a factor of purchasing decisions as for women: only 22.4% of men note environmental safety of the product as an important factor, compared to 46.5% of women.
Of those who defined their financial situation as “I actually live in poverty”, 60% are not ready to pay more for environmentally friendly goods, 20% are ready. Another 20% found it difficult to answer. Of those who defined their financial situation as “I save on necessary goods”, 46.67% are not ready to pay more for environmentally friendly goods, 16.67% are ready and 36.67% found it difficult to answer. Of the respondents with an average income level (defined their position as “I can satisfy all needs, but sometimes I have to save”) 33.14% are not ready to pay more for environmentally friendly goods, 37.28% are ready and 29.59% of respondents found it difficult to answer this question. Of the respondents with a high level of income (defined their position as “I can satisfy all personal and family needs”), 12.9% are not ready to pay more for eco-friendly goods, 87.1% are ready to pay more and no one had any difficulty in answering (Figure 8b). In summary, these results show that the higher the income level, the more willingness to pay for environmentally friendly goods is expressed by the respondent. This finding is not surprising and was reported earlier by Laroche et al. [33], Schumacher [22], Kianpour [34], Wojnarowska et al. [9] and others [35,36,37].
Of the respondents with secondary education, 32% are not ready to pay more and the same amount, 32% are ready. The majority of respondents (36%) find it difficult to answer. Of the respondents with incomplete higher education, 25.86% are not ready to pay more for environmentally friendly goods, 48.28% are ready and 25.86% found it difficult to answer. Of the respondents with higher education, 36.43% are not ready, and almost the same share (35.66%) of respondents are ready to pay more for environmentally friendly goods. In addition, 27.91% of the respondents in this category found it difficult to answer. Of the most educated respondents with postgraduate education, only 7.69% are not ready to pay more, while the majority (69.23%) are ready. In this category, 23.08% of respondents find it difficult to answer (Figure 8c). These results indicate that respondents with incomplete higher education (students) and the most educated respondents with postgraduate education (the majority are university professors) show the highest willingness to pay. Perhaps they have more opportunities for this since students (in contrast to the respondents who have already completed their studies and have higher education) receive material support from their families. The most educated respondents have a high income. Thus, we have not found a linear correlation between the level of education and the willingness to pay a premium price for eco-products.
No correlation was found between the respondent’s age and their willingness to pay a premium price for environmentally friendly products. Furthermore, statistical tests revealed that the relationship between the respondent’s age and how often they check for the ecolabel before buying a product is statistically significant. We can say that the age group from 50 and older is the most attentive to the presence of ecolabel when choosing products (Figure 9a). These results match those observed by Rochikashvili and Bongaerts [6]. The relationship between the age and consideration of environmental safety as a factor of purchasing decisions is also statistically significant. The age groups of 30–49 and 50–59 are the most sensitive to this factor (61% and 60%, respectively).
The relationship between the respondents’ education level and how often they check for the ecolabel before purchasing a product is statistically significant. The most educated respondents (also with the highest income level) are more careful when choosing products and pay more attention to ecolabeling than other groups of respondents.
The relationship between education and theoretical knowledge of ecolabeling is statistically significant. The correct answers in the group with secondary education comprise 56%, 72.41% with incomplete higher education, 59.69% with higher education and 84.62% with postgraduate education. At the same time, there was no evidence that education influences understanding of the goals of ecolabeling.
The relationship between age and knowledge of ecolabeling is statistically significant. The correct answers are in the 20–29 age group, which consists mostly of students. In addition, all respondents in the 70+ age category answered correctly, but since there are only three of these respondents, these conclusions cannot be generalized.
No statistically significant relationships were found between the respondent’s place of residence and their awareness of ecolabeling issues. However, the relationship between the respondent’s place of residence and their factors of purchasing decisions is statistically significant. People living in small cities are more attentive to the environmental safety of the products and consider it an important factor of purchasing decisions (51.3% compared to 35% in other groups). This finding was unexpected and has not been previously described in the literature on other countries. These results therefore need to be interpreted with caution because this “small cities” group is very heterogeneous and was actually formed by merging several small groups of respondents from different regions.
In addition, using cross-tabulation, we checked the relationships between the respondent’s answers to theoretical questions about ecolabelling and questions about their consumer behavior (Table 7).
The Chi-square test shows statistically significant differences in WTP between those respondents who understand the purpose of ecolabeling and those who do not. Of those respondents who gave the wrong answer (just over half of these respondents-52.4%)-37.4% are not ready to pay more, 39.69% are ready to pay more and 22.9% are at a loss to choose an answer. Of those who know the goals of ecolabeling (the share of such respondents is 47.6%), only 25.21% are not ready to pay more, 39.5% are ready to pay more and another 35.29% found it difficult to answer. The results provide evidence that understanding the purpose of labeling in general increases the willingness to pay for greener products.
The Chi-square test also shows that the consideration of environmental safety of the product as one of the main factors of purchasing decisions influences the WTP of respondents. Of those who value environmental safety, almost 50% are ready to pay the premium price, 29% are not ready and about 39% found it difficult to answer. This result is consistent with that of Schumacher [22], who reports that the demand for ecolabeled goods increases with the consciousness of the consumer.
We also found a statistically significant relationship at the p = 0.01 level between the respondent’s WTP for eco-products and how often they check for the ecolabel before buying. Of those who are unwilling to pay a premium price for eco-products, 55.7% never check for ecolabels, 35.44% do sometimes and 8.86% always check. Of the respondents willing to pay a premium price, 30.3% do not check for the ecolabel, 61.62% do it sometimes (depending on the product category) and 8.08% always check for the ecolabel. Of the respondents who found it difficult to answer the question about their WTP (which may also indicate that their answer depends on the product category), 31.94% do not check the presence of ecolabel, 66.67% do it sometimes and only 1.39% always do it. These results are expected and do not add new knowledge to the problem but rather indicate that the survey is built logically. We can conclude that those who are willing to pay for more environmentally friendly products check for the presence of ecolabeling more often before buying. The same comment can be made regarding the results of checking the relationship between the importance of environmental safety for a respondent and how often they check ecolabels. Not surprisingly, the people who value environmental safety check ecolabels more often (49.6% always and 43.7% sometimes compared to 25.8% for those who never check ecolabels).
To check the correctness of the survey design and the informal choice of answers by the respondents, we tested a relationship between the understanding of what ecolabeling is and the understanding of ecolabeling’s goals. The statistical significance of this dependence turned out to be high (0.00078), which testifies to the correct logic of constructing the survey and the conscious participation of the respondents in it.

5. Conclusions

The present study provides the first comprehensive assessment of consumers’ awareness and reaction to ecolabeled products in the Russian market of everyday goods. Compared with the available literature data, the prevalence and informativeness of ecolabelling in Russia are low, both on the supply and demand sides. Regarding the supply side, our study reports that only 4–10% of the everyday goods presented in economy-class retail stores have ecolabels. On the demand side, we have found a 42% recognition of ecolabels versus 50–60% according to similar European studies. Our results reveal that Russian buyers are well aware of the theoretical issues related to ecolabeling (which can be explained by the high level of education of the respondents). However, at the same time, they pay little attention to ecolabels when making a purchase decision and do not check or do not recognize the most common ecolabel signs. Thus, we conclude that the insufficient demand for ecolabeled products does not yet create the necessary pressure on manufacturing companies to change their production systems and marketing strategies. We believe it is the main reason why greenwashing is not yet widespread in Russia.
In result of the supply-side research, we have found that of the goods of the inspected categories (household chemicals, perfumes and hygiene, food, office goods) about 4.16–10.3% are positioned as environmentally friendly. The most significant share of labeled goods falls into the category of “household chemicals”. In addition, manufacturers’ claims for the environmental friendliness of products in this category are the most substantiated and best meet the criteria of ISO 14020, 14021 and 14024.
The most frequent signs of greenwashing are observed in the food product category. The sustainability claims in this category are the vaguest and most poorly supported and are nothing more than an element of the manufacturer’s advertising campaign. In addition, environmental friendliness in this category of goods is most often understood as the health benefits of the consumer. At the same time, the impact of the production of this product on the environment is rarely considered.
In general, we did not find any significant differences in price between eco-friendly and conventional products. The only exceptions are some brands in different sub-categories. At the same time, we can note that the study was conducted in retail stores classified in the “economy” class. Therefore, a noticeable difference in the price of a greener product in this market segment can alienate the buyer.
Information of an ecological nature, presented on the ecolabel, is minimal for most products. None of the analyzed ecolabels provides information on the product’s environmental impact over its entire lifecycle. Therefore, so far, ecolabeling is not an effective tool for promoting the principles of a circular economy in Russia.
Regarding the dependence of the respondent’s consumer behavior on their level of awareness of ecolabeling and sociodemographic characteristics, the patterns we have identified correlate well with the data of other studies mentioned in the literature review. Thus, our research confirms that the higher the income level, the more a willingness to pay for environmentally friendly goods is expressed by the respondent. The relationship we found between the respondent’s age and how often they check for the ecolabel before purchasing a product is non-linear. The age category from 50 to 70 years old is the most attentive to ecolabels when choosing products. The respondent’s level of education influences his awareness of ecolabeling issues, in particular, the correct understanding of what ecolabeling is. However, this relationship is also non-linear. The most aware of this are people with incomplete higher education (students) and the most educated respondents with postgraduate educations. Men are more likely to be willing to pay for sustainable products than women are, but at the same time, they value the environmental safety of the product less than women do during the process of making a purchasing decision.
Summarizing the revealed patterns between the respondent’s level of awareness and their consumer preferences, we can say that awareness increases the willingness to pay more for environmentally friendly goods. The willingness to pay, in turn, changes consumer behavior.
Our conclusion that consumers need to be better educated in ecolabels supports previous research. However, instead of proposing distributing educational materials, we suggest developing smartphone applications that allow buyers to check the compliance of ecolabels on a product with ISO standards directly during the shopping process. We consider this approach as a cost-effective and straightforward way to simultaneously raise consumer awareness of ecolabeling and reduce the likelihood of greenwashing.
In addition, as measures to correct the state policy in voluntary environmental certification, we suggest increasing the government stimulation of those ecolabeling systems that contribute to the practical implementation of the principles of a circular economy such as recyclability and maintainability. This will help to make ecolabels more informative and diminish the information gap between the producer and the buyer. The forms of such incentives can be different: from information support to tax and other benefits.

Author Contributions

Conceptualization and methodology, S.R. (Ratner Svetlana); software, S.R. (Ratner Svetlana); validation, S.R. (Ratner Svetlana), K.G. and S.R. (Revinova Svetlana); formal analysis, I.L.; investigation, S.R. (Ratner Svetlana); resources, K.G.; data curation, S.R. (Revinova Svetlana); writing—original draft preparation, S.R. (Ratner Svetlana); writing—review and editing, K.G.; visualization, K.G.; supervision, S.R. (Ratner Svetlana); project administration, S.R. (Ratner Svetlana); funding acquisition, I.L. All authors have read and agreed to the published version of the manuscript.

Funding

This paper has been supported by the RUDN University Strategic Academic Leadership Program.

Institutional Review Board Statement

Not applicable.

Informed Consent Statement

Not applicable.

Data Availability Statement

Conflicts of Interest

The authors declare no conflict of interest.

Appendix A

Table A1. Variables for statistical analysis.
Question AnswerCodeVariable NameType
GenderMale1Gendercategorical
Female2
Age16–191Agerank
20–292
30–393
40–494
50–595
60–695
70+7
IncomeI actually live in poverty1Incomecategorical
I save on necessary goods2
I can satisfy all needs, but sometimes
I have to save3
I can satisfy all personal and family needs4
I find it difficult to answer5
I refuse to answer6
EducationSecondary education1Educationrank
Incomplete higher education2
Higher education
(Bachelor’s degree or above)3
Postgraduate education (postgraduate, doctoral, academic degree, degree MBA)4
RegionMoscow region1Regioncategorical
City with at least 1 mill inhabitants 2
Other Russian regions3
What, in your opinion, is the main purpose of applying the ecolabel?Correct (corresponds with ISO 14020)1Purposedichotomous
Wrong0
What do you think is meant by ecological products?Correct (corresponds with ISO 14020)1Eco_productsdichotomous
Wrong0
What do you mean by environmental safety of products?Correct (corresponds with ISO 14020)1En_safdichotomous
Wrong0
Do you know what eco-labeling is?Correct (corresponds with ISO 14020)1Ecolabel_SEdichotomous
Wrong0
Eco-labels are…Correct (corresponds with ISO 14020)1Ecolabel_REdichotomous
Wrong0
How many of these ecolabels are familiar to you?0,1,2,3,4,50,1,2,3,4,5Num_ELnumerical
Are you willing to pay a higher price for environmental products?No0WTPcategorical
Yes1
Difficult to answer2
Do you check ecolabels on the packaging of a product before purchasing it?No, nether1Checking_ELcategorical
Sometimes/Depending on the category of goods2
Yes, always3
What factors are more important for you when buying goods?Choosing the answer “environmental safety” as one of the options1Factorsdichotomous
Not choosing answer “environmental safety” as one of the options0
Source: authoring.

References

  1. Horne, R.E. Limits to labels: The role of eco-labels in the assessment of product sustainability and routes to sustainable consumption. Int. J. Consum. Stud. 2009, 33, 175–182. [Google Scholar] [CrossRef]
  2. Sandoval, J.V.P.; Alfaro, J.A.; Mejia-Villa, A.; Ormazabal, M. ECO-labels as a multidimensional research topic: Trends and opportunities. J. Clean. Prod. 2016, 135, 806–818. [Google Scholar] [CrossRef]
  3. François-Lecompte, A.; Bertrandias, L.; Bernard, Y. The environmental labelling rollout of consumer goods by public authorities: Analysis of and lessons learned from the French case. J. Clean. Prod. 2017, 161, 688–697. [Google Scholar] [CrossRef]
  4. Ratner, S.; Lazanyuk, I.; Revinova, S.; Gomonov, K. Barriers of consumer behavior for the development of the circular economy: Empirical evidence from Russia. Appl. Sci. 2020, 11, 46. [Google Scholar] [CrossRef]
  5. Van Amstel, M.; Driessen, P.; Glasbergen, P. Eco-labeling and information asymmetry: A comparison of five eco-labels in the Netherlands. J. Clean. Prod. 2008, 16, 263–276. [Google Scholar] [CrossRef]
  6. Rochikashvili, M.; Bongaerts, J.C. How eco-labelling influences environmentally conscious consumption of construction products. Sustainability 2018, 10, 351. [Google Scholar] [CrossRef] [Green Version]
  7. Guo, R.; Zhang, W.; Wang, T.; Li, C.B.; Tao, L. Timely or considered? Brand trust repair strategies and mechanism after greenwashing in China—From a legitimacy perspective. Ind. Mark. Manag. 2018, 72, 127–137. [Google Scholar] [CrossRef]
  8. Konishi, Y. Efficiency properties of binary ecolabeling. Resour. Energy Econ. 2011, 33, 798–819. [Google Scholar] [CrossRef]
  9. Wojnarowska, M.; Sołtysik, M.; Prusak, A. Impact of eco-labelling on the implementation of sustainable production and consumption. Environ. Impact Assess. Rev. 2020, 86, 106505. [Google Scholar] [CrossRef]
  10. Van Hal, J.D.M. A labeling system as steppingstone for incentives related to the profitability of sustainable housing. Neth. J. Hous. Environ. Res. 2007, 22, 393–408. [Google Scholar] [CrossRef] [Green Version]
  11. Hetterich, J.; Bonnemeier, S.; Pritzke, M.; Georgiadis, A. Ecological sustainability—A customer requirement? Evidence from the automotive industry. J. Environ. Plan. Manag. 2012, 55, 1111–1133. [Google Scholar] [CrossRef]
  12. Bullock, G. Information-based governance theory. In Handbook on Theories of Governance; Ansell, C., Torfing, J., Eds.; Edward Elgar Publishing: Cheltenham, UK, 2016; pp. 281–292. [Google Scholar]
  13. Clemenz, G. Eco-labeling and horizontal product differentiation. Environ. Resour. Econ. 2009, 45, 481–497. [Google Scholar] [CrossRef]
  14. Markham, D.; Khare, A.; Beckman, T. Greenwashing: A proposal to restrict its spread. J. Environ. Assess. Policy Manag. 2014, 16, 1450030. [Google Scholar] [CrossRef]
  15. Zhang, L.; Li, D.; Cao, C.; Huang, S. The influence of greenwashing perception on green purchasing intentions: The mediating role of green word-of-mouth and moderating role of green concern. J. Clean. Prod. 2018, 187, 740–750. [Google Scholar] [CrossRef]
  16. Chen, H.; Bernard, S.; Rahman, I. Greenwashing in hotels: A structural model of trust and behavioral intentions. J. Clean. Prod. 2018, 206, 326–335. [Google Scholar] [CrossRef]
  17. Sun, Z.; Zhang, W. Do government regulations prevent greenwashing? An evolutionary game analysis of heterogeneous enterprises. J. Clean. Prod. 2019, 231, 1489–1502. [Google Scholar] [CrossRef]
  18. European Commission (E.C.). Unfair Commercial Practices Directive. 2021. Available online: https://ec.europa.eu/info/law/law-topic/consumers/unfair-commercial-practices-law/unfair-commercial-practices-directive_en (accessed on 1 July 2021).
  19. Legislation.gov.au. Competition and Consumer Act 2010. 2021. Available online: https://www.legislation.gov.au/Details/C2018C00437 (accessed on 1 July 2021).
  20. Business Insider. PepsiCo is Being Sued Over Its Naked Juice Marketing. 2021. Available online: https://www.businessinsider.com/pepsico-sued-for-naked-juice-marketing-2016-10 (accessed on 1 July 2021).
  21. Zaharova, T.; Krakovetskaya, I. Eco-marketing: “Green” advertisement, assistance of the market and other tools to promote technological innovation in the university cities of the world and Russia. Vestn. Tomsk. Gos. Univ. Èkon. 2018, 231–245. [Google Scholar] [CrossRef] [PubMed] [Green Version]
  22. Schumacher, I. Ecolabeling, consumers’ preferences and taxation. Ecol. Econ. 2010, 69, 2202–2212. [Google Scholar] [CrossRef]
  23. Hartman Group. Sustainability 2017 Report Overview and Highlights. 2017. Available online: http://store.hartman-group.com/content/Sustainability-2017-Overview.pdf (accessed on 1 July 2021).
  24. Gutierrez, A.M.J.; Chiu, A.S.F.; Seva, R. A proposed framework on the affective design of eco-product labels. Sustainability 2020, 12, 3234. [Google Scholar] [CrossRef] [Green Version]
  25. Srinivasan, A.K.; Blomquist, G.C. Ecolabeled paper towels: Consumer valuation and expenditure analysis. J. Environ. Manag. 2009, 90, 314–320. [Google Scholar] [CrossRef] [PubMed]
  26. Di Martino, J.; Nanere, M.G.; Dsouza, C. The effect of pro-environmental attitudes and eco-labelling information on green purchasing decisions in Australia. J. Nonprofit Public Sect. Mark. 2019, 31, 201–225. [Google Scholar] [CrossRef]
  27. Tully, S.M.; Winer, R.S. The role of the beneficiary in willingness to pay for socially responsible products: A meta-analysis. J. Retail. 2014, 90, 255–274. [Google Scholar] [CrossRef]
  28. Song, L.; Lim, Y.; Chang, P.; Guo, Y.; Zhang, M.; Wang, X.; Yu, X.; Lehto, M.R.; Cai, H. Ecolabel’s role in informing sustainable consumption: A naturalistic decision making study using eye tracking glasses. J. Clean. Prod. 2019, 218, 685–695. [Google Scholar] [CrossRef]
  29. Grunert, K.G.; Hieke, S.; Wills, J. Sustainability labels on food products: Consumer motivation, understanding and use. Food Policy 2014, 44, 177–189. [Google Scholar] [CrossRef] [Green Version]
  30. Simeone, M.; Scarpato, D.; Marinelli, N.; Simeone, M.; Scarpato, D.; Marinelli, N. Factors affecting food label complexity: Does the new EU regulation satisfy consumer issues? An exploratory study. J. Food Prod. Mark. 2016, 22, 571–583. [Google Scholar] [CrossRef]
  31. Bullock, G.; Van Der Ven, H. The shadow of the consumer: Analyzing the importance of consumers to the uptake and sophistication of ratings, certifications, and eco-labels. Organ. Environ. 2018, 33, 75–95. [Google Scholar] [CrossRef]
  32. Krasnodar City Ranks First in the Russian Federation in Terms of the Provision of High-Quality Retail Space per Capita. 2021. Available online: https://realty.ria.ru/20150622/405526164.html (accessed on 1 July 2021).
  33. Laroche, M.; Bergeron, J.; Barbaro-Forleo, G. Targeting consumers who are willing to pay more for environmentally friendly products. J. Consum. Mark. 2001, 18, 503–520. [Google Scholar] [CrossRef] [Green Version]
  34. Kianpour, K. Importance of price for buying environmentally friendly products. J. Econ. Behav. Stud. 2012, 4, 371–375. [Google Scholar] [CrossRef] [Green Version]
  35. Van Der Werf, H.M.; Salou, T. Economic value as a functional unit for environmental labelling of food and other consumer products. J. Clean. Prod. 2015, 94, 394–397. [Google Scholar] [CrossRef]
  36. Wang, L.; Cui, Z.; Liang, X. Does it pay to be green? Financial benefits of environmental labeling among Chinese firms, 2000–2005. Manag. Organ. Rev. 2015, 11, 493–519. [Google Scholar] [CrossRef]
  37. Yau, Y. Eco-labels and willingness-to-pay: A Hong Kong study. Smart Sustain. Built Environ. 2012, 1, 277–290. [Google Scholar] [CrossRef]
Figure 1. The figure from the questionnaire. Source: authoring.
Sustainability 13 09581 g001
Figure 2. The percentage of goods with environmental claims in the “household chemicals” category. Source: authoring.
Sustainability 13 09581 g002
Figure 3. The difference in price between products with and without environmental claims in “household chemicals” category. Source: authoring.
Sustainability 13 09581 g003
Figure 4. The percentage of goods with environmental claims in “perfume and hygiene” category. Source: authoring.
Sustainability 13 09581 g004
Figure 5. The difference in price between products with and without environmental claims in the “perfume and hygiene” category. Source: authoring.
Sustainability 13 09581 g005
Figure 6. The percentage of goods with environmental claims in the “food” category. Source: authoring.
Sustainability 13 09581 g006
Figure 7. The difference in price between products with and without environmental claims in the “food” category. Source: authoring.
Sustainability 13 09581 g007
Figure 8. Distribution of answers of respondents about their readiness to pay a premium price for ecofriendly goods: (a) Difference in WTP between men and women; (b) Difference in WTP among the groups with different income; (c) Difference in WTP among the groups with different level of education. Source: authoring.
Sustainability 13 09581 g008
Figure 9. Distribution of respondents’ answers about the frequency of checking for ecolabels: (a) Difference in the frequency of checking for ecolabels in age groups; (b) Difference in checking for ecolabels in groups with different levels of education. Source: authoring.
Sustainability 13 09581 g009
Table 1. Checklist for verification of the environmental labeling of goods for compliance with the requirements of ISO 14020/14021.
ISO 14024
NumberQuestionAnswer
Q1Does the label provide information about
the product lifecycle?
yes/no/partially/no information
Q2Are the environmental criteria for reporting
the information selective?
yes/no/partially/no information
Q3Do the products meet the health and safety
requirements and consumer needs
(fitness for purpose)?
yes/no/partially/no information
Q4Is the environmental labeling program
transparent in its information?
yes/no/partially/no information
Q5Does the product fit the product category,
product environmental criteria
and performance data set by the ecolabeling body?
yes/no/partially/no information
Q6Is there information that explains
the meaning of the ecolabel?
yes/no/partially/no information
Q7Does the mark on the product match the
official label of the environmental program?
yes/no/partially/no information
ISO 14021
Q8Are the environmental claims used inappropriate claims such as: “environmentally sound; environmentally friendly; non-polluting; green”, etc.?yes/no/partially/no information
Q9Are there explanations for the environmental statement if it is not clear?yes/no/partially/no information
Q10Do the environmental claims comply with the special established requirements of 14021 chapter 5.7?yes/no/partially/no information
Q11Are special signs used, for example: Mobius strip (recycling sign)?yes/no/partially/no information
Source: authoring.
Table 2. The questionnaire.
Part of the QuestionnaireQuestions
Part I
Sociodemographic data
Gender, age, place of living, education, income, occupation
Part II
Recognition of ecolabels
Do you know what ecolabeling is?
Ecolabels are… (choose the correct answer)
How many types of ecolabels do you think there are?
Are these ecolabels familiar to you?
Which country do you think the below eco-label belongs to?
Where do you know these ecolabels from?
How many ecolabels do you think exist?
What, in your opinion, is the main purpose of applying the ecolabel?
Do you think that a unique gadget application for searching for information about ecolabeled products would be helpful?
Part III
The factors of purchasing decision
Do you check ecolabels on the packaging of a product before purchasing it? (nether/sometimes, depending on the category of goods/ always)
What factors are more important for you when buying goods?
Do you think ecolabeled products are better (healthier, environment-friendly) than conventional ones?
What do you think is meant by ecological products?
What do you mean by the environmental safety of products?
Are you willing to pay a higher price for environmental products?
Source: authoring.
Table 3. Sociodemographic profiles of the respondents.
AttributesValueFrequency%
GenderMale6726.8
Female18373.2
Age16–19114.4
20–2912349.2
30–393614.4
40–493413.6
50–593514
60–6983.2
70+31.2
IncomeI actually live in poverty52
I save on necessary goods3012
I can satisfy all needs, but sometimes
I have to save
16867.2
I can satisfy all personal and family needs3112.4
I find it difficult to answer114.4
I refuse to answer41.6
EducationSecondary education5020
Incomplete higher education5823.2
Higher education (Bachelor’s degree or above)12951.6
Postgraduate education (postgraduate, doctoral, academic degree, degree MBA)135.2
RegionKrasnodar and Krasnodar Region13052
Moscow and Moscow Region5321.2
Volgograd124.8
Ufa31.2
Surgut31.2
Voronezh20.08
Kamchatka Krai3714.8
Stavropol20.08
St. Petersburg41.6
Yaroslavl region20.08
Tula region20.08
Source: authoring.
Table 4. Percentage of conformity of goods from the categories “household chemicals”, “perfume and hygiene” and “food” to the requirements of ISO 14021 and ISO 14024.
RequirementHousehold ChemicalsPerfume and HygieneFood
FullyPartiallyFullyPartiallyFullyPartially
Q10.0060.000.0058.620.0047.83
Q293.333.33100.000.00100.000.00
Q350.0043.3358.620.0030.430.00
Q433.3326.6710.340.000.000.00
Q50.0093.330.000.000.000.00
Q640.0040.0048.280.0052.170.00
Q736.670.0020.690.000.000.00
Q810.0010.000.00100.000.00100.00
Q946.6740.0055.1713.7952.1730.43
Q100.0093.330.000.000.000.00
Q1176.6710.0093.106.9056.5230.43
Source: authoring.
Table 5. Distribution of respondents’ answers.
QuestionAnswerFrequencyPercentage, %
What, in your opinion, is the mainChoosing the correct answer from the four variants suggested11947.6
purpose of applying the ecolabel?
What do you think is meant byChoosing the correct answer from the four variants suggested9939.6
ecological products?
What do you mean by theChoosing the correct answer from the four variants suggested12148.4
environmental safety of products?
Do you know what ecolabeling is?Yes11546
No7630.4
Find it difficult to answer5923.6
Ecolabels are…Choosing the correct answer from the four variants suggest-ed15863.2
How many of these ecolabels areNone14658.4
familiar to you?One239.2
Two218.4
Three135.2
Four00
All of them4618.4
Do you think that a special gadgetYes24296.8
application for searching information about ecolabeled products would be useful?No20.8
Find it difficult to answer62.4
Are you willing to pay a higher price for environmental products?Yes9939.6
No7931.6
Find it difficult to answer7228.8
Do you check ecolabels on the packaging of a product before purchasing it?Yes, always9738.8
No, nether166.4
Sometimes/Depending on the category of goods13754.8
What factors are more important for you when buying goods?Choosing the answer “environmental safety” as one of the options15060
Source: authoring.
Table 6. Cross-tabulation results (only statistically significant results are presented).
AttributeAnswerPearson χ2p-Level
GenderWillingness-to-pay6.64220.03611
GenderEnvironmental safety as a factor of decision11.82950.00058
IncomeWillingness-to-pay52.55920.00001
EducationWillingness-to-pay10.83950.09346
AgeFrequency of checking ecolabels26.95210.00785
EducationFrequency of checking ecolabels15.25680.01835
EducationKnowing what ecolabeling is6.47840.09052
AgeKnowing what ecolabeling is20.91180.00198
AgeEnvironmental safety as a factor of decision21.67080.00139
Place of livingEnvironmental safety as a factor of decision6.015700.04940
Source: authoring.
Table 7. Cross-tabulation results (only statistically significant results are presented).
AnswerAnswerPearson χ2p-Level
Knowing the purpose of ecolabelingWillingness-to-pay6.26060.04371
Environmental safety as a factor of decisionWillingness-to-pay7.65670.02175
Willingness-to-payFrequency of checking eco-labels20.62750.00038
Environmental safety as a factor of decisionFrequency of checking eco-labels13.57340.00113
Knowing the purpose of ecolabelingKnowing what ecolabeling is11.28320.0008
Source: authoring.
Publisher’s Note: MDPI stays neutral with regard to jurisdictional claims in published maps and institutional affiliations.

