Article

Image Processing of UAV Imagery for River Feature Recognition of Kerian River, Malaysia

by
Emaad Ansari
1,
Mohammad Nishat Akhtar
1,
Mohamad Nazir Abdullah
2,
Wan Amir Fuad Wajdi Othman
2,*,
Elmi Abu Bakar
1,*,
Ahmad Faizul Hawary
1 and
Syed Sahal Nazli Alhady
2
1
School of Aerospace Engineering, Universiti Sains Malaysia, Engineering Campus, Nibong Tebal 14300, Malaysia
2
School of Electrical and Electronic Engineering, Universiti Sains Malaysia, Nibong Tebal 14300, Malaysia
*
Authors to whom correspondence should be addressed.
Sustainability 2021, 13(17), 9568; https://doi.org/10.3390/su13179568
Submission received: 28 June 2021 / Revised: 4 August 2021 / Accepted: 11 August 2021 / Published: 25 August 2021

Abstract

:
The impact of floods is the most severe among the natural calamities occurring in Malaysia. The knock of floods is consistent and annually forces thousands of Malaysians to relocate. The lack of information from the Ministry of Environment and Water, Malaysia is the foremost obstacle in upgrading the flood mapping. With the expeditious evolution of computer techniques, processing of satellite and unmanned aerial vehicle (UAV) images for river hydromorphological feature detection and flood management have gathered pace in the last two decades. Different image processing algorithms—structure from motion (SfM), multi-view stereo (MVS), gradient vector flow (GVF) snake algorithm, etc.—and artificial neural networks are implemented for the monitoring and classification of river features. This paper presents the application of the k-means algorithm along with image thresholding to quantify variation in river surface flow areas and vegetation growth along Kerian River, Malaysia. The river characteristic recognition directly or indirectly assists in studying river behavior and flood monitoring. Dice similarity coefficient and Jaccard index are numerated between thresholded images that are clustered using the k-means algorithm and manually segmented images. Based on quantitative evaluation, a dice similarity coefficient and Jaccard index of up to 97.86% and 94.36% were yielded for flow area and vegetation calculation. Thus, the present technique is functional in evaluating river characteristics with reduced errors. With minimum errors, the present technique can be utilized for quantifying agricultural areas and urban areas around the river basin.

1. Introduction

Floods have been the most damaging disasters in Malaysia for a long time. The rise in sea level due to climate change, population growth, and abrupt urbanization have given rise to frequent flood disasters in many countries around the globe. Those living near the seashore and rivers are the most affected due to floods, which often force them to rehabilitate and disturbs their life. One of the factors that leads to degradation of the environment and represents a principal cause of floods in Malaysia is the fact that human activities, including the rapid development of densely populated flood plains, destruction of trees, and encroachment on flood-prone areas for development are viewed only as a positive development, turning a blind eye to their negative aspects [1]. Floods constitute 49% of the total disasters faced by Malaysia post-independence [2]. The consequences of floods in Malaysia include loss of human and animal life, destruction of infrastructures, and crumbling health conditions. In Malaysia, the National Security Council is responsible for flood management by implementing new techniques for flood control, forecasting, warning, and eviction, thus handling pre-disaster, disaster, and post-disaster activities [3]. The Malaysian National Security Council still requires additional overview of floods by researchers and government agencies to assist in decision making [4]. Researchers are finally coming up with community-based flood mitigation policies for inhabitants of towns located in the vicinity of different rivers that are prone to floods [5].
The backwash of floods disturbing the lives of Malaysians has led to more researchers and government agencies escalating the aim of developing enhanced and upgraded flood tracking systems. Quickly predicting the temporal level rise of river water and spatial mapping of flood consequences forms the core of flood monitoring systems. Early detection of flood after-effects and timely measures being taken by government agencies and disaster relief teams in advance can save many lives and protect resources from extreme destruction. All these factors are directly dependent on the availability of suitable data for developing a well-grounded flood monitoring system.
Various researchers have applied different techniques to analyze remotely sensed data for flood mapping that are captured by satellite platforms or UAV high-resolution imagery. Annis et al. [6] compared the digital elevation model (DEM) produced by data obtained using UAVs and light detection and ranging (LiDAR) satellites. Their results, which were determined via quantitative analyses, proved that DEMs acquired using UAVs have very high resolution along with a low surveying cost and require less time compared to DEMs procured by field visits or LiDAR satellites. Tamminga et al. [7] used small drones to investigate 3D dynamic changes due to floods on the Elbow River, Canada. Due to floods, a sediment flux mobility of a complex nature was confirmed in the study. UAVs and satellite images are also useful for examining riparian vegetation along the river basin [8]. Another advantage of UAVs is that they fill the gap between space-borne and field data by quickly providing high spatial resolution data [9]. This edge of UAVs over data acquired through other means helps in measuring river water levels with a better overall accuracy using a canny method [10] or DEM generation [11]. For better validation and calibration of flood models, georeferenced information regarding river shorelines, river geometry, and vegetation along the river basin attained using UAVs provides high temporal resolution, which is limited in the case of satellite images [12]. Post-flood surveys of high-water marks and river cross-sections using small, unmanned aircrafts have proven to be more accurate and effective compared to ground surveys [13]. Ephemeral rivers flowing in ungauged regions are essential for ecosystem balance and runoff. The techniques for measuring the peak discharge of these transient rivers are limited. UAV technology merged with the incipient motion of stones is useful for calculating the peak discharges of such short-lived rivers [14]. Flash floods occurring in ephemeral streams have a direct relationship with human activities, and the magnitude of destruction caused by flash floods is better calibrated by combining field survey data with UAV observations [15]. From the existing literature, it is evident that UAV imagery has a lead over satellite images and field survey data due to its ability to provide high temporal resolution information in less time with a low overall cost. Apart from this, high-resolution satellite images are costly and can sometimes be limited due to weather conditions, whereas field surveys take a long time. Therefore, the present work includes river images captured using UAVs for river feature recognition. Satellite data are also used in the present work for tertiary information, such as weather forecasting, crucial site locating, and river mapping. An amalgamation of UAV technology and satellite images is employed to collect reliable results.
Implementation of image processing algorithms for flood mapping has improved the reliability of results. Although there is no common solution for accurate flood monitoring, image processing has been proven to be a most reliable and widely used technique for analyzing digital images of river ecosystems [16]. Supervised image analysis consisting of classical image processing techniques such as multispectral classification along with pixel aggregation and shadow treatment is useful for analyzing flooded riverbeds [17]. Digital image processing is also functional as regards historical archives of river imagery to capture features of interest [18] as well as for LiDAR images [19]. Image processing of webcam images utilizing Raspberry-Pi and optical sensors is handy for flood detection [20]. Image processing algorithms are convenient for flood mapping as they can analyze terrestrial features and satellite images [21,22]. Real-time flood monitoring through the investigation of river hydromorphological features has become convenient due to video processing [23] and image processing [24] of data captured using UAVs. Cyber surveillance of an object in a flooded region for automatic monitoring and alert feedback are other applications of image processing [25]. The applications of image processing are not limited to early flood detection and flood monitoring, however. The segmentation and classification of UAV imagery are convenient for detecting the hydromorphological effects of floods in riverbeds and floodplains [26]. Plotting flood hydrographs has become possible using object-based image analysis (OBIA) with the help of image processing technology [27]. Jafari et al. [28] used live cameras and image processing techniques for real-time stream water level monitoring in this study. Apart from image processing techniques, convolutional neural networks (CNNs) [29], deep learning (DL) [30], artificial neural networks (ANN) [31], etc., for flood mapping using UAVs are other useful techniques that can be integrated, but image processing techniques have an edge over them due to the availability of high-resolution time saving algorithms [32]. Thus, from the existing literature, a range of applications of image processing for flood detection, flood monitoring, and analyzing post-flood effects is observed.
The hydromorphological feature data of the Kerian River are very limited. Therefore, this research presents the application of image processing for feature extraction in the Kerian River. The k-means algorithm for clustering along with thresholding for image segmentation are used in the present study to evaluate temporal variation in flow width and vegetation along river banks during a period of 3 months.

2. Materials and Methods
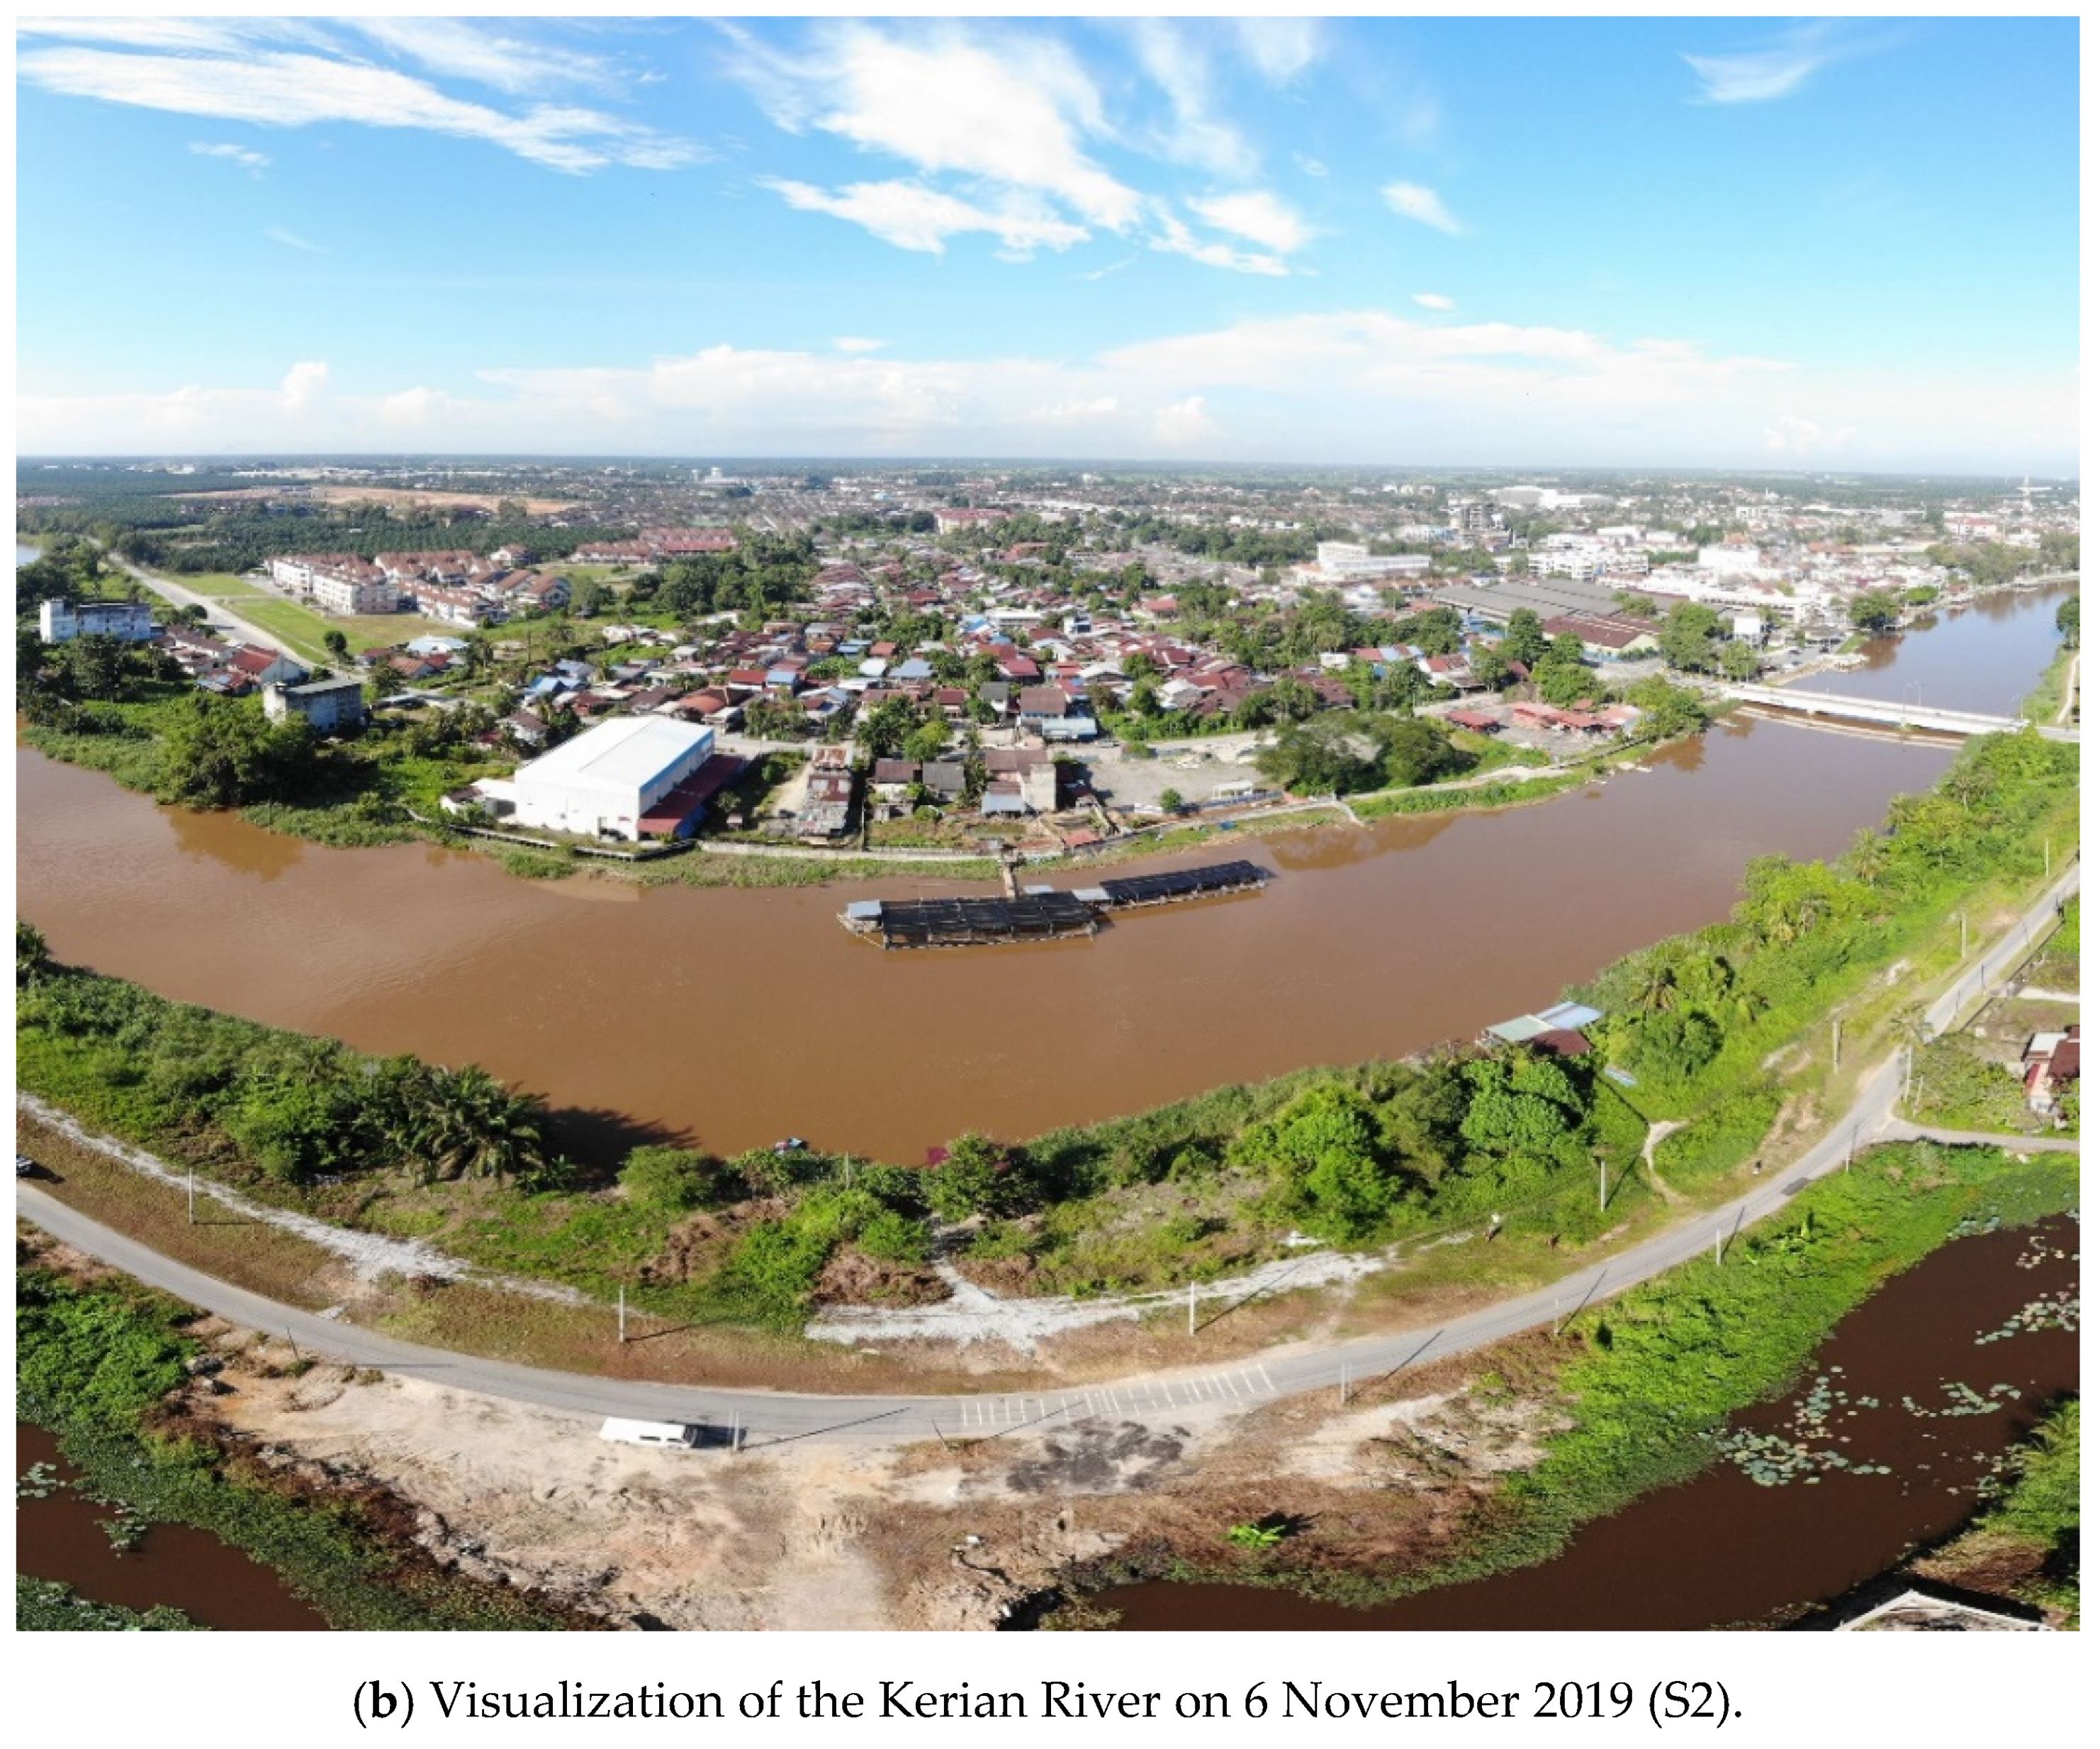
2.1. Study Area

We carried out the study in the Kerian River (Figure 1) that flows through the northern states of Peninsular Malaysia. The Kerian River is a meandering river of approximately 90 km length, originating in the Bintang Range in the northern state of Perak. This river serves as a border between the state of Kedah and Perak for approximately 73 km until it enters the Malaysian state of Penang for its remaining 17 km, where it finally discharges into the Strait of Melaka. The study region lies downstream of the Kerian River at the location 5 ° 7′31″ N, 100 ° 29′50″ E in Bandar Baharu, Kedah, where the width of the river measures 34.51 m. The width of the mouth of the Kerian River is approximately 166.71 m.

2.2. Flight Mission

The UAV used in the study is a DJI Mavic Pro fitted with a 1/2.3″ complementary metal-oxide-semiconductor (CMOS) 12MP 4K camera. We tabulate the characteristics of the camera in Table 1. We carry out the flight operations twice within three months. The flight mission comprised reconnaissance of the mapped site and pre-flight fieldwork. The H83 mm × W83 mm × L198 mm copter has an upright take-off weight of 734 g. Its fully charged lithium polymer (LiPo) 3830 mAh batteries provide a maximum flight time of 27 min. The DJI Mavic Pro can withstand wind speed up to 7 m/s, which was never exceeded during the flight mission. The flight altitude while capturing the images was 70 m, which the UAV climbed with an ascent speed of 4 m/s. The resulting ground sample distance was (GSD) 2.4 cm. To observe variation in flow width and vegetation growth, we execute a flight mission to capture UAV images on 31 July 2019 at 09:04 am and 6 November 2019 at 09:20 am at the location 5 ° 7′40″ N, 100 ° 29′48″ E in Bandar Baharu, Kedah. We name the sites S1 and S2 on 31 July 2019 and 6 November 2019, respectively. The wind speed recorded was 1.67 m/s with the partly cloudy conditions at S1 and 1.11 m/s with broken clouds at S2. The temperature recorded on these two days was 29 ° C and 31 ° C , respectively. The level of tides was 1.69 m at S1 and 1.73 m at S2.

2.3. Image Processing of UAV Images

2.3.1. Implementation of Bilateral Filter

The first step in image processing was the enhancement of all UAV images, using a bilateral filter. Bilateral filter, a type of time-domain non-linear filter, reduces the noise with edge preservation by restoring the intensity of every pixel with weighted intensity values of surrounding pixels [33]. A bilateral filter uses the Gaussian distribution for calculating the weighted intensity values with an additional component, which is a function of pixel intensity difference [34]. This additional component ensures it used only weighted intensity values in computing blurred intensity values. The bilateral filter is defined as:
I f i l t e r e d = 1 W P x i Ω I ( x i ) f r ( I ( x i ) I ( x ) ) g s ( x i x )
W P is the normalization term defined by:
W P = x i Ω f r ( I ( x i ) I ( x ) ) g s ( x i x )
In Equations (1) and (2), I f i l t e r e d is the filtered image, I is the input image, x are the coordinates of the current pixel, Ω is the window centered in x , x i   ϵ   Ω is another pixel, f r is the range kernel and g s is the spatial kernel. Allocation of the weight W P uses f r and g s [34].
If a pixel located at ( i , j ) is to be denoised in image using surrounding pixels and we consider one of its neighbors at ( k , l ) , then the weight assigned to a pixel at ( k , l ) to denoise a pixel at ( i , j ) is given by:
w ( i ,   j ,   k ,   l ) =   exp ( ( i k ) 2 + ( j l ) 2 2 σ d 2 I ( i , j ) I ( k , l ) 2 2 σ r 2 )
In Equation (3), σ d and σ r are smoothing parameters, whereas I ( i , j ) and I ( k , l ) are pixel intensities at ( i , j ) and ( k , l ) , respectively [34]. We calculate the denoised intensity of pixel, I D at ( i , j ) after evaluating the weights and normalizing them using the equation:
I D ( i , j ) = k , l I ( k , l ) w ( i , j , k , l ) k , l W ( i , j , k , l )
Bilateral blur can fragment the image into different scales [35]. Along with edge preservation, bilateral filter finds application in denoising, tone mapping, tone management, data fusion, retinex, and texture and illumination separation [36]. The present work required denoising, which the bilateral blur serves, and hence we select it for this study. We did not detect the staircase effect and gradient reversal in the filtered image in this work, which are the limitations of the bilateral blur.

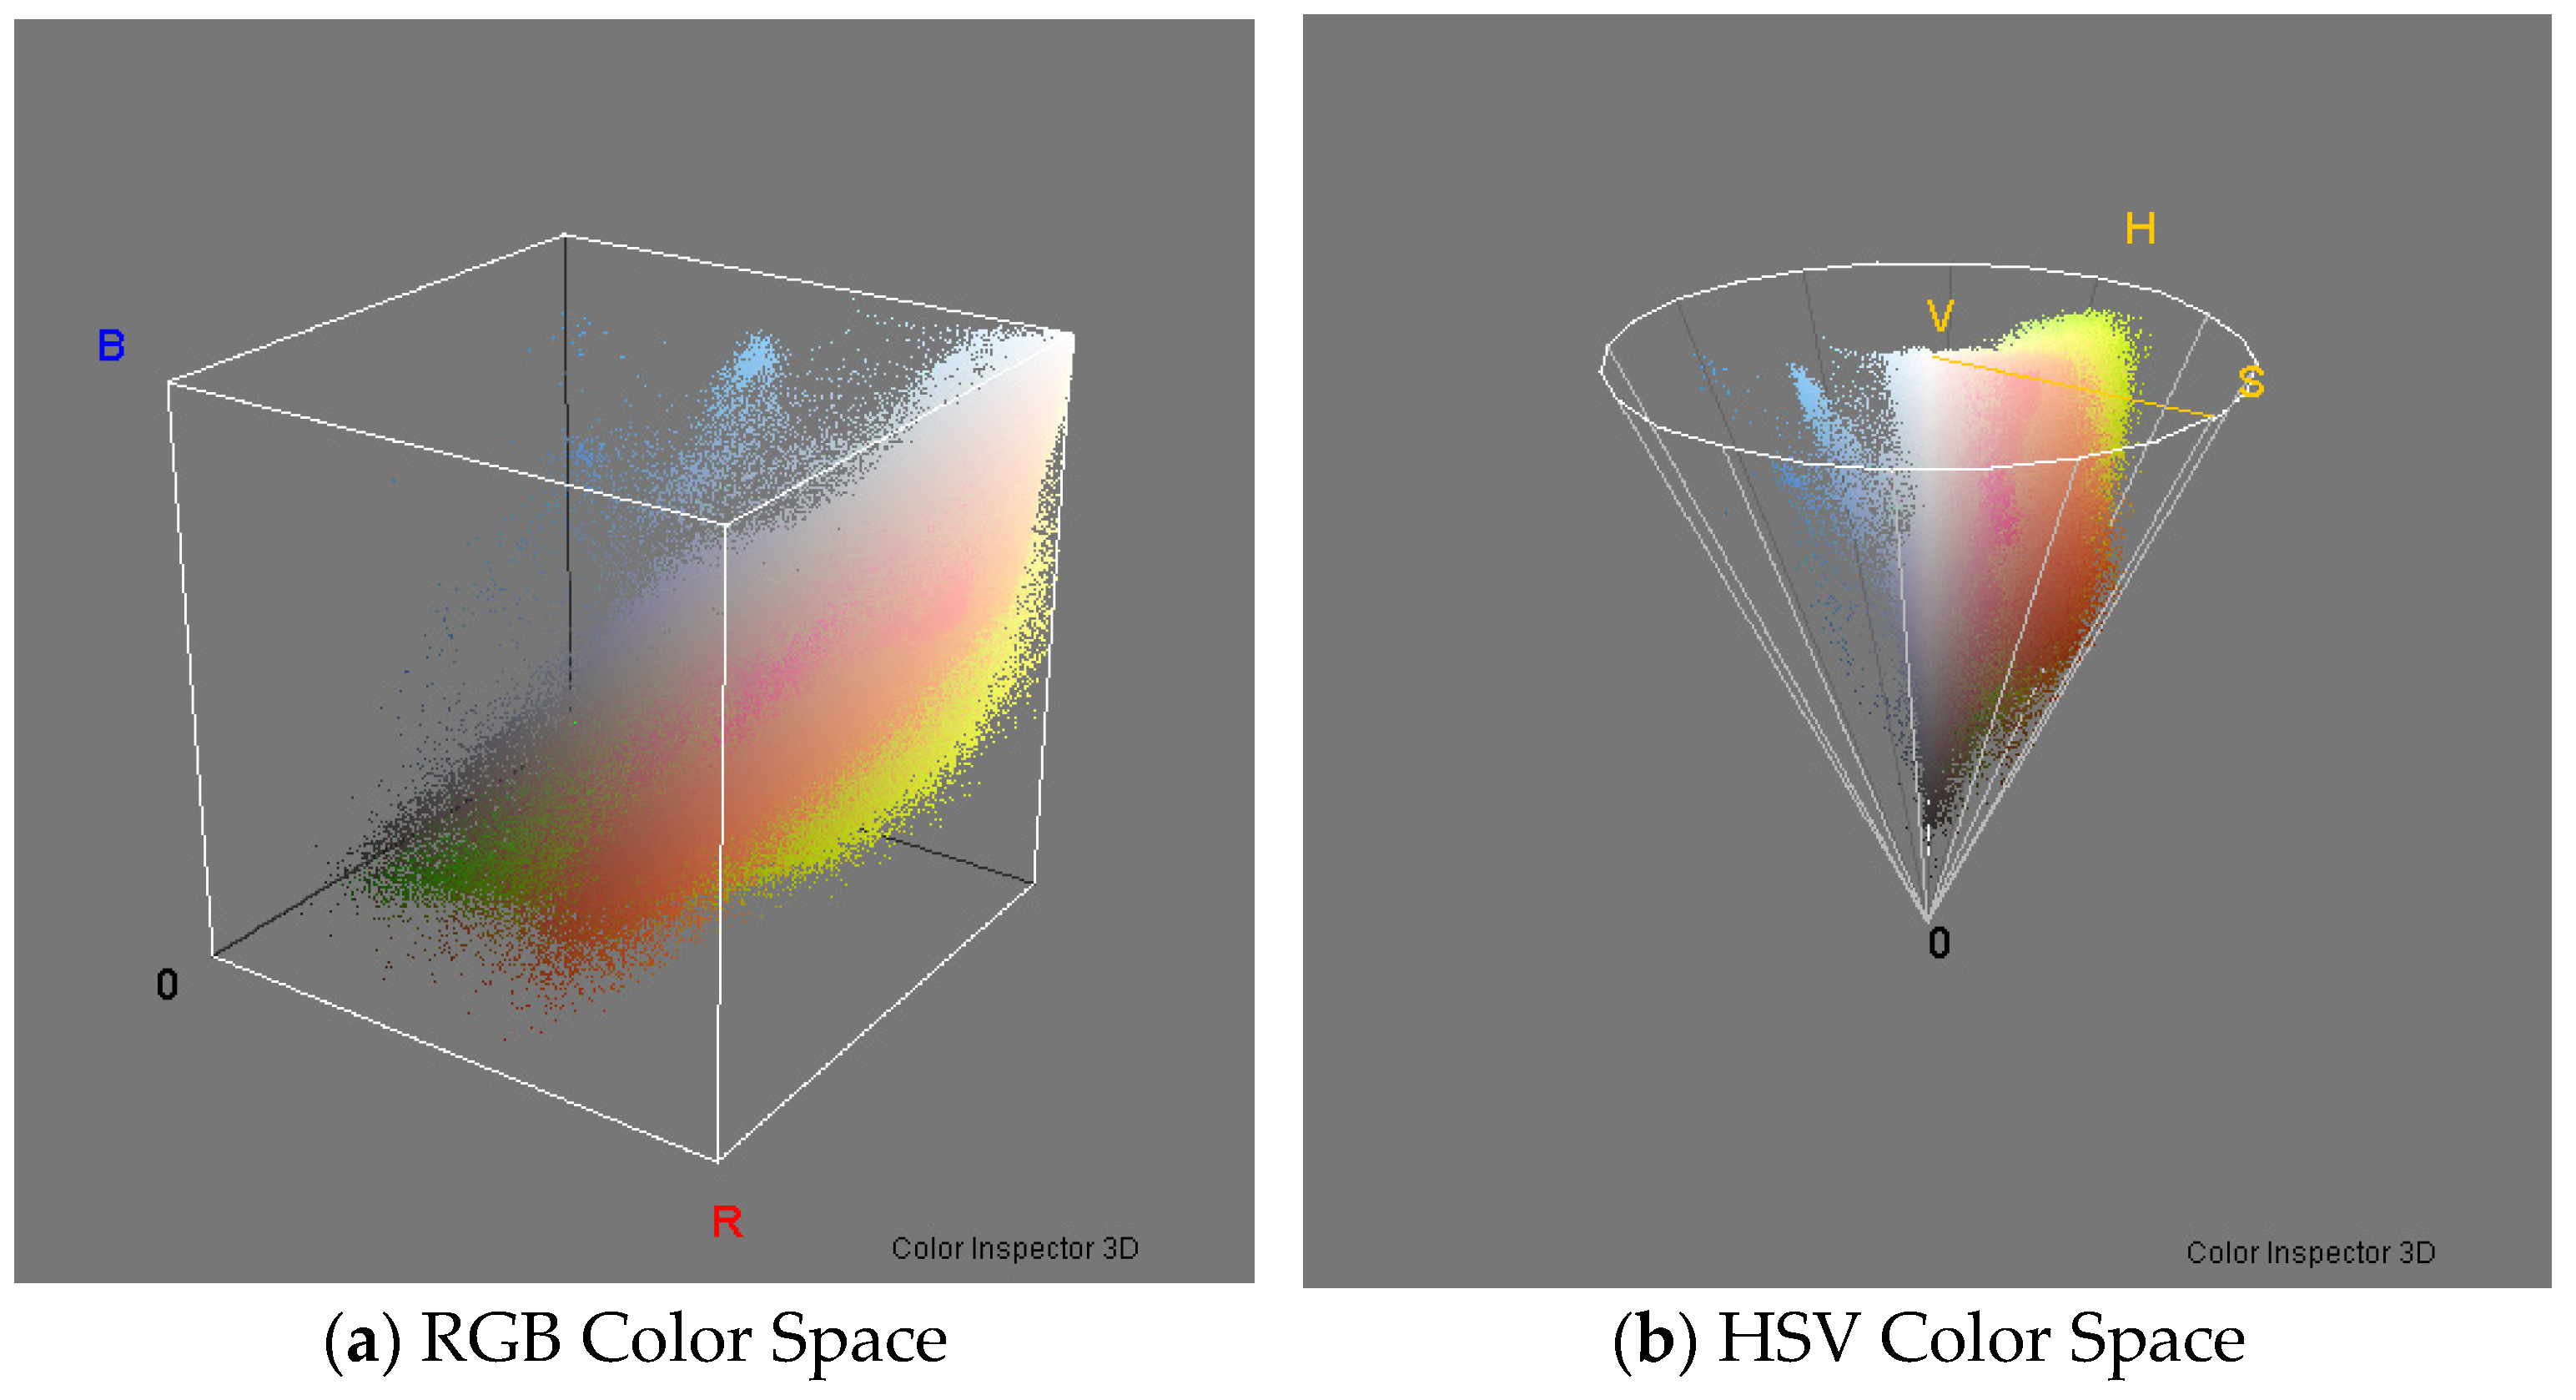
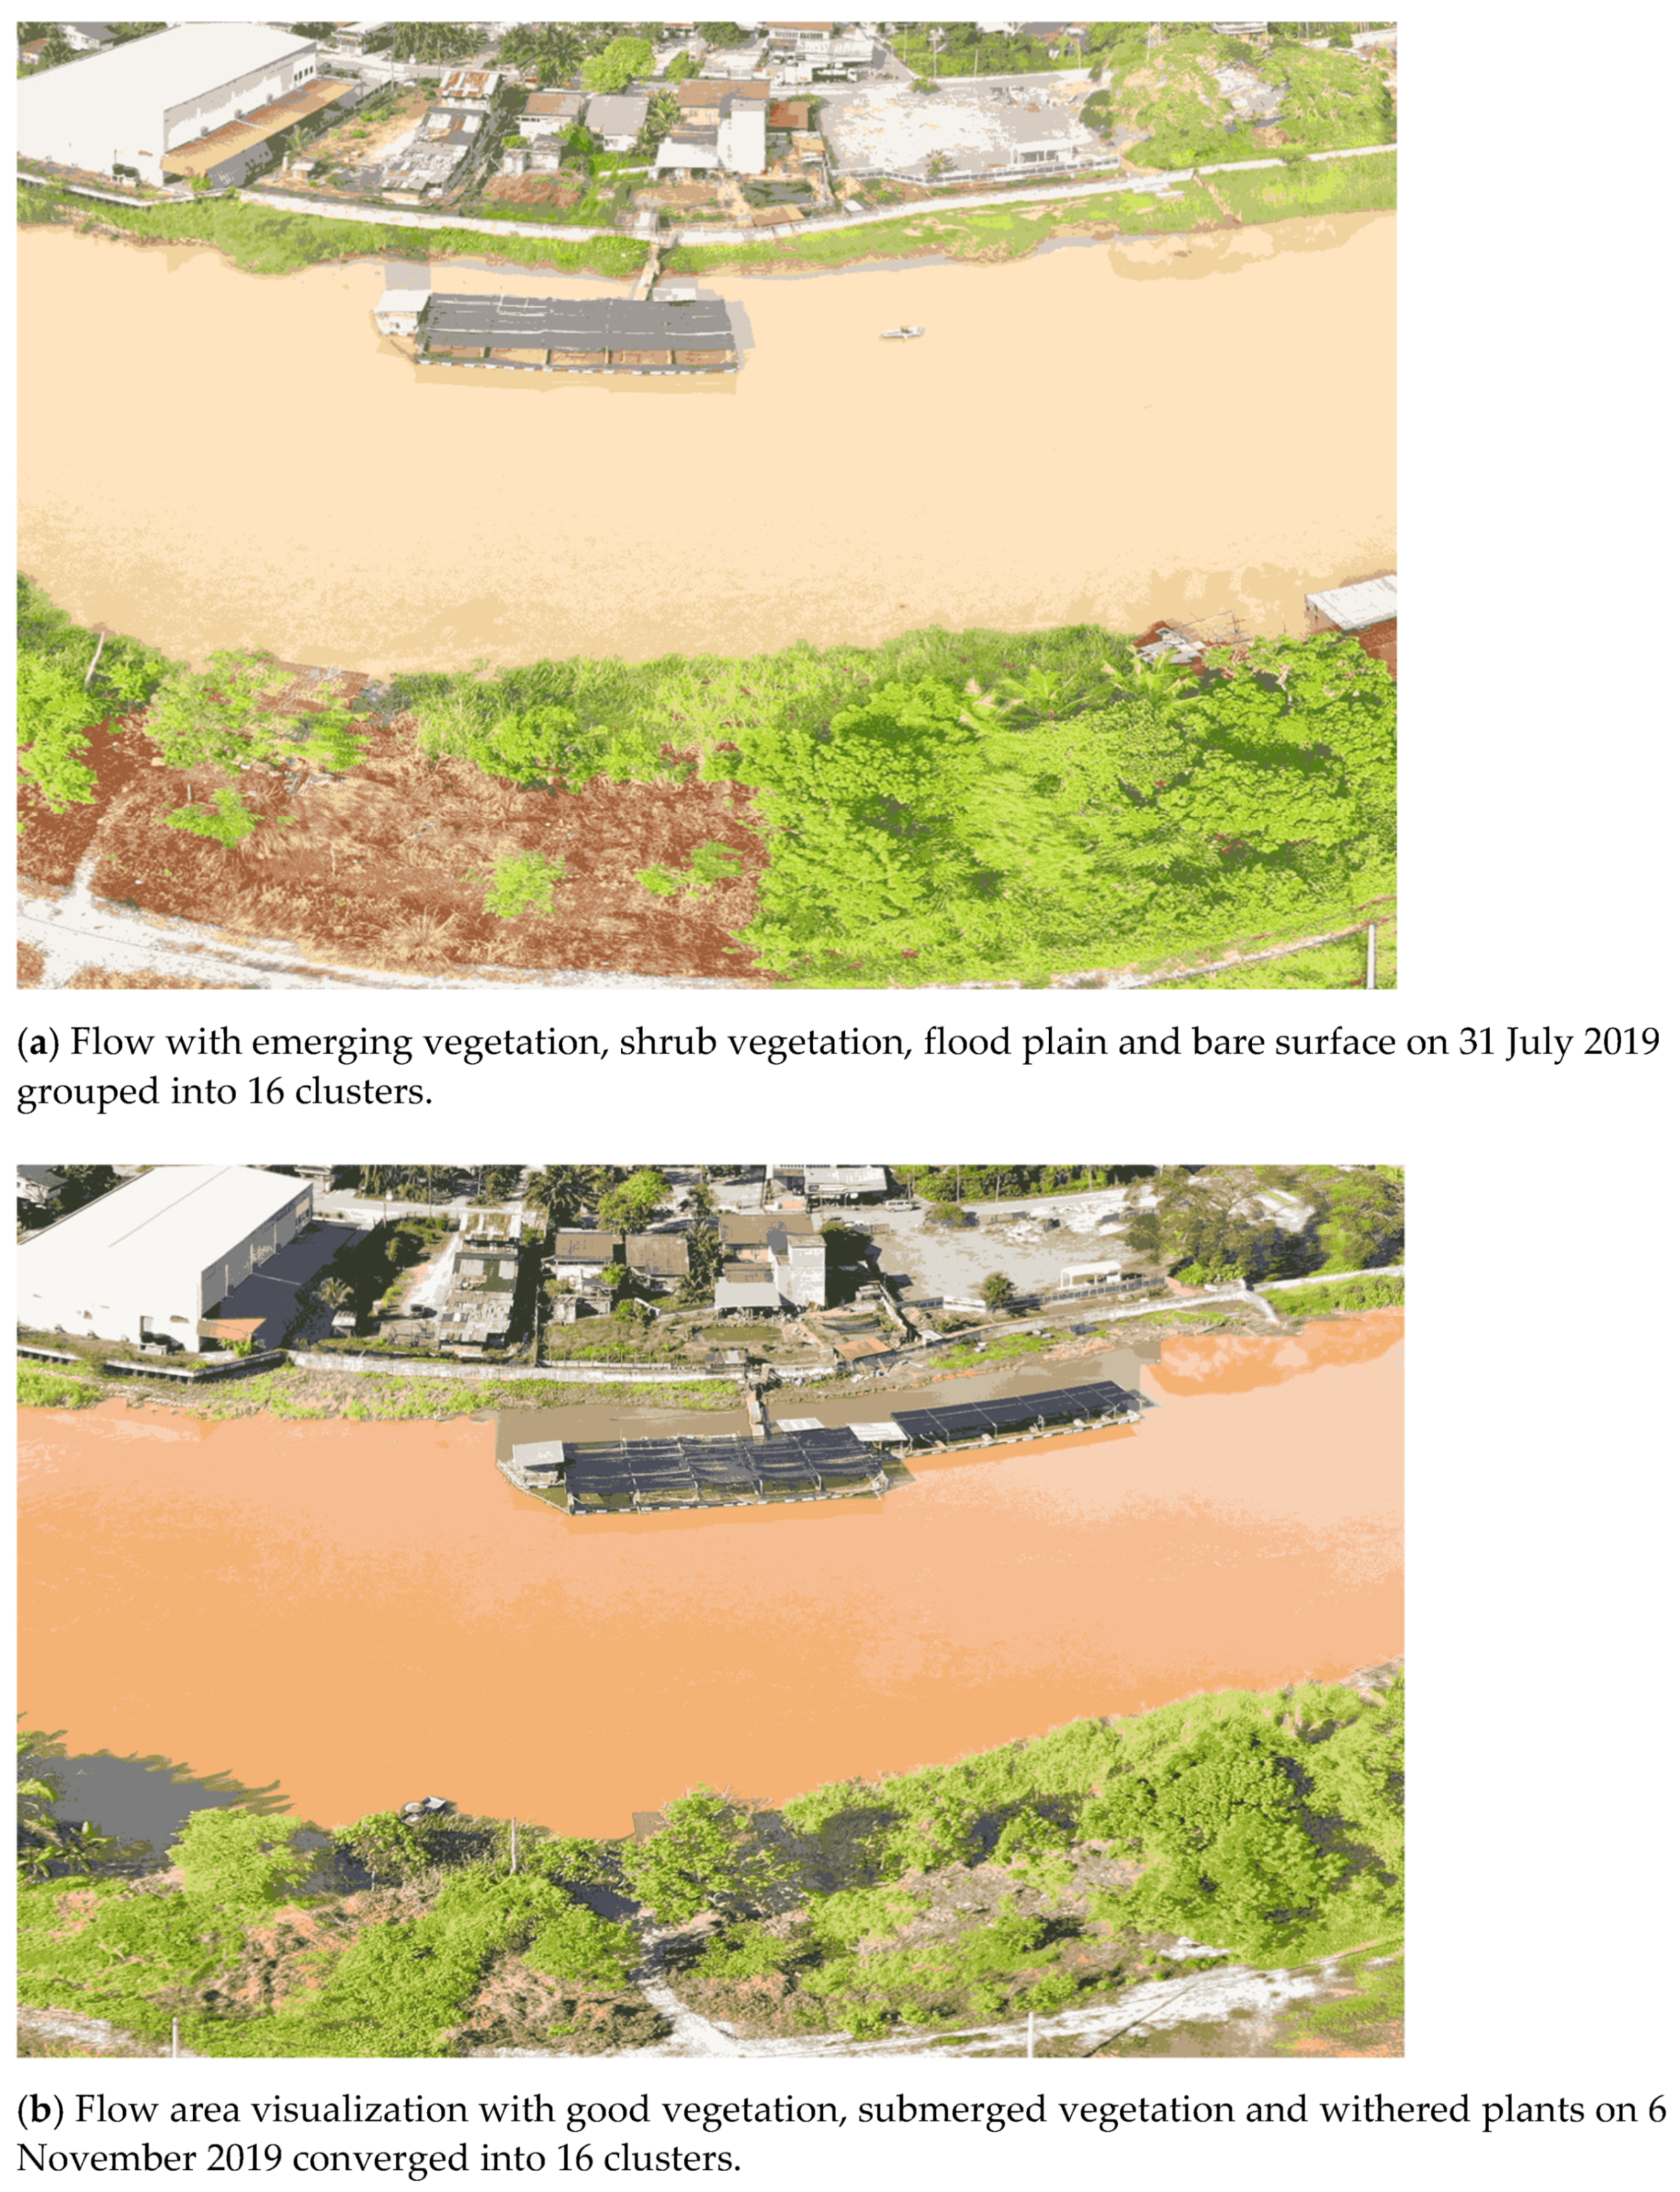
2.3.2. Clustering of Pixels Using k-Means Clustering Method

We then clustered, filtered, and enhanced images using the k-means clustering algorithm. The k-means clustering method is a clustering algorithm. In image analysis, it can cluster pixels of an image in unsupervised classification. Implementation of the k-means clustering in Python is uncomplicated, and therefore widely used by novice programmers and data scientists [37]. We implement the k-means for image pixel clustering in Python using its multiprocessing feature. The multiprocessing feature enables the parallel implementation of the k-means algorithm, reducing the execution time. The principal component of k-means clustering involves two steps, expectation and maximization. We assign each pixel to its nearest centroid in expectation, while the maximization step involves computing the mean of all pixels for each cluster and sets the new centroid. The flowchart in Figure 2 depicts the steps involved in implementing the k-means clustering algorithm.

2.3.3. Thresholding of Clustered Images

We use HSV thresholding for the analysis of clustered images post-k-means clustering. In vision and image processing, separating image intensity from color information is very important for many applications that are possible only in HSV color space. For this reason, we convert the clustered images from RGB to HSV color space.
Image segmentation is significant to gain clear perceptibility of the region of interest (ROI) [38]. We compute limits of the segmented pairs of hue (Hlower, Hupper), saturation (Slower, Supper), and value (Vlower, Vupper) to convert HSV color space to binary form using the equation:
C ( x , y ) = { 1 , H l o w e r < H i n p u t ( x , y ) < H u p p e r , } { S l o w e r < S i n p u t ( x , y ) < S u p p e r , } { V l o w e r V i n p u t ( x , y ) V u p p e r , } { 0 ,   O t h e r w i s e } .
In Equation (5), C ( x , y ) is the thresholded part. Additionally, Equation (5) shows that if the HSV values for the pixels of the input image lie between the range of lower and upper bound values, then its associated output pixel belongs to class object 1, otherwise it is null (0). The segmented image is further analyzed to compute the area of white pixels. We calibrate the percentage of white pixels to calculate the ROI in desired units.

2.4. Evaluation of Image Processing Algorithm Effectiveness

The human evaluator or quantitative evaluation methods can calculate the efficiency and effectiveness of image processing algorithms [17]. Some of the metrics approached and extensively used by researchers for evaluating the accuracy of image processing algorithms include dice similarity coefficient (DSC), Jaccard index, precision, and recall. In the present work, we use DSC and Jaccard index to assess the effectiveness of image thresholding with the implementation of the k-means clustering. We used DSC and Jaccard index for evaluating variation in flow area and vegetation growth. We calculate the efficiency of clustered segmented images to manually segmented images.
The DSC works on binary numbers, and its value ranges from 0% to 100% for no overlap to complete overlap between two data sets of image thresholding. The DSC is defined as:
D S C = 2 | A B | | A | + | B |
where | A | and | B | are the number of elements of set A and set B, respectively.
The Jaccard index (J) is the ratio of the intersection of two data sets to the union of the two sets. It also ranges from 0 to 100%, describing the same overlap conditions as DSC. The Jaccard index (J) is given by:
J ( A , B ) = | A B | | A B |

3. Results

We show the oblique UAV images captured in the present study and visualize the study reach for the present study along with the in-channel structure in Figure 3. Apart from this, we also capture the floodplains, water areas, low vegetation, shrub vegetation, and tree vegetation. We also captured the urban areas around the floodplain on the terrace. The present work only focuses on water area and vegetation growth in order to enumerate their variation. We cropped the study region as per the ROI, maintaining the pixel ratio. Further, in order to remove the noise, we apply a bilateral filter. On application of the bilateral filter, we obscured considerable noise and smoothened the site images. The edge preservation benefit of the bilateral filter paves the way for better clustering. Sunlight and water reflectance that are denoised to an extent by the application of the filter influences the various forms of vegetation along the river basin and flow area.
The next step post-implementation of the bilateral filter is the clustering of pixels using the k-means clustering algorithm. The necessity of clustering is that it segregates the largely distributed values of color space into desired numbers of color variation equivalent to the number of clusters (k). Figure 4 shows the color inspection in RGB color space and HSV color space. The color inspector feature of ImageJ software was used for the aforementioned purpose. Prior to clustering of pixels, it was difficult to extract the RGB or HSV limits, which lead to a decrease in the effectiveness of image segmentation. Extracting the RGB or HSV limits from the color inspector models for the water area and vegetation cover region is extremely tedious work. The researcher needs to analyze every pixel of the image for extracting the limits.
Figure 5 shows the images filtered and clustered using a bilateral filter and the k-means clustering algorithm. As per the flowchart in Figure 2, for all the site images, we selected the value of k randomly from k = 2 onwards until the clusters appeared unchanged. We increased the number of clusters by 2 and visualized them by human vision. Further, we increased the number of clusters in order to classify the image into an optimum number of color clusters. Finally, we clustered Figure 5a,b with k = 16 as the images converged at this number of clusters. Further increase in k produced unchanged cluster centroids as observed by human evaluation. Human visualization incorporated with interpreting elbow graphs produces better results in terms of accuracy in predicting an optimum number of clusters [39]. We identified the optimum number of clusters using an elbow graph in the current work.
Post clustering of images, the color inspection of HSV components becomes a simple and effective task. We converted the color space of all the images from RGB to HSV. HSV color space proves useful for robustness, removing shadows, lighting changes, etc., because of the separation of color components from the intensity. Thus, increasing the effectiveness of the image segmentation algorithm. Figure 6 shows the color inspection model in HSV color space for clustered image (k = 16). Compared to Figure 5, the HSV color inspector post-application of the k-means clustering algorithm (Figure 6) produces a better visual for extraction of HSV limits, which saves the energy and time of the human evaluator. We tabulated the thresholding HSV limits of water area and vegetation for sites S1 and S2 in Table 2 and used these values for image thresholding (Figure 7). Then, we counted the white pixels depicting ROI in thresholded images using a pixel counting algorithm in Python. Finally, we performed the RGB to HSV color space conversion and HSV limit evaluation using ImageJ (Version 1.53c). ImageJ allows the human evaluator to move the pointer over the image, which reflects the HSV value on the color inspector. An image with an optimum number of clusters classifies the features of the image into a clear perspective. In the present work, we clustered the water area and vegetation spread into six color components each. We got the maximum and minimum values of hue, saturation, and value component of the flow area and vegetation from Figure 6 (Table 2).

4. Discussion

4.1. Variation in Water Flow Area and Vegetation Cover

We calibrated the number of white pixels as a percentage of the total number of pixels and in terms of actual area (Table 3). The flow area varied slightly from 39.441% (4437.1 m2) to 39.531% (4447.2 m2). This slight variation is because of the tide difference, while all the other conditions were similar. An increase of 8.45% of the flow area will lead to overflow conditions. The vegetation growth over the period changed from 19.513% (2195.2 m2) to 25.314% (2847.8 m2). Malaysia having a tropical climate with year-round rainfall is one of the main reasons for this good amount of vegetation growth [40]. Vegetation significantly influenced the linkages between terrestrial ecosystems and atmospheric processes. It is workable to measure the advantages of ecosystem restoration by identifying the mechanisms through which vegetation dynamics and sensitivities to water resource availability respond at various temporal and geographical scales.

4.2. Quantitative Evaluation

The effectiveness of thresholding post-implementation of the k-means clustering is clear from the DSC values ranging from 92.51% to 97.86% and the Jaccard index ranging from 91.39% to 94.36%. Compared to thresholding of non-clustered images where the DSC is 77.99%, the Jaccard index is 63.92% for normal flow conditions [17], the present method scores much better effectiveness for normal flow conditions. The metric values prove better overlap between the manually segmented images and the algorithm segmented images. We expect we can score a much better DSC and Jaccard index for overflow conditions since in overflow conditions the ROI becomes smoother. We encountered the commission and omission errors in the image classification technique in the present work to a small extent. During image classification, at some point, no actual change is classified as a change in the model, which leads to commission errors. While in other instances, we left some actual changes unsegmented in image thresholding, leading to omission errors [41]. We observed the combined effect of these errors in the quantitative evaluation results (Table 4). For the suggested research, the quantitative method can aid in an analysis where qualitative data is mainly in terms of analytic yield. The technique expands qualitative analyses horizons by providing researchers with a systematic way of guiding subgroup analysis within a qualitative data set.

4.3. Advantages and Limitations of UAV in River Feature Recognition

The advancement in UAV has paved the way for vertical dimension formation density and position referencing [42]. UAVs are also reliable for fluvial geomorphic study and reduce the error in observation arising in field study [43]. UAVs ensure less time consumption in data acquisition. They also have an upper hand in capturing real-time series data that we use in capturing flood events and landslides. Also, UAV technology compiles different data models produced in a single flight. Apart from being less expensive, UAV mapping provides equivalent spatial information and better operational features than airborne LIDAR [44]. However, the optical data acquisition of UAVs cannot pierce through vegetation cover and terrain features [45]. Another limitation of UAV technology is that the region with extensively low vegetation is unclassified in removal from the surface [46], but point cloud acquisition from the ground under the vegetation is possible using UAV LIDAR [47]. Another disadvantage of using small UAV platforms is that it limits the payload, while implementing drone-based imaging to capture temporal images of the same cross-sections is a tedious job.

4.4. UAV Imagery in Landscape of Kerian River and other Malaysian Rivers

The tropical climate of Malaysia and the year-round rainfall makes it difficult to analyze the river characteristics using low-cost satellite images because of heavy cloud covers [48]. UAV technology has a lead over satellite imagery because of its low operating cost. The Kerian River, for most of its upstream length, flows in an isolated region. The Kerian and other river basins of Malaysian rivers are the habitats of crocodiles, which makes it threatening for field visits. UAV imagery proves to be safe considering the climate and threats. The present study focuses only on flow area and vegetation growth using UAVs. We will get more features of the Kerian River using UAVs as inputs to the Ministry of Environment and Water, Malaysia in the future for river management. The sediment concentration by collecting sediments using samplers [49] and its validation using image processing are some gaps in this research topic. Apparently, for the Kerian River, there is limited river surveillance camera and flood does not occur frequently in this region. Therefore, direct use of a convolutional neural network (CNN) may not be a viable option for the river state classification. However, for future consideration, if enough surveillance cameras are installed at various cross-sections of the Kerian River, then we can develop a CNN model, as there will be a sufficient dataset to train the network. We may plan further work to use spectral cameras in UAVs to find the sediment concentration and composition using reflectance.

5. Conclusions

This work presented the application of the k-means clustering algorithm on UAV captured images with image thresholding for pressing out the flow area and vegetation growth. We calculated the binary white pixels to numerate the water area and vegetation cover. The results of image processing were proficient in withdrawing the river features. The dice similarity coefficient and Jaccard index for flow area and vegetation segmentation techniques fetched a value of over 90%, better than the existing techniques. Apart from this, the UAV technology is a promising tool to identify the river characteristics with high temporal information, low cost, and less time. A better understanding of river complexity may help the river management authorities in the proper planning of activities in the river basin. Our results will open a new corridor for the local officials in improving river hydro morphological conditions for sustainable river management, deploying various assessment tools.

Author Contributions

Conceptualization, E.A., M.N.A. (Mohammad Nishat Akhtar), and E.A.B.; formal analysis, E.A., M.N.A. (Mohammad Nishat Akhtar), and E.A.B.; funding acquisition, W.A.F.W.O.; methodology, E.A., M.N.A. (Mohammad Nishat Akhtar), M.N.A. (Mohamad Nazir Abdullah), E.A.B. and A.F.H.; project administration, W.A.F.W.O., E.A.B. and S.S.N.A.; supervision, M.N.A. (Mohammad Nishat Akhtar), M.N.A. (Mohamad Nazir Abdullah) and E.A.B.; writing—original draft, E.A.; writing—review and editing, E.A., W.A.F.W.O. and A.F.H. and S.S.N.A. All authors have read and agreed to the published version of the manuscript.

Funding

This study was funded by Research Creativity and Management Office, Universiti Sains Malaysia. The authors would like to acknowledge the grant RUI 1001/PAERO/8014035 and RU Top-Down 1001/PAERO/870052.

Conflicts of Interest

The authors declare no conflict of interest.

References

  1. Chan, N.W. Increasing flood risk in Malaysia: Causes and solutions. Disaster Prev. Manag. Int. J. 1997, 6, 72–86. [Google Scholar] [CrossRef]
  2. Shaluf, I.M.; Ahmadun, F.R. Disaster types in Malaysia: An overview. Disaster Prev. Manag. Int. J. 2006, 15, 286–298. [Google Scholar] [CrossRef]
  3. Khalid, M.S.B.; Shafiai, S.B. Flood Disaster Management in Malaysia: An Evaluation of the Effectiveness Flood Delivery System. Int. J. Soc. Sci. Humanit. 2015, 5, 398–402. [Google Scholar] [CrossRef] [Green Version]
  4. Shah, S.M.H.; Mustaffa, Z.; Yusof, K.W. Disasters Worldwide and Floods in the Malaysian Region: A Brief Review. Indian J. Sci. Technol. 2017, 10. [Google Scholar] [CrossRef]
  5. Mohit, M.A.; Sellu, G.M. Mitigation of Climate Change Effects through Non-structural Flood Disaster Management in Pekan Town, Malaysia. Procedia Soc. Behav. Sci. 2013, 85, 564–573. [Google Scholar] [CrossRef] [Green Version]
  6. Annis, A.; Nardi, F.; Petroselli, A.; Apollonio, C.; Arcangeletti, E.; Tauro, F.; Belli, C.; Bianconi, R.; Grimaldi, S. UAV-DEMs for Small-Scale Flood Hazard Mapping. Water 2020, 12, 1717. [Google Scholar] [CrossRef]
  7. Tamminga, A.D.; Eaton, B.C.; Hugenholtz, C.H. UAS-based remote sensing of fluvial change following an extreme flood event. Earth Surf. Process. Landf. 2015, 40, 1464–1476. [Google Scholar] [CrossRef]
  8. Morgan, B.E.; Bolger, D.T.; Chipman, J.W.; Dietrich, J.T. Lateral and longitudinal distribution of riparian vegetation along an ephemeral river in Namibia using remote sensing techniques. J. Arid Environ. 2020, 181, 104220. [Google Scholar] [CrossRef]
  9. Bandini, F.; Jakobsen, J.; Olesen, D.; Reyna-Gutierrez, J.A.; Bauer-Gottwein, P. Measuring water level in rivers and lakes from lightweight Unmanned Aerial Vehicles. J. Hydrol. 2017, 548, 237–250. [Google Scholar] [CrossRef] [Green Version]
  10. Ridolfi, E.; Manciola, P. Water level measurements from drones: A Pilot case study at a dam site. Water 2018, 10, 297. [Google Scholar] [CrossRef] [Green Version]
  11. Hashemi-Beni, L.; Jones, J.; Thompson, G.; Johnson, C.; Gebrehiwot, A. Challenges and opportunities for UAV-based digital elevation model generation for flood-risk management: A case of princeville, north carolina. Sensors 2018, 18, 3843. [Google Scholar] [CrossRef] [PubMed] [Green Version]
  12. Karamuz, E.; Romanowicz, R.J.; Doroszkiewicz, J. The use of unmanned aerial vehicles in flood hazard assessment. J. Flood Risk Manag. 2020, 13, 1–12. [Google Scholar] [CrossRef]
  13. Forbes, B.T.; DeBenedetto, G.P.; Dickinson, J.E.; Bunch, C.E.; Fitzpatrick, F.A. Using small unmanned aircraft systems for measuring post-flood high-water marks and streambed elevations. Remote Sens. 2020, 12, 1437. [Google Scholar] [CrossRef]
  14. Yang, S.; Li, C.; Lou, H.; Wang, P.; Wang, J.; Ren, X. Performance of an unmanned aerial vehicle (UAV) in calculating the flood peak discharge of ephemeral rivers combined with the incipient motion of moving stones in arid ungauged regions. Remote Sens. 2020, 12, 1610. [Google Scholar] [CrossRef]
  15. Kastridis, A.; Kirkenidis, C.; Sapountzis, M. An integrated approach of flash flood analysis in ungauged Mediterranean watersheds using post-flood surveys and unmanned aerial vehicles. Hydrol. Process. 2020, 34, 4920–4939. [Google Scholar] [CrossRef]
  16. Rusnák, M.; Sládek, J.; Kidová, A.; Lehotský, M. Template for high-resolution river landscape mapping using UAV technology. Meas. J. Int. Meas. Confed. 2018, 115, 139–151. [Google Scholar] [CrossRef]
  17. Muhadi, N.A.; Abdullah, A.F.; Bejo, S.K.; Mahadi, M.R.; Mijic, A. Image segmentation methods for flood monitoring system. Water 2020, 12, 1825. [Google Scholar] [CrossRef]
  18. Brigante, R.; Cencetti, C.; De Rosa, P.; Fredduzzi, A.; Radicioni, F.; Stoppini, A. Use of aerial multispectral images for spatial analysis of flooded riverbed-alluvial plain systems: The case study of the Paglia River (central Italy). Geomat. Nat. Hazards Risk 2017, 8, 1126–1143. [Google Scholar] [CrossRef] [Green Version]
  19. Lane, S.N.; Widdison, P.E.; Thomas, R.E.; Ashworth, P.J.; Best, J.L.; Lunt, I.A.; Sambrook Smith, G.H.; Simpson, C.J. Quantification of braided river channel change using archival digital image analysis. Earth Surf. Process. Landf. 2010, 35, 971–985. [Google Scholar] [CrossRef]
  20. Cobby, D.M.; Mason, D.C.; Davenport, I.J. Image processing of airborne scanning laser altimetry data for improved river flood modelling. ISPRS J. Photogramm. Remote Sens. 2001, 56, 121–138. [Google Scholar] [CrossRef]
  21. Ariawan, A.; Pebrianti, D.; Akbar, Y.M.; Margatama, L.; Bayuaji, L. Image Processing-Based Flood Detection BT—Proceedings of the 10th National Technical Seminar on Underwater System Technology 2018; Md Zain, Z., Ahmad, H., Pebrianti, D., Mustafa, M., Abdullah, N.R.H., Samad, R., Noh, M.M., Eds.; Springer: Singapore, 2019; pp. 371–380. [Google Scholar]
  22. Efremova, O.A.; Kunakov, Y.N.; Pavlov, S.V.; Sultanov, A.K. An algorithm for mapping flooded areas through analysis of satellite imagery and terrestrial relief features. Comput. Opt. 2018, 42, 695–703. [Google Scholar] [CrossRef]
  23. Sultanov, A.K.; Pavlov, S.V.; Efremova, O.A. Development of a processing method of digital maps and satellite images for solving problems of emergencies. In Proceedings of the SPIE, Kazan, Russia, 6 June 2018; Volume 10774. [Google Scholar]
  24. Jyh-Horng, W.; Chien-Hao, T.; Lun-Chi, C.; Shi-Wei, L.; Fang-Pang, L. Automated image identification method for flood disaster monitoring in riverine environments: A case study in Taiwan. In Proceedings of the AASRI International Conference on Industrial Electronics and Applications (IEA 2015), London, UK, 27–28 June 2015; Atlantis Press: Dordrecht, The Netharlands, 2015. [Google Scholar]
  25. Zhang, Q.; Jindapetch, N.; Duangsoithong, R.; Buranapanichkit, D. Investigation of Image Processing based Real-time Flood Monitoring. In Proceedings of the 2018 IEEE 5th International Conference on Smart Instrumentation, Measurement and Application (ICSIMA), Songkla, Thailand, 28–30 November 2018; IEEE: Piscataway, NJ, USA, 2018; pp. 1–4. [Google Scholar] [CrossRef]
  26. Lo, S.-W.; Wu, J.-H.; Lin, F.-P.; Hsu, C.-H. Cyber surveillance for flood disasters. Sensors 2015, 15, 2369–2387. [Google Scholar] [CrossRef] [PubMed] [Green Version]
  27. Langhammer, J.; Vacková, T. Detection and mapping of the geomorphic effects of flooding using UAV photogrammetry. Pure Appl. Geophys. 2018, 175, 3223–3245. [Google Scholar] [CrossRef]
  28. Jafari, N.H.; Li, X.; Chen, Q.; Le, C.-Y.; Betzer, L.P.; Liang, Y. Real-time water level monitoring using live cameras and computer vision techniques. Comput. Geosci. 2020, 147, 104642. [Google Scholar] [CrossRef]
  29. Oga, T.; Harakawa, R.; Minewaki, S.; Umeki, Y.; Matsuda, Y.; Iwahashi, M. River state classification combining patch-based processing and CNN. PLoS ONE 2020, 15, e0243073. [Google Scholar] [CrossRef]
  30. Akiyama, T.S.; Marcato Junior, J.; Gonçalves, W.N.; Bressan, P.O.; Eltner, A.; Binder, F.; Singer, T. Deep learning applied to water segmentation. Int. Arch. Photogramm. Remote Sens. Spat. Inf. Sci. ISPRS Arch. 2020, 43, 1189–1193. [Google Scholar] [CrossRef]
  31. Casado, M.R.; Gonzalez, R.B.; Kriechbaumer, T.; Veal, A. Automated identification of river hydromorphological features using UAV high resolution aerial imagery. Sensors 2015, 15, 27969–27989. [Google Scholar] [CrossRef] [PubMed] [Green Version]
  32. Cuevas, J.; Chua, A.; Sybingco, E.; Bakar, E.A. Identification of river hydromorphological features using histograms of oriented gradients cascaded to the Viola-Jones algorithm. Int. J. Mech. Eng. Robot. Res. 2019, 8, 289–292. [Google Scholar] [CrossRef]
  33. Elad, M. On the origin of the bilateral filter and ways to improve it. IEEE Trans. Image Process. 2002, 11, 1141–1151. [Google Scholar] [CrossRef] [PubMed] [Green Version]
  34. Paris, S.; Durand, F. A fast approximation of the bilateral filter using a signal processing approach. Int. J. Comput. Vis. 2009, 81, 24–52. [Google Scholar] [CrossRef] [Green Version]
  35. Zhang, B.; Allebach, J.P. Adaptive bilateral filter for sharpness enhancement and noise removal. Proc. Int. Conf. Image Process. ICIP 2007, 4, 664–678. [Google Scholar] [CrossRef]
  36. Chen, B.-H.; Tseng, Y.-S.; Yin, J.-L. Gaussian-Adaptive Bilateral Filter. IEEE Signal. Process. Lett. 2020, 27, 1670–1674. [Google Scholar] [CrossRef]
  37. Akhtar, M.N.; Ahmed, W.; Kakar, M.R.; Bakar, E.A.; Othman, A.R.; Bueno, M. Implementation of Parallel K-Means Algorithm to Estimate Adhesion Failure in Warm Mix Asphalt. Adv. Civ. Eng. 2020, 2020, 8848945. [Google Scholar] [CrossRef]
  38. Danish, M.; Akhtar, M.N.; Hashim, R.; Saleh, J.M.; Bakar, E.A. Analysis using image segmentation for the elemental composition of activated carbon. MethodsX 2020, 7, 1–9. [Google Scholar] [CrossRef] [PubMed]
  39. Syakur, M.A.; Khotimah, B.K.; Rochman, E.M.S.; Satoto, B.D. Integration K-Means Clustering Method and Elbow Method for Identification of The Best Customer Profile Cluster. IOP Conf. Ser. Mater. Sci. Eng. 2018, 336, 12017. [Google Scholar] [CrossRef] [Green Version]
  40. Ansari, E.; Akhtar, M.N.; Bakar, E.A.; Uchiyama, N.; Kamaruddin, N.M.; Umar, S.N.H. Investigation of Geomorphological Features of Kerian River Using Satellite Images BT—Intelligent Manufacturing and Mechatronics; Bahari, M.S., Harun, A., Zainal Abidin, Z., Hamidon, R., Eds.; Springer: Singapore, 2021; pp. 91–101. [Google Scholar]
  41. Pierce, K.B. Accuracy optimization for high resolution object-based change detection: An example mapping regional urbanization with 1-m aerial imagery. Remote Sens. 2015, 7, 12654–12679. [Google Scholar] [CrossRef] [Green Version]
  42. Kršák, B.; Blišťan, P.; Pauliková, A.; Puškárová, P.; Kovanič, L.; Palková, J.; Zelizňaková, V. Use of low-cost UAV photogrammetry to analyze the accuracy of a digital elevation model in a case study. Meas. J. Int. Meas. Confed. 2016, 91, 276–287. [Google Scholar] [CrossRef]
  43. Mirijovskỳ, J.; Langhammer, J. Multitemporal monitoring of the morphodynamics of a mid-mountain stream using UAS photogrammetry. Remote Sens. 2015, 7, 8586–8609. [Google Scholar] [CrossRef] [Green Version]
  44. Niethammer, U.; James, M.R.; Rothmund, S.; Travelletti, J.; Joswig, M. UAV-based remote sensing of the Super-Sauze landslide: Evaluation and results. Eng. Geol. 2012, 128, 2–11. [Google Scholar] [CrossRef]
  45. Turner, D.; Lucieer, A.; de Jong, S.M. Time series analysis of landslide dynamics using an Unmanned Aerial Vehicle (UAV). Remote Sens. 2015, 7, 1736–1757. [Google Scholar] [CrossRef] [Green Version]
  46. Rusnák, M.; Sládek, J.; Buša, J.; Greif, V. Suitability of Digital Elevation Models Generated By Uav Photogrammetry for Slope Stability Assessment (Case Study of Landslide in Svätý Anton, Slovakia). Acta Sci. Pol. Form. Circumiectus 2016, 15, 439–449. [Google Scholar] [CrossRef]
  47. Sankey, T.; Donager, J.; McVay, J.; Sankey, J.B. UAV lidar and hyperspectral fusion for forest monitoring in the southwestern USA. Remote Sens. Environ. 2017, 195, 30–43. [Google Scholar] [CrossRef]
  48. Ansari, E.; Akhtar, M.N.; Abdullah, M.N.; Bakar, E.A. Design, assembly and use of a simple, economical water sampler for suspended sediment collection. J. Phys. Conf. Ser. 2021, 1921, 12096. [Google Scholar] [CrossRef]
  49. Ansari, E.; Akhtar, M.N.; Bakar, E.A.; Hawary, A.F.; Alhady, S.S.N. Investigation of Suspended Sediment Samplers: A Review. J. Phys. Conf. Ser. 2021, 1874, 12018. [Google Scholar] [CrossRef]
Figure 1. Localization of Kerian River and its tributaries in Malaysia.
Sustainability 13 09568 g001
Figure 2. Flow chart of k-means clustering algorithm steps.
Sustainability 13 09568 g002
Figure 3. The Orthophoto of the Kerian River Basin and meandering structure on (a) 31 July 2019, and (b) 6 November 2019.
Sustainability 13 09568 g003aSustainability 13 09568 g003b
Figure 4. Pre-clustered color inspection model of Figure 3.
Sustainability 13 09568 g004
Figure 5. The outputs portray the implementation of bilateral filter and k-means clustering algorithm.
Sustainability 13 09568 g005
Figure 6. HSV color inspector for component limit evaluation of Figure 5 post application of k-means algorithm representing water area, vegetation and other features in (a) S1 and (b) S2.
Sustainability 13 09568 g006
Figure 7. Thresholded Images representing the ROI and variation in Water Flow Area on (a) 31 July 2019 (b) 6 November 2019 and Vegetation cover on (c) 31 July 2019 (d) 6 November 2019 in white pixels along the river basin.
Sustainability 13 09568 g007
Table 1. Characteristics of the DJI Mavic Pro camera.
CharacteristicsDJI Mavic Pro Camera
Sensor Type1/2.3″ CMOS Sensor
Million Effective Pixels12.34
Image Size4000 × 3000
Lens35 mm
ISO range100–1600
Table 2. HSV limits of flow region and vegetation for Figure 6a,b.
Site Feature Minimum Limits Maximum Limits
H ( ° ) S (%) V (%) H ( ° ) S (%) V (%)
S1Flow Area3424100383194
Vegetation641040836289
S2Flow Area252695284997
Vegetation35621785285
Table 3. Image segmentation results.
SiteFeatureWhite Pixels% (ROI)Area (m2)
S1Flow Area39.4414437.1
Vegetation19.5132195.2
S2Flow Area39.5314447.2
Vegetation25.3142847.8
Table 4. Quantitative evaluation results.
SiteFeatureDSCJaccard Index
S1Flow Area97.8694.36
Vegetation94.9192.20
S2Flow Area96.2293.58
Vegetation92.5191.39
Publisher’s Note: MDPI stays neutral with regard to jurisdictional claims in published maps and institutional affiliations.

