Article

Have Academics’ Citation Patterns Changed in Response to the Rise of World University Rankings? A Test Using First-Citation Speeds

1
Department of Education, Sejong University, Seoul 050060, Korea
2
International Centre for Higher Education Research (INCHER), University of Kassel, D-34109 Kassel, Germany
3
Research Institute for Higher Education (RIHE), Hiroshima University, Higashi-Hiroshima 739-8512, Japan
*
Author to whom correspondence should be addressed.
Sustainability 2021, 13(17), 9515; https://doi.org/10.3390/su13179515
Submission received: 1 August 2021 / Revised: 13 August 2021 / Accepted: 20 August 2021 / Published: 24 August 2021

Abstract

:
Academics may actively respond to the expectations of the academic status market, which have largely been shaped by the World University Rankings (WURs). This study empirically examines how academics’ citation patterns have changed in response to the rise of an “evaluation environment” in academia. We regard the WURs to be a macro-level trigger for cementing a bibliometric-based evaluation environment in academia. Our analyses of citation patterns in papers published in two higher education journals explicitly considered three distinct periods: the pre-WURs (1990–2003), the period of WURs implementation (2004–2010), and the period of adaption to WURs (2011–2017). We applied the nonparametric Kaplan–Meier method to compare first-citation speeds of papers published across the three periods. We found that not only has first-citation speed become faster, but first-citation probability has also increased following the emergence of the WURs. Applying Cox proportional hazard models to first-citation probabilities, we identified journal impact factors and third-party funding as factors influencing first-citation probability, while other author- and paper-related factors showed limited effects. We also found that the general effects of different factors on first-citation speeds have changed with the emergence of the WURs. The findings expand our understanding of the citation patterns of academics in the rise of WURs and provide practical grounds for research policy as well as higher education policy.

1. Introduction

Governmental policies and market forces are influencing the sustainable development of the academic institutions and the behaviors of academics. The world university rankings (WURs), which have been especially influential in this regard, are based on bibliometric indicators that measure the quality of a university’s academic research, such as the number of publications and citations that correspond to its research outputs. Government policymakers and university leaders have been paying attention to the quantitative metrics provided by WURs [1]. However, improved performance in the WURs does not necessarily translate into improvement in the quality of a university and its academic research. Many scholars have pointed out that the results of ranking evaluations do not provide sufficient information to assess actual academic development [2,3,4]. Furthermore, the adequacy of key bibliometric indicators for measuring academic research quality has been deemed controversial [5,6,7,8].
Nonetheless, universities and academics have largely accepted and conformed to the pressures generated by university rankings [9,10,11]. Many studies have shown that academics are perceptive and responsive to the resource requirements (e.g., funding and reputation) set out by states, research funding agencies, and the academic community [12,13,14,15,16,17,18]. For example, as academics are urged to select research topics that can be easily published in journals to meet universities’ conditions for academic appointments and promotions [19], the number of publications has increased rapidly. The citation impact of research papers especially contributes to the WURs evaluation, which considers the total number of citations, the number of highly cited papers, the number of citations per paper, and the number of citations per faculty. Such emphasis on citation impact in the WURs has led universities and academics to pay more attention to citation numbers [20].
There have been many studies on the impact of WUR on higher educational institutions, but little is known about the citation behavior of academics in response to the rise of the evaluation environment under WURs [11,21,22,23]. To investigate the “trickle-down” effects [9] and impact of WURs on academics, this empirical study examines how academics’ citation patterns have changed in response to the rise of an evaluation environment focusing on first-citation speed and probability. We conducted a focused case study on two higher education journals, Minerva and Studies in Higher Education (SHE). We selected these because we assumed that academics in the field of higher education would be more aware of the impact of WURs than those in other research areas. The sample of papers from Minerva and SHE captures different editorial strategies with regard to developments in publication over the past three decades. This allowed us to methodologically control for research field-, author-, and paper-related factors that potentially influence first-citation probability.
We consider the WURs to be a macro-level trigger shaping the academic bibliometric evaluation environment, and the first citation of an academic paper to be a micro-level trigger for further citations. The first citation indicates that a paper’s status has shifted from “unused” to “used” [24]. Obtaining a visible first citation soon after publication is important because cited papers are more likely to receive subsequent citations. We thus examined how academics’ citation patterns might have changed since the establishment of WURs in terms of first-citation speed and probability. The research questions are as follows:
(1)
Have academics’ citation patterns changed since the establishment of world university rankings? In particular, has first-citation speed increased since the establishment of world university rankings?
(2)
What are the factors influencing first-citation probability? How have these factors changed with the emergence of world university rankings?

2. Literature Review

2.1. World University Rankings and Indicators

The Academic Ranking of World Universities (ARWU), established in 2003, expanded national rankings in higher education and the sciences to the global level [11,25]. A variety of WURs, such as the Times Higher Education World University Rankings (THE), QS World University Rankings (QS), and U-Multirank, have subsequently been introduced. These WURs are based on a “relative evaluation” method, which weights objective indicators and peer reviews to produce total scores and determines universities’ relative ranks [4,26].
WURs use indicators to estimate the status and reputations of both universities and academics [27]. Metrics and the league tables that use such indicators to assign ranks are catchall depictions that provide summary information about the millions of academics and the creation of research-based knowledge across thousands of universities worldwide. The ARWU indicators related to publication and citation include the number of highly cited researchers (20%), the number of papers published in two natural science journals (Nature and Science) (20%), and the number of papers indexed in the Sciences Citation Index-Expanded and the Social Science Citation Index (20%). As shown in Table 1, THE and QS include citations per faculty member (20% to 30%). Therefore, WURs generally incorporate two indicators of research recognition: publications in indexed and high-impact journals, and citations (i.e., numbers of citations and highly cited researchers).
The demands from WURs for the calculation of various indices and the compilation of data have had extensive effects on higher education [27,28,29,30]. WURs expose universities and academics to competition at the global scale, influencing the publication and citation behaviors of academics in this competitive academic market. However, aside from general assumptions about the impacts of WURs on higher education institutions, little is known about academics’ behaviors in response to the rise of WURs [11,21,22,23]. To address this research gap, we focus on the micro-level “reactivity” [10] of academics by studying academics’ citation behaviors. That is, aside from the various reasons for citing the research of others [31], a citation by an academic can be interpreted as an explicit social act [32], which can be assumed to be subject to environmental changes and organizational and professional pressures [18,20]. Considering Goldratt’s [33] insights into measurement-driven behavior (“tell me how you will measure me, and I will tell you how I behave”), we test how citations and, specifically, first-citation speeds have changed amid the rise of WURs. Accordingly, we propose:
Hypothesis 1 (H1).
First-citation speed has increased since the establishment of WURs.

2.2. First Citation and Its Factors of Influence

The number of citations is an important bibliometric indicator that has been widely used to evaluate research impact, assess research grants, and rank universities [34,35]. The impact of scientific papers can be dependent on their citation speeds as well as citation counts [36,37]. Highly cited research works tend to be cited more frequently and more quickly than others. Bornmann and Daniel [36] found that manuscripts accepted in a prestigious journal were more likely to receive first citations after publication more quickly than those that were rejected by the same journal and published elsewhere.
The time to first citation is a critical indicator of how quickly the state of a published paper changes from “unused” to “used” [38]. Van Dalen and Henkens [37] pointed out that because a lack of citations on a given paper may signal to readers that the paper is of low quality, the probability of receiving a first citation tends to decrease over time. With the exception of “sleeping beauties,” which are generally rare [39], a paper’s early visibility is associated with higher impact in the academic community [24].
Citation counts and speeds have been found to be affected by multiple factors, such as time since publication, academic field, journal, article, and author [36,40]. Glänzel and Schoepflin [41] found that citations for papers published in the social sciences and mathematics journals accumulated more slowly and for longer than those published in medical and chemistry journals. Glänzel et al. [42] investigated the time to first citation for papers published in cellular biology journals and found that papers published in Cell were significantly faster to receive citations than those published in other journals. The “Matthew effect” has also been observed in citation counts and speeds, where publications of authors who have been highly cited in the past are more likely to receive their first citations faster than publications by other authors [36]. A researcher’s experience (or lack thereof) in publishing five or more articles in prestigious journals has also been shown to affect the time to first citation of their papers [43,44].
Research funding is a crucial resource for scientific research [45], and interest in how research funding influences the academic community is increasing [46,47]. Cantwell and Taylor [48] showed that university rank in WURs increase with increasing amounts of third-party funding (TPF). Zhao and colleagues [45] found that research funding influenced a paper’s citations, where papers reporting funded research received more citations. Accordingly, publications reporting research funded by third-party grants can be assumed to be of good status, as is the case for publications in high-impact journals. In addition, the probability of citations may depend on the number of authors [42,49], the extent of international collaboration between authors [50], the number of pages in a manuscript [51], and the number of references in a manuscript [52].
Based on these factors that have shown to influence citation counts and speed, we propose seven additional hypotheses, as follows.
Hypothesis 2 (H2).
Publications written by a corresponding author from a prestigious university are positively correlated with first-citation probability.
Hypothesis 3 (H3).
Publishing in high-impact journals is positively correlated with first-citation probability.
Hypothesis 4 (H4).
Publications resulting from third-party funded research are positively correlated with first-citation probability.
Hypothesis 5a (H5a).
Publications with higher numbers of authors are positively related to first-citation probability.
Hypothesis 5b (H5b).
Publications with international collaborations are positively related to first-citation probability.
Hypothesis 6a (H6a).
Publications with higher numbers of references are positively related to first-citation probability.
Hypothesis 6b (H6b).
Publications of longer length are positively related to first-citation probability.

3. Methodology

3.1. Sample

Inspired by Hedström and Ylikoski [53], our research question (Has first-citation speed increased since the establishment of WURs?) investigates academics’ responses to the rise of WURs over time. To test the different hypotheses, we differentiated time according to pre- and post-event periods. Rogers’ “diffusion of innovation” theory [54] holds that the establishment of an innovation is followed by a phase of social and technological implementation and adaptation. In our case, the “innovation” can be taken to be the establishment of the ARWU in the year 2003; hence, this provides a pre-WURs or antecedent period (1990–2003). The post-WURs periods are divided into two periods, implementation period (2004–2010) and adaptation period (2011–2017). The implementation phase is characterized by the establishment of additional WURs, with the introduction of THE-QS WURs and this provides an implementation period (2004–2010). The adaptation period (2011–2017) is characterized by THE and QS WURs starting separately in 2010 and one latecomer (U-Multirank in 2014).
Bourgeois [55] and Merton [56] have advocated for the use of a small case study design in studies of social phenomena (e.g., the emergence of WURs), as this lowers the risk of “getting lost in the data.” Accordingly, to test the hypotheses, we used a non-random sample [57] of articles from two journals: Minerva and SHE. In using similar cases [58], we are able to control article length, as the maximum article length (including references, tables, etc.,) for articles in Minerva is 10,000 words, while that for articles in SHE is 7000 words. Controlling for article length is especially important for testing H6b. Furthermore, as a limit on article length may also influence the number of references per article (H6a), we can also control for an increase in the number of cited references per paper in recent decades [59].
Minerva and SHE have differing editorial policies on long-term journal development. SHE is one of many journals publishing more issues and articles per year [60]. SHE published two issues per year between 1976 and 1986, three issues per year between 1987 to 2001, four issues per year in 2002 and 2003, six issues per year between 2004 and 2008, and ten issues with two additional special issues per year since. Coincidentally, the increase in issues and articles per year in SHE correlates with the establishment of WURs and is stable across the WURs adaptation period (2011–2017). In contrast, Minerva increased the number of issues it published per year well before the period of interest (from two issues per year from 1962–1969 to four issues per year since 1970). The number of papers published in Minerva has risen only moderately in the adaptation period. Accordingly, the purposeful sampling allows for control of the citation probability for citation time-window [34].
Both Minerva and SHE are general journals that cover wide ranges of topics, and neither of them stipulates a preferred methodology. We thus expect the two journals to show low levels of agreement on research priorities [61]. As both journals have an interdisciplinary focus, and are dominated by the papers from the social sciences [62,63,64], they share similar publication and citation behaviors [65]; thus, normalization for field differences is not required [66]. Of relevance to H3, the Journal Impact Factor (JIF) of both journals has increased considerably in recent decades, and as shown in Figure 1, this increase has been volatile but linear since 2014.

3.2. Data

We selected 1990 as the starting point for the study, as this year marked the beginning of a steady increase in citations in both Minerva and SHE. We used data on citations from the Web of Science, as it applies the most restrictive citation count [67]. The dataset downloaded from the Web of Science for SHE comprised 1346 articles published from 1990 (volume 15, issue 1) to 2017 (volume 42, issue 12). The dataset for Minerva comprised 443 articles; although a total of 474 articles were published from 1990 (volume 28, issue 1) to 2017 (volume 55, Issue 4), 31 of these were removed from the dataset because they are reports or discussions. We collected the following bibliometric data for each paper: authors’ names and addresses, corresponding authors’ names and addresses, length of paper, number of cited references, funding sources, total number of citations, and number of citations per year.

3.3. Analytical Methods

The empirical analysis was separated into three parts. First, we analyzed how citation patterns might have changed since the establishment of WURs. Here, we conducted a descriptive analysis of the general patterns of citations in the two journals for each of the three time periods of WURs between 1990 and 2017: antecedent period, implementation period, and adaptation period.
Second, we used a survival analysis to measure the effect of first-citation speed as a micro-level trigger on academic citations [36,43,68]. We used the nonparametric Kaplan–Meier method to stratify the data on first-citation speeds according to the three time periods within the 28-year citation window. The Kaplan–Meier method is widely used and includes a cumulative survival function that is relatively easy to understand.
Third, we analyzed the factors influencing first-citation probability and examined whether there were differences in covariates between the two journals and between the three time periods. We used Cox proportional hazard modeling to test the effects of covariates on first citation. The Cox proportional hazard model, based on a logistic regression and the survival analysis model, can be used to examine how covariates influence the hazard rates of papers being cited [36,69]. According to Cleves et al. [70], the hazard function is the probability that a paper experiences the event of first citation during a short time interval, given that the paper is uncited up to the beginning of that interval. The formula of the hazard function is
h t = lim Δ t 0 Pr [ t T < t + Δ t | T t ] Δ t = f t S t  
The cumulative hazard function h(t) is the sum of the paper hazard rates from time zero to time t. The formula of the cumulative hazard function is
h i t = h 0 t exp β x i = h 0 t exp β 1 x i 1 + β 2 x i 2 + + β p x i p
We used two Cox proportional hazard models. The first was applied to analyze covariate differences in first citations between journals. The second was used to examine covariate differences in first citations between the three different time periods corresponding to developments in WURs. Factors that could influence first citations (i.e., WURs period, academic reputation, JIF, TPF, and author- and paper-related factors) were analyzed in each model. The proportionality of hazard assumption, a key assumption for Cox proportional hazard models, was tested and met in each model. STATA 16 tools were used to conduct these statistical analyses.

3.4. Variables and Measures

To analyze first-citation speeds in the three periods within the 28-year citation window and examine the factors influencing citation patterns, we put together the analytical variables as follows. For the survival analysis, we required new variables representing survival time, censored data, and event data. In this study, survival time was defined as first-citation speed, which was measured in terms of the time that elapsed from the year of publication to the year of the first citation. Censored data means no citation, and event data means citation within the 28-year citation window.
The factors we considered included WURs period, author reputation, JIF, funding, author-related factors, and paper-related factors (Table 2). We divided the publications into three groups based on WURs period (i.e., antecedent period, implementation period, and adaptation period), using the publications during antecedent period as a criterion variable to construct the dummy variables. Academic reputation (H2) was measured as a proxy variable; it was determined by whether the corresponding author’s affiliated university was ranked among the top 100 universities in the ARWU rankings (coded as 1) or not (coded as 0). As the ARWU ranking might have changed over time, we checked the rankings in 2003, 2010, and 2017, and investigated universities ranked among the top 100 universities in the 2017 ARWU rankings that had also appeared more than once among the top 500 universities in the 2003, 2010, and 2017 ARWU rankings. JIF (H3) was entered as a dummy variable by coding SHE as 1 and Minerva as 0. TPF (H4) was entered as a dummy variable coded as 1 when information about a TPF source was identified in a paper. Due to the small number of articles that acknowledged TPF, specific TPF sources could not be differentiated (e.g., between funding from national research foundations and that from business and industry sources). The author-related factors were the number of authors (H5a) and the extent of international collaboration (H5b). International collaboration was measured as a dummy variable coded as 1 when a paper’s authorship involved an international collaboration; this was determined based on the authors’ affiliated institution addresses. Paper-related factors consisted of the number of references (H6a) and the paper’s length (H6b). Table 3 presents the descriptive statistics of the study.

4. Results

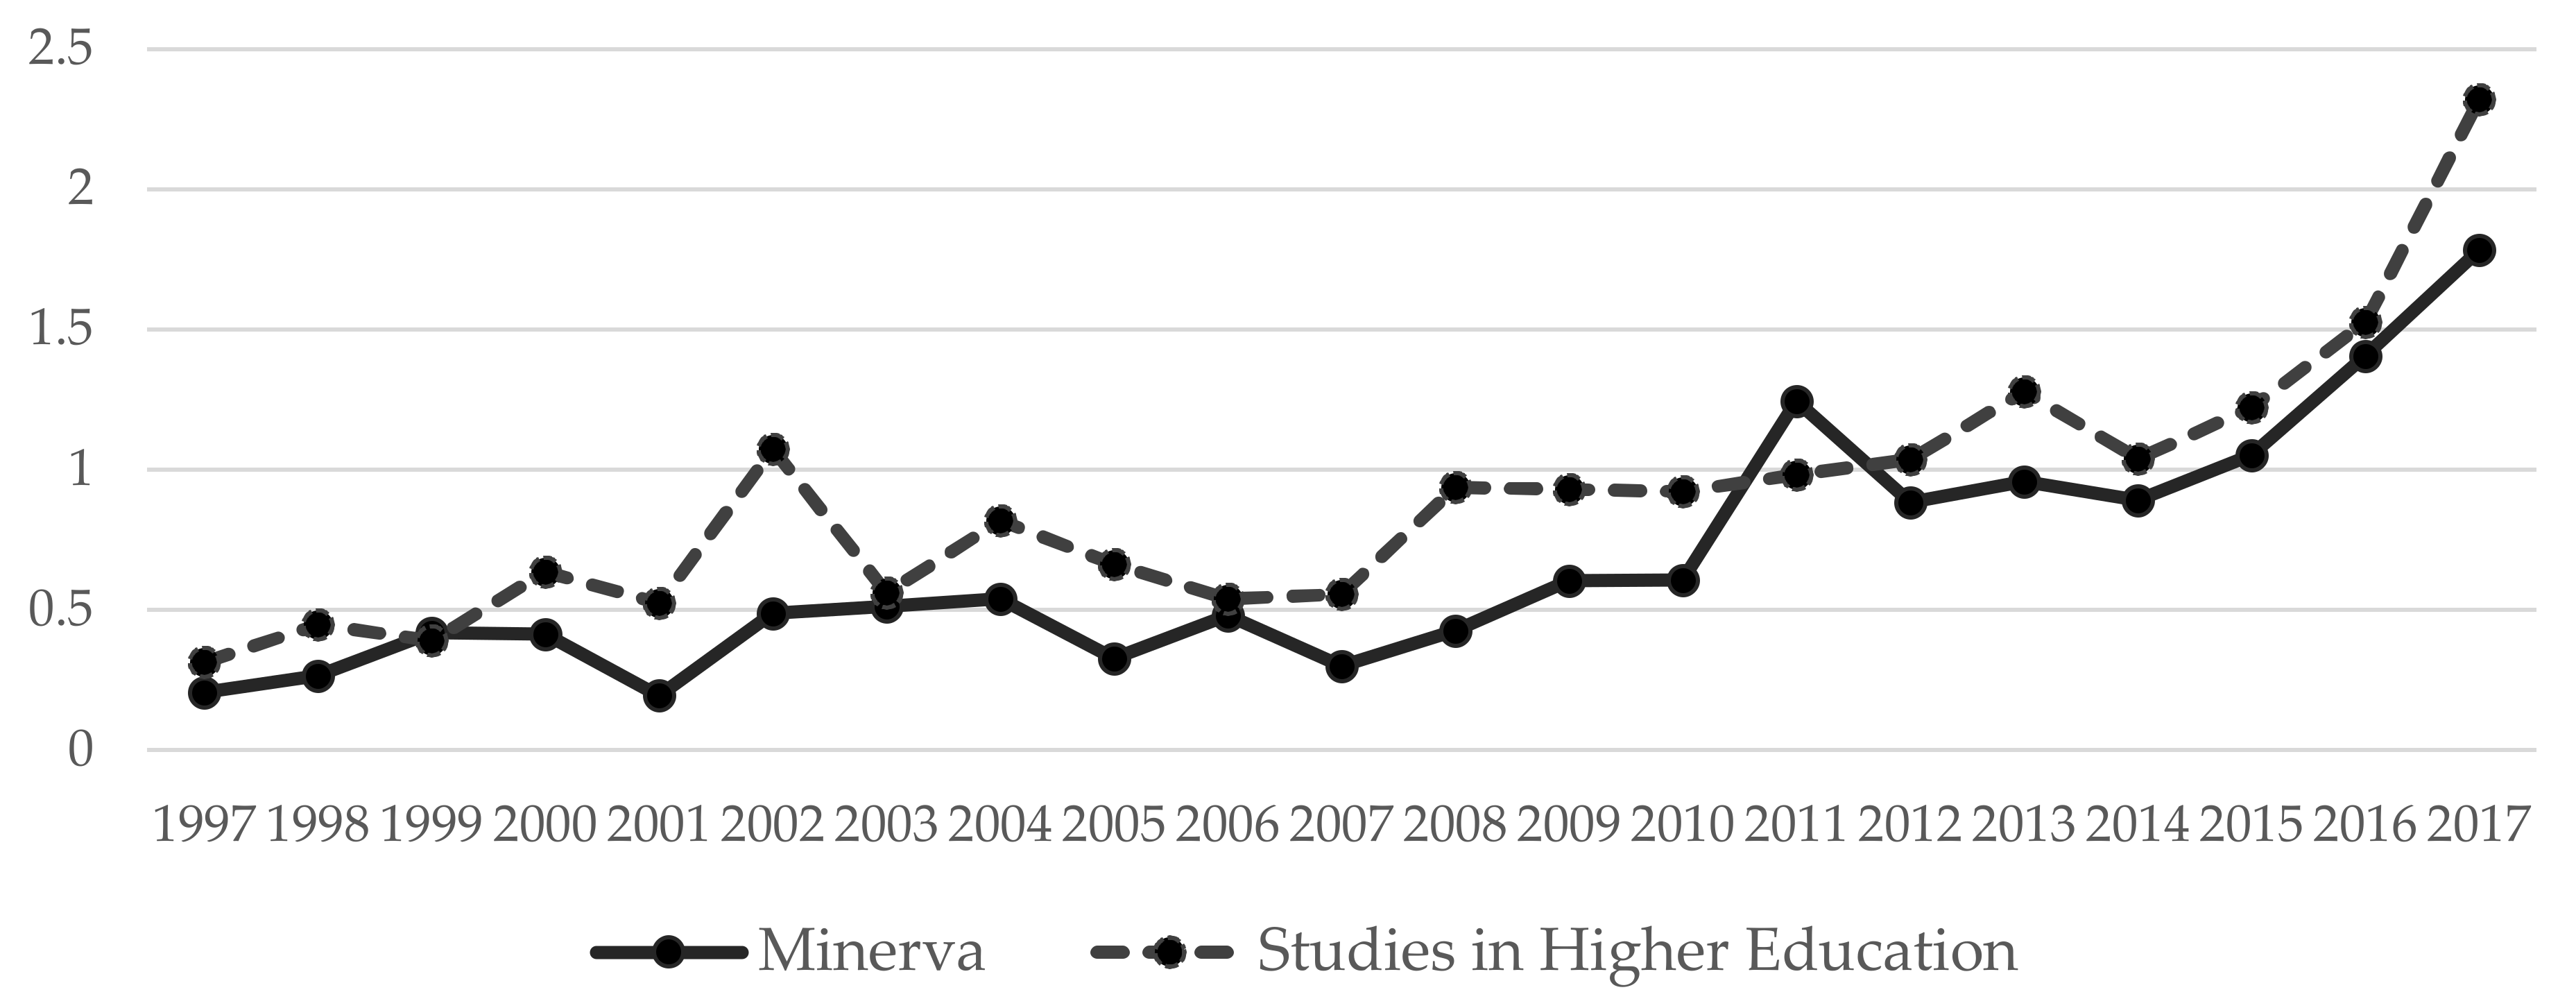
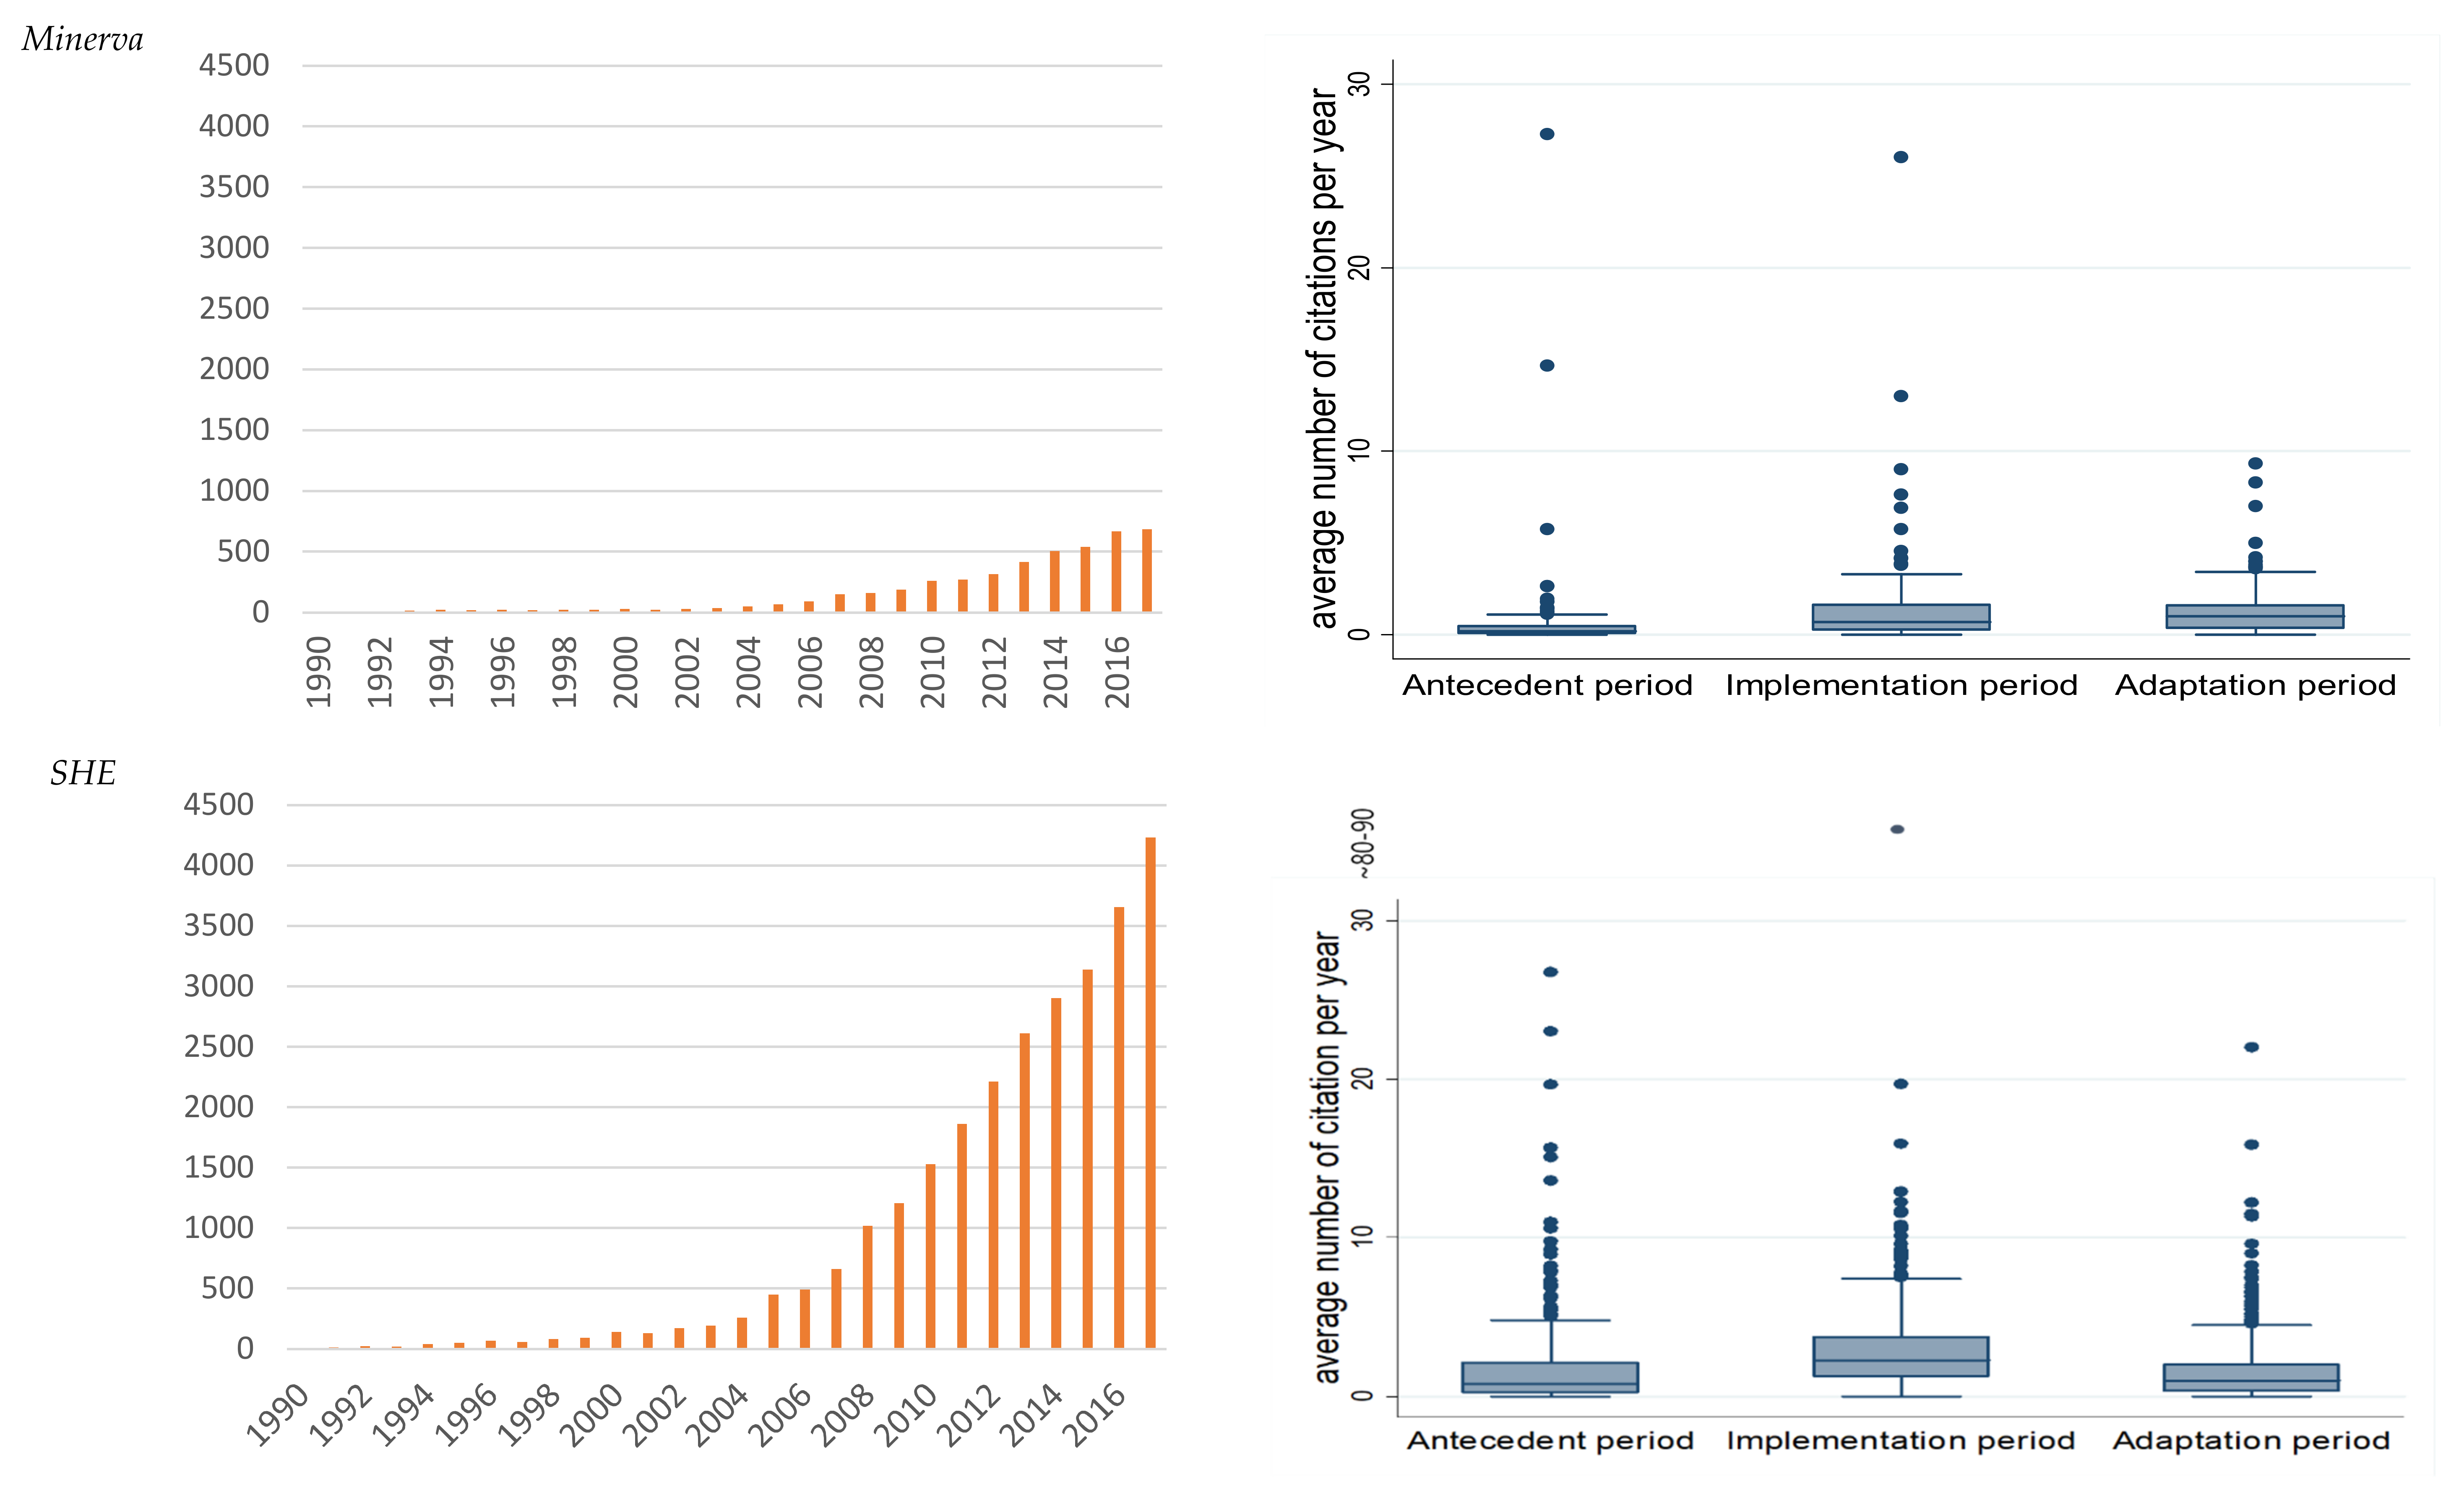
4.1. Changes in Citations over Time amid the Rise of WURs

Table 4 shows the general patterns of publication and citation in the three WURs periods. The average number of citations per year for papers published in Minerva during the WURs antecedent period was 0.59, that in the implementation period was 1.57, and that in the adaptation period was 1.27. The average number of citations per year for papers published in SHE during the WUR antecedent period was 1.88, that in the implementation period was 3.37, and that in the adaptation period was 1.55. Overall, the average number of citations of papers per year increased from the antecedent period (1990–2003) to the implementation period (2004–2010). This occurred in spite of the longer citation window that was available to papers published in the antecedent period (28 years) than to papers published in the implementation period (8–14 years). Furthermore, in the case of Minerva articles, average citations did not decrease substantially during the adaptation period (1–7 years for citation). In both journals, the percentage of authors from other countries also increased significantly over the past decade (Table 4). The number of authors per paper increased from 1.30 to 1.80 in Minerva and from 1.72 to 2.39 in SHE during the pre-WURs period and the adaptation period, respectively. We assumed that first-citation speed was not strongly affected by the increase in the number of publications and cited references over the years [71,72], as these could be sufficiently balanced by a steady increase in the number of researchers.
Figure 2 shows the general pattern of citations across the two journals between 1990 and 2017. The total number of citations across both journals increased dramatically after the introduction of WURs in 2003. The boxplots display the distribution of the average numbers of citations per year for each WURs period. The bar in the middle of the box is the median, and the upper and lower boundaries of the box indicate the third and first quartiles in the data distribution, respectively. The boxplots for both journals showed that papers published during the implementation period had a higher probability of citation than those published during the antecedent period. For example, the citation probability of papers published in Minerva during the WURs adaptation period (2011–2017) almost approximated the median number of citations received by papers published in the same journal during the WURs implementation period (2004–2010), while it is almost at the same level as the WURs antecedent period (pre-2004) for SHE.

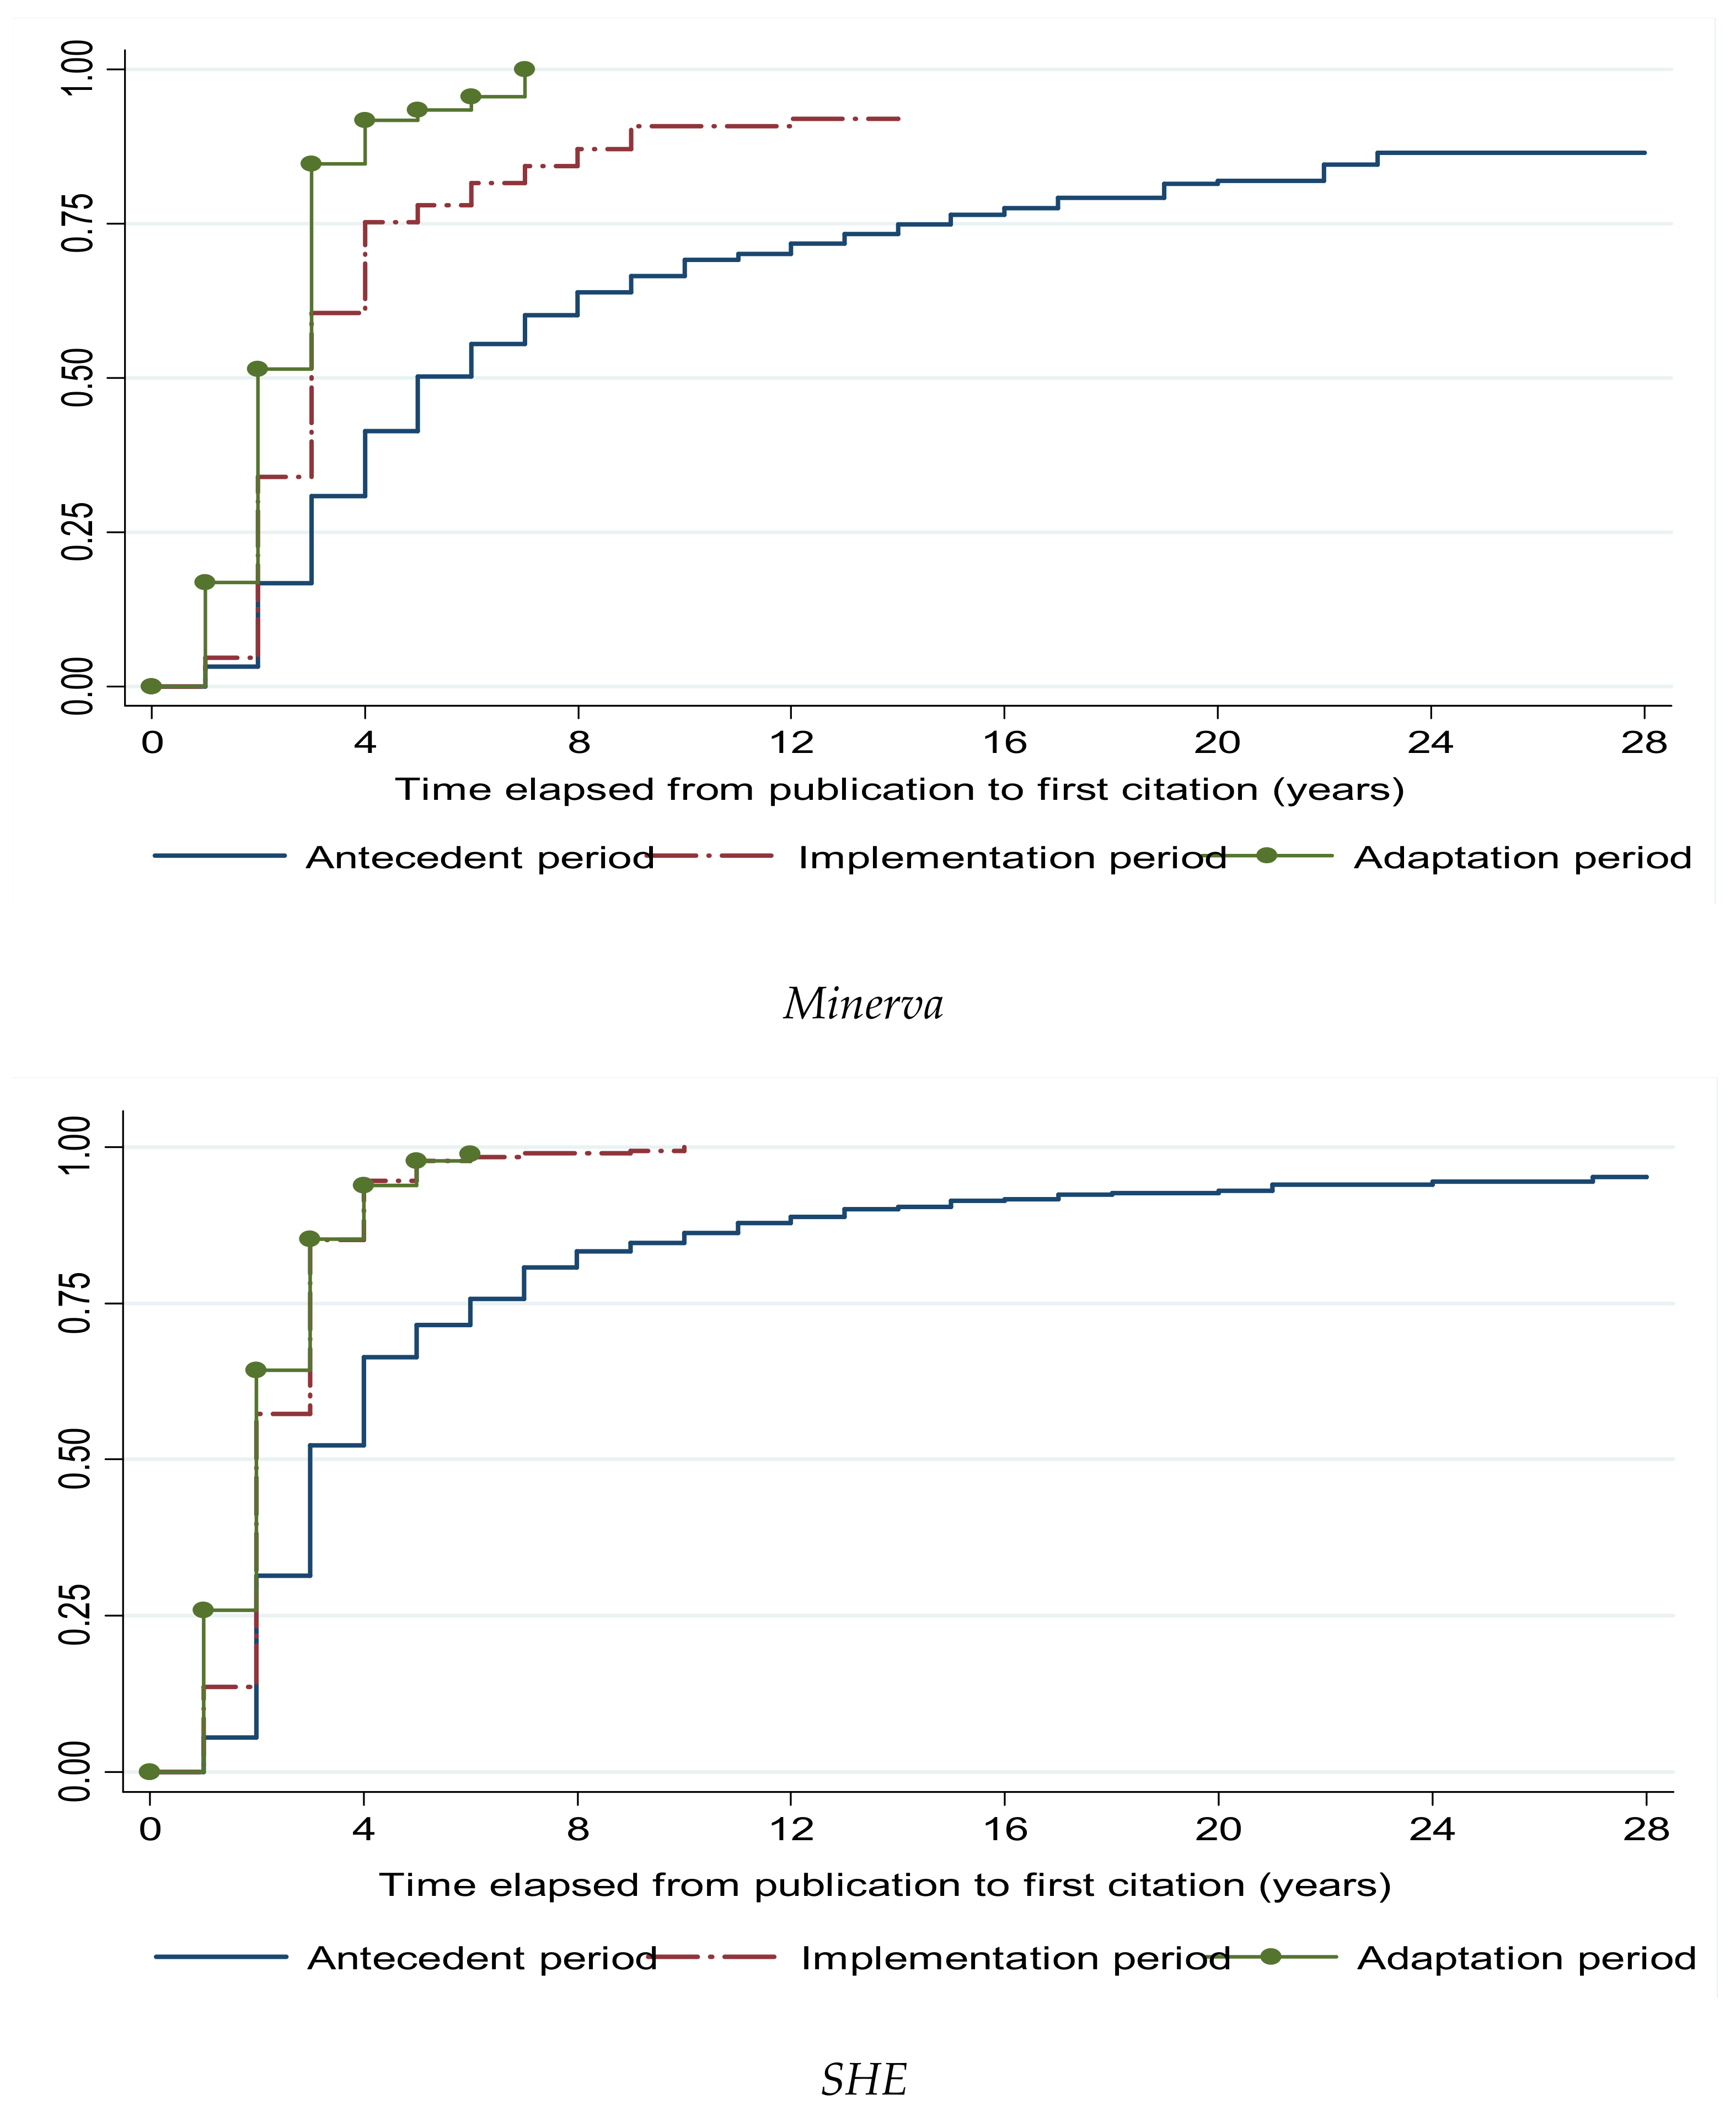
4.2. First-Citation Speed by Journal and WURs Period

Table 5 details the average first-citation status and first-citation speeds for articles published in the two journals across the three different WURs periods. We applied the Kaplan–Meier method to examine first-citation speeds in the three WURs periods. The results indicate a general increase in first-citation speeds over the three WURs periods, and therefore support H1. For articles published in SHE, the median first-citation speed increased from three years for articles published during the antecedent period to two years for articles published in each subsequent post-WURs period. For articles published in Minerva, first-citation speed increased from five years to three years and finally to two years over the three periods. Based on the log rank method (Mantel–Cox) and Breslow (generalized Wilcoxon), the differences in first-citation speed between the two journals and among the three WUR periods were found to be statistically significant (p < 0.001). These results showed that articles published in SHE had a faster first-citation speed than those published in Minerva. They also indicated that first-citation speeds changed more for articles published in Minerva than for those published in SHE over the three WURs periods.
The total number of uncited SHE papers was 162 (12%), while that for Minerva was 62 (14%). In terms of specific WURs periods, a total of 17 (5.5%), 1 (0.3%), and 144 (20.1%) paper(s) published in SHE during the antecedent period, implementation period, and adaptation period, respectively, were uncited. A similar pattern was observed for papers published in Minerva. The sharp increase in uncited papers published during the adaptation period could be attributed to the dramatic increase in the total number of papers published. Another potential reason was the relatively short citation window (1–7 years) compared to the other period. Notably, fewer papers published during the implementation period were uncited as compared to the antecedent period, even though the latter was associated with a lengthier citation window (implementation: 8–14 years; antecedent: 15–28 years).
Figure 3 shows the Kaplan–Meier failure estimates that measure the time elapsed from the year of publication to the year of the first citation for papers published in the three WURs periods. The estimates for Minerva indicated that, among papers published in the antecedent period, 50% and 75% would be cited after 5 years and 15 years, respectively. In comparison, the probability of receiving a first citation for papers published in the same journal during the implementation period reached 50% after three years and 75% after four years, while that for papers published in the adaptation period reached 50% after two years and 75% after three years. The estimates for SHE showed that the probability of receiving a first citation reached 50% after three years and 75% after six years for papers published during the antecedent period, while that for papers published during the implementation or adaptation periods reached 50% after two years and 75% after three years.

4.3. Factors Influencing First-Citation Probability

Table 6 and Table 7 show the results of the Cox regression analyses, which examined the influence of different factors on first-citation probability. In Table 6, which presents the results for each journal, Models 1 and 3 are the basic models (not using WURs periods), and Models 2 and 4 apply the implementation and adaptation periods. The antecedent period was used as a criterion variable to construct the dummy variables.
In Models 2 and 4, the number of references, TPF, and post-WUR periods significantly influenced the first-citation probabilities of papers published in both journals. The number of references cited by papers also showed significant effects; however, the hazard ratios (1.01 in Minerva and 1.00 in SHE) indicated that papers with more references would have only a slightly higher probability of receiving a first citation. Therefore, H6a was weakly supported for both journals. Papers in Minerva (Model 2) supported by TPF had 55% higher hazard of first citation than other papers, while those in SHE (Model 4) had 40% higher hazard. Accordingly, H4 was supported for both journals. For both journals, papers published during the WURs implementation and adaptation periods had higher first-citation probabilities than papers published during the antecedent period. In comparison with papers published in Minerva during the antecedent period, papers published in the same journal during the implementation period had a 78% higher hazard of first-citation probability, while those published during the adaptation period had a 2.72-times higher probability of receiving a first citation. In comparison with papers published in SHE during the antecedent period, papers published in the same journal during the implementation and adaptation periods had 88% and 96% higher hazards of receiving a first citation, respectively. In Models 3 and 4, the length of the paper was found to significantly influence first-citation probability only among papers published in SHE; therefore, H6b was partially supported (i.e., only for SHE). The first-citation probabilities of papers were not significantly affected by whether or not their corresponding authors were affiliated with top-100 ARUW universities; thus, H2 was not supported.
Table 7 presents the results of Cox regressions for the three WURs periods. In Model 5 (which focused on the antecedent period), the number of authors, references, and the JIF significantly affected papers’ first-citation probabilities. As a higher number of authors was positively associated with the probability of receiving a first citation for a paper only at the 0.1 significance level, H5a was weakly supported. In addition, although the number of references cited in a paper significantly affected its first-citation probability, the low hazard ratio (1.01) indicated that papers with higher numbers of references had only a marginally higher first-citation probability. Thus, H6a was again weakly supported. In Model 5, papers published in SHE were found to have a 76% higher hazard of first citation than those published in Minerva.
In Model 6 (which focused on the implementation period), only the JIF showed a significant effect on first-citation probability. Papers published in SHE had a 2.04-times higher hazard of first citation than those published in Minerva. In Model 7 (which focused on the adaptation period), papers published in SHE had a 38% higher hazard of first citation than those published in Minerva. Accordingly, H3 was supported in Models 5, 6, and 7.
Unlike in Model 5, the number of authors and the number of references in Model 7 did not significantly affect the first-citation probability. However, JIF and TPF showed significant effects on first-citation probability in this model. Papers supported by TPF had a 36% higher hazard of first citation than others; hence, H4 was supported in Model 7.

5. Discussion and Conclusions

This study examined how academics’ citation patterns have changed in response to the rise of an evaluation environment, focusing on trends in the first-citation speed and probability of academic papers. We considered WURs to be a macro-level trigger for cementing a bibliometric-based evaluation environment in academia and the first citation of a paper to be a micro-level trigger for further citations. We found an increase in first-citation speed in the period following establishment of the WURs, and thus accepted H1. The median first-citation speed of papers published in SHE has also quickened, from three years for papers published during the antecedent period of the WURs to only two years during post-WURs periods. For papers published in Minerva, first-citation speed went from five years to three years and subsequently to two years over the three time periods. The Kaplan–Meier failure function plots for Minerva and SHE further indicated that first-citation speeds have quickened with the emergence of WURs.
The WURs have expanded the academic evaluation market by differentiating the status and reputations of both universities and academics on the basis of bibliometric indicators such as the numbers of publications and citations. The WURs have exposed universities and academics to global competition and modified the publication and citation behaviors of academics [11,21,22,23,28]. As a result, academics have published more papers and cited other papers more quickly following the rise of WURs.
We investigated the factors influencing first-citation probability and examined how these factors have changed with the emergence of WURs. We found that papers published in high-impact journals had higher first-citation probabilities (H3 accepted). As Table 7 shows, a higher JIF influenced the probability of first citation. The trend toward higher first-citation probability during the implementation WURs period was particularly interesting. In SHE, the number of uncited papers dropped to almost zero in the implementation period (in comparison to the 5.5% of papers published during the antecedent period that went uncited, despite these papers experiencing a lengthy citation window of 28 years). Similarly, in Minerva, 8.3% of papers published during the implementation period were uncited, in comparison with the 14.7% from the antecedent period (Table 5). Considering their relatively short publication time windows [34,73] and the increasing JIFs of both journals, the proportions of uncited papers in SHE and Minerva were low in comparison with the average rate of 22% among other papers in the social sciences [74].
Whereas JIFs have existed for a long time, information on TPF in journals was only available in the Web of Science for the post-WURs periods. We found that the first-citation probabilities of papers with TPF information were higher only during the adaptation period (Table 7, Model 7). However, as shown in Table 6, TPF information significantly influenced the first-citation probability of papers in both Minerva and SHE. Papers resulting from TPF were positively related to first-citation probability, and thus, H4 was accepted.
However, papers written by a corresponding author from an ARWU top-100 university were not found to be significantly positively correlated with first-citation probability in both journals and during the three periods of WURs. Thus, H2 was rejected. Here, academic reputation was measured as a proxy variable by determining whether the corresponding author’s affiliated university was among the top 100 universities of the ARWU rankings. While relations between the reputations of academics’ and institutions were deemed acceptable in the context of the fuzzy attribution mechanisms of status [75,76], academic reputation does not seem to be directly consistent with university reputation in this study. Therefore, further research would be required to more accurately estimate academic reputation by factoring in highly cited researchers and various other indicators.
The author- and paper-related factors were found to have relatively limited effects on first-citation probability. First, having a larger number of authors on a paper was positively associated with the probability of receiving first citation. However, this was only observed for papers published in SHE during the antecedent period of WURs, at the p < 0.1 significance level. Thus, H5a was weakly accepted. The weak support for H5a could potentially be attributed to the general increase in the number of authors on a paper over the three periods of the development of WURs, as this would weaken the impact of the number of authors on first-citation probability. Second, papers with international collaborations were not significantly positively related to first-citation probability. Although H5b was not accepted, our findings indicated that the establishment of WURs was associated with an increase in international collaboration. We found that following the establishment of the first WURs in 2003, the lists of authors of papers published in both journals became more international. For example, the proportion of papers from international collaborations in Minerva increased from 2.16% (1990–2003) to 16.08% (2011–2017), while those in SHE increased from 3.53% to 14.62% in the same time periods (Table 4). As the number of authors from non-Anglo-Saxon countries has increased, we infer that authors across a greater number of countries want, have to, or are being forced to publish in high-impact journals. Third, we observed that increases in the average number of references for papers in both Minerva (from 35.50 to 48.74 references) and SHE (from 28.57 to 38.84 references) were associated with higher probabilities of first citation (weakly supporting H6a). A similar trend was observed for lengths of SHE articles (partially supporting H6b). These findings suggested that both shorter reading times and greater numbers of references (which increased each paper’s connections to other papers) were positively related to the probability of first citation.
As shown in this study, WURs influence the academics’ citation patterns as well as competitive behaviors of higher education institutions. We found that not only has first-citation speed become faster, but first-citation probability has also increased after the WURs appearance. We identified journal impact factors and third-party funding as factors influencing first-citation probability, and we also found that the general effects of influence factors on first citation probability have changed with the emergence of the WURs. We surmised that academics are likely to cite papers granted by journal impact factor and third-party funding agencies in the rise of the evaluation environment under WURs. These citation patterns of academics might strengthen the evaluation social mechanisms of academia and influence the sustainability of science. The findings broaden our understanding of the citation patterns of academics in the rise of WURs and provide practical grounds for research policy as well as higher education policy.
This study was not without limitations. First, the small case study used only considered two higher education journals, Minerva and SHE. Future studies could investigate the extent to which the observed findings are reflected in journals with similar scope (i.e., general areas) or high(er) JIFs, as well as the more specialized journals. Second, for articles in the Web of Science that were published before 2004, funding information was not systematically recorded and information on institutional affiliation was only available for corresponding authors. Third, the list of highly cited researchers could not be used as a substitute for authors’ reputations in this study because there were only three such cases in the data. Future studies could improve this by distinguishing between the effects of academics’ reputations from the effects of the reputation of their institutions. Fourth, the papers published in the adaptation period of WURs (2011–2017) had relatively short citation windows. Wang [34] suggested that a short citation window (e.g., a 5-year citation window) would be theoretically justified for identifying the direction of research and its contemporary impact. However, he pointed out that it seems necessary to focus a longer time citation windows, differentiating the top 10% and top 20% of the most-cited papers from the remaining majority [77]. Fifth, by using a mixed-methods design [78], such studies could further investigate the effects of article content (e.g., method used, theoretical contributions, and research topics) among highly or higher-cited authors and their influence on first-citation probability [79,80,81]. Finally, future theory-based research could contribute theoretical explanations for the social mechanisms driving the changing publication and citation behaviors among academics’ amid the establishment of the WURs that were documented in this study.

Author Contributions

Conceptualization, S.J.L. and C.S.; methodology, S.J.L.; validation, S.J.L., C.S., Y.K., and I.S.; writing—original draft preparation, S.J.L. and C.S.; writing—review and editing, S.J.L., C.S., Y.K., and I.S.; funding acquisition, S.J.L., C.S., and Y.K. All authors have read and agreed to the published version of the manuscript.

Funding

This research is supported by Research Institute for Higher Education (RIHE), Hiroshima University (Grant number S01001).

Institutional Review Board Statement

Not applicable.

Informed Consent Statement

Not applicable.

Data Availability Statement

Not applicable.

Acknowledgments

The authors would like to thank Inyoung Song for support with data cleaning in the early stage of the research.

Conflicts of Interest

The authors declare no conflict of interest.

References

  1. De la Poza, E.; Merello, P.; Barbera, A.; Celani, A. Universities’ Reporting on SDGs: Using THE Impact Rankings to Model and Measure Their Contribution to Sustainability. Sustainability 2021, 13, 2038. [Google Scholar] [CrossRef]
  2. Dill, D.D. Convergence and Diversity: The Role and Influence of University Rankings. In University Rankings, Diversity, and the New Landscape of Higher Education; Kehm, B., Stensaker, B., Eds.; Sense Publishers: Rotterdam, The Netherlands, 2009; pp. 97–116. [Google Scholar]
  3. Marginson, S. Global university rankings: Some potentials. In University Rankings, Diversity, and The New Landscape of Higher Education; Kehm, B., Stensaker, B., Eds.; Sense Publishers: Rotterdam, The Netherlands, 2009; pp. 85–96. [Google Scholar]
  4. Usher, A.; Medow, J. Global survey of university ranking and league tables. In University Rankings, Diversity, and the New Landscape of Higher Education; Kehm, B., Stensaker, B., Eds.; Sense Publishers: Rotterdam, The Netherlands, 2009; pp. 3–18. [Google Scholar]
  5. Dill, D.D.; Soo, M. Academic quality, league tables, and public policy: A cross-national analysis of university ranking systems. High. Educ. 2005, 49, 495–533. [Google Scholar] [CrossRef]
  6. Federkeil, G. Reputation Indicators in Rankings of Higher Education Institutions. In University Rankings, Diversity, and The New Landscape of Higher Education; Kehm, B., Stensaker, B., Eds.; Sense Publishers: Rotterdam, The Netherlands, 2009; pp. 19–34. [Google Scholar]
  7. Usher, A.; Savino, M. A World of Difference: A Global Survey of University League Tables; Educational Policy Insitute: Toronto, ON, Canada, 2006. [Google Scholar]
  8. Kauppi, N. The global ranking game: Narrowing academic excellence through numerical objectification. Stud. High. Educ. 2018, 43, 1750–1762. [Google Scholar] [CrossRef] [Green Version]
  9. De Rijcke, S.; Wouters, P.F.; Rushforth, A.D.; Franssen, T.P.; Hammarfelt, B. Evaluation practices and effects of indicator use-a literature review. Res. Eval. 2016, 25, 161–169. [Google Scholar] [CrossRef]
  10. Espeland, W.N.; Sauder, M. Rankings and reactivity: How public measures recreate social worlds. Am. J. Sociol. 2007, 113, 1–40. [Google Scholar] [CrossRef] [Green Version]
  11. Hazelkorn, E. Rankings and the Reshaping of Higher Education: The Battle for World-Class Excellence; Palgrave: London, UK, 2015. [Google Scholar]
  12. Butler, L. Explaining Australia’s increased share of ISI publications—The effects of a funding formula based on publication counts. Res. Policy 2003, 32, 143–155. [Google Scholar] [CrossRef]
  13. Butler, L. Modifying publication practices in response to funding formulas. Res. Eval. 2003, 12, 39–46. [Google Scholar] [CrossRef]
  14. Glaser, J.; Laudel, G. Advantages and dangers of ‘remote’ peer evaluation. Res. Eval. 2005, 14, 186–198. [Google Scholar] [CrossRef]
  15. Laudel, G.; Glaser, J. Beyond breakthrough research: Epistemic properties of research and their consequences for research funding. Res. Policy 2014, 43, 1204–1216. [Google Scholar] [CrossRef]
  16. Musselin, C. How peer review empowers the academic profession and university managers: Changes in relationships between the state, universities and the professoriate. Res. Policy 2013, 42, 1165–1173. [Google Scholar] [CrossRef]
  17. Van Noorden, R. Metrics: A Profusion of Measures. Nature 2010, 465, 864–866. [Google Scholar] [CrossRef]
  18. Woelert, P.; McKenzie, L. Follow the money? How Australian universities replicate national performance-based funding mechanisms. Res. Eval. 2018, 27, 184–195. [Google Scholar] [CrossRef]
  19. Han, J.; Kim, S. How rankings change universities and academic fields in Korea. Korean J. Sociol. 2017, 51, 1–37. [Google Scholar] [CrossRef]
  20. Baldock, C. Citations, Open Access and University Rankings. In World University Rankings and the Future of Higher Education; Downing, K., Ganotice, J., Fraide, A., Eds.; IGI Global: Hershey, PA, USA, 2016; pp. 129–139. [Google Scholar]
  21. Brankovic, J.; Ringel, L.; Werron, T. How Rankings Produce Competition: The Case of Global University Rankings. Z. Soziologie 2018, 47, 270–287. [Google Scholar] [CrossRef]
  22. Gu, X.; Blackmore, K. Quantitative study on Australian academic science. Scientometrics 2017, 113, 1009–1035. [Google Scholar] [CrossRef]
  23. Münch, R. Academic Capitalism: Universities in the Global Struggle for Excellence; Routledge: New York, NY, USA, 2014. [Google Scholar]
  24. Egghe, L. A heuristic study of the first-citation distribution. Scientometrics 2000, 48, 345–359. [Google Scholar] [CrossRef]
  25. Selten, F.; Neylon, C.; Huang, C.-K.; Groth, P. A longitudinal analysis of university rankings. Quant. Sci. Stud. 2020, 1, 1109–1135. [Google Scholar] [CrossRef]
  26. Moed, H.F. A critical comparative analysis of five world university rankings. Scientometrics 2017, 110, 967–990. [Google Scholar] [CrossRef] [Green Version]
  27. Marginson, S. Global University Rankings: Implications in general and for Australia. J. High. Educ. Policy Manag. 2007, 29, 131–142. [Google Scholar] [CrossRef]
  28. Uslu, B. A path for ranking success: What does the expanded indicator-set of international university rankings suggest? High. Educ. 2020, 80, 949–972. [Google Scholar] [CrossRef]
  29. Luque-Martínez, T.; Faraoni, N. Meta-ranking to position world universities. Stud. High. Educ. 2020, 45, 819–833. [Google Scholar] [CrossRef]
  30. Moshtagh, M.; Sotudeh, H. Correlation between universities’ Altmetric Attention Scores and their performance scores in Nature Index, Leiden, Times Higher Education and Quacquarelli Symonds ranking systems. J. Inform. Sci. 2021. [Google Scholar] [CrossRef]
  31. Garfield, E. Can citation indexing be automated. In Proceedings of the Statistical Association Methods for Mechanized Documentation, Symposium Proceedings; National Bureau of Standards: Washington, DC, USA, 1965; pp. 189–192. [Google Scholar]
  32. Judge, T.A.; Cable, D.M.; Colbert, A.E.; Rynes, S.L. What causes a management article to be cited—Article, author, or journal? Acad. Manag. J. 2007, 50, 491–506. [Google Scholar] [CrossRef]
  33. Goldratt, E. The Haystack Syndrome: Sifting Information out of the Data Ocean; North River Press: Great Barrington, MA, USA, 1990. [Google Scholar]
  34. Wang, J. Citation time window choice for research impact evaluation. Scientometrics 2013, 94, 851–872. [Google Scholar] [CrossRef]
  35. Huang, Y.; Bu, Y.; Ding, Y.; Lu, W. Exploring direct citations between citing publications. J. Inf. Sci. 2020. [Google Scholar] [CrossRef]
  36. Bornmann, L.; Daniel, H.D. Citation speed as a measure to predict the attention an article receives: An investigation of the validity of editorial decisions at Angewandte Chemie International Edition. J. Inf. 2010, 4, 83–88. [Google Scholar] [CrossRef]
  37. Van Dalen, H.P.; Henkens, K. Signals in science—On the importance of signaling in gaining attention in science. Scientometrics 2005, 64, 209–233. [Google Scholar] [CrossRef] [Green Version]
  38. Egghe, L.; Bornmann, L.; Guns, R. A proposal for a First-Citation-Speed-Index. J. Inf. 2011, 5, 181–186. [Google Scholar] [CrossRef]
  39. Van Raan, A.F.J. Sleeping Beauties in science. Scientometrics 2004, 59, 467–472. [Google Scholar] [CrossRef]
  40. Youtie, J. The use of citation speed to understand the effects of a multi-institutional science center. Scientometrics 2014, 100, 613–621. [Google Scholar] [CrossRef]
  41. Glanzel, W.; Schoepflin, U. A Bibliometric Study on Aging and Reception Processes of Scientific Literature. J. Inf. Sci. 1995, 21, 37–53. [Google Scholar] [CrossRef]
  42. Glanzel, W.; Rousseau, R.; Zhang, L. A Visual Representation of Relative First-Citation Times. J. Am. Soc. Inf. Sci. Tec. 2012, 63, 1420–1425. [Google Scholar] [CrossRef]
  43. Hancock, C.B. Stratification of Time to First Citation for Articles Published in the Journal of Research in Music Education: A Bibliometric Analysis. J. Res. Music Educ. 2015, 63, 238–256. [Google Scholar] [CrossRef]
  44. Yarbrough, C. Forum: Editor’s report. The status of the JRME, 2006 Cornelia Yarbrough, Louisiana State University JRME editor, 2000–2006. J. Res. Music Educ. 2006, 54, 92–96. [Google Scholar] [CrossRef]
  45. Zhao, S.X.; Lou, W.; Tan, A.M.; Yu, S. Do funded papers attract more usage? Scientometrics 2018, 115, 153–168. [Google Scholar] [CrossRef]
  46. Gläser, J. How can governance change research content? Linking science policy studies to the sociology of science. In Handbook on Science and Public Policy; Simon, D., Kuhlmann, S., Stamm, J., Canzler, W., Eds.; Edward Elgar Publishing: Cheltenham, UK, 2019; pp. 419–447. [Google Scholar]
  47. Wang, J.; Shapira, P. Funding acknowledgement analysis: An enhanced tool to investigate research sponsorship impacts: The case of nanotechnology. Scientometrics 2011, 87, 563–586. [Google Scholar] [CrossRef]
  48. Cantwell, B.; Taylor, B.J. Global Status, Intra-Institutional Stratification and Organizational Segmentation: A Time-Dynamic Tobit Analysis of ARWU Position Among U.S. Universities. Minerva 2013, 51, 195–223. [Google Scholar] [CrossRef]
  49. Wuchty, S.; Jones, B.F.; Uzzi, B. The increasing dominance of teams in production of knowledge. Science 2007, 316, 1036–1039. [Google Scholar] [CrossRef] [Green Version]
  50. Pislyakov, V.; Shukshina, E. Measuring excellence in Russia: Highly cited papers, leading institutions, patterns of national and international collaboration. J. Assoc. Inf. Sci. Tech. 2014, 65, 2321–2330. [Google Scholar] [CrossRef]
  51. Bornmann, L.; Daniel, H.D. What do citation counts measure? A review of studies on citing behavior. J. Doc. 2008, 64, 45–80. [Google Scholar] [CrossRef]
  52. Corbyn, Z. An easy way to boost a paper’s citations. Nature 2010. [Google Scholar] [CrossRef]
  53. Hedstrom, P.; Ylikoski, P. Causal Mechanisms in the Social Sciences. Ann. Rev. Sociol. 2010, 36, 49–67. [Google Scholar] [CrossRef] [Green Version]
  54. Rogers, E.M. Diffusion of Innovation; Free Press: New York, NY, USA, 1983. [Google Scholar]
  55. Bourgeois, L.J. Toward a Method of Middle-Range Theorizing. Acad. Manag. Rev. 1979, 4, 443–447. [Google Scholar] [CrossRef]
  56. Merton, R.K. On Sociological Theories of the Middle Range. In Social Theory and Social Structure; Mertion, R.K., Ed.; Simon & Schuster: New York, NY, USA, 1949; pp. 39–53. [Google Scholar]
  57. Suri, H. Purposeful sampling in qualitative research synthesis. Qual. Res. J. 2011, 11, 63–75. [Google Scholar] [CrossRef] [Green Version]
  58. Seawright, J.; Gerring, J. Case selection techniques in case study research—A menu of qualitative and quantitative options. Polit Res. Quart. 2008, 61, 294–308. [Google Scholar] [CrossRef]
  59. Costas, R.; van Leeuwen, T.N.; Bordons, M. Referencing patterns of individual researchers: Do top scientists rely on more extensive information sources? J. Am. Soc. Inf. Sci. Tec. 2012, 63, 2433–2450. [Google Scholar] [CrossRef] [Green Version]
  60. Kyvik, S.; Aksnes, D.W. Explaining the increase in publication productivity among academic staff: A generational perspective. Stud. High. Educ. 2015, 40, 1438–1453. [Google Scholar] [CrossRef]
  61. Hargens, L.L.; Hagstrom, W.O. Scientific Consensus and Academic Status Attainment Patterns. Sociol. Educ. 1982, 55, 183–196. [Google Scholar] [CrossRef]
  62. Daston, L. Science Studies and the History of Science. Crit. Inq. 2009, 35, 798–813. [Google Scholar] [CrossRef]
  63. Tight, M. Discipline and methodology in higher education research. High. Educ. Res. Dev. 2013, 32, 136–151. [Google Scholar] [CrossRef]
  64. Tight, M. Discipline and theory in higher education research. Res. Pap. Educ. 2014, 29, 93–110. [Google Scholar] [CrossRef]
  65. Dorta-Gonzalez, P.; Dorta-Gonzalez, M.I.; Santos-Penate, D.R.; Suarez-Vega, R. Journal topic citation potential and between-field comparisons: The topic normalized impact factor. J. Inf. 2014, 8, 406–418. [Google Scholar] [CrossRef] [Green Version]
  66. Waltman, L. A review of the literature on citation impact indicators. J. Inf. 2016, 10, 365–391. [Google Scholar] [CrossRef] [Green Version]
  67. Martin-Martin, A.; Orduna-Malea, E.; Thelwall, M.; Lopez-Cozar, E.D. Google Scholar, Web of Science, and Scopus: A systematic comparison of citations in 252 subject categories. J. Inf. 2018, 12, 1160–1177. [Google Scholar] [CrossRef] [Green Version]
  68. Hancock, C.B.; Price, H.E. First citation speed for articles in Psychology of Music. Psychol. Music 2016, 44, 1454–1470. [Google Scholar] [CrossRef]
  69. Cox, D.R. Regression Models and Life-Tables. J. R. Stat. Soc. B 1972, 34, 187–202. [Google Scholar] [CrossRef]
  70. Cleves, M.A.; Gould, W.M.; Gutierrez, R.; Marchenko, Y. An Introduction to Survival Analysis Using STATA; STATA Press: College Station, TX, USA, 2010. [Google Scholar]
  71. Bornmann, L.; Mutz, R. Growth rates of modern science: A bibliometric analysis based on the number of publications and cited references. J. Assoc. Inf. Sci. Tech. 2015, 66, 2215–2222. [Google Scholar] [CrossRef] [Green Version]
  72. Larsen, P.O.; von Ins, M. The rate of growth in scientific publication and the decline in coverage provided by Science Citation Index. Scientometrics 2010, 84, 575–603. [Google Scholar] [CrossRef] [Green Version]
  73. Abramo, G.; D’Angelo, C.A.; Cicero, T. What is the appropriate length of the publication period over which to assess research performance? Scientometrics 2012, 93, 1005–1017. [Google Scholar] [CrossRef]
  74. Nicolaisen, J.; Frandsen, T.F. Zero impact: A large-scale study of uncitedness. Scientometrics 2019, 119, 1227–1254. [Google Scholar] [CrossRef] [Green Version]
  75. Aspers, P. Knowledge and valuation in markets. Theory Soc. 2009, 38, 111–131. [Google Scholar] [CrossRef] [Green Version]
  76. Sauder, M.; Lynn, F.; Podolny, J.M. Status: Insights from Organizational Sociology. Ann. Rev. Sociol. 2012, 38, 267–283. [Google Scholar] [CrossRef] [Green Version]
  77. Lotka, A. The frequency distribution of scientific productivity. J. Wash. Acad. Sci. 1926, 16, 317–324. [Google Scholar]
  78. Creswell, J.W.; Plano-Clark, V.L. Designing and Conducting Mixed Methods Research; SAGE Publishing: Newbury Park, CA, USA, 2011. [Google Scholar]
  79. Adler, N.J.; Harzing, A.W. When Knowledge Wins: Transcending the Sense and Nonsense of Academic Rankings. Acad. Manag. Learn. Educ. 2009, 8, 72–95. [Google Scholar] [CrossRef] [Green Version]
  80. Agrawal, A.; McHale, J.; Oettl, A. How stars matter: Recruiting and peer effects in evolutionary biology. Res. Policy 2017, 46, 853–867. [Google Scholar] [CrossRef]
  81. Bozeman, B.; Corley, E. Scientists’ collaboration strategies: Implications for scientific and technical human capital. Res. Policy 2004, 33, 599–616. [Google Scholar] [CrossRef]
Figure 1. Change in the 5-year JIF of Minerva and SHE from 1997–2017. Source: Journal Citation Reports (https://jcr.clarivate.com, accessed on 22 January 2020).
Sustainability 13 09515 g001
Figure 2. Total number of citations for articles published in Minerva and SHE by year and WURs periods.
Sustainability 13 09515 g002
Figure 3. Kaplan–Meier failure function plot for papers published in the journals Minerva and SHE during three WURs periods.
Sustainability 13 09515 g003
Table 1. Citation and publication indicators used in different WURs.
ARWU aQS bTHE cLeiden dSCImago eU-Multirank f
Since20032004 2004200720092014
OrganisationShanghai Jiao Tong UniversityQuacquarelli SymondsTimes Higher EducationCentre for Science and Technology Studies (CWTS), Leiden UniversitySCImago LabCentre for Higher Education (CHE), Center for Higher Education Policy Studies (CHEPS), University of Twente, CWTS, and Fundación CYD, Spain.
IndicatorsHighly cited researchers: 20%
Papers published in Nature and Science: 20%
Papers indexed in Science Citation Index-Expanded and Social Science Citation Index: 20%
Academic Reputation: 40%
Citations per faculty: 20%
Research (volume, income and reputation): 30%
Citations (research influence): 30%
Scientific impact
Collaboration
Open access
Research: 50%
Normalized impact: 13%
Output: 8%
Not own journals: 3%
Own journals: 3%
Excellence: 2%
High quality publication: 2%
Open access: 2%
Societal: 20%
Altmetrics: 10%
Inbound links: 5%
Web size: 5%
Research
Bibliometric data sourceWeb of ScienceScopusWeb of ScienceWeb of ScienceScopusWeb of Science
Table 2. Variables and measurements used in the analysis.
FactorVariableMeasurement
First-citation speedFirst-citation speedTime elapsed from year of publication to year of first citation
First-citation statusFirst-citation statusCited case = 1; censored case (uncited) = 0
Social mechanismWURs periodsAntecedent period (1990–2003) (criterion variable)
Implementation period (2004–2010)
Adaptation period (2011–2017)
Prior recognitionAcademic reputationCorresponding author’s affiliated university within top 100 in ARWU = 1; other = 0
JIFSHE = 1; Minerva = 0
Third-party fundingThird-party funding sources acknowledged in a paper = 1; other = 0
Author characteristicsNumber of authorsNumber of authors in a paper
International collaborationInternational collaboration = 1; others = 0
Paper-related factorsNumber of referencesNumber of references cited in a paper
Paper lengthNumber of pages from first to last page
Table 3. Descriptive statistics of the two journals in the study.
VariableMinervaSHE
NMin.Max.MeanSDNMin.Max.MeanSD
Total citations443040910.4327.7513460106220.2846.31
No. of authors443191.490.9013461112.141.26
Paper length (no. of pages)44317621.367.05134613615.783.67
No. of references443023446.8728.571345016139.7218.95
VariableMinervaSHE
N%N%
Number of papers published in each WURs periodAntecedent period19143.1231223.18
Implementation period10924.6031623.48
Adaptation period14332.2871853.34
First-citation statusCited38186.00118487.96
Uncited6214.0016212.04
Academic reputationTop-100 university in ARWU12628.9023217.33
Other31071.10110782.67
Third-party fundingYes317.001138.40
No41293.00123391.60
International collaborationYes306.861329.81
No40793.14121490.19
Table 4. General patterns in publications and citations for the two journals by WURs period.
VariableMinervaSHE
Antecedent
1990–2003
Implementation
2004–2010
Adaptation
2011–2017
Antecedent
1990–2003
Implementation
2004–2010
Adaptation
2011–2017
No. of papers191109143312316718
Average no. of papers per year13.6415.5720.4322.2945.14102.57
No. of citations2030175183811,26211,4414600
Average no. of citations per paper10.6316.065.8636.1036.216.41
Average no. of citations of papers per year0.591.571.271.883.371.55
Top-100 university in ARWU53
(28.80%)
34
(31.19%)
39
(27.27%)
44
(14.19%)
62
(19.62%)
126
(17.67%)
Third-party funding0
(0.00%)
4
(3.67%)
27
(18.88%)
0
(0.00%)
1
(0.32%)
112
(15.60%)
No. of authors1.301.411.801.721.992.39
International collaboration4
(2.16%)
3
(2.75%)
23
(16.08%)
11
(3.53%)
16
(5.06%)
105
(14.62%)
Average paper length20.8420.3422.8413.8315.9716.54
Total no. of references678053138695891512,27532,278
No. of references from same journal230
(3.39%)
105
(1.98%)
376
(4.32%)
274
(3.07%)
533
(4.34%)
1453
(4.50%)
Average no. of
references in a paper
35.5048.7460.8028.5738.8445.08
Table 5. First-citation status and first-citation speed for the journals Minerva and SHE.
JournalPeriodNFirst Citation StatusFirst-Citation Speed
Censored
(Uncited, %)
CitedMean
(Std. Err.)
Median
(Std. Err.)
MinervaAntecedent (1990–2003)19128 (14.7%)1639.78 (0.69)5.00 (0.51)
Implementation (2004–2010)1099 (8.3%)1004.38 (0.34)3.00 (0.18)
Adaptation (2011–2017)14325 (17.5%)1182.66 (0.13)2.00 (0.13)
Total44362 (14.0%)3816.66 (0.38)3.00 (0.15)
SHEAntecedent (1990–2003)31217 (5.5%)2955.91 (0.37)3.00 (0.16)
Implementation (2004–2010)3161 (0.3%)3152.56 (0.07)2.00 (0.06)
Adaptation (2011–2017)718144 (20.1%)5742.14 (0.05)2.00 (0.05)
Total1346162 (12.0%)11843.36 (0.13)2.00 (0.04)
Table 6. Cox regression models for factors influencing the first-citation probability of papers published in the journals Minerva and SHE.
MinervaSHE
Model 1Model 2Model 3Model 4
Hazard RatioStd. Err.zHazard RatioStd. Err.zHazard RatioStd. Err.zHazard RatioStd. Err.z
WURs implementation period---1.780.244.24 ***---1.880.176.89 ***
WURs adaptation period---2.720.416.63 ***---1.960.187.37 ***
Top-100 university in ARWU0.960.11−0.341.000.120.021.120.091.441.100.091.21
Third-party funding (TPF)2.130.493.25 **1.550.371.87 +1.530.213.11 **1.400.192.45 *
No. of authors1.090.061.471.050.060.731.050.032.01 *1.020.030.76
International collaboration1.040.260.150.910.23−0.381.110.130.921.060.120.52
Number of references1.010.005.51 ***1.010.003.43 **1.010.004.84 ***1.000.002.59 *
Paper length0.990.01−0.931.000.01−0.371.030.012.91 **1.020.011.90 +
N43643612701270
Log-likelihood−2000.89−1978.16−7065.04−7031.86
LR chi245.26 ***90.72 ***82.70 ***149.05 ***
+p < 0.1, * p < 0.05, ** p < 0.01, *** p < 0.001.
Table 7. Cox regression models for factors influencing first-citation probability by WURs period.
Model 5
(WURs Antecedent)
Model 6
(WURs Implementation)
Model 7
(WURs Adaptation)
Hazard RatioStd. Err.zHazard RatioStd. Err.zHazard RatioStd. Err.z
Top-100 university in ARWU1.080.130.631.150.141.151.030.100.25
JIF (SHE)1.760.214.63 **2.040.285.13 ***1.380.172.57 *
Third-party funding(n.d.a.)2.030.961.501.360.172.47 *
No. of authors1.100.061.86 +1.050.051.020.990.03−0.34
International collaboration0.870.27−0.451.070.270.251.040.130.34
No. of references1.010.004.73 ***1.000.001.311.000.001.22
Paper length1.000.01−0.121.010.010.981.010.011.09
N494425787
Log likelihood−2467.18−2223.86−3713.74
LR chi246.73 ***39.13 ***14.58 *
+p < 0.1, * p < 0.05, ** p < 0.01, *** p < 0.001.
Publisher’s Note: MDPI stays neutral with regard to jurisdictional claims in published maps and institutional affiliations.

