Article

Constructing Sports Promotion Models for an Accessibility and Efficiency Analysis of City Governments

1
Physical Education Office, Takming University of Science and Technology, Taipei City 114, Taiwan
2
Physical Education Center, Taipei National University of the Arts, Taipei City 112, Taiwan
3
School of Physical Education and Health, Guangxi Normal University, Guangxi 541004, China
4
Graduate Institute of Sport, Leisure and Hospitality Management, National Taiwan Normal University, Taipei City 106, Taiwan
*
Authors to whom correspondence should be addressed.
Sustainability 2021, 13(16), 9390; https://doi.org/10.3390/su13169390
Submission received: 22 May 2021 / Revised: 16 August 2021 / Accepted: 20 August 2021 / Published: 21 August 2021
(This article belongs to the Special Issue Accessibility, Public Space and Health)

Abstract

:
This study provides a systematic analysis of sports promotion efficiency in 22 administrative districts in Taiwan from 2011 to 2018. We first considered sports behavior and sports information promotion and connected the multiple intermediate products using network DEA, used the public performance and outputs to measure the total efficiency of sports promotion in the 22 administrative districts, and then established the final input–output indicators. The long-term tracking of sports promotion efficiency shows that, while Taipei and Taoyuan experienced upward trends, the other 20 administrative districts saw declining trends. We also used truncated regression to identify 14 environmental variables that affected the efficiency of sports promotion in the 22 administrative districts from 2016 to 2018, with the results showing that funding, satisfaction with life, and average BMI in each administrative district were significant factors, revealing the latest trends in and measurements of governance in terms of government accessibility.

1. Introduction

Since data science has been used to assess the performance of governments, ‘per-formance evaluations’ and ‘performance management’ have become important research topics. In the 2017 World Competitiveness Yearbook (WCY) published by the Swiss-based International Institute for Management Development (IMD), Taiwan ranked 14th out of 63 countries and regions in terms of national competitiveness, which was an unchanged rank from that in 2016. In the Asia-Pacific region, Taiwan ranked third, just behind Hong Kong and Singapore. Among the four competitiveness factors in the WCY, Taiwan ranked 10th in terms of ‘government efficiency’, which was also the country’s highest ranking for an individual factor; ‘economic performance’ and ‘business efficiency’ improved by three and one spots for this period, respectively, while ‘infrastructure’ fell by two spots [1]. Efficient government management involves implementing government policies and meeting the expectations of the public so that such policies are noticed by the public. The Organization for Economic Cooperation and Development (OECD) has pointed out that efficient government management involves ‘processes’, ‘efficiency’, ‘effectiveness’, ‘service delivery’, ‘financial performance’, and other targets [2,3]. Past experience suggests that indicators of efficient government management guides the behaviors and attention of organization members. Lin et al. [4] constructed a new efficiency management model by exploring data characteristics and correlations among data. The use of real-time information as an important reference for government authorities in promoting sports and adjusting marketing strategies is indeed an issue worthy of attention.
Academic research and sports promotion and sports organization efficiency analyses generally focus on four major issues, namely sports for development (SFD) [5,6,7,8], sports organization efficiency management [9,10,11,12,13,14,15], sports and health promotion [5,12,16,17,18], and public health [19,20,21]. First, the promotion of sports development and activity includes creating integrated models to enhance collaboration and accessibility [5], establishing new models for public governing bodies (PSOs) to understand sports participation [6], managing SFD and healthy lifestyles [7], and comprehensively analyzing theoretical and conceptual advancements in SFD [8]. Second, the scope and content of studies on the management and efficiency of sports organizations are relatively extensive and include conducting efficiency analyses of sports organization training activities [9], assessing the efficiency of public sports facilities and physical facilities in public spaces [10], examining the impacts of physical facilities for different sports measured through different indexes [11], implementing health promotion and comprehensive capacity-building strategies via sporting organizations [12,13], examining facilities management and sports promotion for participants with disabilities [14], and investigating the organizational capacity and performance of community sports clubs [15]. Third, sports and health promotion has always been a matter of public concern, with relevant research subjects including health promotion and the fund management strategies of sports authorities [12], the promotion of social well-being through sports and health promotion and recreation [5], the examination of sports and health promotion for research development and practice [16], the management of sports and health promotion [17], and the promotion of the dietary health of audiences through sports and mega sports events (e.g., the Olympic games) [18]. Fourth, public health is a focus of many joint efforts between the public and the government. Relevant studies cover topics such as public health perspectives on leisure-time physical activity [19], the spillover effects of sports and physical activity and the corresponding relationship between government quality and individual health [20], and sports as a vehicle for health promotion (a shared value in corporate social responsibility) [21]. In summary, sports promotion and sports organization efficiency issues mainly focus on sports promotion strategies, sports involvement and participation, and goal identification. Since 2019, the coronavirus disease 2019 (COVID-19) pandemic has had an unprecedented impact on the global economy, affecting economic prospects and subverting the ways people are used to living and working; however, regardless of the scientific and technological interventions that are developed, it is vital that sports concepts and knowledge be promoted, as these are the most influential factors in promoting actual sports and public health and highlight the importance and necessity of continuously strengthening the government’s sports promotion.
The P-O-L-C framework categorizes the four primary functions of management, namely planning, organizing, leading, and controlling. Most research studies on sports promotion address the first three aspects, although discussions on ‘control’, efficiency measurements, and repromotion, after feedback reviews, are rare; however, when government sports authorities implement policies, if efficiency measurements can be carried out and a valuable feedback mechanism can be established, overall governance efficiency should improve, which can greatly help promote mass sports. De Borger and Kerstens [22], Geys and Moesen [23], and Hauner and Kyobe [2] have proposed that only after the development of data envelopment analysis (DEA) did administrative efficiency measurement by governments begin to receive much attention. The literature review for this study revealed that the topics that have received the most attention to date have covered five aspects: (1) Discussions on the cost efficiency of each administrative district; (2) Land (space) administration and financial analyses of local governments; (3) The relationship between public expenditure by local governments and public service; (4) Energy efficiency in each administrative district; (5) Productivity analyses for all energy factors governed by local governments. The Taiwanese government formulated economic development strategies, deployed policies in advance, and used innovative medicine, which combines technology and healthcare (the two most powerful industries in Taiwan) to build a strong health industry; this situation has had a significant impact on the practical perspective of sports management outlined in this study [24].
In contrast, studies on government efficiency in the sports field are rare, and the level of formalization of existing sports participation knowledge is relatively low [6]. In attempting to fill this research gap, Girginov, Toohey and Willem [6] mentioned that knowledge creation in the context of PSOs has been shaped by the interplay among personal knowledge (i.e., cognitive), organizational forms (i.e., culture, structure, and processes), and societal institutions (i.e., government policy on data). Bastow, Patrick and Jane [25] have identified that no organization has a complete inventory of the three broad categories of knowledge—ordinary, applied and research, and theoretical; therefore, an essential aspect of ‘applied and research’ knowledge that has strong utilization potential remains unrecorded. As such, policy development and implementation by government sports authorities and the implementation and measurement of public sports policies are related to successful national sports programs and sports development. This vital research topic, which is the primary concern of this study, warrants extensive discussion and review, and the relevant studies must be implemented through data management analysis.
In summary, from the perspectives of data science and efficiency management, and based on the gap between practical needs and academic research, this study analyzes government funds, human resources, facilities, sports populations, health conditions, body mass index (BMI), and the level of satisfaction with life (SWL) index. Additionally, this study combines influential variables, such as people’s exercise habits, exercise behavior, and sports satisfaction, to comprehensively explore the present situation and potential future of sports promotion in 22 administrative districts in Taiwan [24,26], with the goal of improving the policy formulation and implementation of government sports authorities and public sports policies, as well as the measurement of the latter’s efficiency. To establish a systematic analysis model of the efficiency of ‘sports promotion’ in 22 administrative districts in Taiwan for our research purposes, we consider ‘sports behavior promotion’ (SBP) and ‘sports information promotion’ (SIP) and connect the multiple intermediate products using a network DEA model. Furthermore, we track the long-term efficiency of sports promotion by using the public performance outputs to measure the total efficiency and trends of sports promotion in the 22 administrative districts. Finally, we determine significant environmental variables that affect the sports promotion efficiency of the 22 administrative districts using truncated regression analysis to reveal the degree of governance.

2. Materials and Methods

2.1. Data Collection

In this study, we evaluated sports promotion efficiency in 22 administrative districts in Taiwan, the first of this type among relevant studies. The study’s scope covered sports promotion efficiency and tracked trends in 22 administrative districts in Taiwan from 2011 to 2018 and fourteen key factors influencing annual sports promotion in each administrative district. Data from government databases and public information, including sports statistics [27] and statistics on the current sports situation in Taiwan [28], were collected.
We first considered sports behavior promotion and sports information promotion and connected the multiple intermediate products using network DEA, used the public performance outputs to measure the total efficiency of sports promotion, then established the final input–output indicators for the long-term tracking of sports promotion efficiency. The operational definitions of input–output indicators were as follows:
  • The funds in each administrative district (FUND), including the annual budget for the sports administrative authorities (central government) and the annual budget for the sports bureau (office) in each administrative district. The total budget for the sports administrative authorities of the central government and the local governments was NTD 21,145,764,497 (USD 704,858,817), including NTD 7,771,174,000 (USD 259,039,133) from the central government and NTD 13,374,590,839 (USD 445,819,683) from local governments [27];
  • Human resources in sports organizations in each administrative district (HR): In 2015, the central and local government sports authorities hired a total of 1319 people, including 486 regular employees, approximately 310 contractors, and 523 other types of personnel [27];
  • Average sports funds per person (AFPP): The average number of sports funds per person in each administrative district, calculated as the total sports funds in each administrative district/total population in each administrative district [27];
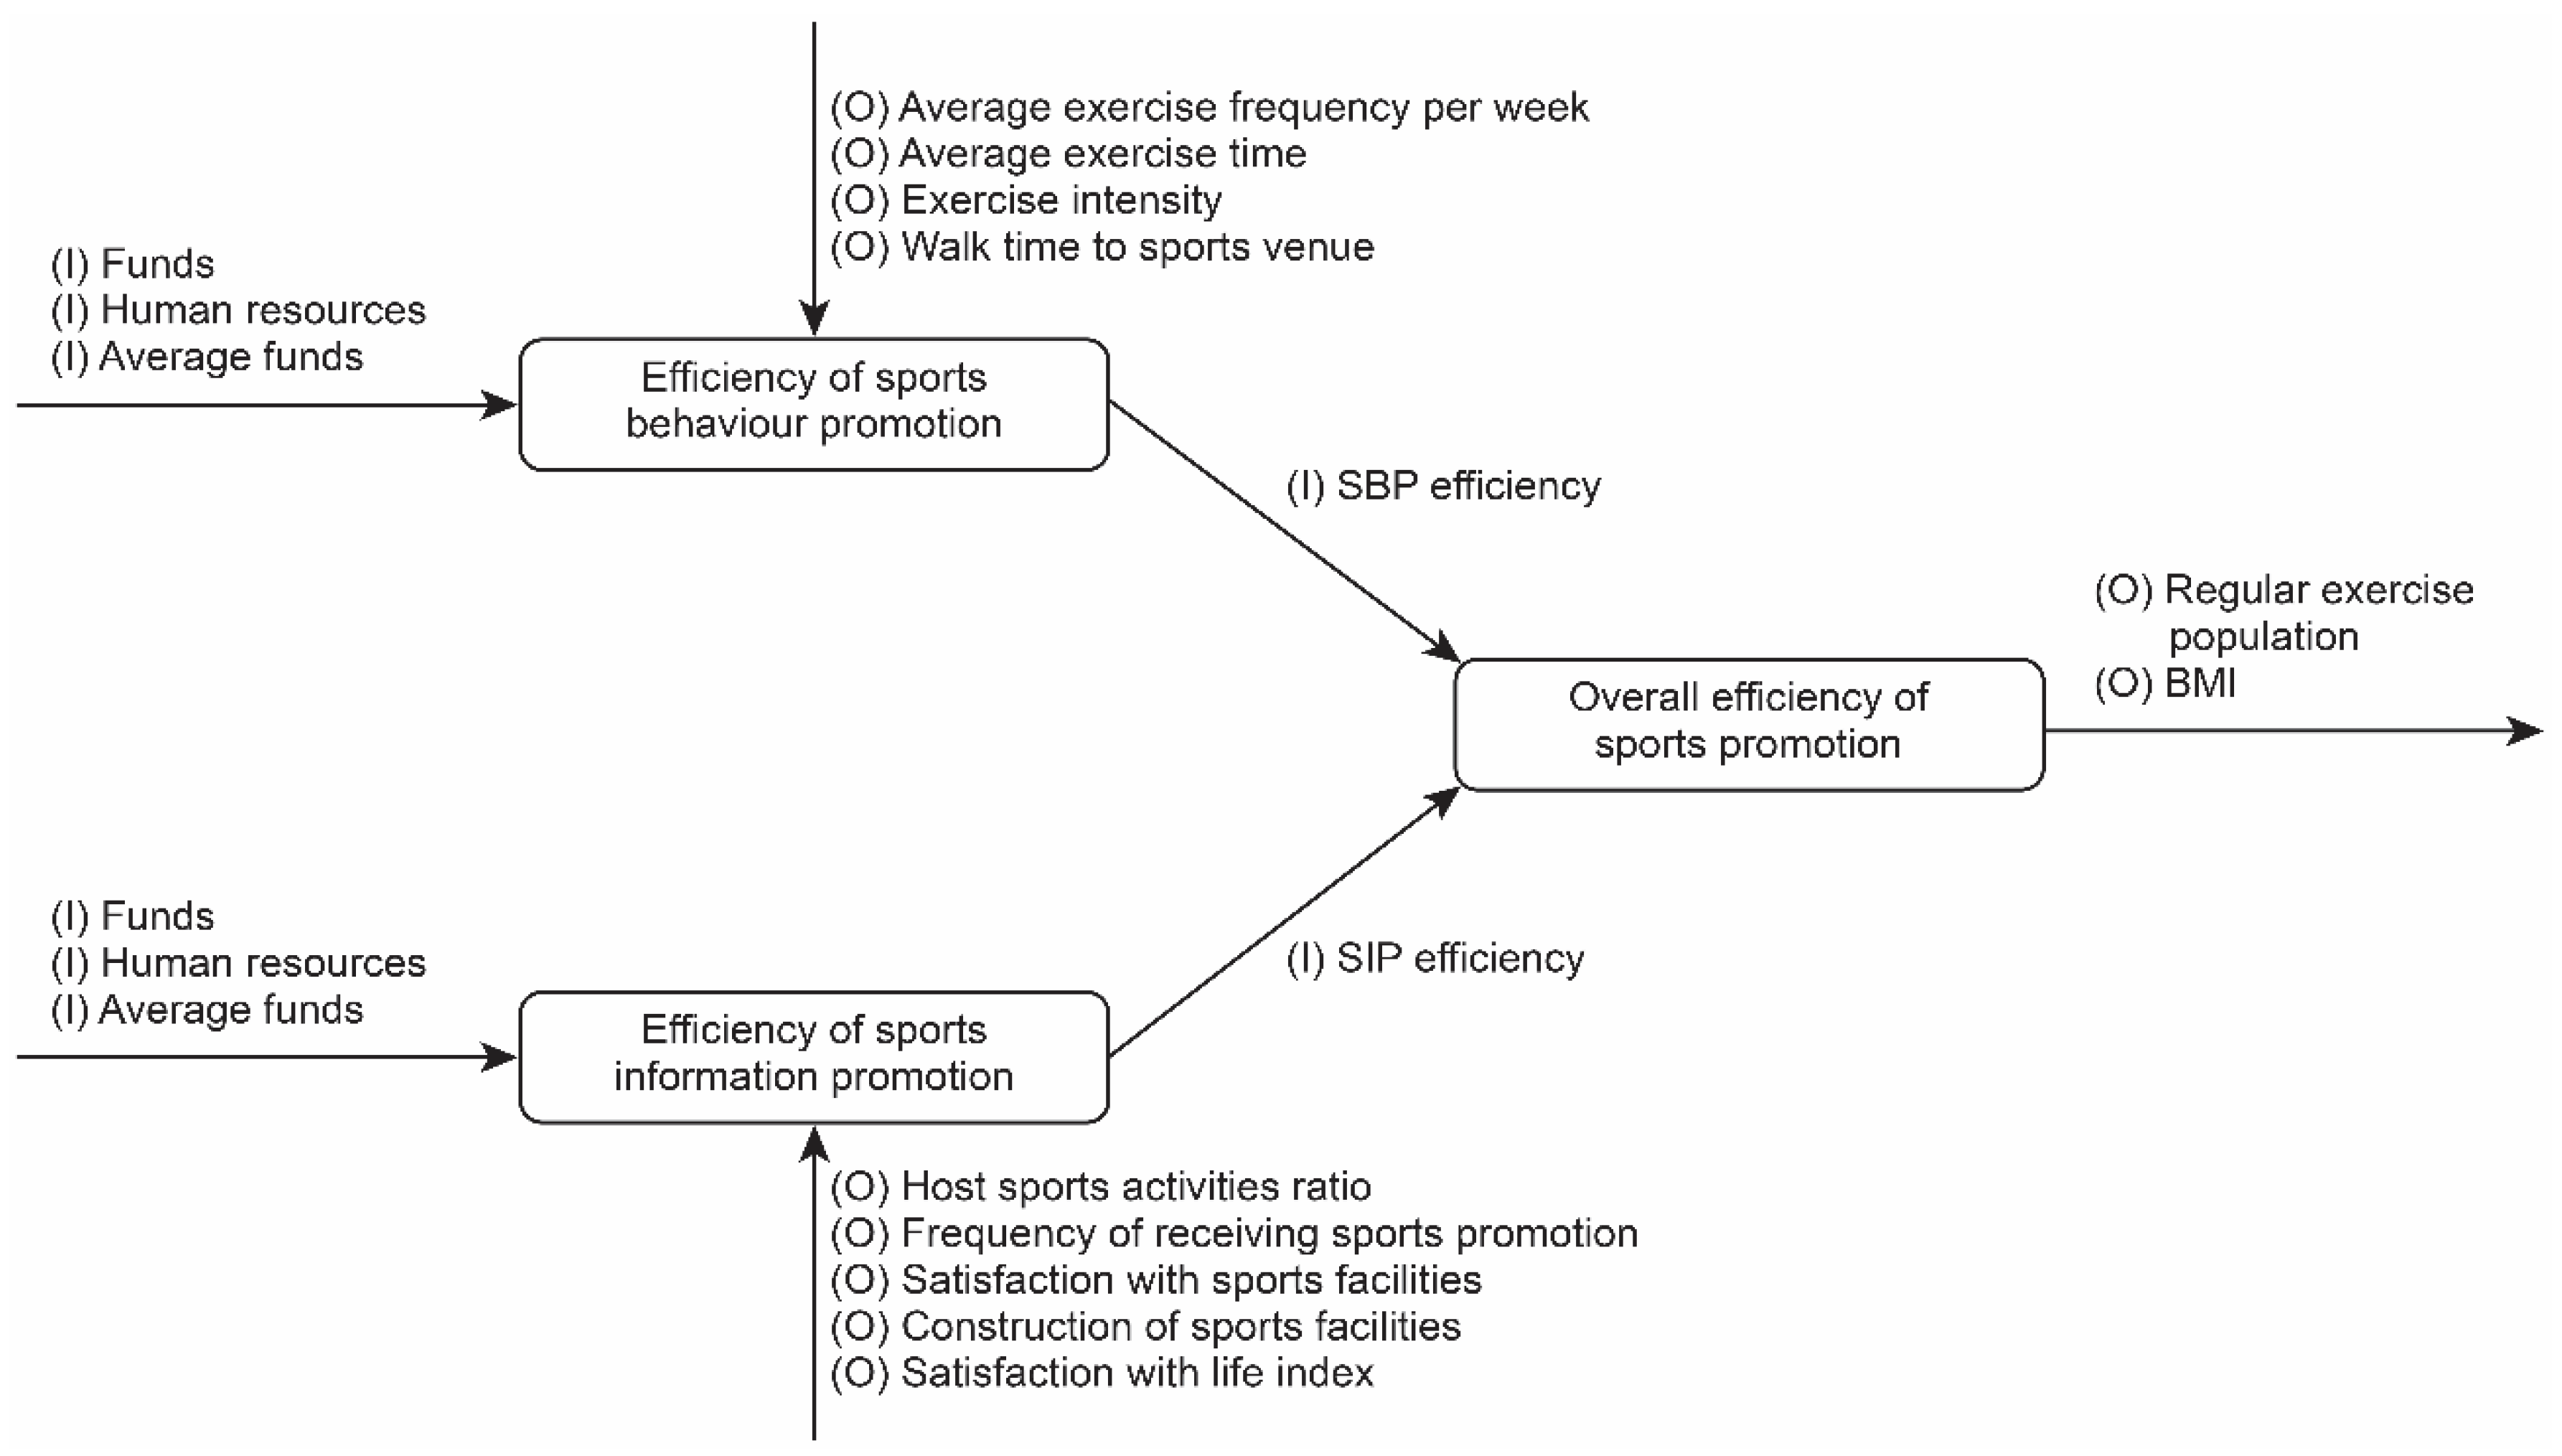
  • Average exercise frequency per week (AEF): Average exercise times per week for people in each administrative district (unit: times) [28];
  • Average exercise time (AET): The total time each person spends exercising in each administrative district (unit: minute) [28];
  • Exercise intensity of each exercise session (EIEE): This represents the average number of people (7333) in each administrative district who exercise 3 times per week at 30 min per session, with a heart rate >130 or wheezing and sweating after exercise. The Sports Administration, Ministry of Education, and Republic of China (Taiwan), conducts an annual sports survey in each administrative district and uses a threshold of 7333 as the criteria to define the regular exercise population (unit: %) [28];
  • Walking/commute time to sports venues (walk time to sports venue, WTSV): There are significant differences in the transportation methods to the most frequently used sports venues between administrative districts, and the walking time to sports venues is used for all administrative districts. Taipei had the highest proportion (>70%) in 2016, and the walking times in Kinmen County and Lienchiang County were the shortest (unit: minute) [28];
  • Host sports activities ratio in each administrative district (HSAR): The proportion of people in each administrative district who think that the administrative district holds sports activities frequently or occasionally. In 2016, the proportion in Lienchiang County (69.5% > 60%) was the highest, while the proportion in Taipei was the lowest proportion (<30%) (unit: %) [28];
  • The frequency of receiving sports promotion (FRSP): This is the frequency of people receiving messages related to sports promotion in each administrative district. In 2016, the proportion of people frequently or occasionally receiving messages related to sports promotion in Lienchiang County was the highest (63.7%), while that in Keelung was the lowest (28.0%) (unit: %) [28];
  • Satisfaction with sports facilities (SWSF): This reflects the satisfaction of people towards the public sports facilities in each administrative district. In 2016, Kinmen County and Lienchiang County had the highest proportion (>70%) of people who were satisfied with the facilities (unit: %) [28];
  • Construction of sports facilities (CSF): This represents the proportion of people in each administrative district who think that there are facilities near to their home. In 2016, Chiayi County, Hualien County, Kinmen County, and Lienchiang County had the highest proportions (>70%) (Unit: %) [28];
  • Satisfaction with life (SWL): This represents the people in each administrative district who think that they are happy with life. In 2016, the proportion of people in Lienchiang County who were very happy was 25.5%, while the proportion of people in Yuanlin County who were very happy was low (unit: %) [28];
  • Regular exercise population in each administrative district (REP): This represents the proportion of the population who regularly participate in sports in each administrative district. In 2015, using a threshold of 7333 to calculate the regular exercise frequency, the regular exercise population accounted for 33% of the population in Taiwan (unit: %) [28];
  • The BMI values for people in each administrative district (BMI): According to the standards of the Ministry of Health and Welfare of Taiwan, for people over 18 years old, BMI values ≥ 27 indicate obesity, 24–27 indicate overweight, 18.5–24 indicates a standard body weight, and values less than 18.5 indicates underweight (unit: %) [28].

2.2. Data Envelopment Analysis

DEA is a nonparametric technique that allows multiple input and output variables in the efficiency frontier. DEA, a linear program model, was first introduced by Charnes, Cooper, and Rhodes [29], who proposed the CCR models, which are named after the initials in their names. DEA is a mathematical programming function used to construct production frontiers and evaluate efficiency scores by projecting the position of a DMU onto the constructed frontiers. The CCR model assumes constant returns to scale and calculates the technical efficiency (TE) value through the relationship between the actual observation point and the frontier of the “isoquant” curve based on the unit isoquant [29,30].
Banker, Charnes, and Cooper [31] assumed a variable return to scale (VRS) and added convexity constraints to the CCR model to calculate the pure TE (i.e., the BCC model). We adopted the output-oriented BCC DEA model [31] to maximize the output in this study.

2.3. Network DEA Procedures

A network DEA method [30] was used with an architecture consisting of three major factors, i.e., the efficiency of SBP, the efficiency of SIP, and the overall efficiency of sports promotion in the 22 administrative districts in Taiwan (Figure 1). The results showed that the efficiency of SBP and SIP were both critical factors for the overall sports promotion efficiency.
The systematic analysis model, ‘the efficiency model of sports promotion in 22 administrative districts in Taiwan’, first considered the efficiency of SBP (SBP efficiency) and the efficiency of SIP (SIP efficiency), connected the multiple intermediate products using network DEA, evaluated the public performance outputs to measure the total efficiency of sports promotion in the 22 administrative districts, and established final input–output indicators (complete framework Figure 1).
The first stage of the research procedure included three inputs (funds, human re-sources, average funds) and four outputs (average exercise frequency per week, average exercise time, exercise intensity, walk time to sports venue) for the efficiency of SBP. The second stage included three inputs (funds, human resources, average funds) and five outputs (host sports activities ratio, frequency of encountering sports promotion messaging, satisfaction with sports facilities, construction of sports facilities, SWL) for the efficiency of SIP. Finally, the third stage included two inputs (SBP efficiency, SIP efficiency) and two outputs (regular exercise population, BMI of people in each administrative district).

2.4. Truncated Regression

This study used a two-stage DEA approach to discuss the sports promotion efficiency of 22 administrative districts in Taiwan. First, we used DEA to obtain efficiency estimates. Then, in the second stage, the DEA scores were regressed on several explanatory variables (environmental variables). Regarding whether censored regression should be used, the most important argument came from Simar and Wilson [32], who noted that the covariates in the second-step regression are correlated with the one-side error terms from the first step; otherwise, there would be no need for the second-step regression. Furthermore, the covariates in the second step are likely to be highly correlated with the covariates in the first step. The errors and the covariates in the first step cannot be independent; thus, Simar et al. [32] concluded that the likelihood that is maximized is not the correct likelihood unless one considers the correlation structure.
In order to evaluate the sports promotion efficiency in 22 administrative districts in Taiwan, we adopted this approach to examine the determinant variables, making this the first study of this type in this research area. Although truncated data appear when samples are drawn only from a specific range of total samples, Simar et al. [32] has proposed using a truncated regression method coupled with a bootstrap method to test and validate the sample’s credibility and to overcome the shortcomings of primary research to the Tobit regression model for environmental variables (key factors). To calculate the TE of 22 administrative districts in Taiwan, and to determine the fourteen environmental variables (the above operational definitions of input–output indicators) affecting sports promotion efficiency, we proposed a truncated regression equation as Equation (1):
TE j = β 0 + β 1 FUND j + β 2 HR j + β 3 AFPP j + β 4 AEF j + β 5 AET j + β 6 EIEE j + β 7 WTSF j + β 8 HSAR j + β 9 FRSP j + β 10 SWSF j + β 11 CSF j + β 12 SWL j + β 13 REP j + β 14 BMI j

3. Results

This study period covered 2011–2018. Due to the large amount of data considered and the desire to examine the most recent information, data and data analysis on the operational definition for 2016 to 2018 are presented. The descriptive statistics of the input and output indicators of SBP from 2016 to 2018 are shown in Table 1. The descriptive statistics for the input and output indicators of SIP from 2016 to 2018 are shown in Table 2. The descriptive statistics for the efficiency of sports promotion in each administrative district from 2016 to 2018 are shown in Table 3.
The results of the network DEA model calculation procedure, as shown in Figure 1, are shown in Table 4 for sports promotion efficiency in the 22 administrative districts from 2011 to 2018. Time series analysis provided an essential reference for ‘long-term’ continuous sports promotion by local governments and central sports authorities.
Additionally, the trends for the efficiency of sports promotion in the 22 administrative districts from 2011 to 2018 are shown in Figure 2, where the x coefficient above the trend line is the ‘slope’. The long-term tracking of sports promotion efficiency showed that while Taipei and Taoyuan showed upward trends, the other 20 administrative districts all showed declining trends. Furthermore, it is clear for each of the 22 administrative districts, whether they are focusing on sports promotion, and this information is definitely worthwhile for local governments and central sports authorities to track in the long term.
According to the special division of the administrative regions, there are currently 6 municipalities directly under the control of the central government of the Republic of China (Taiwan), i.e., Taipei (formed in 1967), Kaohsiung (first formed in 1979, reformed in 2000 with Kaohsiung County), New Taipei City (formed in 2010), Taichung (formed in 2010), Tainan (formed in 2010), and Taoyuan (formed in 2014), commonly known as the 6 special municipalities. The six special municipalities have more authority and resources than other administrative districts regarding organizational personnel and financial budgets. For example, in the allocation of centrally funded tax revenue, the six special municipalities account for 65% of all revenue, while the remaining 16 administrative districts account for only 35%. Among the 6 special municipalities, Taipei, the capital, receives 10 billion to 20 billion NTD (approximately USD 340 million to 640 million) more each year than the other 5 special municipalities, while its resources are also more abundant than those of the other administrative districts. In terms of sports promotion efficiency in the 22 administrative districts in 2011–2018, only Taipei and Taoyuan showed continuous upward trends, with all other administrative districts, including New Taipei City, Taichung, Tainan, and Kaohsiung, showing downward trends; the relevant influencing factors deserve the continued attention of the local governments and the central competent authorities.
In terms of the different geographical locations, the 3 offshore island counties, Penghu County, Kinmen County, and Lienchiang County, all exhibited downward trends in sports promotion efficiency, while the 3 counties in eastern Taiwan, i.e., Ilan County, Hualien County, and Taitung County, also showed declining trends. Whether these counties’ accessibility was affected by the gap between urban and rural spaces in terms of economic development, population loss, and transportation inconvenience (flights are necessary to reach the 3 offshore island counties, and there is no high-speed rail in the eastern region of Taiwan) requires further analysis and discussion in the future.
To understand the most recent trends, we assessed the environmental variables that affected sports promotion efficiency in the 22 administrative districts of Taiwan from 2016 to 2018. For the truncated regression analysis, we used double bootstrap procedures [32] to overcome the serial correlation problem related to the DEA efficiency estimates. The dependent variable was the ‘efficiency of sports promotion’ in the 22 administrative districts, while the independent variables (environmental variables) were the funds in each administrative district, the human resources for sports organizations in each administrative district, the average sports funds per person, the average exercise frequency per week, the average exercise time, the exercise intensity of each exercise session, the walking or commute time to sports venues, the ratio of hosted sports events in each administrative district, the frequency of encountering sports promotion messages, the satisfaction with sports facilities, the construction of sports facilities, SWL, the size of the regularly exercising population in each administrative district, and the average BMI of people in each administrative district. These variables were examined to find the relevant key factors. To determine the overall sports environment in Taiwan, 14 significant factors affecting the sports promotion efficiency in the 22 administrative districts were included (Table 5), and truncated regression with bootstrapping was employed to perform 2000 replications to reduce bias in the study.
The results showed that the effects of the 3 indicators, ‘funds in each administrative dstrict’, ‘SWL’, and ‘average BMI in each administrative district’, were significant. The results showed that the amount of funds directly affects the quality of governance and people’s SWL and well-being, which warrants more attention from local governments than they receive at present, and are the main factors affecting sports promotion, while BMI is the most explicit reference for public health and an indicator for the government efficiency.

4. Discussion

4.1. Discussion and Conclusions

The active promotion of sports and health concepts by states and governments is an important way to show national strength. This study explored sports promotion efficiency in 22 administrative districts in Taiwan from 2011 to 2018, which can be used as a reference for governance and policy-making decisions. Year-on-year adjustment and long-term planning can certainly facilitate the promotion of mass sports and provide the most advantageous situation for both governments and the public.
From 2011 to 2018, in the time series analysis (efficiency trend) of sports promotion in the 22 administrative districts (Figure 2), Taipei and Taoyuan showed upward trends, but the other 20 administrative districts showed declining trends, which thus warrants ‘long-term’ tracking by local governments and central sports authorities [24,26].
Regarding environmental variables that influenced sports promotion efficiency in the 22 administrative districts in Taiwan from 2016 to 2018, the effects of ‘funds in each administrative district’, ‘SWL’, and ‘average BMI of the people in each administrative district’ were significant. Importantly, the six special municipalities have relatively high levels of funding, while the districts on offshore islands and in eastern Taiwan have relatively high levels of SWL. Funding amounts directly affect governance quality; people’s SWL and well-being warrant more attention from local governments than they receive at present and are the main factors affecting sports promotion, while the average BMI of the public is the most explicit indicator of government efficiency. From 2016 to 2018, the proportions of people in the overweight range (according to BMI) in Yunlin County (40.6%), Penghu County (40.6%), and Lienchiang County (40.4%) were >40%, providing the most explicit governance promotion target for competent sports authorities and governments.
We found that sports promotion and health promotion by governments can be broadly divided into sports venue and facility management, policy promotion and fund management, sports promotion quality, sports participation, and health promotion behavior. These issues are managed in four ways, i.e., planning, organizing, guiding, and controlling, with most being addressed via ‘controlling’. When government sports authorities implement policies, if efficiency measurements can be implemented and a useful feedback mechanism can be established, overall governance efficiency should improve, which should substantially help in the promotion of mass sports and sports participation. This highlights the importance of performance evaluations for sports policy implementation. According to the ‘mold Taiwan into a sports island’ plan, for example, the target proportion of the population that regularly exercises was 33% in 2016; however, according to the data collected in this study, in 2018, nine administrative districts, i.e., New Taipei City (32.5%), Taoyuan (29.4%), Hsinchu County (30.8%), Miaoli County (32.8%), Yuanlin County (29.3%), Chiayi County (31.4%), Tainan (32%), Penghu County (32.2%), and Kingman County (31.3%), failed to meet the target, and the specific differences can provide the competent authorities with the most practical data and guidelines for improving these districts’ sport promotion efficiency.
To improve sports promotion and administrative efficiency, the central government departments plan and implement policies, and local governments coordinate with each other; therefore, sports promotion can be implemented from the top down, with different levels of responsibility and interlocking among all authorities (departments). In the 2016–2021 ‘Taiwan I Sports Program’, seven qualitative and quantitative goals are listed [26]: (1) Holding large-scale sports activities at the county (city) level; (2) Training 25,000 personnel for sports promotion; (3) Answering over 100,000 queries on sports information platforms regarding online courses and electronic manuals; (4) Establishing professional sports counselling groups in each administrative district to continually promote mass sports in the region; (5) Integrating bike and pedestrian lanes with 65% of the roads in each administrative district; (6) Increasing the number of women and workers in the regularly exercising population by 2% by 2021; (7) Institutionalizing the mechanism for the central government to guide sports promotion in each administrative district and enhancing the autonomy of local governments in policy promotion. Overall, there is still room for tremendous growth and progress in sports promotion in Taiwan. Policy formulation and implementation by government sports authorities and the implementation and measurement of public sports policies are the driving factors in sports promotion, including strengthening the management foundation, implementing data analysis, and making good use of big data, all of which are important research topics that must be widely discussed and actively strengthened.

4.2. Suggestions for Future Studies

This study aimed to produce results with practical applications. It is crucial to construct a measurement model for sports promotion efficiency in the 22 administrative districts in Taiwan and to create goals and directions that the authorities (the central sports authorities and local governments) can follow to further promote sports and improve public health. The recommendations of this study are as follows:
  • ‘Sports big data’, ‘data analysis’, and ‘modelling’ should be used to meet the practical needs and the trend of the times so that governments and users can make good use of them [4]. In the future, sports promotion efficiency can be analysed together with the complete health insurance data for Taiwan, including information on medical behaviors, health behaviors, and birth and death data, in order to provide an important reference for constructing a complete information network for the big health industry, which is one of the ultimate goals of this study;
  • Sports policy-making and continuous sports promotion are necessary. The Sports Administration, Minister of Education, and Republic of China (Taiwan) [26], for example, have promoted the ‘sunlight fitness promotion plan’ and the ‘sports population doubling plan’ since 1997; furthermore, the six-year project to ‘mould Taiwan into a sports island’ has been promoted since 2010, with the goal of gradually having 33% of the population regularly exercising. From 2016 to 2021, the ‘Taiwan I Sports Program’ was implemented with the hope of shaping a new culture of sports and encouraging the public to actively participate in sports [33,34]. Data analysis has made a significant contribution to the practical perspective of sports management in this study, expanding the channels of sports promotion and enhancing awareness and knowledge regarding people’s participation in sports, training professional human resources, enhancing the efficiency of mass sports promotion, fostering connections between sports venues and daily life and promoting the spirit of sports among the public and at the grassroots level;
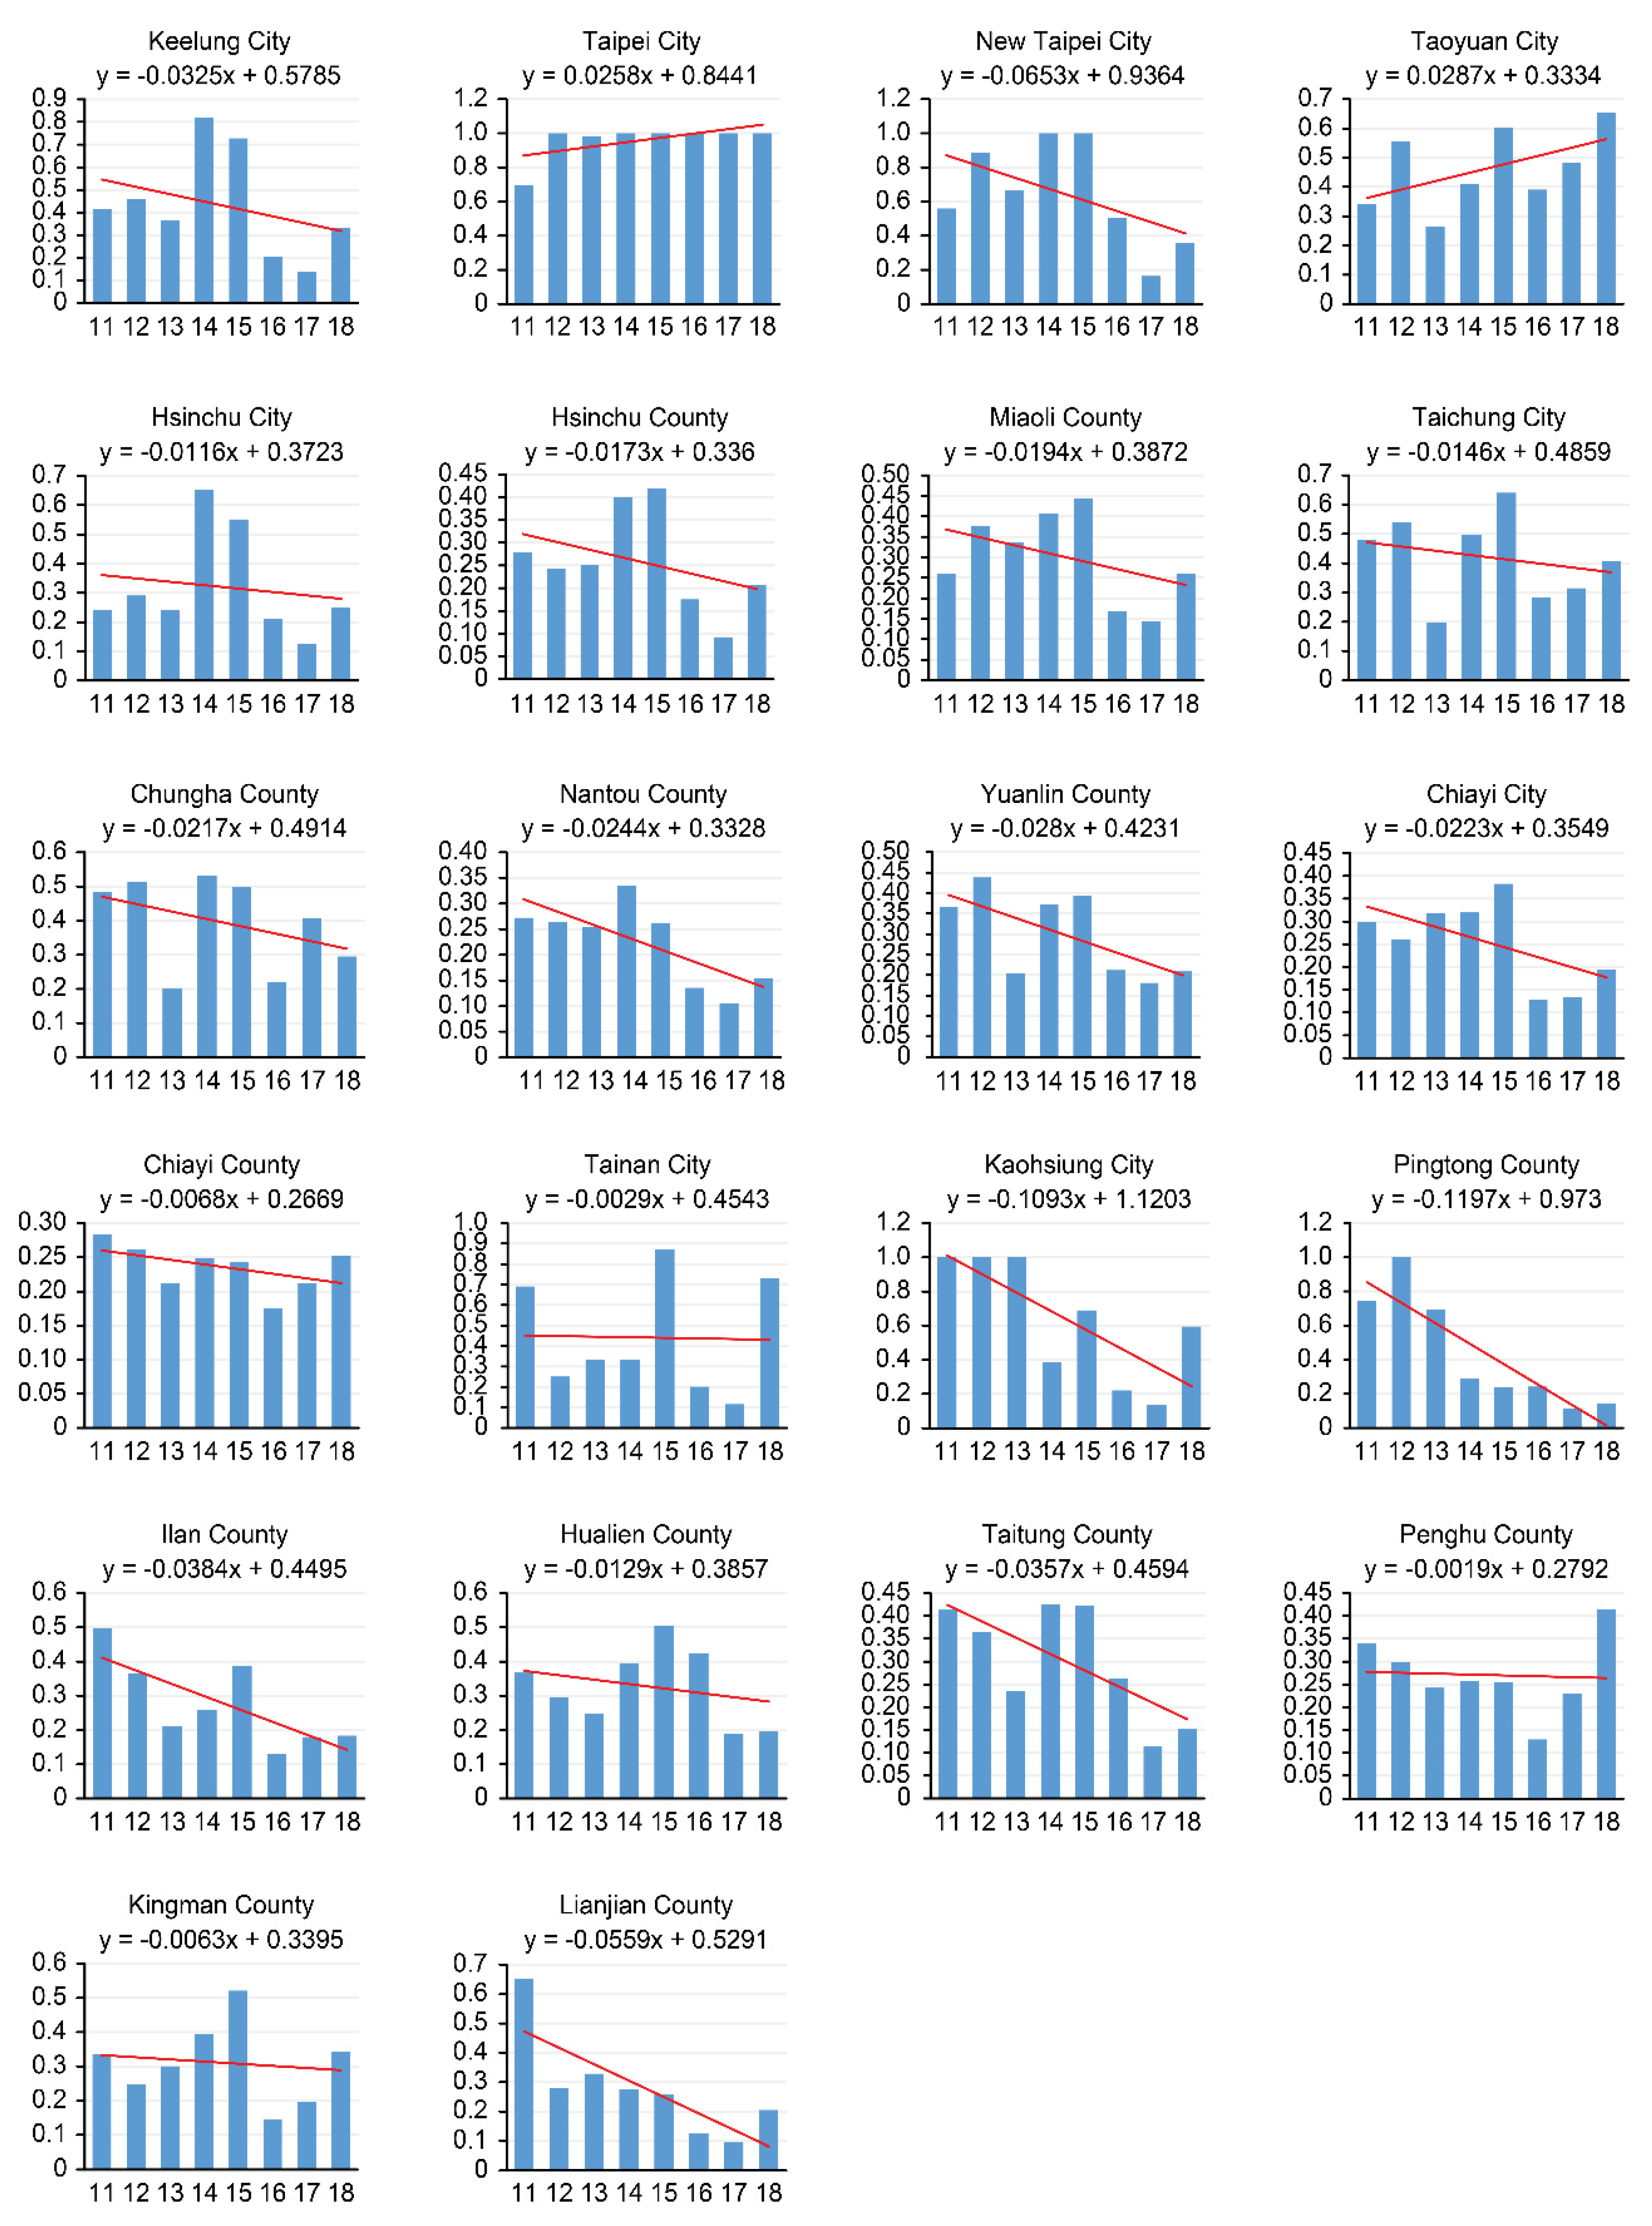
  • Performance evaluations for sports policy implementation are important [35,36]. The purpose of the ‘mould Taiwan into a sports island’ plan was to increase the percentage of the regularly exercising population to 33% by 2016, although the results of this study show that at least nine administrative districts failed to reach this target. Different data analyses and continuous monitoring could help promote the formulation, promotion, and implementation of long-term sports and health policies;
  • Academic research related to the governments’ administrative efficiency is relatively rare in the sports field [6], although it has significant reference value [2,4,22,23]. Long-term and continuous research and promotion require more attention and effort than that which is seen at present. Research and practice can complement each other to increase the sports promotion and policy implementation of the 22 administrative districts of the Taiwanese government, creating a win–win situation that strengthens the nations’ human resources and public health. This study provides information on data science and efficiency management based on the gap between practical needs and academic research, constituting an initial contribution that focuses on the connection between public spending and sports participation at the sports administrative level;
  • As for the sports industry [37], setting appropriate input and output indicators, introducing different research methods, and constructing different models for calculation could help meet the unique needs for measuring government efficiency, improving management efficiency and resource allocation across the whole sports industry, and determining the advantages and disadvantages of operations to achieve the best possible outcomes. By strengthening the ‘control’ function of management, implementing efficiency management, and through the effective use of resources, the purpose of this study, which is to apply scientific management techniques and improve sports management, can be achieved;
  • The COVID-19 crisis has been a turning point. The Taiwanese government formulated economic development strategies, deployed policies in advance, and used innovative medicine that combines technology and healthcare (the two most powerful industries in Taiwan) to build a strong health industry [24]. Specific implementation policies include promoting digital therapies, accelerating the development of precision medicine, developing epidemic prevention technologies, promoting the healthcare service industry, and exporting intelligent medical systems. These five policies are closely related to the sports promotion approaches examined above and form another significant contribution to this study. After connections between these policies have been established, new competitive advantages in the post-pandemic era could improve digital productivity and produce new lifestyles, a new economy, and new values.

4.3. Limitations

This study collected and collated data on the input and output indicators and the environmental variables of sports promotion for the 22 administrative districts in Taiwan only from 2016 to 2018. The results from this study should not be applied to topics that were not addressed here.

Author Contributions

Conceptualization, W.-B.L., M.-J.C. and M.-Y.C.; methodology, W.-B.L. and M.-J.C.; software, W.-B.L. and M.-J.C.; data curation, W.-B.L. and S.-W.Y.; writing—original draft preparation, W.-B.L. and M.-J.C.; writing—review and editing, S.-W.Y., M.-J.C. and M.-Y.C.; All authors have read and agreed to the published version of the manuscript.

Funding

This research was funded by Ministry of Science and Technology Taiwan, grant number MOST 107-2410-H-119-007-; and partly funded by the Research Foundation of Education Bureau of Hunan Province, China (grant No. 18C0624).

Institutional Review Board Statement

Not applicable.

Informed Consent Statement

Not applicable.

Data Availability Statement

No new data were created or analyzed in this study. Data sharing is not applicable to this article.

Acknowledgments

The current study was supported by the Ministry of Science and Technology of Taiwan.

Conflicts of Interest

The authors declare no conflict of interest.

References

  1. IMD. IMD World Competitiveness Rankings 2017 Results. IMD World Competitiveness Yearbook, 23 May. Available online: https://www.imd.org/wcc/world-competitiveness-center-rankings/competitiveness-2017-rankings-results/ (accessed on 26 May 2018).
  2. Hauner, D.; Kyobe, A. Determinants of government efficiency. World Dev. 2010, 38, 1527–1542. [Google Scholar] [CrossRef]
  3. Cuadrado-Ballesteros, B.; Bisogno, M. Public sector accounting reforms and the quality of governance. Public Money Manag. 2021, 41, 107–117. [Google Scholar] [CrossRef]
  4. Lin, W.; Yeh, S.; Yang, C. A study of efficiency management for players and teams in CPBL from the viewpoint of data science. Phys. Educ. J. 2017, 50, 91–107. [Google Scholar] [CrossRef]
  5. Rowe, K.; Shilbury, D.; Ferkins, L.; Hinckson, E. Sport development and physical activity promotion: An integrated model to enhance collaboration and understanding. Sport Manag. Rev. 2013, 16, 364–377. [Google Scholar] [CrossRef] [Green Version]
  6. Girginov, V.; Toohey, K.; Willem, A. Creating and leveraging knowledge to promote sport participation: The role of public governing bodies of sport. Eur. Sport Manag. Q. 2015, 15, 555–578. [Google Scholar] [CrossRef]
  7. Schulenkorf, N.; Siefken, K. Managing sport-for-development and healthy lifestyles: The sport-for-health model. Sport Manag. Rev. 2019, 22, 96–107. [Google Scholar] [CrossRef]
  8. Peachey, J.W.; Schulenkorf, N.; Hill, P. Sport-for-development: A comprehensive analysis of theoretical and conceptual advancements. Sport Manag. Rev. 2020, 23, 783–796. [Google Scholar] [CrossRef]
  9. Barros, C.P.; Santos, A. Productivity in sports organisational training activities: A DEA study. Eur. Sport Manag. Q. 2003, 3, 46–65. [Google Scholar] [CrossRef]
  10. Benito, B.; Solana, J.; Moreno, M.R. Assessing the efficiency of local entities in the provision of public sports facilities. Int. J. Sport Financ. 2012, 7, 46–72. [Google Scholar]
  11. Hallmann, K.; Wicker, P.; Breuer, C.; Schönherr, L. Understanding the importance of sport infrastructure for participation in different sports—findings from multi-level modeling. Eur. Sport Manag. Q. 2012, 12, 525–544. [Google Scholar] [CrossRef]
  12. Casey, M.M.; Payne, W.R.; Eime, R.M. Organisational readiness and capacity building strategies of sporting organisations to promote health. Sport Manag. Rev. 2012, 15, 109–124. [Google Scholar] [CrossRef] [Green Version]
  13. Lucidarme, S.; Cardon, G.; Willem, A. A comparative study of health promotion networks: Configurations of determinants for network effectiveness. Public Manag. Rev. 2016, 18, 1163–1217. [Google Scholar] [CrossRef]
  14. Kung, S.P.; Taylor, P. The use of public sports facilities by the disabled in England. Sport Manag. Rev. 2014, 17, 8–22. [Google Scholar] [CrossRef] [Green Version]
  15. Doherty, A.; Cuskelly, G. Organizational capacity and performance of community sport clubs. J. Sport Manag. 2019, 34, 240–259. [Google Scholar] [CrossRef]
  16. Edwards, M.B. The role of sport in community capacity building: An examination of sport for development research and practice. Sport Manag. Rev. 2015, 18, 6–19. [Google Scholar] [CrossRef]
  17. Edwards, M.B.; Rowe, K. Managing sport for health: An introduction to the special issue. Sport Manag. Rev. 2019, 22, 1–4. [Google Scholar] [CrossRef]
  18. Piggin, J.; De Souza, D.L.; Furtado, S.; Milanez, M.; Cunha, G.; Louzada, B.H.; Graeff, B.; Tlili, H. Do the Olympic Games promote dietary health for spectators? An interdisciplinary study of health promotion through sport. Eur. Sport Manag. Q. 2019, 19, 481–501. [Google Scholar] [CrossRef]
  19. Berg, B.K.; Warner, S.; Das, B.M. What about sport? A public health perspective on leisure-time physical activity. Sport Manag. Rev. 2015, 18, 20–31. [Google Scholar] [CrossRef]
  20. Wicker, P.; Downward, P. Exploring spillovers between government quality and individual health production through sport and physical activity. Eur. Sport Manag. Q. 2017, 17, 244–264. [Google Scholar] [CrossRef] [Green Version]
  21. Hills, S.; Walker, M.; Barry, A.E. Sport as a vehicle for health promotion: A shared value example of corporate social responsibility. Sport Manag. Rev. 2019, 22, 126–141. [Google Scholar] [CrossRef]
  22. De Borger, B.; Kerstens, K. Cost efficiency of Belgian local governments: A comparative analysis of FDH, DEA, and econometric approaches. Reg. Sci. Urban Econ. 1996, 26, 145–170. [Google Scholar] [CrossRef]
  23. Geys, B.; Moesen, W. Exploring sources of local government technical inefficiency: Evidence from Flemish municipalities. Public Financ. Manag. 2009, 9, 1–19. [Google Scholar]
  24. Minister of Education and Republic of China (Taiwan). Major Policies. Ministry of Education, Republic of China (Taiwan), 12 August. Available online: https://english.moe.gov.tw/lp-48-1.html (accessed on 12 October 2017).
  25. Bastow, S.; Patrick, D.; Jane, T. The Impact of the Social Sciences: How Academics and Their Research Make a Difference, 1st ed.; Sage: London, UK, 2014. [Google Scholar]
  26. Sport Administration, Minister of Education, and Republic of China (Taiwan). Taiwan i Sport Program. Sport White Book 2017, 1 March. Available online: https://www.sa.gov.tw/Resource/Other/f1519884489390.pdf (accessed on 12 September 2017).
  27. Sport Administration, Minister of Education, and Republic of China (Taiwan). Sport Statistics. Sport Statistics, 13 April. Available online: https://www.sa.gov.tw/ebook/List?id=12&n=169 (accessed on 12 October 2019).
  28. Sport Administration, Minister of Education, and Republic of China (Taiwan). A Survey of the Existing Sports Situation in Taiwan. Statistics of the Existing Sports Situation in Taiwan, 5 August. Available online: https://isports.sa.gov.tw/Apps/TIS08/TIS0801M_01V1.aspx?MENU_CD=M07&ITEM_CD=T01&MENU_PRG_CD=12&LEFT_MENU_ACTIVE_ID=26 (accessed on 22 October 2019).
  29. Charnes, A.; Cooper, W.W.; Rhodes, E. Measuring the efficiency of decision making units. Eur. J. Oper. Res. 1978, 2, 429–444. [Google Scholar] [CrossRef]
  30. Chen, C.H.; Lin, W.B.; Yang, S.C.; Hsiao, R. Multiple criteria decision-making: A novel applications of network DEA model. Processes 2020, 8, 1482. [Google Scholar] [CrossRef]
  31. Banker, R.D.; Charnes, A.; Cooper, W.W. Some models for estimating technical and scale inefficiencies in data envelopment analysis. Manag. Sci. 1984, 30, 1078–1092. [Google Scholar] [CrossRef] [Green Version]
  32. Simar, L.; Wilson, P.W. Estimation and inference in two-stage, semi-parametric models of production processes. J. Econom. 2007, 136, 31–64. [Google Scholar] [CrossRef]
  33. Dallmeyer, S.; Wicker, P.; Breuer, C. How an aging society affects the economic costs of inactivity in Germany: Empirical evidence and projections. Eur. Rev. Aging Phys. Act. 2017, 14, 1–9. [Google Scholar] [CrossRef] [PubMed] [Green Version]
  34. Lera-López, F.; Wicker, P.; Downward, P. Does government spending help to promote healthy behavior in the population? Evidence from 27 European countries. J Public Health. 2016, 38, e5–e12. [Google Scholar] [CrossRef] [Green Version]
  35. Sam, M.P. The public management of sport. Public Manag. Rev. 2009, 11, 499–514. [Google Scholar] [CrossRef]
  36. Christiansen, N.V.; Kahlmeier, S.; Racioppi, F. Sport promotion policies in the European Union: Results of a contents analysis. Scand. J. Med. Sci. Sports 2012, 24, 428–438. [Google Scholar] [CrossRef] [PubMed]
  37. Kokolakakis, T.; Lera-López, F.; Castellanos, P. Regional differences in sports participation: The case of local authorities in England. Int. J. Sport Financ. 2014, 9, 149–171. [Google Scholar]
Figure 1. The network Data Envelopment Analysis (DEA) model of sports promotion in 22 administrative districts in Taiwan.
Sustainability 13 09390 g001
Figure 2. The trends for the efficiency of sports promotion in the 22 administrative districts from 2011 to 2018.
Sustainability 13 09390 g002
Table 1. Descriptive statistics of input–output indicators of SBP from 2016 to 2018 (n = 66).
MaxMinAverageSD
Funds (NTD)8,115,196,905.0035,047,100.00773,998,309.001,652,252,178.00
Average funds (NTD)4689.25108.64721.85837.86
Human resources (person)466.009.0062.5280.05
Average exercise frequency per week (time)4.333.383.760.24
Average exercise time (minute)72.5150.9160.533.96
Exercise intensity (%)50.8039.2043.752.89
Walk time to sport venue (minute)0.170.070.110.02
Table 2. Descriptive statistics of input–output indicators of SIP from 2016 to 2018 (n = 66).
MaxMinAverageSD
Funds (NTD)8,115,196,905.0035,047,100.00773,998,309.001,652,252,178.00
Average funds (NTD)4689.25108.64721.85837.86
Human resources (person)466.009.0062.5280.05
Host sports activities ratio (%)76.6028.3037.9011.80
Frequency of receiving sports promotion (%)46.9018.2027.237.87
Satisfaction with sports facilities (%)76.3740.2057.278.05
Construction of sports facilities (%)73.9043.9059.806.34
Satisfaction with life (%)85.5071.5674.793.44
Table 3. Descriptive statistics of input–output indicators for the efficiency of sports promotion from 2016 to 2018 (n = 66).
MaxMinAverageSD
Sports behavior promotion (efficiency value)10.100.670.27
Sports information promotion (efficiency value)10.110.650.27
Regular exercise population (%)41.0029.033.492.51
BMI values (%)40.630.937.72.36
Table 4. The efficiency of sports promotion in 22 administrative districts from 2011 to 2018.
Rank20182017201620152014201320122011
DMUScoreDMUScoreDMUScoreDMUScoreDMUScoreDMUScoreDMUScoreDMUScore
1TPC1.000TPC1.000TPC1.000NTC1.000TPC1.000KOC1.000TPC1.000KOC1.000
2TYC0.504CHCO0.468NTC0.363TPC1.000NTC0.832TPC1.000PTCO0.865PTCO0.748
3TNC0.442LCCO0.462TYC0.268TNC0.941KLC0.607NTC0.752KOC0.785TPC0.697
4KOC0.403TYC0.447TCC0.238KLC0.728HCC0.594PTCO0.662NTC0.647TNC0.691
5TCC0.343TCC0.344CHCO0.199KOC0.669TCC0.447KLC0.388TCC0.490LCCO0.653
6KMCO0.281PHCO0.231PTCO0.199TCC0.641CHCO0.406CYC0.332TYC0.458NTC0.561
7CHCO0.263CYCO0.204KLC0.194KMCO0.628KMCO0.401LCCO0.329CHCO0.451ILCO0.496
8KLC0.246KMCO0.190KOC0.183TYC0.610TYC0.367MLCO0.326YLCO0.405CHCO0.484
9NTC0.236YLCO0.185HCC0.180HCC0.551HSCO0.354HSCO0.316KLC0.350TCC0.479
10PHCO0.222NTC0.181HLCO0.163CHCO0.493HLCO0.334TNC0.314ILCO0.345KLC0.414
11HCC0.202HLCO0.176TNC0.154MLCO0.429MLCO0.323KMCO0.302TTCO0.332TTCO0.413
12CYCO0.189ILCO0.157CYCO0.129HSCO0.414YLCO0.322HCC0.301MLCO0.318HLCO0.368
13HLCO0.169KLC0.151MLCO0.128CYC0.409TTCO0.321TYC0.293PHCO0.276YLCO0.367
14CYC0.168MLCO0.151HSCO0.126HLCO0.400KOC0.316HLCO0.246LCCO0.268TYC0.341
15MLCO0.159CYC0.134LCCO0.125YLCO0.357CYC0.289NTCO0.245HCC0.265PHCO0.340
16HSCO0.148KOC0.122TTCO0.121ILCO0.351NTCO0.280PHCO0.244HLCO0.263KMCO0.336
17ILCO0.146HCC0.116KMCO0.120TTCO0.334TNC0.267TTCO0.236KMCO0.244CYC0.299
18LCCO0.142TNC0.116PHCO0.119LCCO0.258PHCO0.229ILCO0.230NTCO0.222CYCO0.283
19TTCO0.127HSCO0.113CYC0.118PHCO0.246PTCO0.223TCC0.210CYC0.220HSCO0.279
20PTCO0.120TTCO0.103YLCO0.116NTCO0.238CYCO0.204CHCO0.204TNC0.212NTCO0.273
21NTCO0.115PTCO0.100NTCO0.114PTCO0.233ILCO0.202YLCO0.193HSCO0.212MLCO0.260
22YLCO0.103NTCO0.098ILCO0.113CYCO0.226LCCO0.196CYCO0.187CYCO0.196HCC0.242
Taipei = TPC; New Taipei City = NTC; Taoyuan = TYC; Taichung = TCC; Tainan = TNC; Kaohsiung = KOC; Keelung = KLC; Hsinchu = HCC; Chiay i = CYC; Hsinchu County = HSCO; Miaoli County = MLCO; Changhua County = CHCO; Nantou County = NTCO; Yunlin County = YLCO; Chiayi County = CYCO; Pingtung County = PTCO; Ilan County = ILCO; Hualien County = HLCO; Taitung County = TTCO; Penghu County = PHCO; Kinmen County = KMCO; Lienchiang County = LCCO.
Table 5. Environmental variables affecting the efficiency of sports promotion in the 22 administrative districts from 2016–2018 (n = 66).
VariableCoefficientSDt Value
Constant−0.830.48−1.72
Funds0.01 ***0.004.99
Human resources0.000.001.66
Average funds0.000.000.06
Average exercise frequency per week0.040.070.56
Average exercise time0.000.00−0.83
Exercise intensity0.010.001.19
Host sports activities ratio0.000.000.59
Frequency of receiving sports promotion0.000.001.29
Satisfaction with sports facilities0.000.00−1.43
Construction of sports facilities0.000.00−0.05
Satisfaction with life index0.01 **0.002.07
Walk time to sport venue−0.531.18−0.45
Regular exercise population0.000.01−0.42
BMI12.03 **5.272.28
Note: The numbers in the table represent the average for each team after sampling 2000 times with bootstrapping; *** and ** denote 1% and 5% significance levels, respectively.
Publisher’s Note: MDPI stays neutral with regard to jurisdictional claims in published maps and institutional affiliations.

