1. Introduction
Sustainability is a desired goal of development and environmental management [
1]. This term has been very popular in environmental policy and is now widely used in various fields including economy, energy, and society. Sustainable society is an aspect of regional planning, which Brown [
2] defined as “an enduring one, self-reliant and less vulnerable to external forces.” Sustaining or growing a population is essential for the self-reliance of regions given that the population is the key variable in a regional or urban plan [
3]. In particular, the population size in rural regions is an important factor to maintain regional society.
Although the most important and basic element defining a geographic region is the population, the population is unevenly distributed among regions within countries. This population distribution or regional population reflects the natural, cultural, social, and economic conditions of the community [
4]. Thus, understanding detailed demographic information is critical for many reasons. The demographics of the population of regions and countries can influence the political power and strength because the population can deeply affect economic performance, resource consumption, and environmental conditions. In addition, the geographical patterns and the degree of population concentration determine urban-rural structures, infrastructure systems, and landscapes [
5].
Demographic change is an important challenge for regional development together with the globalization technological shift and climate change [
6]. Most countries have experienced unprecedented rapid demographic changes with the huge expansion in global population (four billion individuals since 1950 [
7] and the new and varied fertility patterns (including adolescent maternity), mortality, migration, urbanization, and aging [
8]. South Korea, Japan, and China have been the most dynamic and fastest-growing countries in the world over the past 50 years, but the recent demographic transition to low -birth and low-death rates, aging, and declining population has affected the economics and social structures of these countries. Japan has already experienced a population decline, so important social issues include aging, a low birthrate, regional declines, and local extinction [
9,
10].
South Korea has also experienced a rapid demographic transition. In 2020, the number of newborns in South Korea fell below the number of deaths. The United Nations (UN) forecasted that Korea will experience the fastest declining population in the next 50 years, at which point it will become the only country in the Organization for Economic Co-operation and Development (OECD) with more seniors than working adults. The imbalance of regional population distribution is also a concern, particularly for the rural area. The rural demographic changes and unbalanced population distribution have raised public concern about the risks of regional shrinkage and depopulation. Population decline and aging are expected to intensify and lead to a decline in the functioning of local cities and the old downtown areas of metropolitan cities because more than half (50%) of the Korean population live in the Seoul metropolitan area. Given these dramatic changes, population decline and aging including the demographic structure are very important issues for South Korea.
With concerns about the extinction of local cities and the hollowing out of rural communities, the demand for new population indices or indicators to evaluate the current state of the local population has increased in South Korea. Scholars have used various demographic indicators to represent regional populations, but these indicators have limitations. They do not effectively show the regional shrinkage because they represent only a part of the age structure. The local extinction-risk index proposed by Lee [
11] was recently introduced and received much attention. Lee’s new indicator considers both the older population and the female childbearing-age population aged based on Masuda’s explanation of “regional extinction” [
9]. However, Lee’s indicator has been criticized for only considering population growth due to childbirth and is not significantly different from existing indices. Thus, there is an urgent need for a new regional index to assess and compare regional shrinkage due to population decline to inform the Korean government on enacting laws to support policies related to shrinking regions and under- or depopulated regions [
12].
The aim of this study was to develop a vulnerability index with the age structure following regional shrinkage, which is a major factor in population change. The specific aims of this study were to (1) analyze population changes in Korea with existing demographic indicators, (2) develop a new index reflecting the age structure of the population (3) apply the new index to the evaluation of regional populations, and (4) analyze the relationship of the new index with other demographic indicators to determine the suitability of the new index. Recently, the term “regional shrinkage” has replaced the older terms including “decline,” “decay,” “blight,” “abandonment,” “dis-urbanization,” “urban crisis,” and “demographic depression” [
13]. A shrinking region is defined as a region that is losing a significant proportion of its population over a period greater than or equal to one generation [
14]. In this study, regional shrinkage refers to hollowing out of a region due to depopulation.
2. Materials and Methods
2.1. Data
The study area of this paper is the entire country of South Korea, which consists of nine provinces and seven cities, including the capital Seoul. Cities and provinces were subdivided into smaller entities (cities, counties, districts) that were defined as communities or local jurisdictions. As of 2015, the local jurisdictions of South Korea included 229 local communities: 77 cities, 82 counties, 69 districts, and Sejong special autonomous city. Our analysis of population indices was performed at the scale of city, county, and district.
Population data and land-use data were used for the estimation of regional shrinkage (hollowing out). Analysis data was collected from the population statistics based on resident registration and cadastral statistics of Statistics Korea [
1]. Population data by region, gender, and age, and built-up land areas were reconstructed for analysis. And we set the analysis period from 2010 to 2019 for the country’s population change status and used data for 2015 and 2019 to evaluate and compare the status of each region.
2.2. Korea’s National Population Situation
2.2.1. Population Size and Density
The most widely used demographic indicator is the population size, which expresses the current state of the population of a region. The population size is the number of individuals based on the unit space of the administrative district or the number of individuals distributed in the unit space of a grid. Population density is a method of measuring the distribution of the population. It is a quantity representing how dense the population is in a certain area and is expressed as the number of individuals/land area. It represents a more complete demographic description than population size.
In Korea, administrative districts are determined based on the size of the population and there are regional differences in the size of districts. The population density index is therefore a more useful indicator. Because 70% of the country is mountainous and these non-residential areas are distributed within administrative districts, the actual population density should be measured by excluding the non-residential areas. In this study, the population density was determined based on the built-up land area.
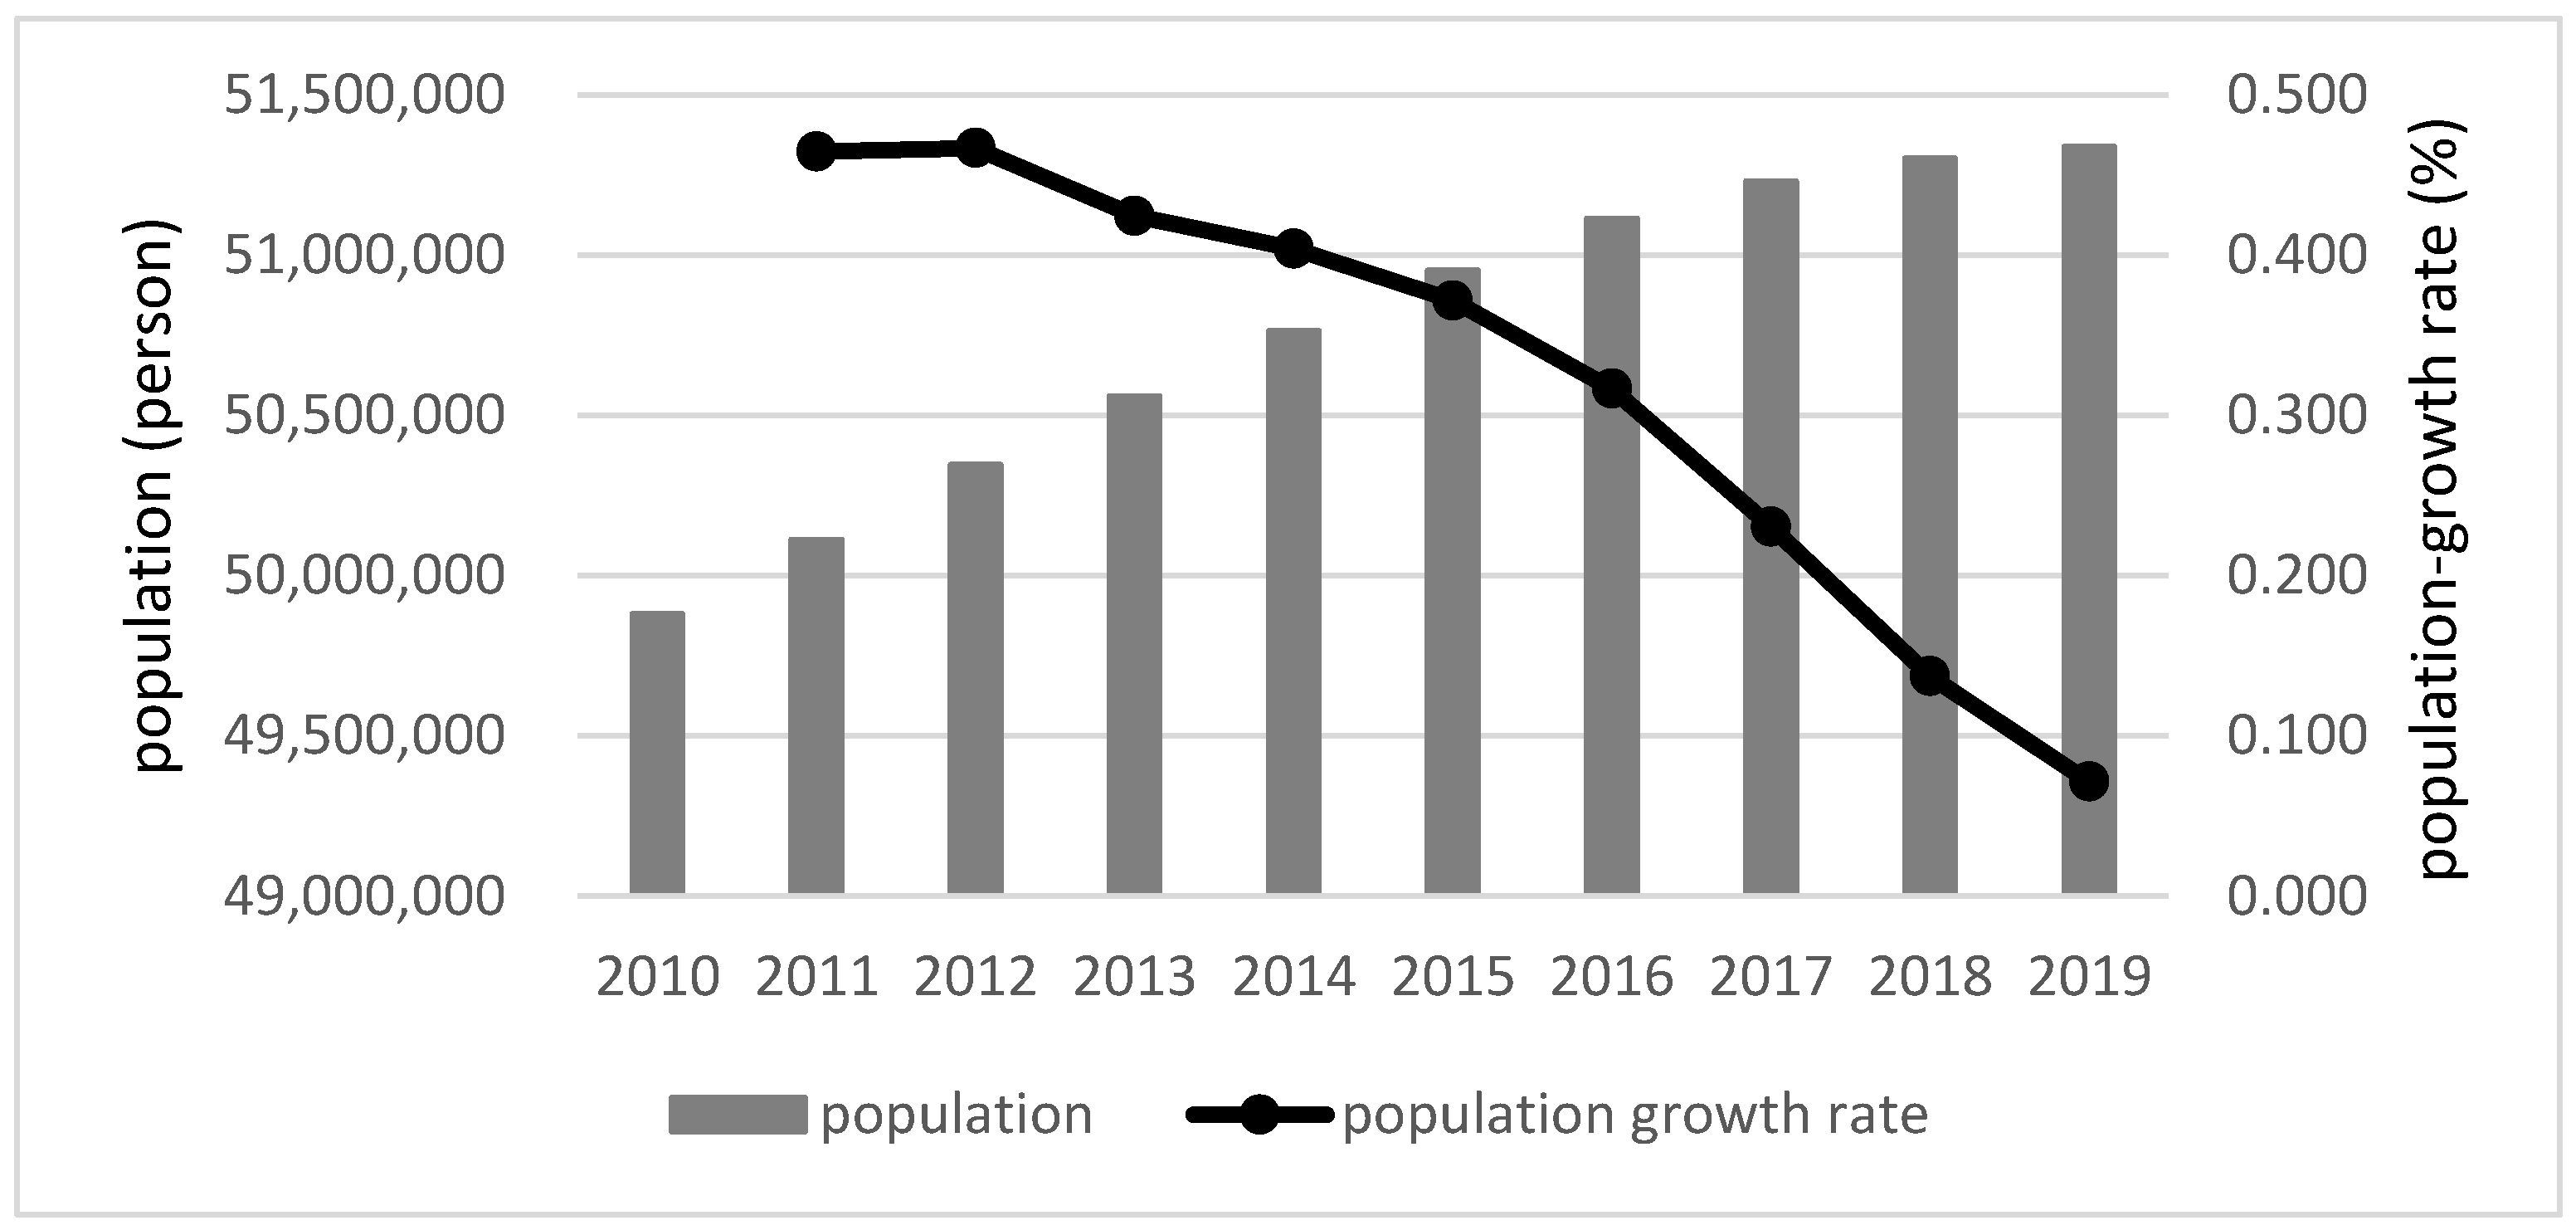
The population of Korea continuously increased over the study period (49,879,812 person in 2010, 50,951,719 persons in 2015, and 51,337,424 persons in 2019).
Figure 1 shows that the population is still increasing, but the rate of growth is slowing. It can be seen that the pace of population growth has slowed significantly since 2017.
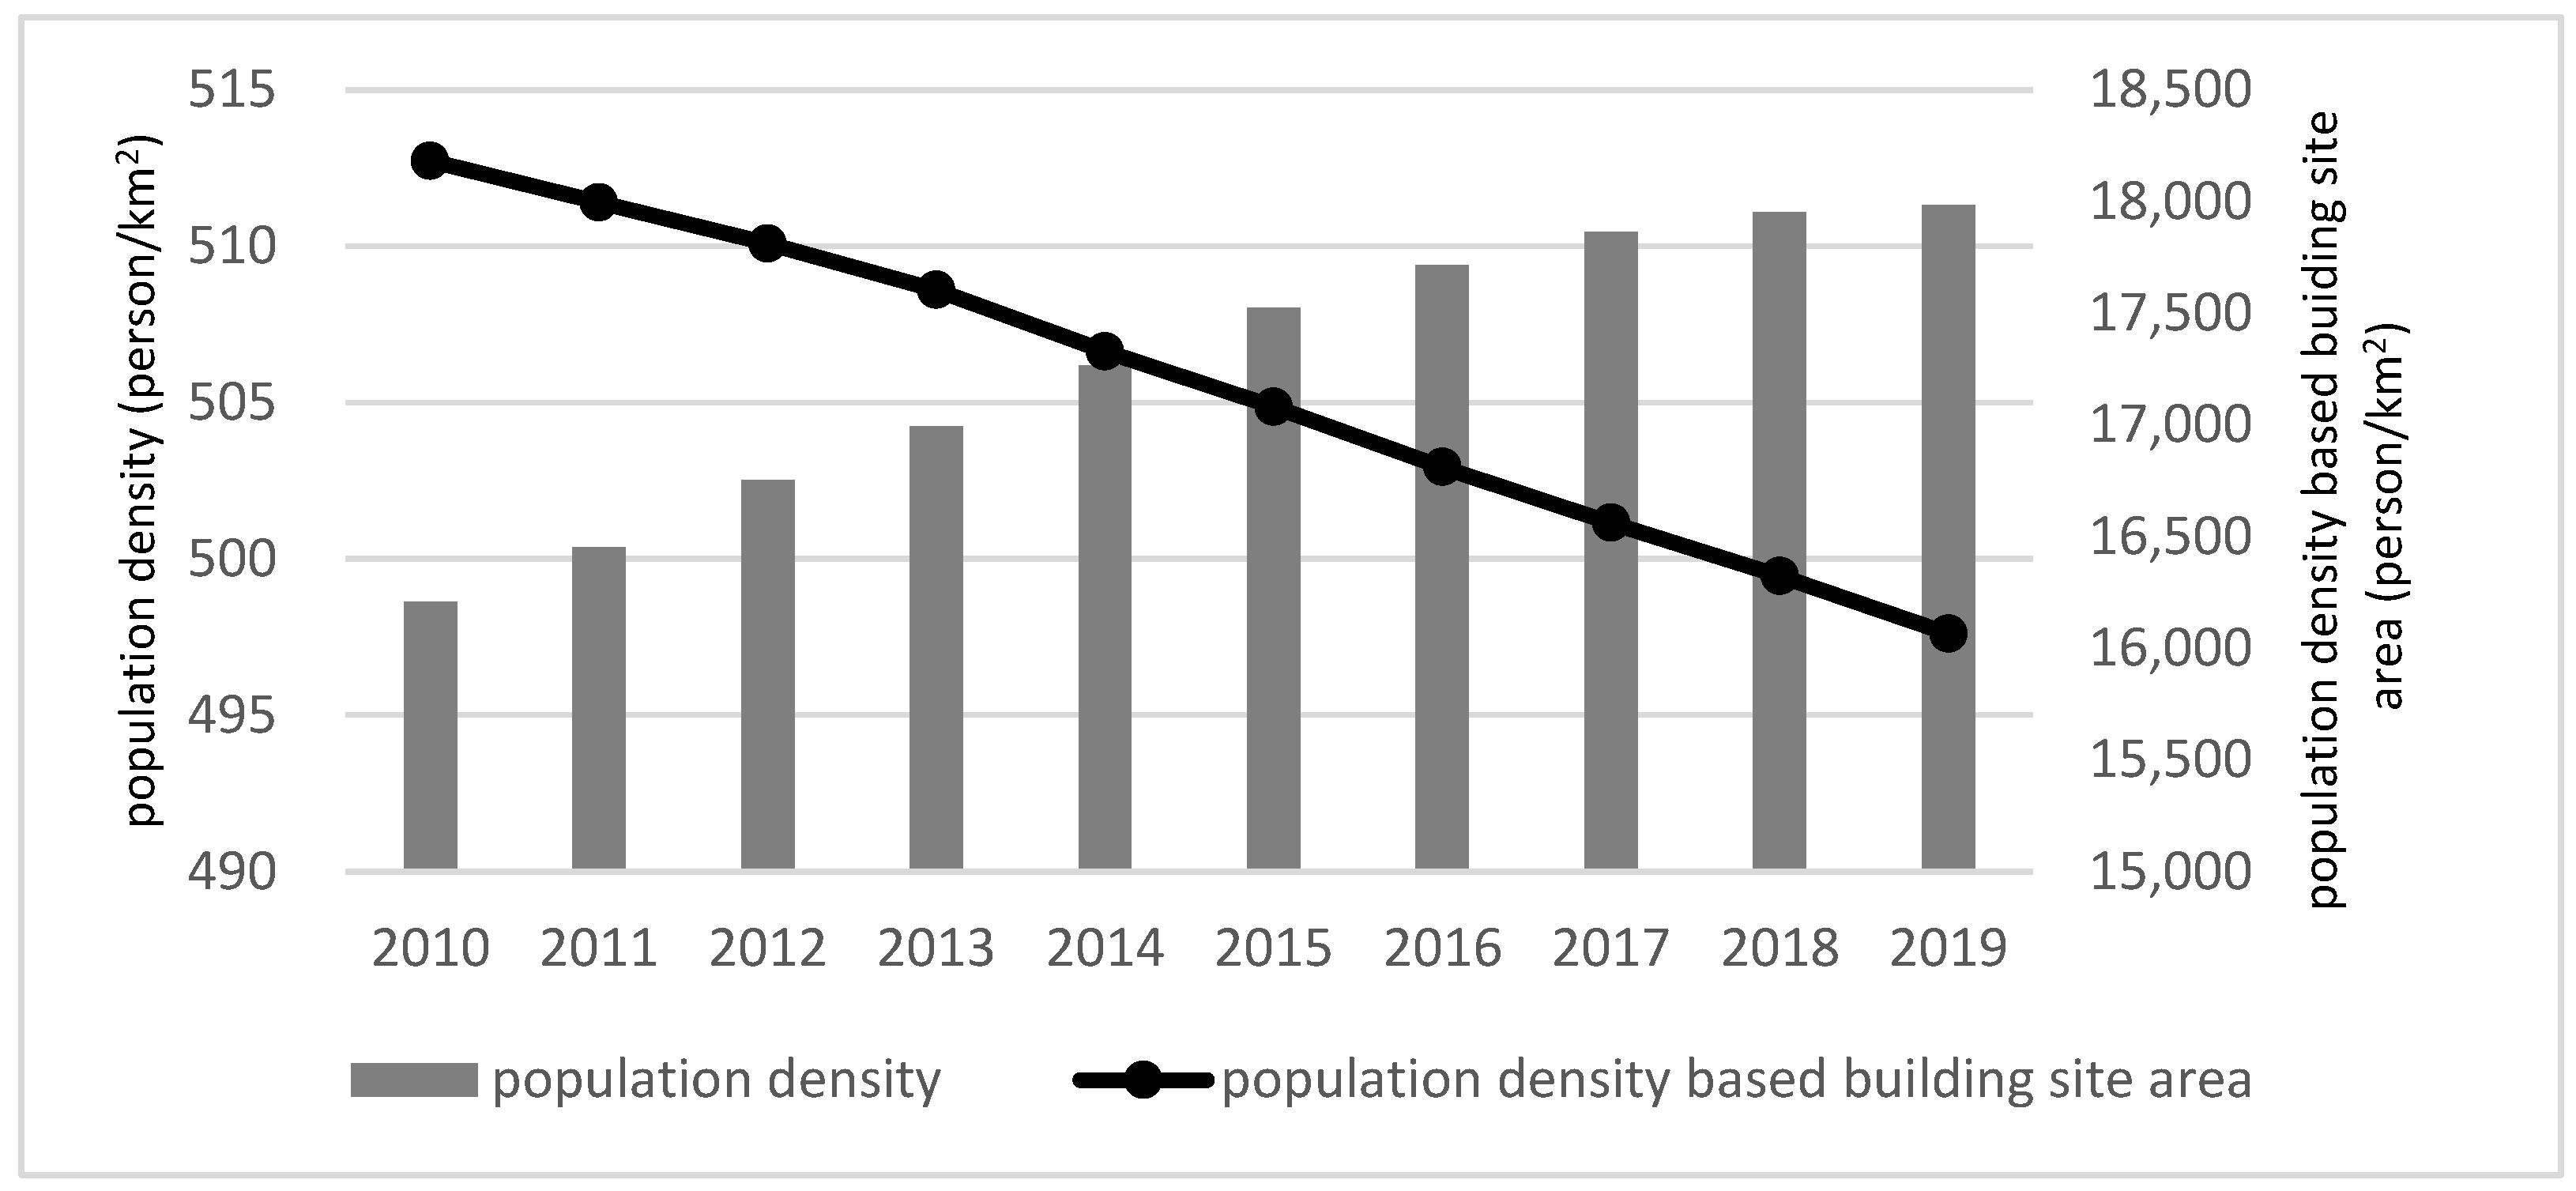
Because the country’s land area has hardly changed, the population density has increased as the number of people has increased. However, the land-use pattern is changing, with the built-up area of Korea increasing from 2710 km
2 in 2010 to 2983 km
2 in 2015 and 3196 km
2 in 2019. As the land area has hardly changed, the population density has increased with the increase of population; however, the population density based on the area of built-up land has decreased due to the increase in the built-up area (
Figure 2).
2.2.2. Age Structure
Age structure is the most widely used demographic parameter to represent the distribution of age classes and to estimate current and future population growth. There are many age structure indicators: the aging rate, youth dependency ratio, elderly dependency ratio, and aging index.
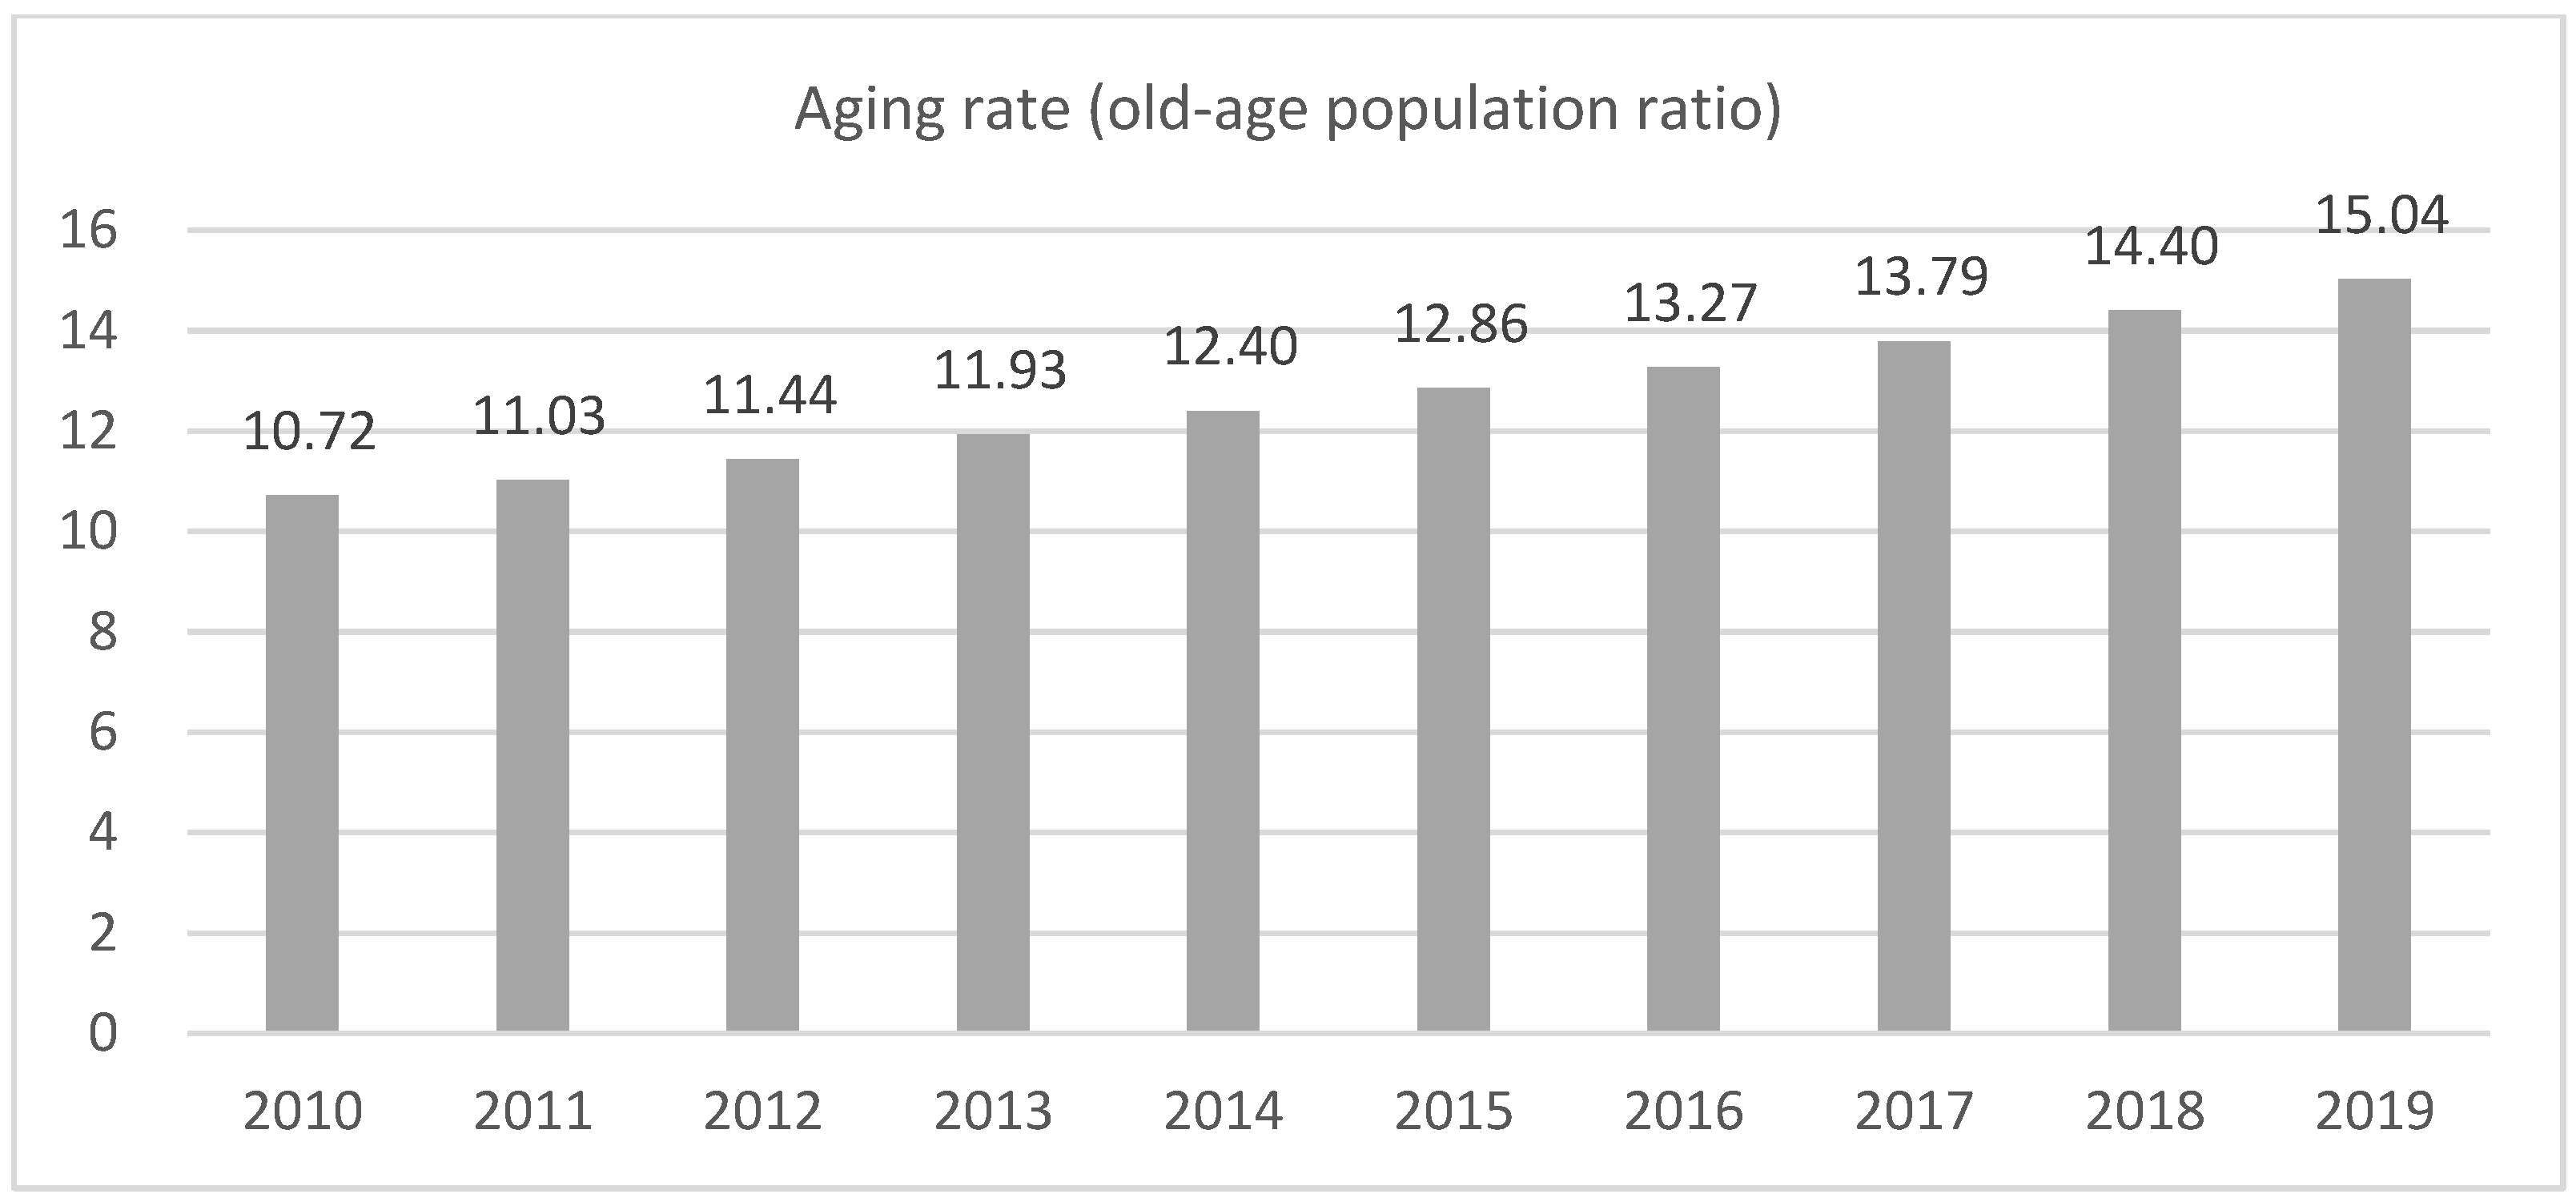
The aging rate (the percentage of older persons) is used to determine the degree to which a country or region is aging, and can be used to define an aging society, an ultra-aged society, and an ultra-ultimate society. According to UN standards, an aging society is defined as a country or region in which the proportion of the population aged over 65 exceeds 7%, an “aged society” is defined as a society in which the proportion of the population aged 65 or older exceeds 14%, and a superaged (or post-aged or ultra-aged) society refers to one whose older population accounts for 20% or more of the entire population. According to Statistics Korea [
15], South Korea became an aging society in 2000. At that time the share of the population aged over 65 was 7.2%. The rate increased to 10.9% in 2010 and 14.2% in 2017, which indicated a transition to an aged society (
Figure 3). Additionally, it is expected that Korea will become the world’s most aged population by 2045, with a large proportion of the population aged 65 or older.
The dependency ratio is the ratio of those typically not in the labor force (the ages 0 to 14 and 65+) to those typically in the labor force (the productive ages of 15 to 64). It is used to measure the pressure on the productive population. The elderly dependency ratio is the ratio of the number of older people at an age when they are generally economically inactive (i.e., aged 65 and over) to the number of people of working age (i.e., 15 to 64 years old). The youth dependency ratio is the ratio of the number of young people at an age when they are generally economically inactive, (i.e., under 15 years of age) to the number of people of working age (i.e., 15 to 64).
Table 1 shows the changes in the demographic structure of Korea and indicates that the country has been experiencing aging and a continuous decline in the young population. In 2010, the youth dependency ratio was 22.33 and the elderly dependency ratio was 14.69 but by 2019, the youth dependency ratio had decreased to 17.64 and the elderly dependency ratio had increased to 20.82. In addition, the increase in the elderly dependency ratio was larger than the decrease in the youth dependency ratio, so the total dependency ratio was constantly increasing over this period. In 2016, the elderly dependency ratio and the youth dependency ratio had similar values and, since 2016, the elderly dependency ratio has increased at a faster rate than in the previous years.
The aging index [
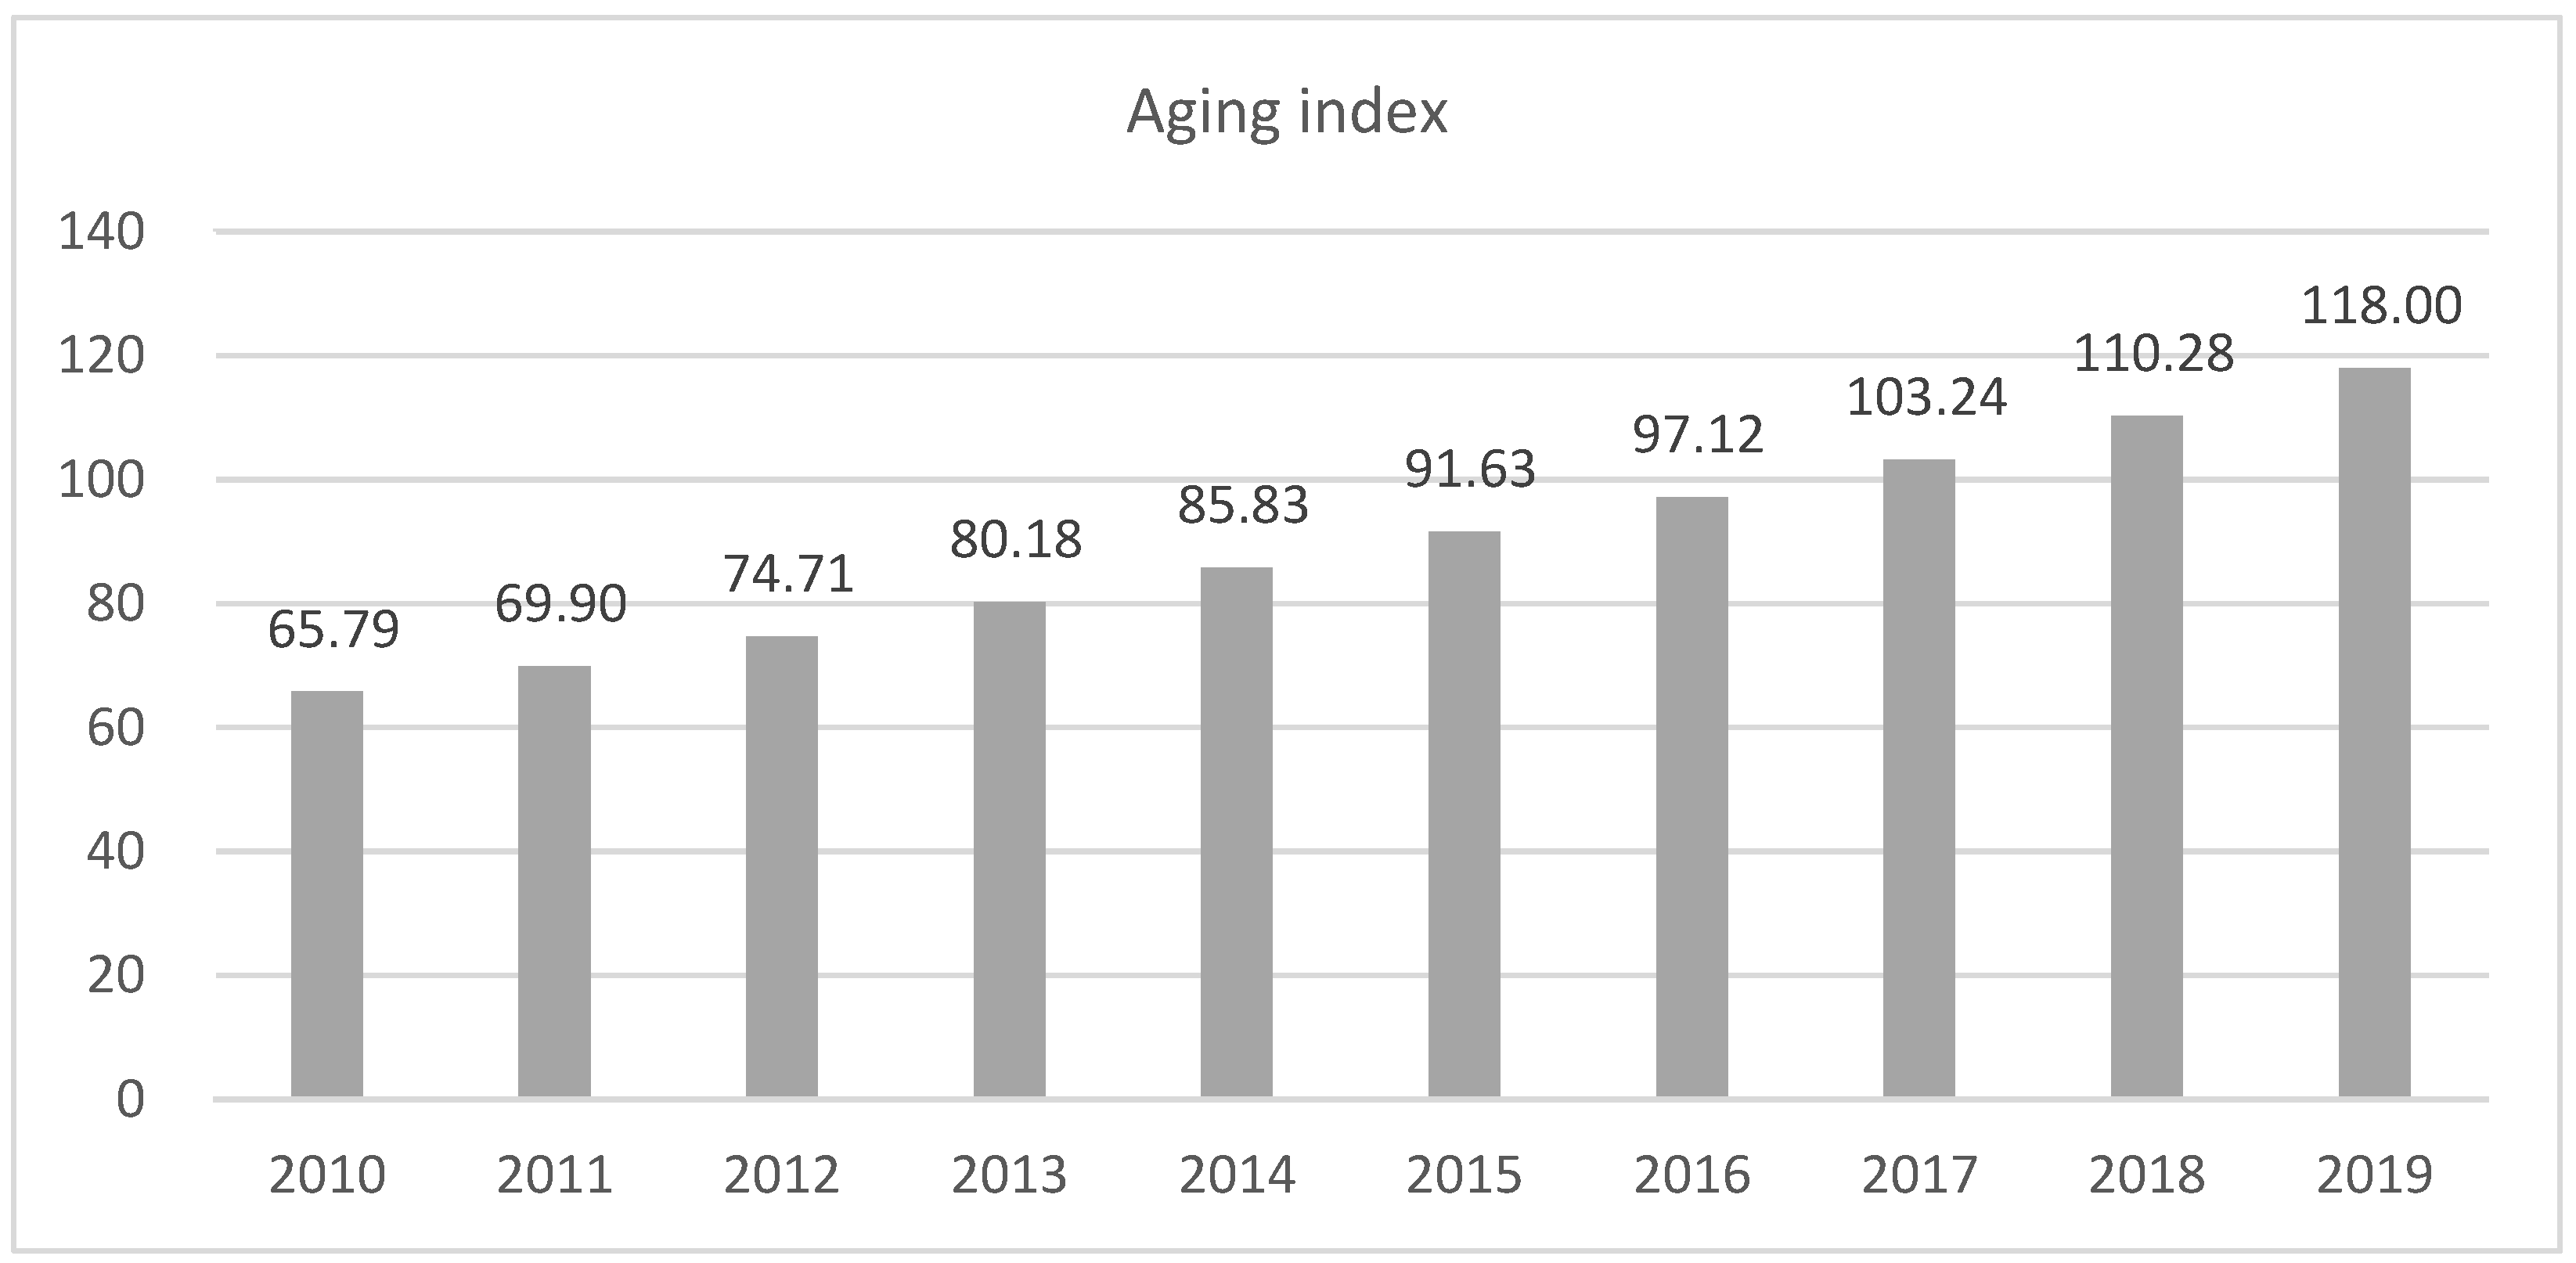
16] refers to the number of older persons per 100 persons younger than 15 years old in a specific population. The aging index is one of the most popular indicators used to determine a region’s susceptibility to aging. This index increases as the population ages. As
Figure 4 shows, the value of this index has increased in South Korea and the amount of change in each year has gradually increased over time. The aging index in 2010 was 65.79, but in 2019 it reached 118, which represented almost a doubling in 10 years.
2.2.3. Extinction-Risk Index
The index that is most frequently used to evaluate the risk of regional shrinkage in Korea is the regional extinction-risk index. The index compares the older population aged 65 and over and the female population aged between 20 and 39. If the extinction-risk index is less than 0.5, a region is considered to be entering the extinction risk stage [
11]. The extinction index value of Korea was 1.3 in 2016 and continued to decrease, reaching 0.87 in 2019 (
Table 2). This was because the aging population increased, while the population of young women decreased.
2.3. Methods
2.3.1. Study Design
An analysis was conducted using the existing well-known population indices and the newly developed index, followed by a comparison of the results of the new index with previous indicators. In the analysis using the existing population indices, we examined South Korea’s demography at the national and regional levels. The demographic indices were population, population density, population-growth rate, and dependency rates, and aging was assessed with age structure and extinction risk indices. For regional analysis, these indicators were compared to determine how much each indicator reflected the regional population change. The new index assessment consisted of suggestion, application, and validation stages.
2.3.2. Assumptions and Definition of the New Index
In this study, a new index was developed to indicate the vulnerability to regional shrinkage considering population density and population structure by age, and using ranking data and correlation analysis.
When comparing regions, it is more appropriate to use population density rather than the number of people because the differences in the area of administrative districts are large. In rural regions, agricultural and mountainous areas occupy large areas of land. It is therefore more appropriate to exclude the area where the population does not reside rather than to consider the total area of the administrative district. Therefore, in this study, an index was developed using population density based on the built-up area of each region.
The age structure of a population is an important factor in population dynamics. Age structure is the proportion of a population in different age classes. Models that incorporate age structure enable better predictions of population growth.
It is common in demographic studies to split the population into three broad age groups:
- -
Children and young adolescents (under 15 years old)
- -
The working-age population (15 to 64 years) and
- -
The old-age population (65 years and older)
The age-specific demographic structure has a great influence on the natural increase and decrease of the local population and is recognized as being important in regional economic revitalization and population outflow. In South Korea, there is a huge difference in the demographic structure of urban and non-urban areas.
Ranking data can be used to develop a comparative index between regions. Ranking data are useful for relative comparisons when there is no certain criterion.
The correlation coefficient is the cosine of the angle θ between two observed vectors in N-dimensional space (for N observations of each variable) [
17,
18]. A positive correlation coefficient means an acute angle, while a negative correlation means an obtuse angle.
The assumptions used in the development of the new index were as follows.
If the regional demographic structure is similar to the national average, the total age population-density ranking and the population-density ranking by age group will be the same.
If the old-age population-density ranking is higher than the regional population-density ranking, it will be vulnerable to regional shrinkage. The degree of vulnerability is regarded as the difference between the overall age population-density ranking and the old-age population-density ranking (vector O in
Figure 5).
If the young population-density ranking is lower than the region’s overall age population-density ranking, it will be vulnerable to regional shrinkage (vector Y in
Figure 5).
If the working-age population-density ranking is lower than the region’s overall age population-density ranking, it will be vulnerable to regional shrinkage (hollowing out) (vector W in
Figure 5).
Vulnerability by age group is regarded as a vector, with a size and direction, and the degree of vulnerability of a region is considered to be the sum of the projections of vectors Y and W onto vector O in assumption 2.
The effect of an old-age population (vector O) = ranking of population density—ranking of old-age (over 65) population density.
Effect of a young population (vector Y) = ranking of young (0–14) population density—ranking of population density.
Effect of a working population (vector W) = ranking of working-age (15–64) population density—ranking of population density.
.
2.3.3. How to Calculate the Regional Shrinkage Vulnerability Index
The process of calculating the regional shrinkage vulnerability index is as follows:
Calculating the population density of built-up areas by age group (all ages, youth, working-age, older adults).
Calculating the density ranking by age group (all age, youth, working-age, older adults): a higher density, higher ranking.
Calculate the ranking gap with the regional ranking of each age group: vector O, vector Y, vector W.
Determine the correlation coefficient* and calculate the angles between two vectors: α, β
* The correlation coefficient indicates how much the two vectors explain in the dot product of vectors and, therefore, the angle between the two vectors can be calculated through the value of the correlation coefficient.
Calculating the vulnerability index: Equation (3).
3. Results
3.1. Analysis of Demographic Indicators
3.1.1. Regional Distribution of Demographic Indicators
Although aging and population decline at the national level are serious problems, unequal distribution by region is a more serious problem. Population distribution is important in terms of spatial justice because it is difficult to expand infrastructure in regions with a small population. To compare population indicators by region, indicators were calculated using the 2019 population data for 229 regions.
Table 3 summarizes the minimum, maximum, average, and standard deviations of the demographic indicators: young population ratio, old-age population ratio, youth dependency ratio, elderly dependency ratio, aging index, and extinction-risk index. Among these indicators, the aging index had the largest variance and the extinction-risk index was distributed over a narrow range. It was also difficult to compare values between regions because the minimum, maximum, and variance of each indicator differed.
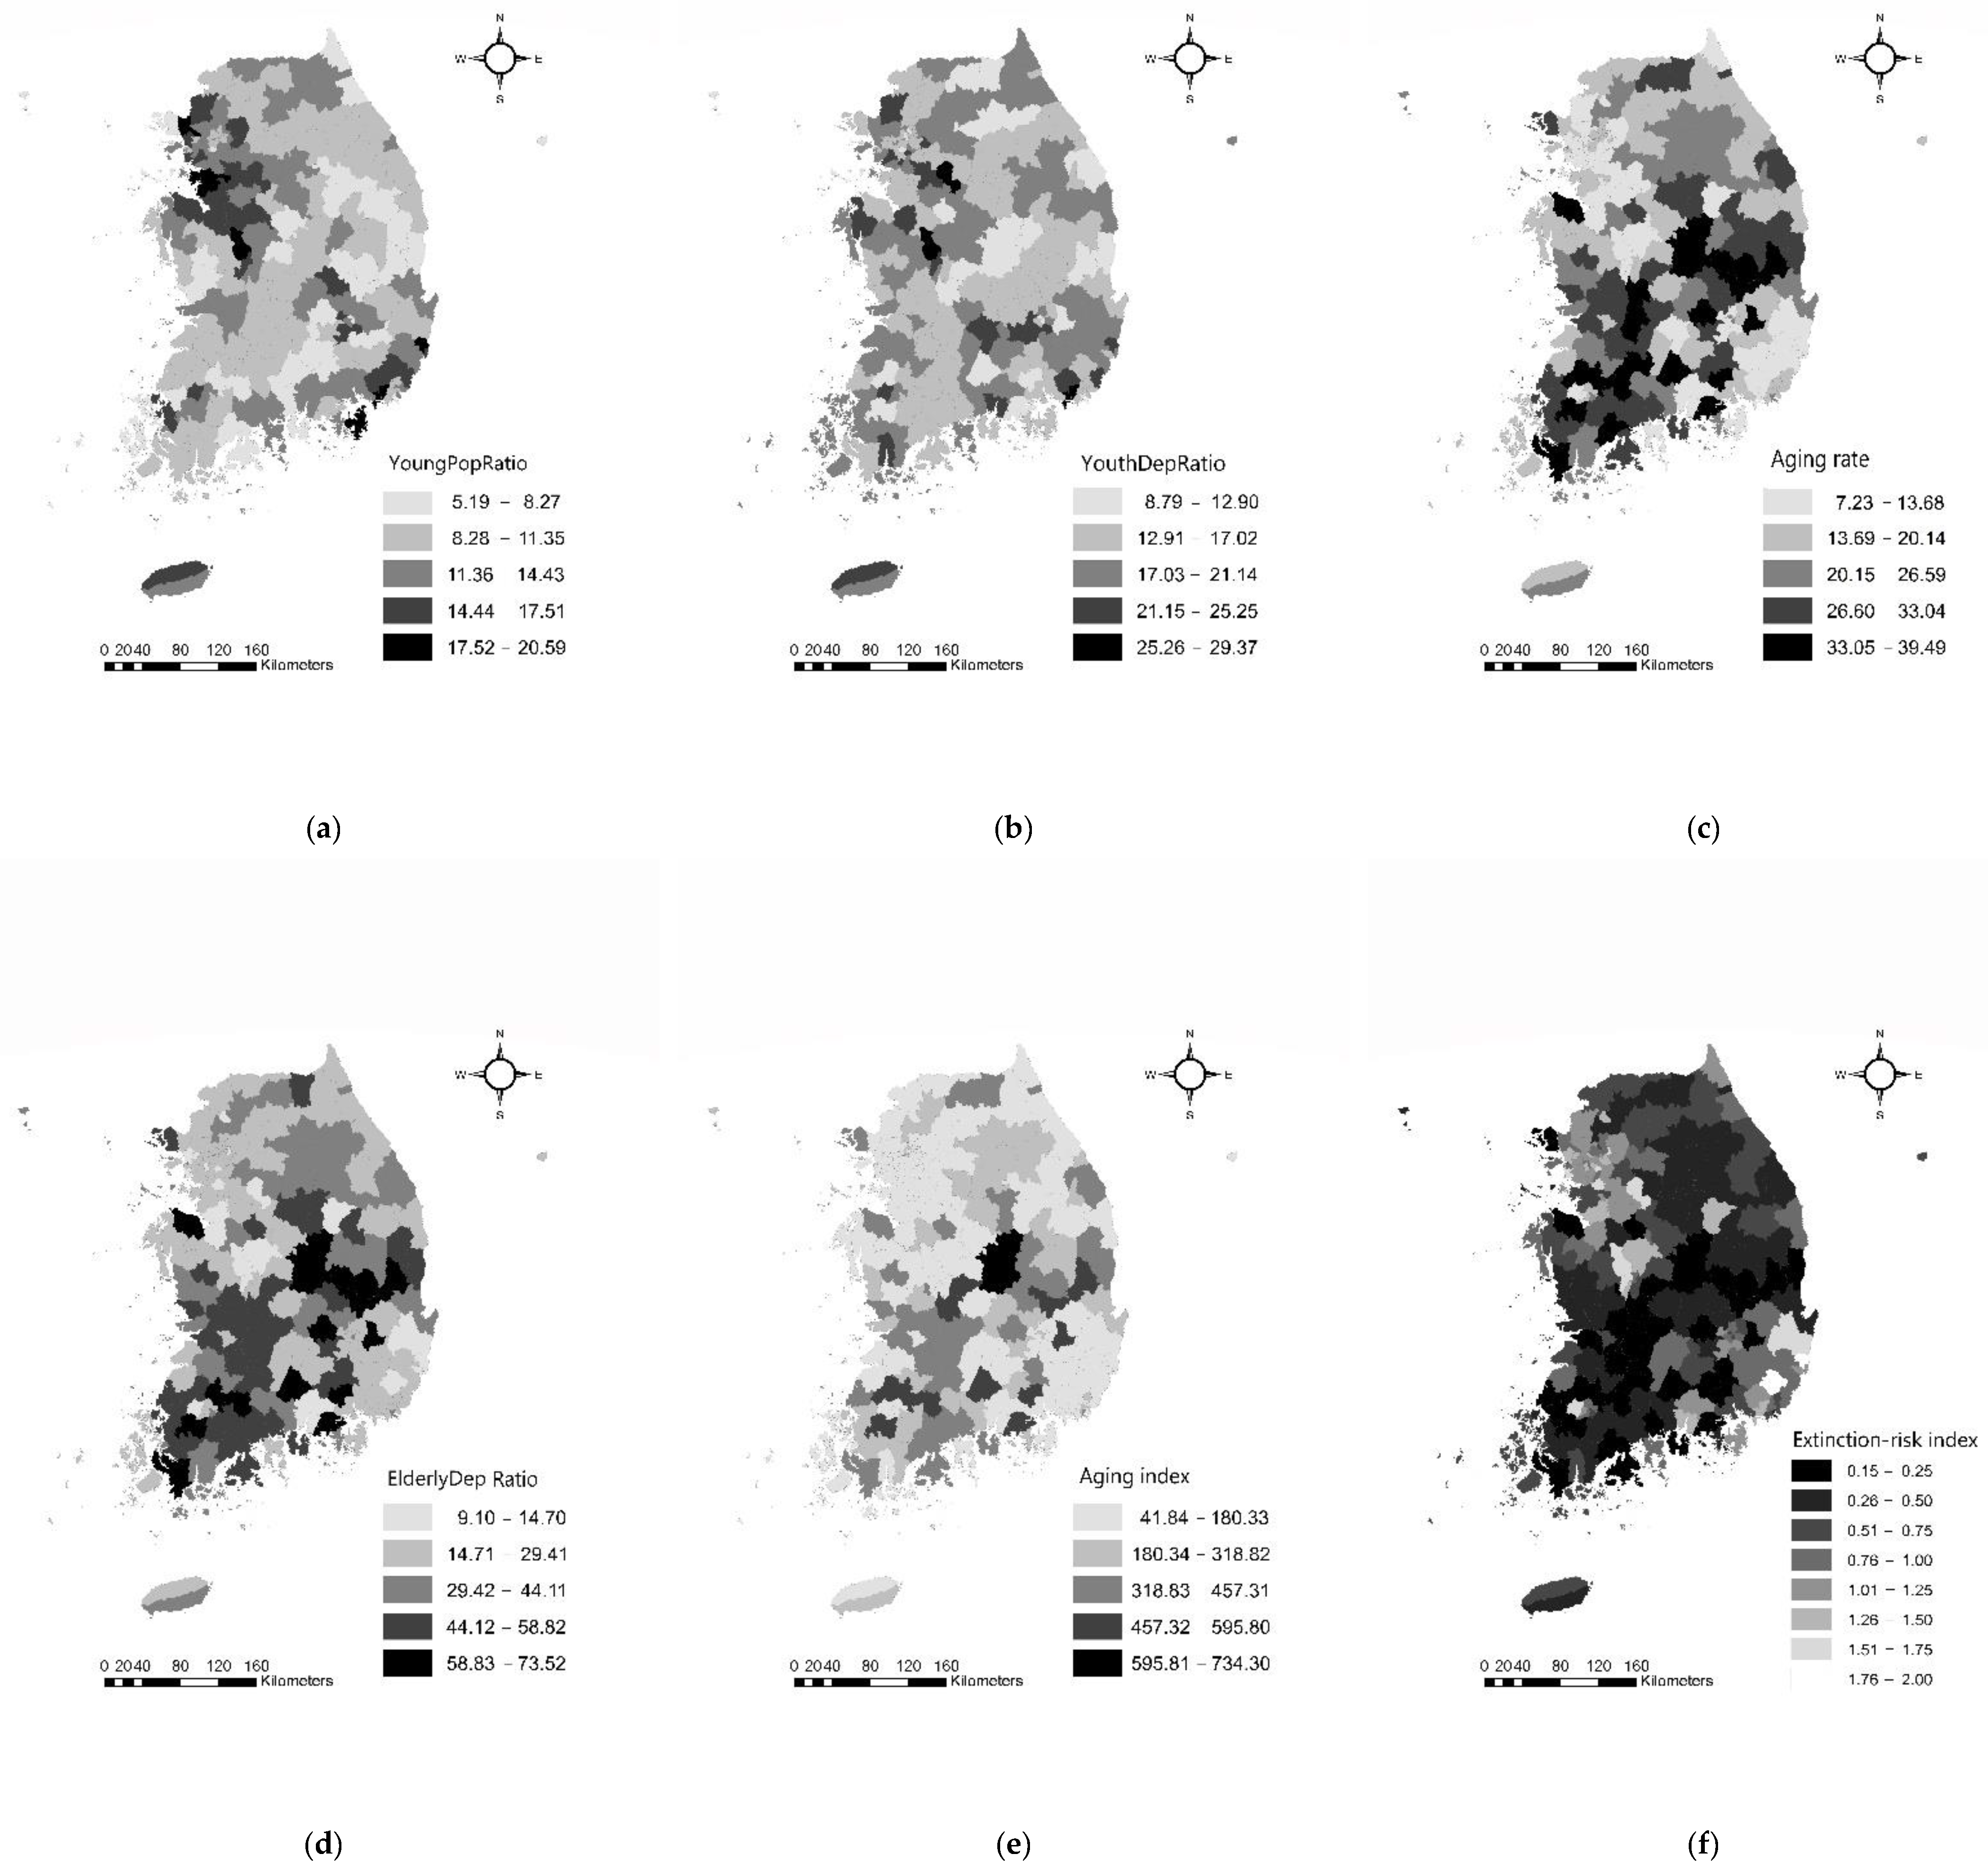
The distribution of each indicator by region was visualized at five equal intervals on an administrative district map using ArcGIS (
Figure 6a–e).
Figure 6a,b show that the young population ratio and the youth dependency ratio were high in the Seoul metropolitan area and metropolitan cities areas.
Figure 6c–e show that high values of the indicators related to the older population were distributed in a diagonal direction from the southwest to the northeast of the country. This distribution was related to the distribution of mountainous areas, which account for 70% of the South Korean land surface. The local extinction index was divided into eight areas at 0.25 intervals and displayed on a map considering the reference point of extinction, 0.5 (
Figure 6f). It was considered that there was an extinction risk in areas below 0.5 displayed black. The number of regions with an index value of 0.5 or less, which were at risk of extinction, was 86 out of 299: three regions (3.5%) in urban areas, 33 regions (38%) in small cities, and 50 regions in rural areas. It was difficult to compare the risk of hollowing out by region because the difference in the index values of the 50 county regions at risk of extinction was not large.
3.1.2. Coefficient of Variation
We examined the coefficient of variation (CV) of indicators to determine the inequality of population distribution and how much difference there was between regions. The coefficient of variation is defined as the ratio of the standard deviation to the mean. The larger the value of the CV, the greater the difference in the index value between regions. As shown in
Table 4, the CV values of the young population ratio and youth dependency ratio were small but gradually increased, while the CV values of the old-age population ratio and elderly dependency ratio were large but gradually decreased. These CV values and their changes clearly indicated a nationwide aging phenomenon, and also indicated that the distribution of the young population will become more important in the future demographic structure. The indexes that had a large CV value and the most gaps between regions were the aging index and extinction-risk index. These two indicators had similar values for 10 years with no decreasing or increasing trend.
3.1.3. Correlation Analysis
A correlation analysis was conducted based on 2019 data to examine the relationship between the indicators.
Table 5 shows the results of the correlation analysis. Indicators related to aging were strongly correlated with other indices. The correlation coefficient for the relationship between the aging index and the old-age population ratio was 0.972; while the correlation coefficient for the relationship between the aging index and the elderly dependency ratio was 0.961, and these indicators were therefore significantly positively correlated. The aging index was negatively correlated with the young population ratio (−0.482) and the youth dependency ratio (−0.76). The strongest negative relationship was found between the extinction-risk index and the elderly dependency ratio (−0.985). The correlation coefficient for the relationships between the extinction-risk index with the young population indicators was smaller than the absolute values of the old-age population indicators, suggesting that the extinction-risk index is an indicator that reflects the young population structure less than the aging index.
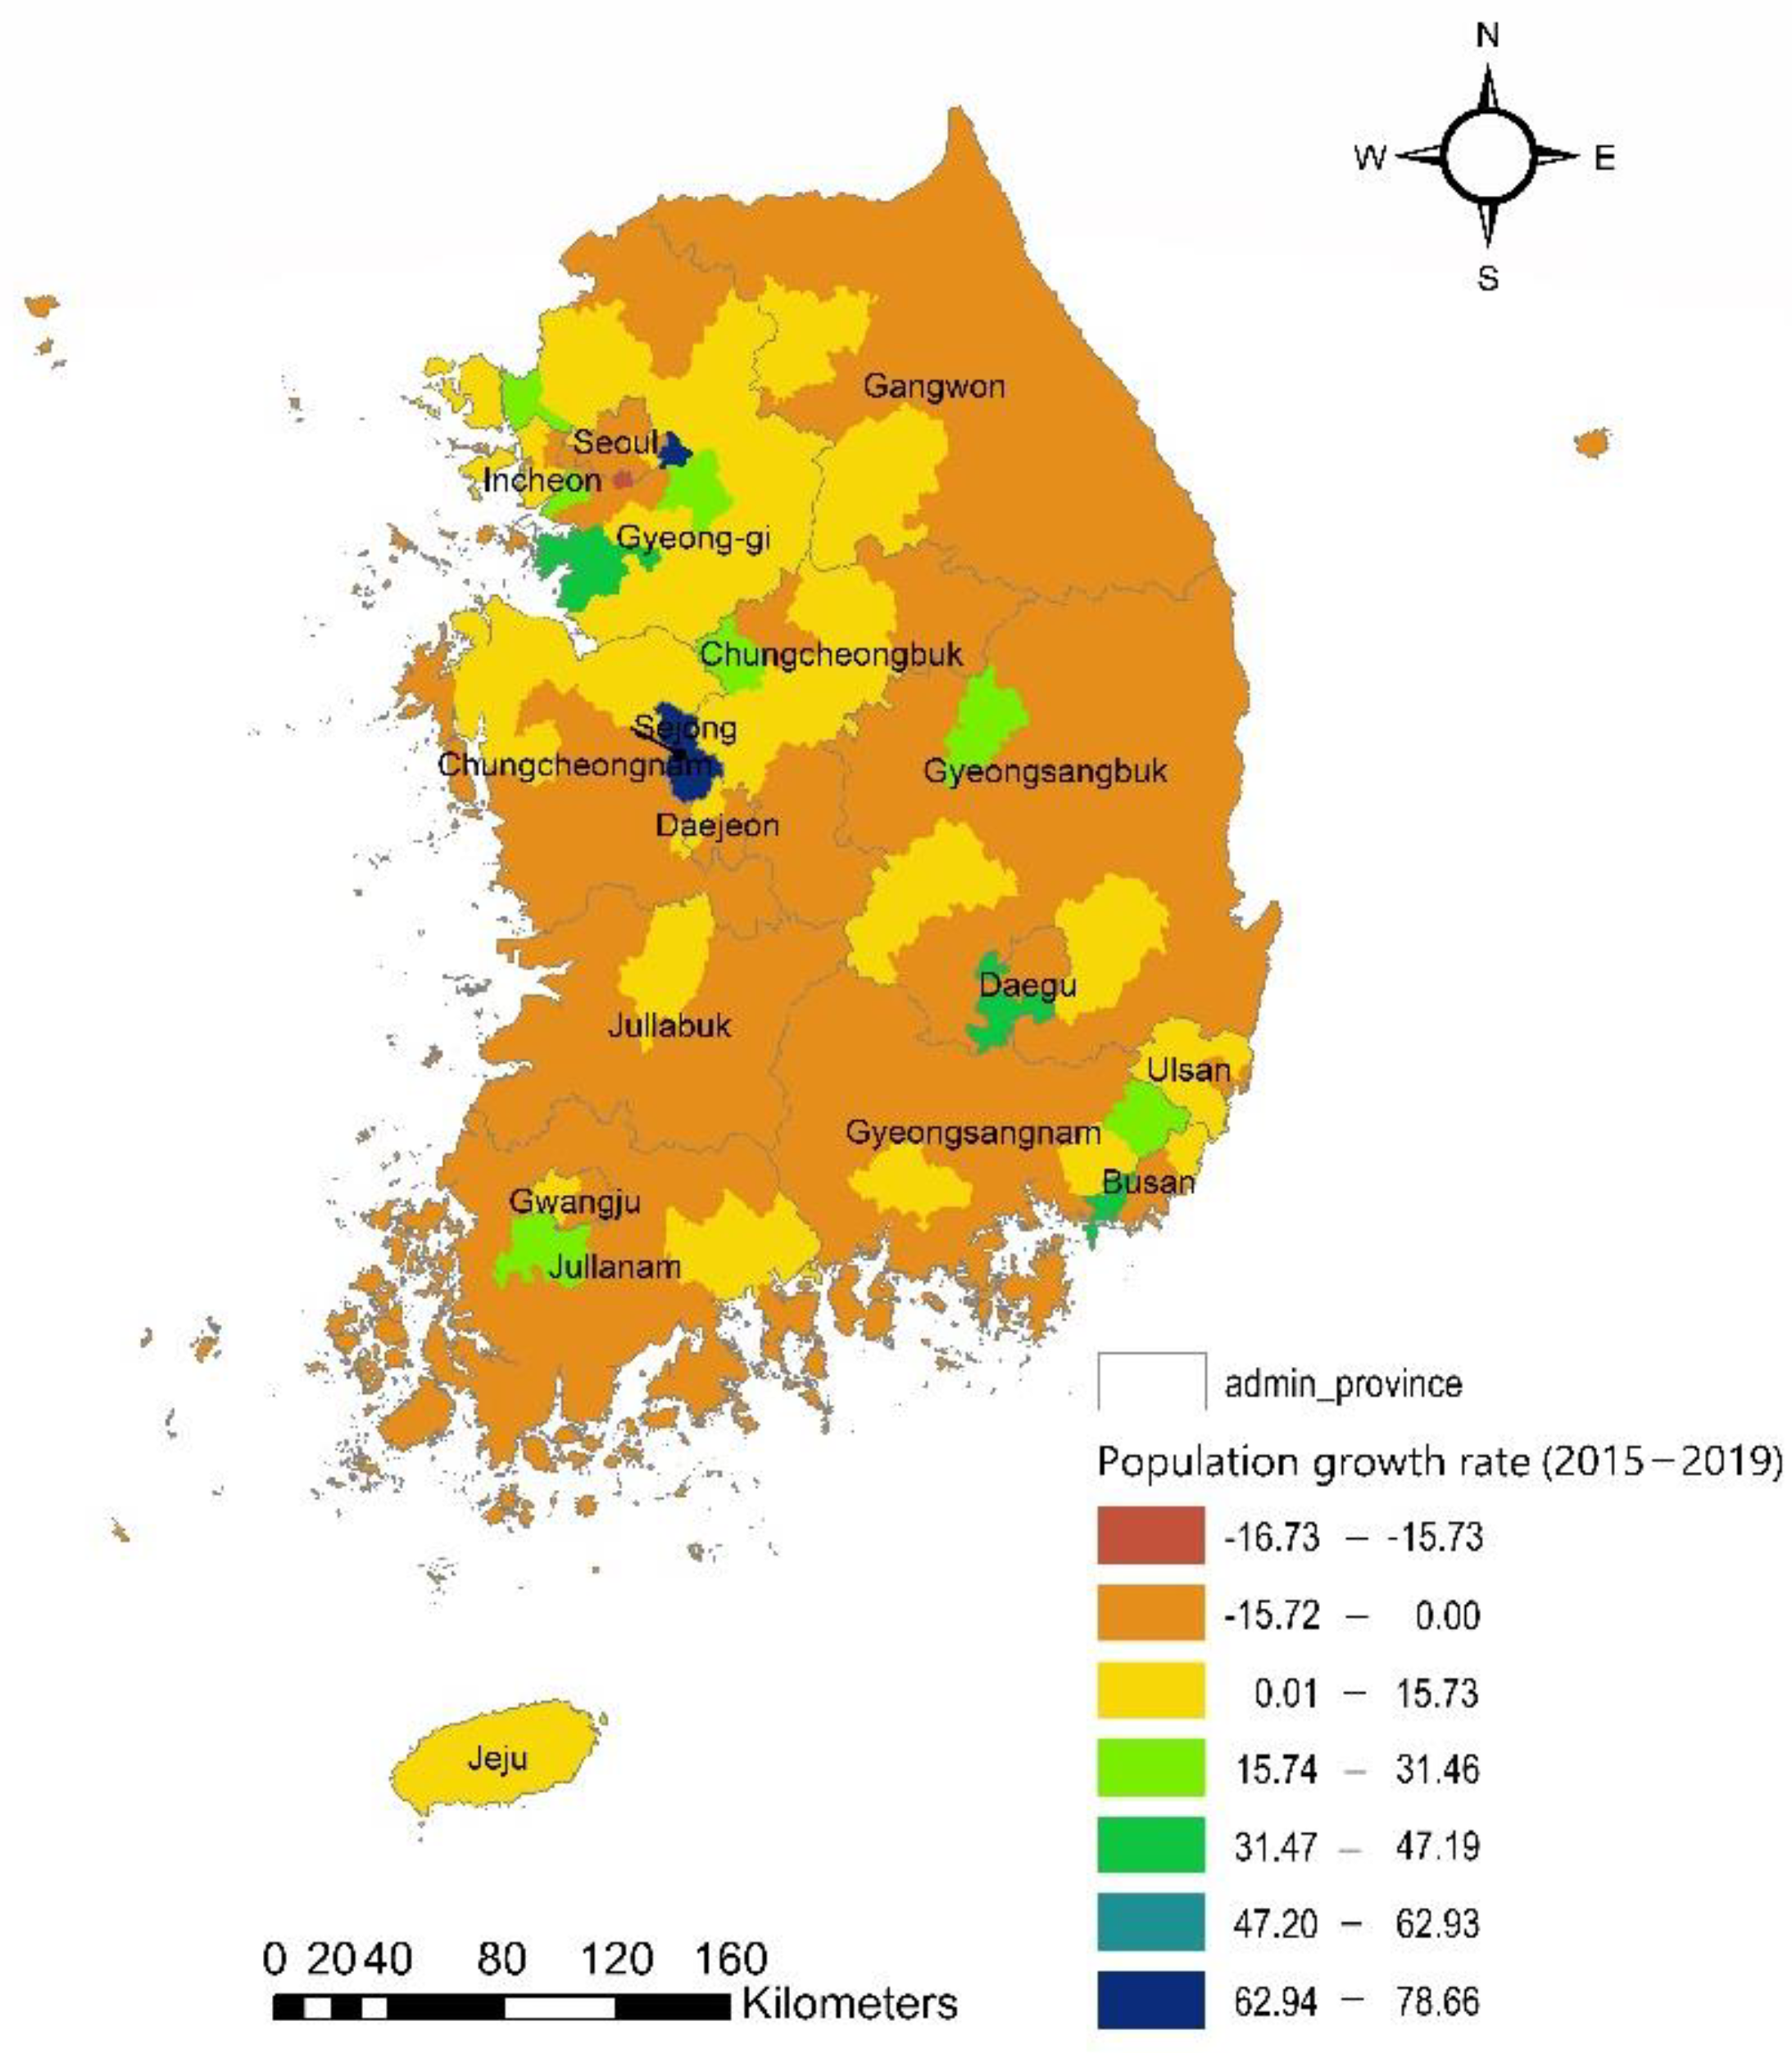
The population-growth rate between 2015 and 2019 by region was calculated using Equation (1). It was found that the population increased in only 66 of the 299 regions. These regions were distributed mostly in Gyeonggi Province and Incheon near Seoul, and in Chungcheongnam and Chungcheongbuk provinces in the south of the Seoul metropolitan area. The regions with the largest increase in population were Sejong City, the newly established administrative capital, and Hanam City in Gyeonggi Province, which is also a newly developed city.
Figure 7 shows that the population is declining in most areas of South Korea, except for some regions where special events have occurred.
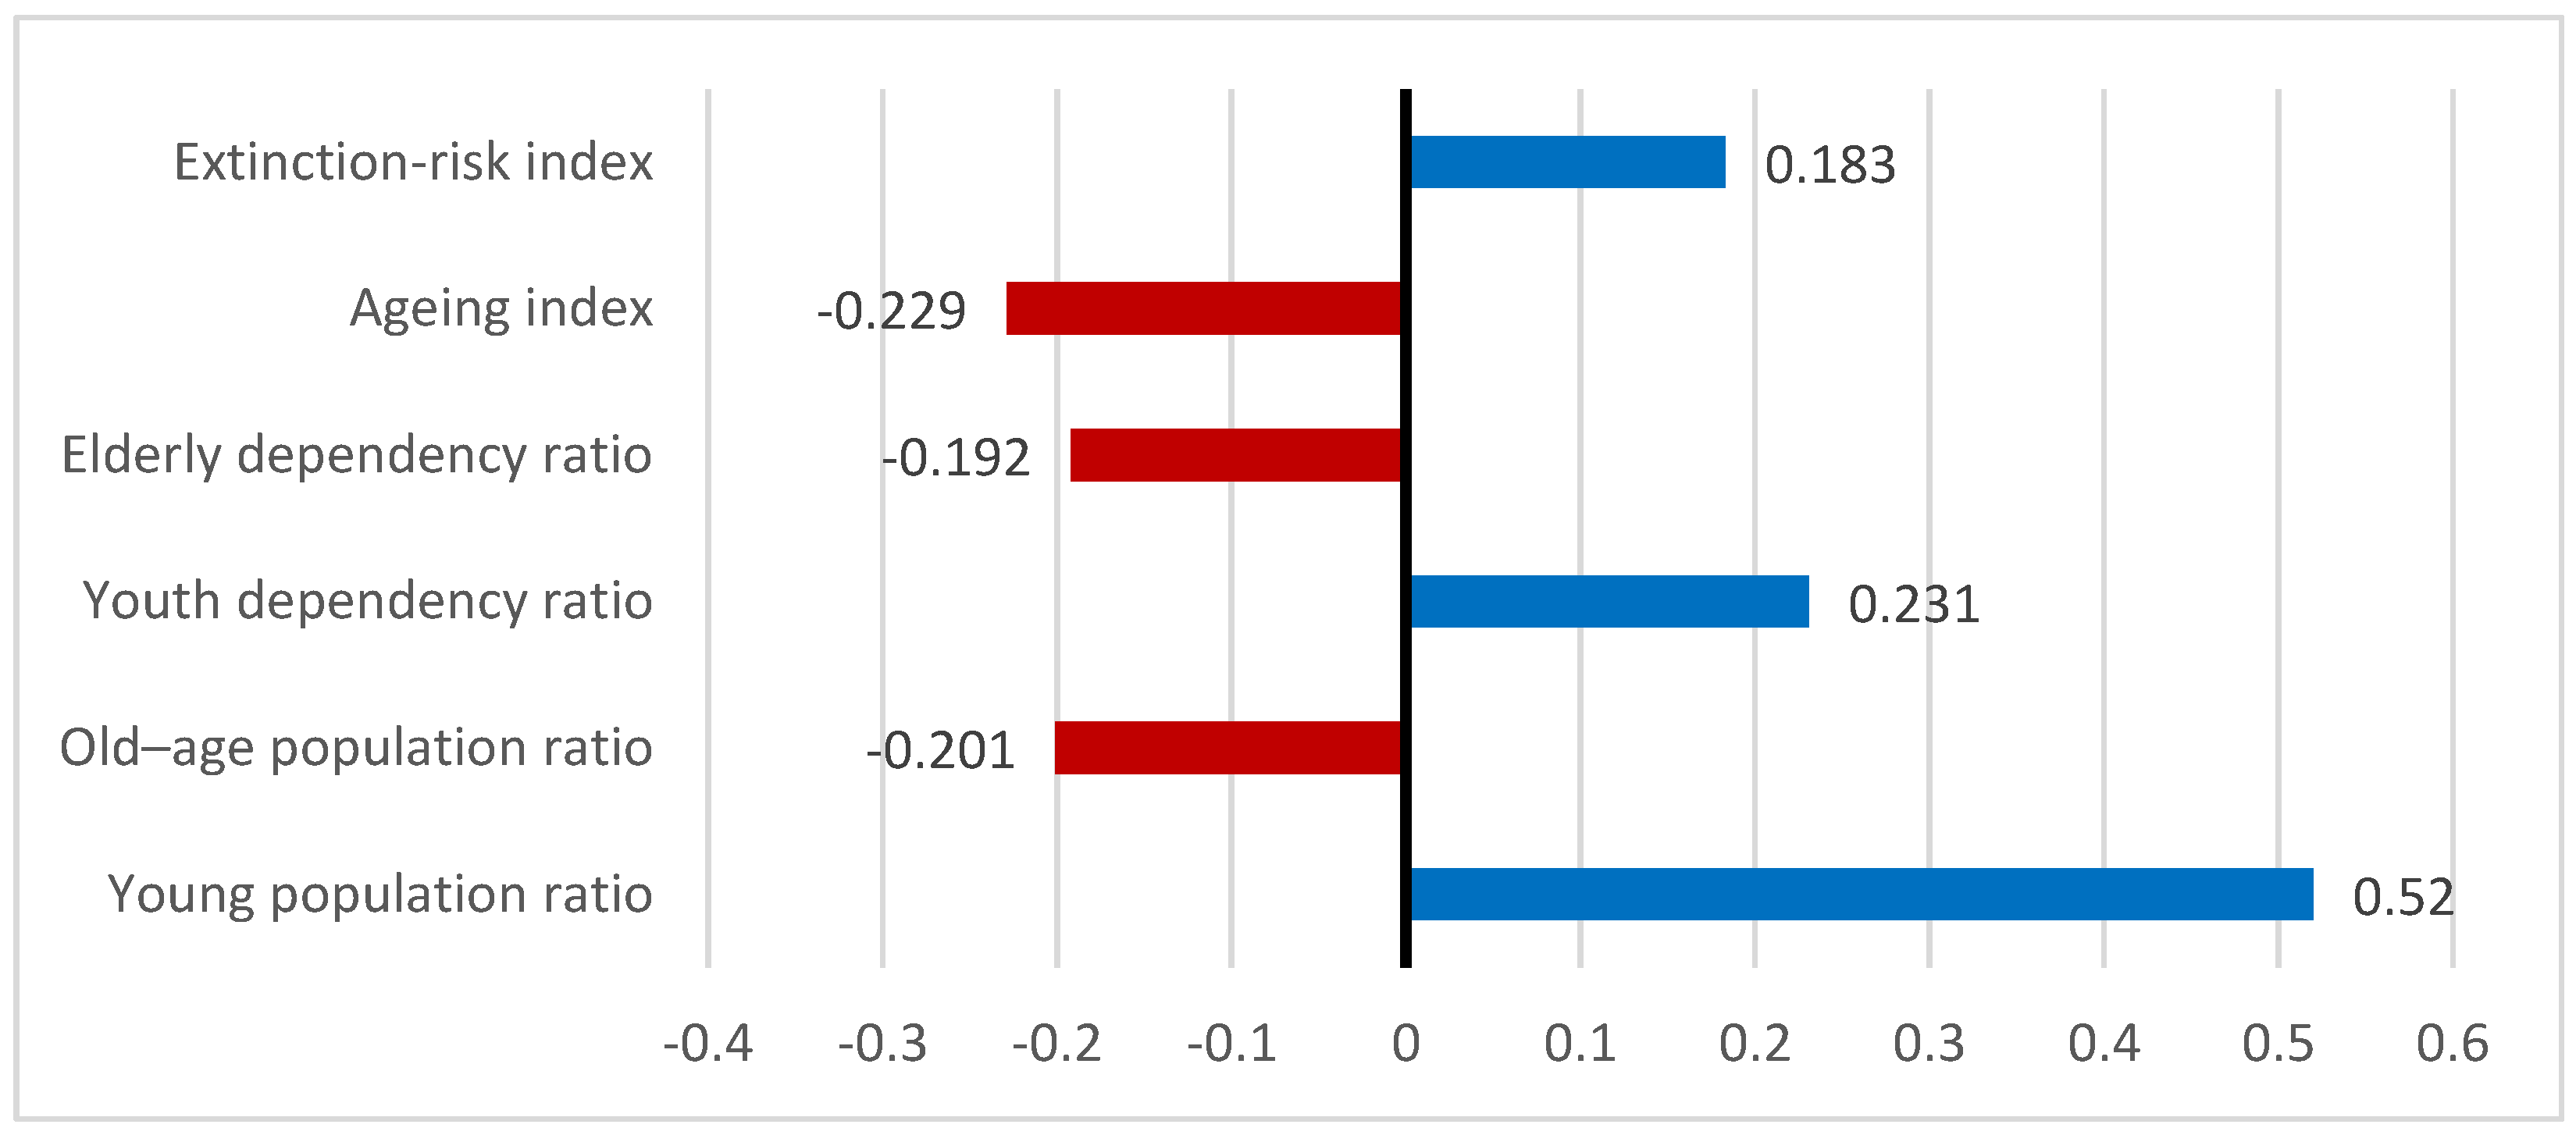
To compare how much each indicator reflected the regional population change, a correlation analysis between the population-growth rate and each indicator was conducted. As shown in
Figure 8, the young population ratio and youth dependency ratio had the largest positive correlation with the population change rate, and the aging index had the largest negative correlation. These results show that the young population is an important factor in population change.
All indicators were significantly correlated with the population change rate, but each has limitations when it is used to represent the population. The young population ratio and aging population ratio describe only one age group and are not indicative of overall population phenomena. The dependency ratios consider two age groups: the dependent age group and the economically active age group, but there were no significant differences between regions in the results for the young population ratio or the elderly population ratio. This was expected because people of working age still accounted for most of the local population despite the increasing dependent population. The extinction-risk index uses the female population of childbearing age and the older population, and it is meaningful for assessing the extinction risk of a region. However, when applying it to South Korea, it was found that most regions had low values and it was, therefore, difficult to compare the extinction risk by region. The aging index could be the best indicator of population status among the demographic indicators. The aging index includes both the young and aged populations, who are the main age groups that have an unequal population distribution and are important in regional shrinkage. It was difficult to compare regions with existing demographic indicators because all indicators included only one or two age groups.
3.2. Regional Evaluation Based on the New Index
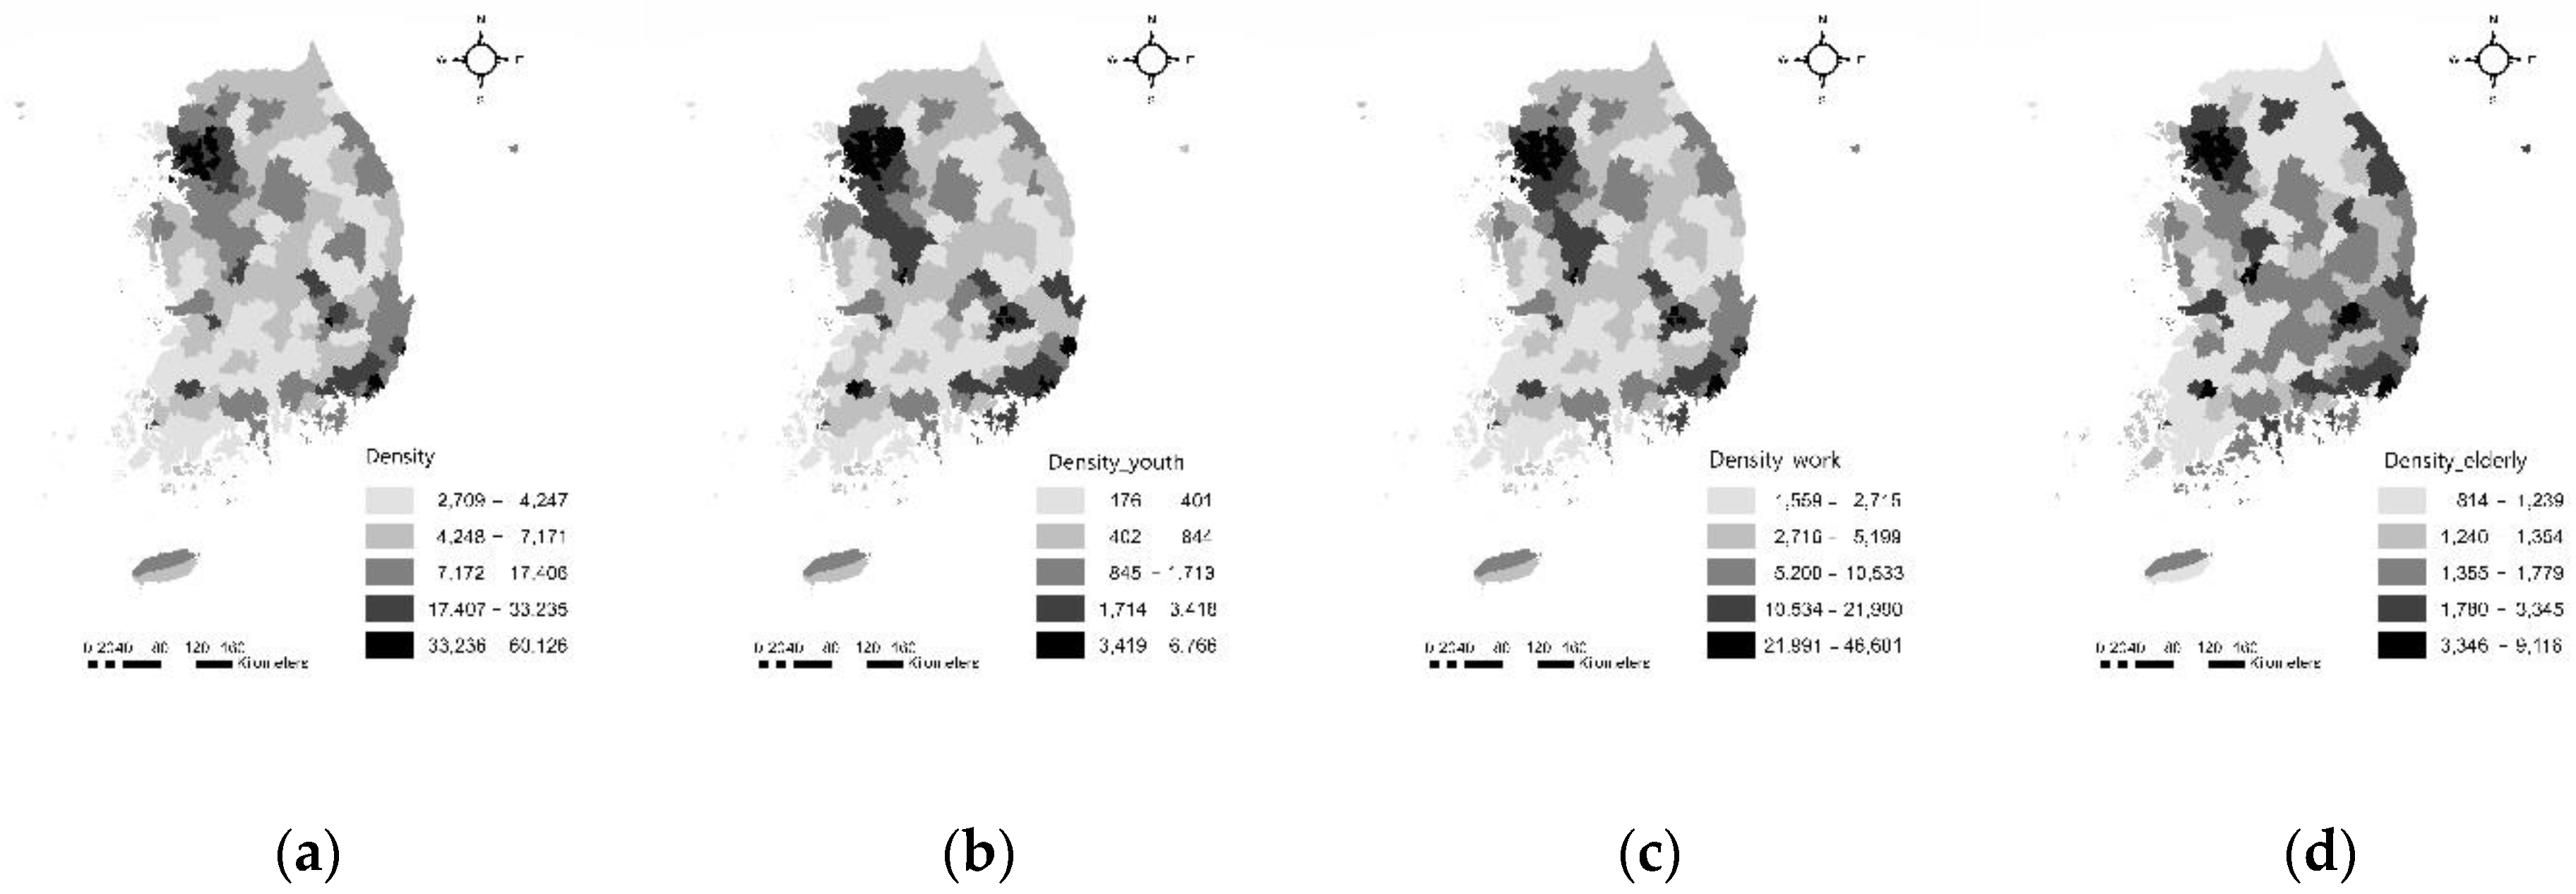
The population density in built-up areas in Korea decreased due to the increase in the built-up area. However, when examining population density by age, it only increased for the age group over 65 years old.
Figure 9 shows the population density in built-up areas by region and age group as of 2019. The distribution of the population density by region for all ages, youth, and the working-age group were similar, but the old-age population density differed. In particular, Gyeongsangnam and Gyeongsangbuk provinces, which are located in the southeast of South Korea, had a relatively high population density in the old-age group.
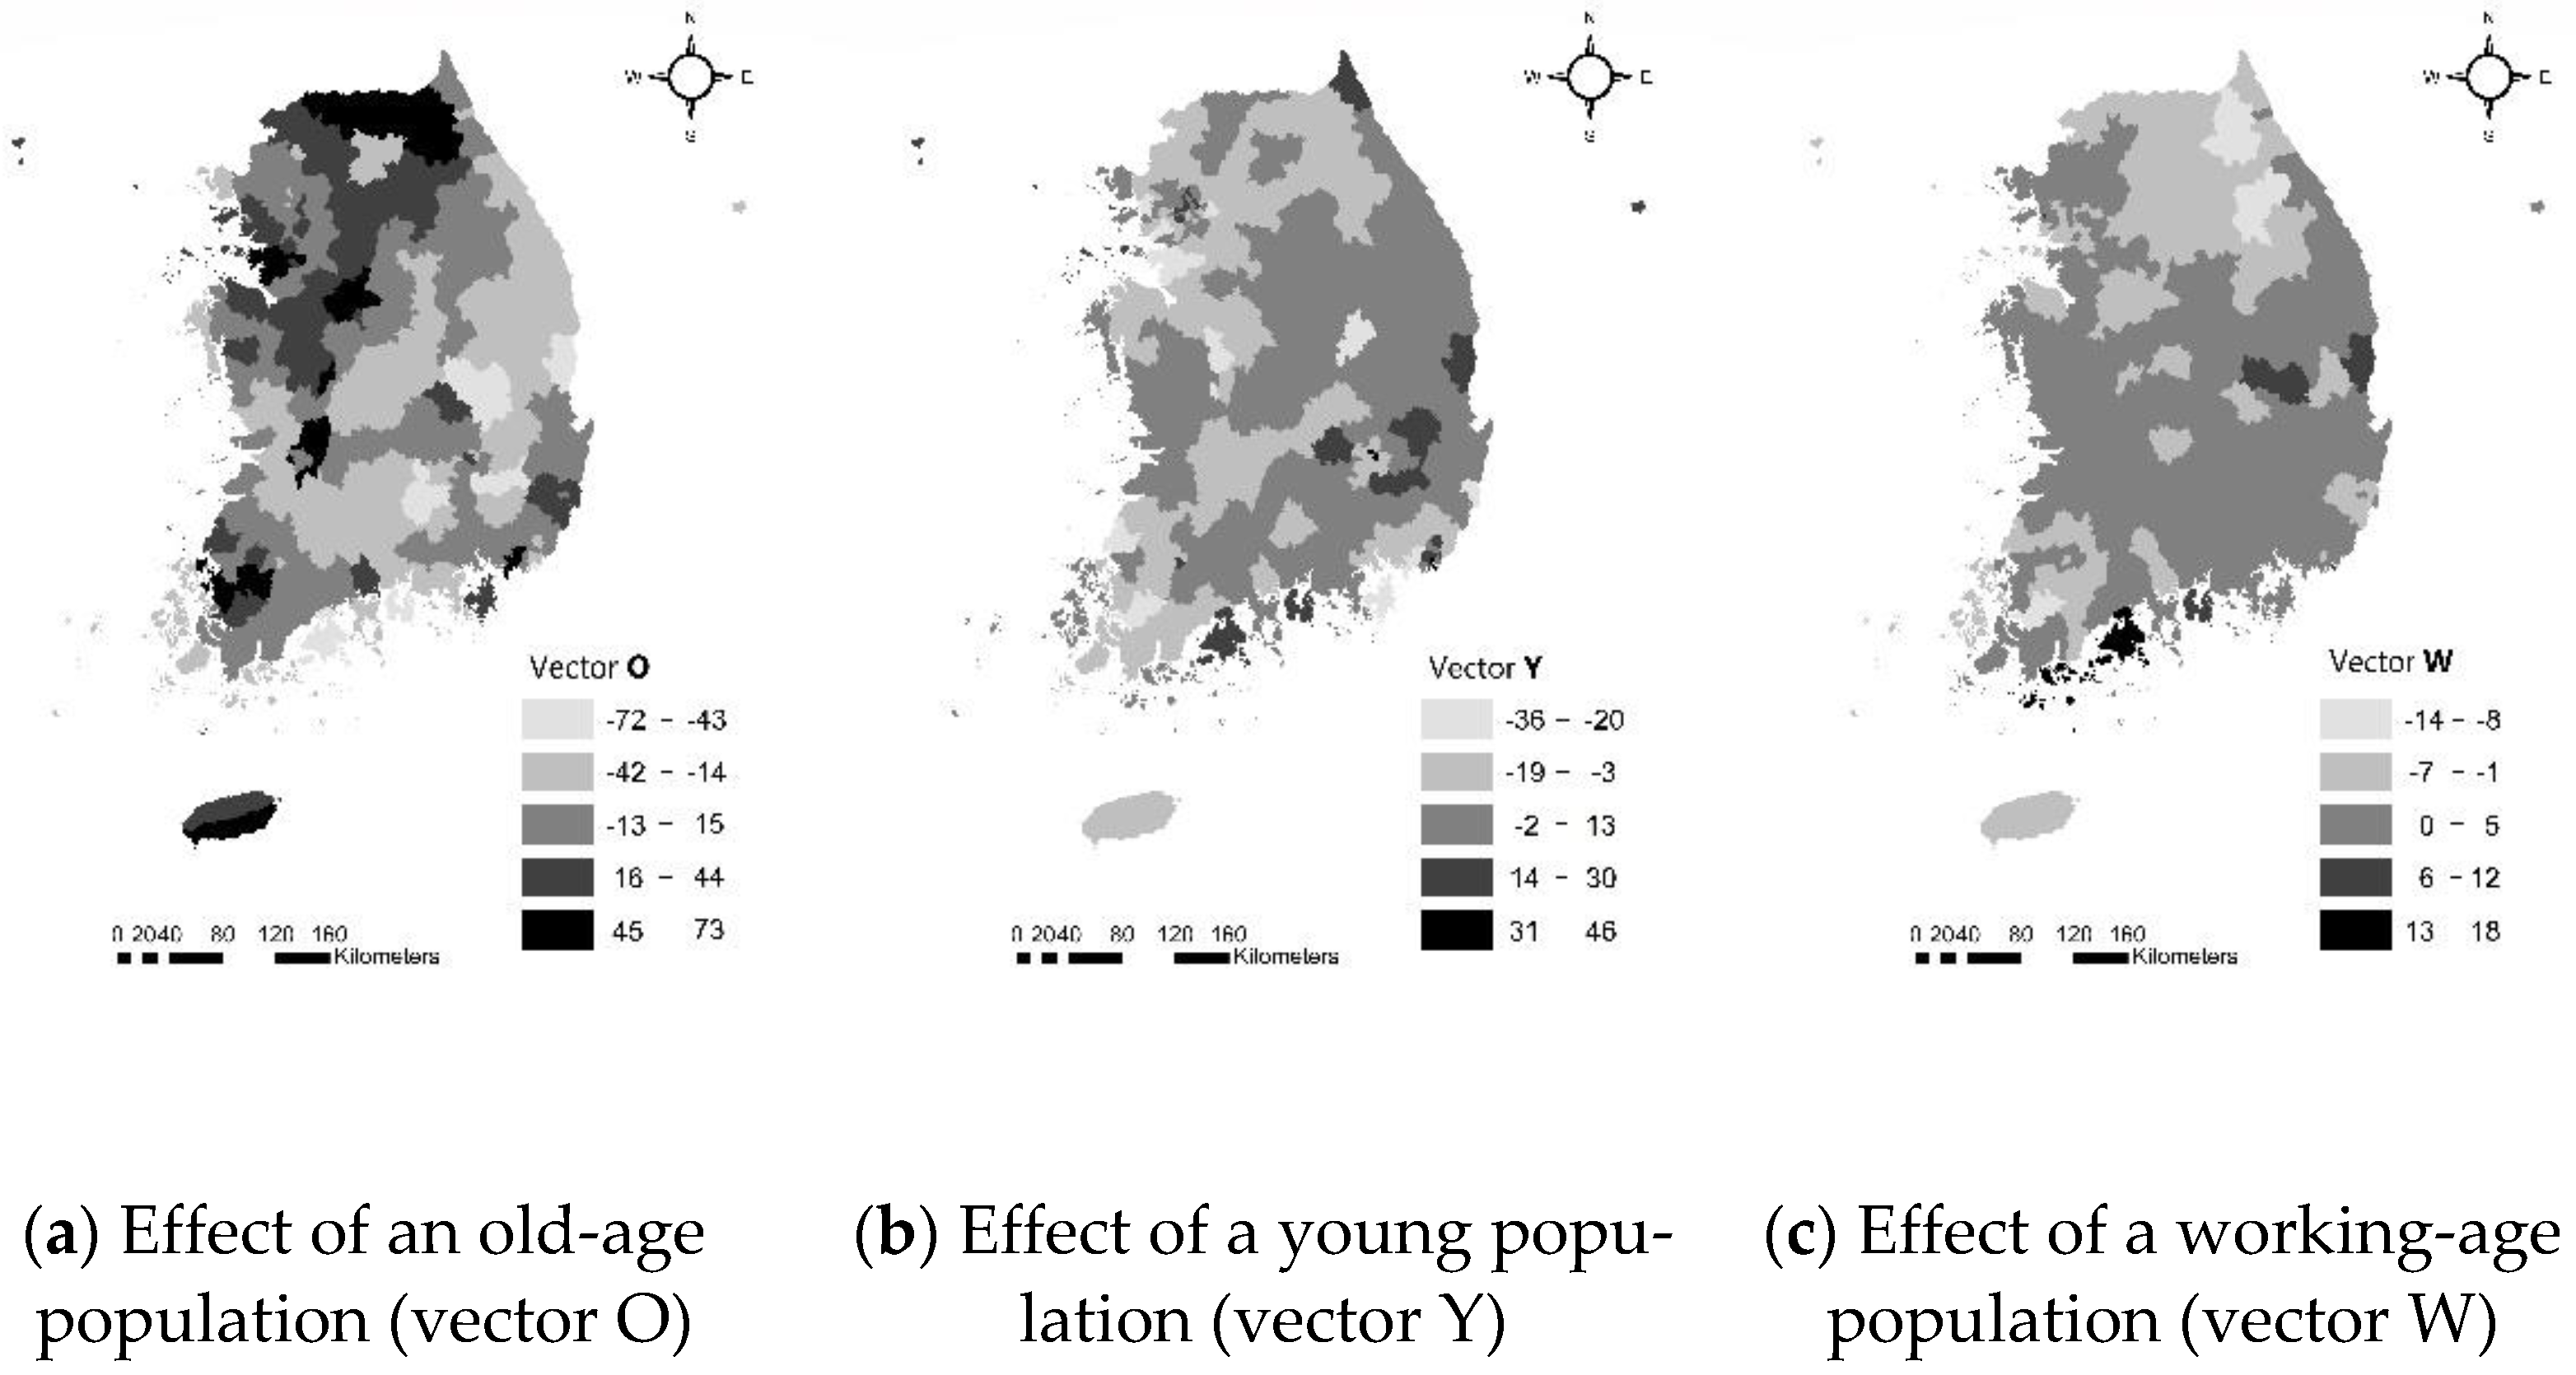
The population-density ranking was calculated, and the sizes of vectors O, Y, and W were evaluated using the difference between the age group ranking and the regional density ranking.
Figure 10 shows the sizes of the vectors O, Y, and W in each region. These maps featured five classes with equal intervals. Vector O, reflecting the old-age population, had the greatest regional variation (
Figure 10a).
A correlation analysis was conducted using the previously calculated values of vectors O, Y, and W in 229 regions. The correlation coefficient for the relationship between vectors O and Y was 0.601, and the correlation coefficient for the relationship between vectors O and W was 0.645. The significance level of both correlation coefficients was 0.001 or less. These correlation coefficients were used to calculate the new index because the correlation coefficient was the cosine of the angle between the two observed vectors.
We calculated the new index with the values of the vectors (O, Y, and W) and angles (αand β), and analyzed the maximum, minimum, average, and standard deviation of the new index for 229 regions. The descriptive analysis is shown in
Table 6. The average value was 0, the minimum was −83.34, the maximum was 89.43, and the standard variance was 32.29.
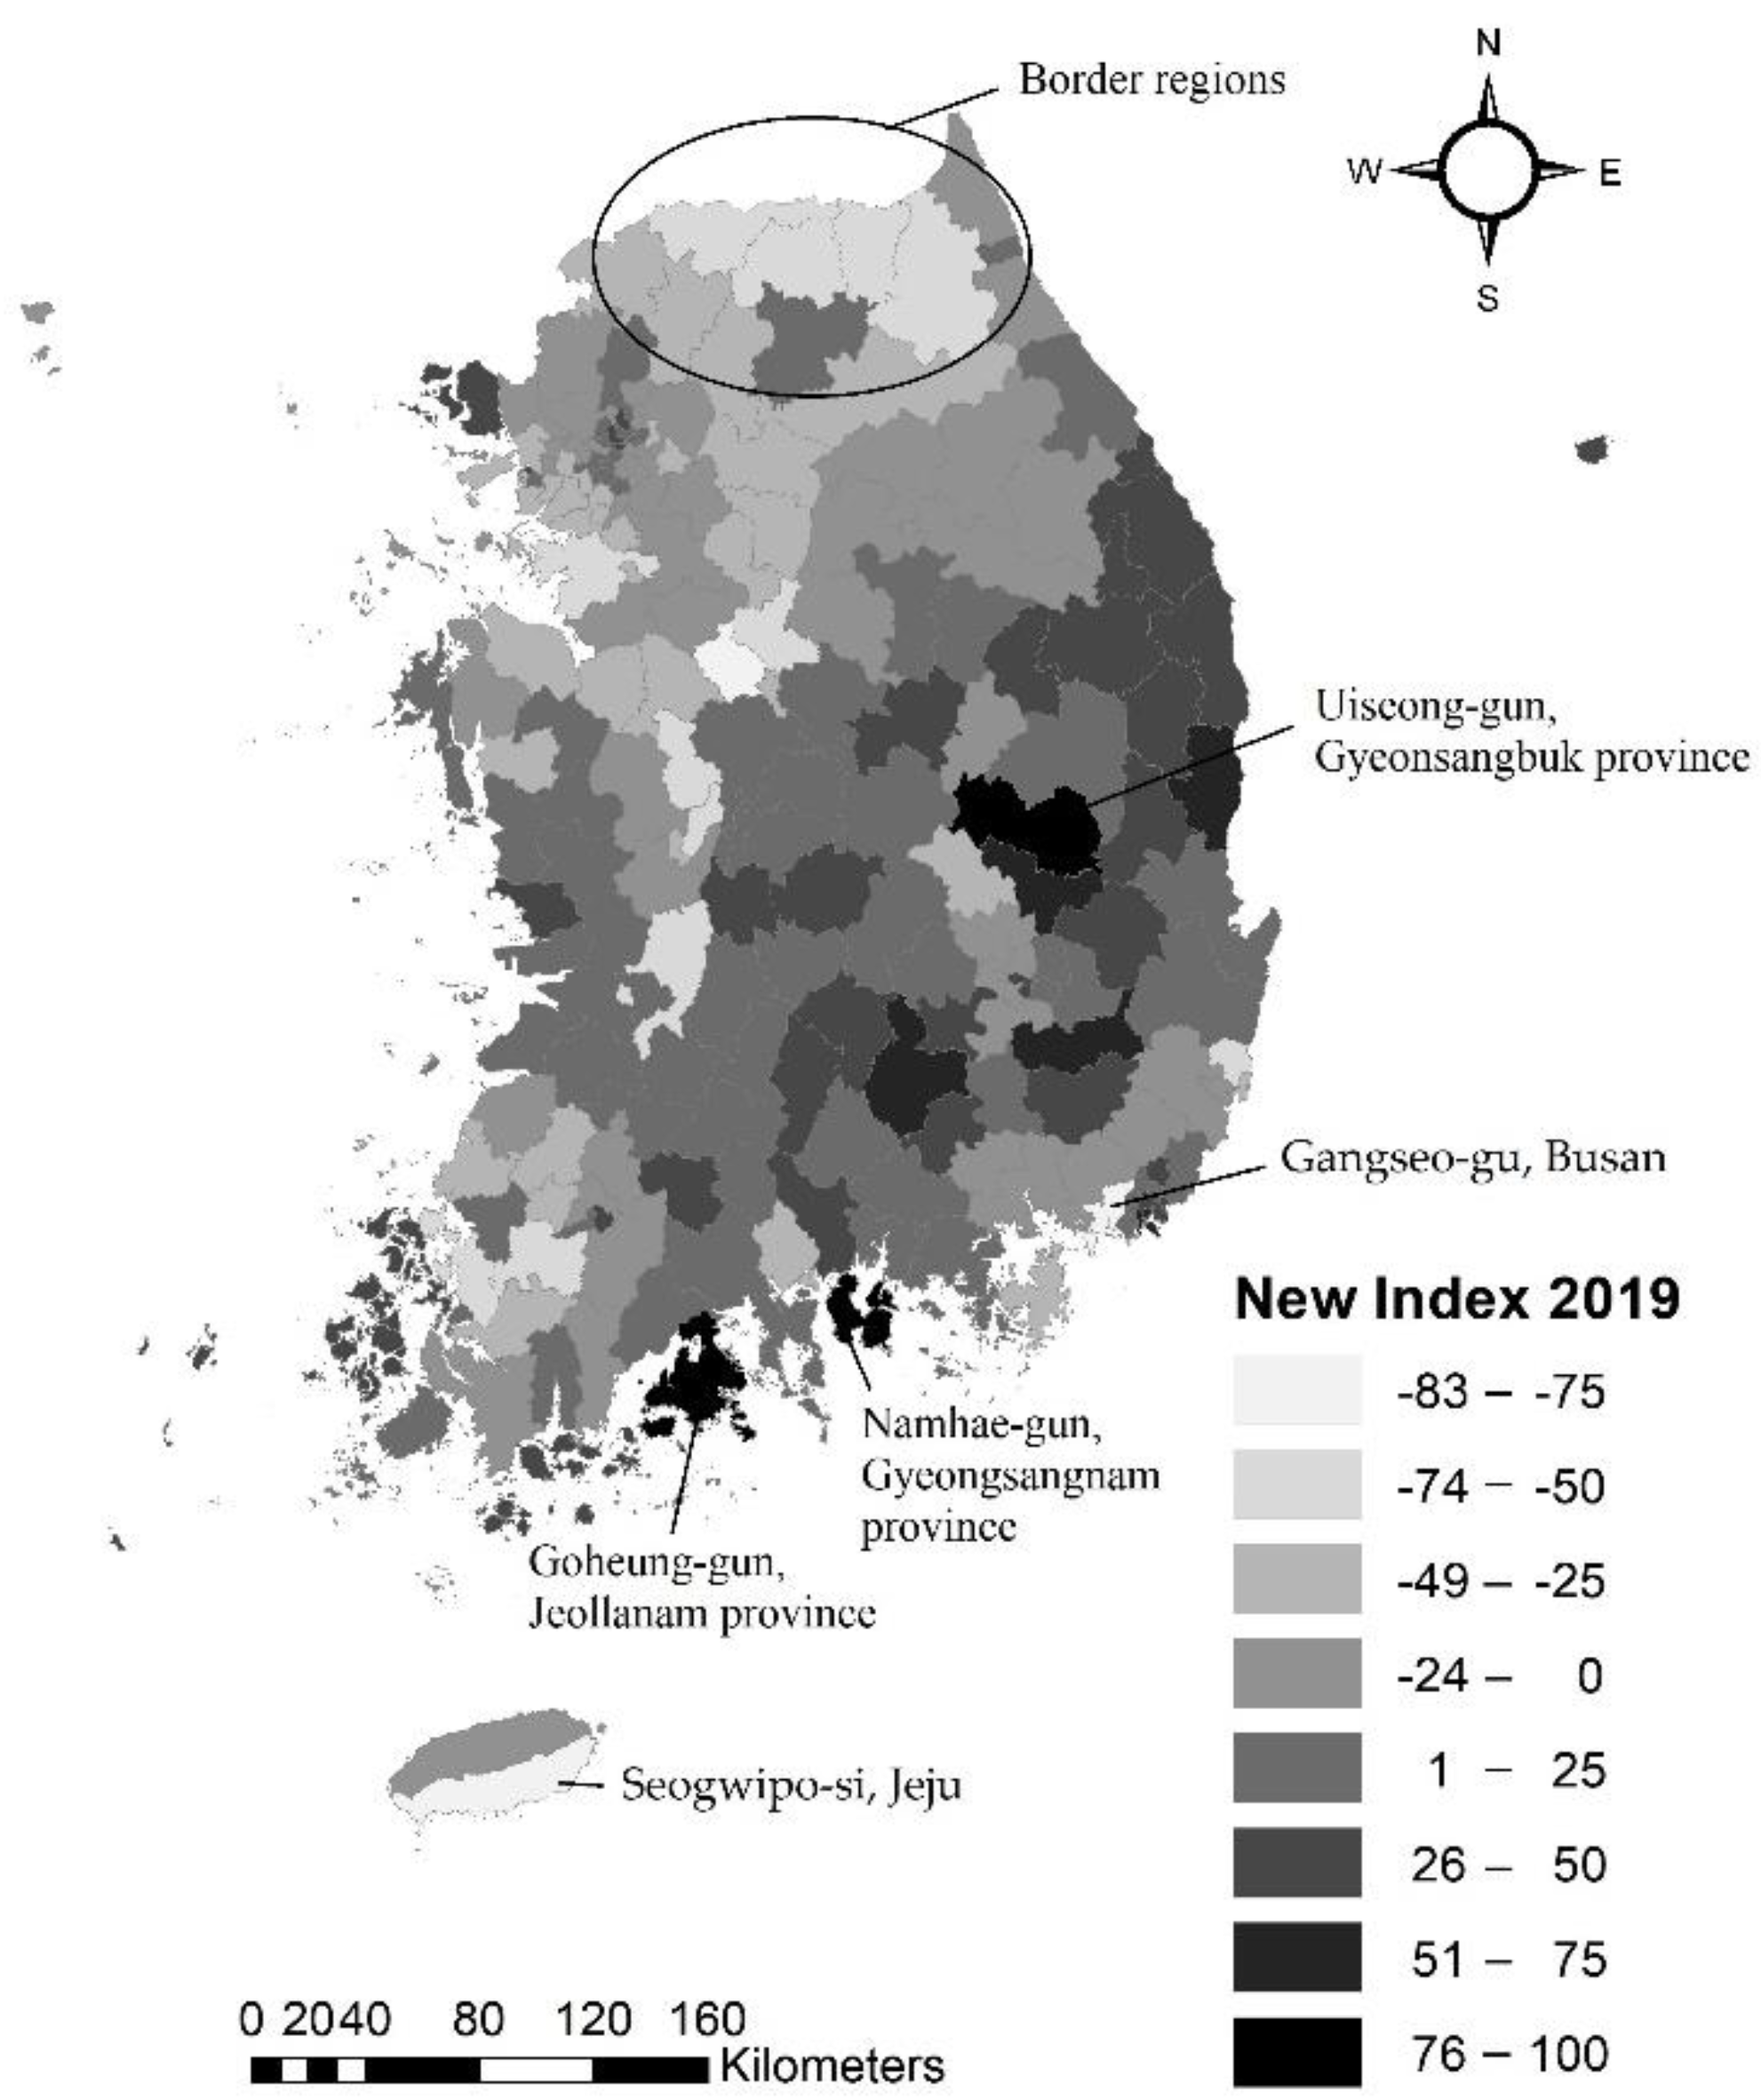
When determining a region’s vulnerability to hollowing out with the new index, Goheung-gun, Jeollanam-do, Uiseong-gun, and Gyeongsangbuk-do were found to be the most vulnerable regions, while Gangseo-gu, Busan, and Seogwipo-si, Jeju were the least vulnerable.
Figure 11 shows a map of the regional index values produced by the new index with equal intervals of 25. The regions with high index values were distributed from the southwest to the northeast of the country and this distribution was likely to be related to the older population. Border regions (Pocheon-si, Yeoncheon-gun, Cheorwon-gun, Hwacheon-gun, Yanggu-gun, Inje-gun, and Goseong-gun) had low vulnerability and were not suitable for the application of the new index because they were more affected by their geographical location than their demographic structure.
3.3. Validation of the New Index
To validate the new index, we conducted a correlation analysis between the new index values and the population-growth rate (
Table 7). The new index was found to be negatively correlated with the population growth 2015-2019, Pearson’s r (299) = −0.443,
p < 0.000. This correlation coefficient was less an absolute value than the correlation coefficient for the correlation with the young population ratio but it had a stronger relationship with the population change rate than the other indicators. To analyze the relationship of the new index with other demographic indicators, a Spearman correlation analysis was performed. As can be seen in
Table 7, the proposed new index was significantly correlated with all other indicators (
p < 0.001). Vulnerability was positively correlated with the older population and negatively correlated with the young population.
4. Discussion & Conclusions
Rapid demographic changes in South Korea have caused public concern about the risks of regional shrinkage and depopulation, which has increased the demand for new indicators to determine the risk of regional shrinkage. This study shows the relationship between the population-growth rate and typical population indicators and provides a new indicator considering the population age structure.
First, we analyzed population changes with the existing demographic indicators. The results revealed the status of the population in South Korea including the declining population density based on the built-up land area, the increased aging rate, and decreased youth dependency ratio. All indicators are significantly correlated with the population change rate, but each indicator only represents a part of the population. Thus, using the existing demographic indicators makes it difficult to compare regions because all indicators only include one or two age groups.
Second, a new vulnerability index was developed to assess regional shrinkage considering population density and the population structure by age. The vulnerability by age group can be expressed as a vector with size and direction, and the sum of the projections of vectors shows the degree of vulnerability of a region.
Third, the new index in this study was applied to evaluate regional shrinkage vulnerability and determine vulnerable regions based on 2019 data. The results indicated that Goheung-gun, Jeollanam-do, Uiseong-gun, and Gyeongsangbuk-do are the most vulnerable regions, while Gangseo-gu, Busan, Seogwipo, and Jeju are the least vulnerable provinces. The index map revealed that the regions with high index values are broadly distributed from the southwest to the northeast of the country.
Finally, a correlation analysis between the new index values and the population-growth rate verified the validity of the new index. We found that the new index values were significantly correlated with the population-growth rate (2015–2019). Our analysis of the relationship between the new index and other demographic indicators showed that the new index was significantly correlated with all other indicators (p < 0.001). Thus the new index could be used as a representative index for regional populations and regional shrinkage.
The Korean government faces an urgent need for new regional indexes to assess and compare regional shrinkage due to population decline. Our new index using all age groups helps detect which areas are shrinking regions. Our new index has an advantage of supporting policies by assessing the population of a region considering all age groups, unlike the existing demographic indicators that assess only one or two age groups. Although our index includes all age groups, there is a significant correlation with the existing indicators. In addition, this new index calculates the vulnerability by comparing the rankings of age groups in each region. Therefore, it is not merely a comparison between regions, but an evaluation using age group information within a region.
Like other regional indicators, new indicators may have some disadvantages for small population regions. The indicator can significantly change with a small change in the population of a specific age group if the population size of the region is too small. Therefore, using this new index is expected to increase accuracy when the results are considered together with the size of the local population. Future studies are encouraged to build on this initial version in view of the population size of small regions by comparing data from different years.
Author Contributions
Conceptualization, J.L. and K.S.; methodology, J.L.; validation, J.L. and K.S.; investigation, J.L.; data curation, J.L.; writing—original draft preparation, J.L.; writing—review and editing, K.S.; supervision, K.S. All authors have read and agreed to the published version of the manuscript.
Funding
This research was supported by the National Research Foundation of Korea (NRF) grant funded by the Korea government (Ministry of Science, ICT & Future Planning) (NRF-2018R1A2B6006744).
Data Availability Statement
Conflicts of Interest
The authors declare no conflict of interest.
References
- Brown, B.J.; Hanson, M.E.; Liverman, D.M.; Merideth, R.W. Global sustainability: Toward definition. Environ. Manag. 1987, 11, 713–719. [Google Scholar] [CrossRef]
- Brown, L.R. Building a sustainable society. Society 1982, 19, 75–85. [Google Scholar] [CrossRef]
- Willis, K. Population studies in planning. Plan. Outlook 1972, 12, 51–57. [Google Scholar] [CrossRef]
- Han, J. Population Geography; Hanul: Paju, Korea, 1999. [Google Scholar]
- European Commission. Population Dynamics. Available online: https://ec.europa.eu/knowledge4policy/population-dynamics_en (accessed on 22 July 2020).
- Martinez-Fernandez, C.; Martinez-Fernandez, C.; Kubo, N.; Noya, A.; Weyman, T. Demographic Change and Local Development: Shrinkage, Regeneration and Social Dynamics; OECD Publishing Paris: Paris, France, 2012. [Google Scholar]
- Bongaarts, J. Human population growth and the demographic transition. Philos. Trans. R. Soc. B Biol. Sci. 2009, 364, 2985–2990. [Google Scholar] [CrossRef] [PubMed] [Green Version]
- Pan American Health Organization. Population Characteristics and Trends. Available online: https://www.paho.org/salud-en-las-americas-2017/?p=1864 (accessed on 22 July 2020).
- Masuda, H.; Declining Population Issue Study Group. The death of regional cities: A horrendous simulation regional cities will disappear by 2040 a polarized society will emerge. In Discuss Japan—Japan Foreign Policy Forum; 2014; Volume 17, Available online: https://www.japanpolicyforum.jp/politics/pt201401201524543388.html (accessed on 22 July 2020).
- Feldhoff, T. Shrinking communities in Japan: Community ownership of assets as a development potential for rural Japan? Urban Des. Int. 2013, 18, 99–109. [Google Scholar] [CrossRef] [Green Version]
- Lee, S. Seven Analyses on Disinfection in Korea; Korea Employment Information Service: Eumseong, Korea, 2016. [Google Scholar]
- Kim, Y.S.H.H.Y. Local Regeneration Plan for Small and Medium-Sized Cities in the Era of Population Decline; National Assembly Research Service: Seoul, Korea, 2020. [Google Scholar]
- Haase, A.; Rink, D.; Grossmann, K.; Bernt, M.; Mykhnenko, V. Conceptualizing Urban Shrinkage. Environ. Plan. A Econ. Space 2014, 46, 1519–1534. [Google Scholar] [CrossRef] [Green Version]
- Grasland, C.; Ysebaert, R.; Corminboeuf, B.; Gaubert, N.; Lambert, N.; Salmon, I.; Baro, M.; Baudet-Michel, S.; Ducom, E.; Riviere, D.; et al. Shrinking Regions: A Paradigm Shift in Demography and Territorial Development; European Parliament’s Committee on Regional Development: Brussels, Belgium, 2008. [Google Scholar]
- Korean Statistical Information Service. Available online: http://kosis.kr/wnsearch/totalSearch.jsp (accessed on 29 July 2020).
- Preedy, V.R.; Watson, R.R. Aging Index. In Handbook of Disease Burdens and Quality of Life Measures; Springer: New York, NY, USA, 2010; p. 4140. [Google Scholar]
- Rummel, R.J. Understanding Correlation; Department of Political Science, University of Hawaii: Honolulu, HI, USA, 1976. [Google Scholar]
- Gniazdowski, Z. Geometric interpretation of a correlation. Zesz. Nauk. Warsz. Wyższej Szk. Inform. 2013, 7, 27–35. [Google Scholar]
Figure 1.
Changes in the population of South Korea (2010–2019).
Figure 1.
Changes in the population of South Korea (2010–2019).
Figure 2.
Changes in the population density in South Korea (2010–2019).
Figure 2.
Changes in the population density in South Korea (2010–2019).
Figure 3.
Changes in the aging rate in South Korea (2010–2019).
Figure 3.
Changes in the aging rate in South Korea (2010–2019).
Figure 4.
Changes in the aging index in South Korea (2010–2019).
Figure 4.
Changes in the aging index in South Korea (2010–2019).
Figure 5.
Vectors related to regional shrinkage vulnerability.
Figure 5.
Vectors related to regional shrinkage vulnerability.
Figure 6.
Distribution of demographic indicators by region: (a) young population ratio; (b) youth dependency ratio; (c) old-age population ratio; (d) elderly dependency ratio; (e) aging index; (f) extinction-risk index.
Figure 6.
Distribution of demographic indicators by region: (a) young population ratio; (b) youth dependency ratio; (c) old-age population ratio; (d) elderly dependency ratio; (e) aging index; (f) extinction-risk index.
Figure 7.
The population-growth rate between 2015 and 2019.
Figure 7.
The population-growth rate between 2015 and 2019.
Figure 8.
Correlation coefficients for the relationships between the population-growth rate (2015–2019) and demographic indicators.
Figure 8.
Correlation coefficients for the relationships between the population-growth rate (2015–2019) and demographic indicators.
Figure 9.
The population density in built-up areas by region and age group: (a) population density in built-up areas; (b) young population density in built-up areas; (c) working population density in built-up areas; (d) old-age population density in built-up areas.
Figure 9.
The population density in built-up areas by region and age group: (a) population density in built-up areas; (b) young population density in built-up areas; (c) working population density in built-up areas; (d) old-age population density in built-up areas.
Figure 10.
Effects of age groups on regional shrinkage by region: (a) the size of vector O indicates how much an old-age population affects the new index, (b) the regional distribution of the size of vector Y, and (c) the map of vector W shows that the impact of working-age groups on the new indicators did not differ significantly by region.
Figure 11.
Regional values of the new vulnerability index for regional shrinkage.
Figure 11.
Regional values of the new vulnerability index for regional shrinkage.
Table 1.
Changes in the dependency ratio in South Korea (2010–2019).
Table 1.
Changes in the dependency ratio in South Korea (2010–2019).
| | 2010 | 2011 | 2012 | 2013 | 2014 | 2015 | 2016 | 2017 | 2018 | 2019 |
|---|
| Youth dependency ratio | 22.33 | 21.55 | 20.91 | 20.32 | 19.76 | 19.20 | 18.69 | 18.34 | 18.01 | 17.64 |
| Elderly dependency ratio | 14.69 | 15.06 | 15.62 | 16.30 | 16.96 | 17.59 | 18.16 | 18.93 | 19.86 | 20.82 |
| Dependency ratio | 37.02 | 36.62 | 36.52 | 36.62 | 36.72 | 36.79 | 36.85 | 37.27 | 37.87 | 38.46 |
Table 2.
Changes in the extinction-risk index in South Korea (2010–2019).
Table 2.
Changes in the extinction-risk index in South Korea (2010–2019).
| | 2010 | 2011 | 2012 | 2013 | 2014 | 2015 | 2016 | 2017 | 2018 | 2019 |
|---|
| Extinction-risk index | 1.39 | 1.32 | 1.25 | 1.17 | 1.11 | 1.05 | 1.01 | 0.96 | 0.91 | 0.87 |
Table 3.
Regional statistics of demographic indicators.
Table 3.
Regional statistics of demographic indicators.
| | Min | Max | Average | SD. |
|---|
| Young population ratio | 5.19 | 20.59 | 11.33 | 2.89 |
| Old-age population ratio | 7.23 | 39.49 | 20.03 | 8.13 |
| Youth dependency ratio | 8.79 | 29.37 | 16.56 | 3.51 |
| Elderly dependency ratio | 9.10 | 73.52 | 30.52 | 15.46 |
| Aging index | 41.84 | 734.30 | 203.80 | 134.08 |
| Extinction-risk index | 0.15 | 1.89 | 0.71 | 0.42 |
Table 4.
Coefficient of variation of each index in 2010–2019.
Table 4.
Coefficient of variation of each index in 2010–2019.
| | 2010 | 2011 | 2012 | 2013 | 2014 | 2015 | 2016 | 2017 | 2018 | 2019 |
|---|
| Young population ratio | 21.26 | 21.39 | 21.46 | 21.83 | 22.34 | 22.89 | 23.53 | 24.24 | 24.92 | 25.50 |
| Old-age population ratio | 48.85 | 48.04 | 46.58 | 45.66 | 43.82 | 43.31 | 43.69 | 42.72 | 41.59 | 40.62 |
| Youth dependency ratio | 57.18 | 56.56 | 55.19 | 54.50 | 52.70 | 52.47 | 53.26 | 52.43 | 51.41 | 50.64 |
| Elderly dependency ratio | 18.86 | 18.82 | 18.71 | 18.83 | 18.81 | 19.36 | 19.82 | 20.32 | 20.83 | 21.19 |
| Aging index | 69.62 | 69.07 | 68.04 | 67.67 | 65.87 | 65.92 | 67.24 | 66.84 | 66.34 | 65.79 |
| Extinction-risk index | 62.45 | 62.32 | 61.97 | 61.63 | 60.58 | 60.27 | 59.68 | 59.24 | 59.01 | 59.13 |
Table 5.
Results of the correlation analysis among the demographic indicators.
Table 5.
Results of the correlation analysis among the demographic indicators.
| | Young Population Ratio | Old-Age Population Ratio | Youth Dependency Ratio | Elderly Dependency Ratio | Aging Index | Extinction-Risk Index |
|---|
| Youth population ratio | 1.000 | | | | | |
| Old-age population ratio | −0.456 ** | 1.000 | | | | |
| Youth dependency ratio | 0.393 ** | −0.600 ** | 1.000 | | | |
| Elderly dependency ratio | −0.448 ** | 0.998 ** | −0.566 ** | 1.000 | | |
| Aging index | −0.482 ** | 0.972 ** | −0.760 ** | 0.961 ** | 1.000 | |
| Extinction-risk index | 0.428 ** | −0.982 ** | 0.523 ** | −0.985 ** | −0.934 ** | 1.000 |
Table 6.
Descriptive statistics of the new index.
Table 6.
Descriptive statistics of the new index.
| | N | Min | Max | Average | SD. |
|---|
| New index 2019 | 229 | −83.34 | 89.43 | 0.00 | 32.29 |
Table 7.
Correlation coefficients between the new index values and demographic indicators.
Table 7.
Correlation coefficients between the new index values and demographic indicators.
| | Young Population Ratio | Old-Age Population Ratio | Youth Dependency Ratio | Elderly Dependency Ratio | Aging Index | Extinction-Risk Index |
|---|
New index
2019 | −0.662 ** | 0.315 ** | −0.326 ** | 0.309 ** | 0.343 ** | −0.284 ** |
| Publisher’s Note: MDPI stays neutral with regard to jurisdictional claims in published maps and institutional affiliations. |
© 2021 by the authors. Licensee MDPI, Basel, Switzerland. This article is an open access article distributed under the terms and conditions of the Creative Commons Attribution (CC BY) license (https://creativecommons.org/licenses/by/4.0/).


