Article

Vulnerability among European Youth: A Proposal for a Multidimensional Approach (2013–2017)

by
Álvaro Moro
*,
Concepción Maiztegui-Oñate
and
Josu Solabarrieta
Department of Education, Faculty of Education, Bilbao Campus, University of Deusto, 48007 Bilbao, Spain
*
Author to whom correspondence should be addressed.
Sustainability 2021, 13(16), 9252; https://doi.org/10.3390/su13169252
Submission received: 15 June 2021 / Revised: 15 July 2021 / Accepted: 3 August 2021 / Published: 18 August 2021

Abstract

:
The notion of vulnerability has acquired an important role in social policy debates. Therefore, the identification of vulnerable groups and their conditions is particularly important for the orientation of public policies and risk reduction. This article aims to offer a broad vision of the situation of European youth (15–29) using three dimensions of vulnerability (personal, economic and socio-cultural dimensions). To do so, we developed a multidimensional approach combining a system of indicators (N = 33) to contrast the evolution of the aforementioned dimensions among the European countries. Based on secondary analysis of quantitative data on European member states, we compared the evolution during two moments in time. The first period examined was 2012–2014, after the global financial crises but prior to the implementation of Youth Guarantee, whereas the second was the period which allowed for an examination of the latest updated data available (2017). Our results confirm territorial imbalances that affect the lives of European youth and their future opportunities. Northern countries led this scenario combining an inclusive education system with supportive labor market policies offering more opportunities to overcome risks. Although this multidimensional analysis is exploratory, its findings provide preliminary insight into the configuration of the dimensions of vulnerability in European youth.

1. Introduction

The second half of the twenty century created growing social uncertainties and new forms of man-made insecurities that affect the industrial bases of society as well as the concept of nation states. Because of this process, the foundation institutions (work, family and welfare) have progressively lost the capacity to provide security to many citizens [1]. In this scenario, the perspective of vulnerability becomes a central dimension in understanding the unforeseen side effects of modern life and to reduce social exclusion [2].
The category of vulnerable implies advocating the State responsibility to ensure the protection of those groups [3]. For this reason, the European Commission, like other international institutions such as the OECD, reflects its concern to reduce vulnerability in the European agenda. One of the main groups considered at risk of social exclusion and therefore most vulnerable in EU policies and plans is young people. This group is often considered to suffer from an intrinsic “inherent vulnerability” related to their stage in the life process, which is reflected in the difficulties they experience in enjoying their rights [4]. Indeed, in increasingly complex contexts, transition to adulthood is a critical phase mainly associated with the challenge of facing job instability together with care responsibilities, especially in the phase of family construction [5]. In particular, young people are at risk of living long periods of vulnerability before being able to access the responsibilities of adulthood, whether they are in the workplace, in the family, or in society [6].
Drawed upon on a broader research project (Encouraging Lifelong Learning for an Inclusive and Vibrant Europe, ENLIVEN) carried out as part of the Horizon 2020 program, this article adopts a conceptualization of vulnerability by a multi-dimensional combination of factors that encompasses a broad range of social indicators. One of the main objectives of the ENLIVEN projects was to understand the target groups of European lifelong learning policies, which led to this paper that focuses on exploring the intersection of vulnerability among young Europeans. Based on the vulnerability model developed by Enliven project [7] this concept is considered as a dynamic condition characterized as a transition space between social inclusion and exclusion, which reflects the participation in three dimensions inspired by Castel [8] and Silver [9]: socio-political life and cultural life and economic labor. In light of this approach, vulnerability does not affect specific predetermined groups, but rather affects groups and individuals in a changing way according to their individual equation with respect to the social dynamics of risk and marginalization. Moreover, in the zone of vulnerability certain conditions reinforce each other, such as employment, education and income [10]. Recognizing the complexity of the notions of vulnerability, this paper analyses and compares three above-mentioned dimensions of vulnerability among the EU countries. Furthermore, this paper incorporates a personal dimension of vulnerability that we have called empowerment.
To achieve this objective, we have developed a multi-dimensional cross-country model by gathering data from official International Institutions (EUROSTAT, EUROBAROMETER and OECD). As pointed out by Osgood, et al. [11], administrative data provide us with key results, such as labor market insertion and educational level, to understand the situation of young people in their transition to adulthood. Where possible, the selected data have been disaggregated by age group and educational level with the intention of adjusting the results to the population we are studying (15–29 years old). One of the main challenges of vulnerability research is to develop measures that portray the situation in this regard [12]. Overall, our analytical model contributes to the vulnerability debate by means of a methodological approach that, through an interaction of factors, provides a disaggregated view of the European youth population.
We have chosen as a milestone the launch of the Youth Guarantee (2014). This initiative aims to improve the human capital of the most vulnerable young Europeans (under 30 years old) to facilitate their access to the labour market. The EU aims to achieve an active, innovative and skilled workforce, while trying to avoid the high costs of unemployed and untrained young people, valued at 1.2% of GDP [13]. Although focused on the labour dimension, it is one of the main European social policies aimed at overcoming vulnerability among youth and its implementation has been intended to be a linchpin of structural reforms and innovation across Europe. For this reason, we have considered it as an appropriate benchmark for our analysis. The second moment was the period that allowed for an examination of the latest updated data available (2017). Regarding the analysis, building on the knowledge of previous research we followed the typology developed by Roosmaa and Saar [14] to take into account an additional feature at country level. Combining typologies on varieties of capitalism, welfare state regimes and their former tensions, the mentioned authors provided an analytical framework to contextualize structural factors. Other studies focused on the development of indices on living conditions provide a frame of reference both for the construction of our proposal and for the contrast of our results. In this respect, see Corrales-Herrero & Rodríguez Prado, [15] in relation to the living conditions of young Europeans in various areas, such as employment, political and social participation; European Commission [16] and Scandurra et al. [17] on labor market integration; Hoskins & Crick [18] on participation as active citizenship or Lelkes [19] on social participation.
The structure of the document is as follows. Section 2 presents the conceptual framework. Section 3 describes the three dimensions of vulnerability included in our proposal. Section 4, Materials and Methods, explains the methodological approach, the composition of the model (dimensions, subdimensions, variables and indicators) and the weighting of the selected indicators. Section 5 depicts the main results regarding the current situation of the youth population in the 28 EU countries. The final section provides a discussion of the results and the main conclusions to be drawn.

2. Vulnerability: Conceptual Framework

Vulnerability has become an increasingly useful field of research for addressing risk reduction and the mediation of economic and social impacts. As an analytical concept, vulnerability emerged in the environmental sciences when studying the impact of natural or economic disasters on human populations [20]. In social sciences, it is associated with the risk of harm in the face of a possible eventuality and the ability to avoid or cope with a harmful outcome [21]. This means that a person (or a family, or a group) considered vulnerable is in a state of weakness that exposes them to particularly negative or harmful consequences [22]. However, as a multivariate concept, the definition and scope vary according to the disciplinary perspective and the specificity of the context.
The state of vulnerability is closely related to the state of exclusion or poverty and marginalization [23]. Accordingly, the ‘most vulnerable’ are considered to be those exposed to the greatest menace that threatens either their chances of survival or their ability to live with minimum security, economic and social, and human dignity [24]. Different nuances and meanings have been explored by many studies. Among others, Ranci & Migliavacca [25] defined social vulnerability as a life-situation characterized by a multi-dimensional combination of factors of disadvantage and advantage, of inclusion and exclusion. Its distinctive feature is that weak and unstable integration in the main mechanisms of resource distribution in contemporary society places people in a situation of uncertainty and high exposure to the risk of poverty and, eventually, of social exclusion. In a similar way, after extensive theoretical revision of the term Chowa et al. [23] verifies that vulnerability includes a double structure including external elements and internal factors. The first one is the exposure to perturbation or external stresses; the second one is the sensitivity to those situations and the capacity to adapt. Furthermore, this approach introduces a positive element, the capacity to cope that is considered the other side of vulnerability (a positive definition focus on the capacities).
In summary, the current debate clearly shows that vulnerability captures various thematic dimensions, such as physical, economic, social and institutional aspects [26]. Moreover, in the zone of vulnerability certain conditions reinforce each other, such as employment, education and income [10]. Although its use is widespread, it has rarely been operationally defined or analyzed [27]. This may be related to the need to apply the term to a large number of categories and social sectors but, above all, accentuating aspects such as unemployment, precarious and poorly paid work, the difficulties faced by the educational system to adapt to social and technological transformations.
Beyond its lack of clarity, another element of indetermination comes from the identification and stigmatization of certain groups that are associated with victimhood, deprivation, dependency or pathology [27]. Critical scholars, such as Stätsett [28], point out that vulnerability is a constitutive part of the human condition and not something that can be eliminated by intervention policies. Furthermore, it has been observed that categorizing a certain group (women, immigrants, the elderly) as vulnerable risks reinforcing the exclusion process that, in theory, was intended to be eliminated by certain top-down approaches [29]. Indeed, Boyadjieva & Ilieva-Trichkova assert that hiding people’s capacities to resist and influence the course of their lives may downplay or even deny the agency of the person perceived as vulnerable. This view can be misleading as people have multidimensional capacities that cannot be forgotten. In addition to the issues described above, Spini, et al. [2] offer a systematic critique of identifying vulnerable groups without understanding the socioeconomic context and historical variables.
In light of this approach, vulnerability does not affect specific predetermined groups, but rather affects groups and individuals in a changing way according to their individual equation with respect to the social dynamics of risk and marginalization, placing them in a continuum of exclusion-integration. Among the groups considered vulnerable, young people have a significant presence [5]. This issue of social inclusion of young people has been present in European political agendas, especially since the last two decades when several specific programs have been launched in terms of education, employment, social inclusion, civic participation, entrepreneurship, etc. [30]. European policies have emphasized the economic factor [7]. However, the weakening of the economic position of this group, increased in 2020 with the Covid 19 pandemic, and their reduced expectations of improvement may lead to a deterioration of their social position and, therefore, of their civic status. A situation that had already been identified previously [31].

Multidimensional Approach to Vulnerability

Recognizing the complexity of the notion of vulnerability, for the purposes of this article, the situation of European youth is analyzed through three dimensions: empowerment, social/civil engagement and employability. Our selection of dimensions and indicators is theoretically driven. In particular, this proposal is inspired by the work of several authors, mainly Robert Castel.
Robert Castel [32] describes vulnerability as a dynamic condition marked by the transition from inclusion to exclusion and vice versa. It differs from permanent poverty and social exclusion in that these are static situations characterized by chronicity. It is only apparent when it no longer exists and it has turned into a more severe situation, although most of the time it has been absorbed back into normality. The author identifies two axes (employment and social ties) to situate people in the social space [8]. The axis related to employment has a range of positions, from fixed employment that provides solid support to the other extreme characterized by insecurity and insecurity of employment.
Representing it schematically: being in the integration zone means that one has the guarantees provided by a permanent job. The second axis reflects social relations through inscription in family and sociability networks, on a continuum from solid support to lack of social resources [33]. The vulnerability zone implies a dual process (poor relationships and lack of incorporation into the labor market). In our model, we incorporated another element related to cultural and civic participation [34]. Silver [9] states that the political dimension, must be taken into account to characterize social inclusion. According to this author, the political dimension refers to “the ability of all citizens to participate in collective decision-making on matters that affect their lives” (p. 10 in [35]). In our view, this approach is particularly suitable for analyzing the conditions of young people. To obtain a broader view of youth engagement, alongside political participation we have also included cultural participation. Those dimensions that are not necessarily related. In fact, it seems that their association also varies across national contexts.
In this paper, we have included another dimension related to personal characteristics, named empowerment. This is a process predominantly referred to groups to transform their action options [24]. To begin with, Figure 1 provides a general view of our three dimensions and subdimensions, which are described in next paragraph. Below, Section 3 (materials and methods) presents the indicators we have used to measure them.

3. Materials and Methods
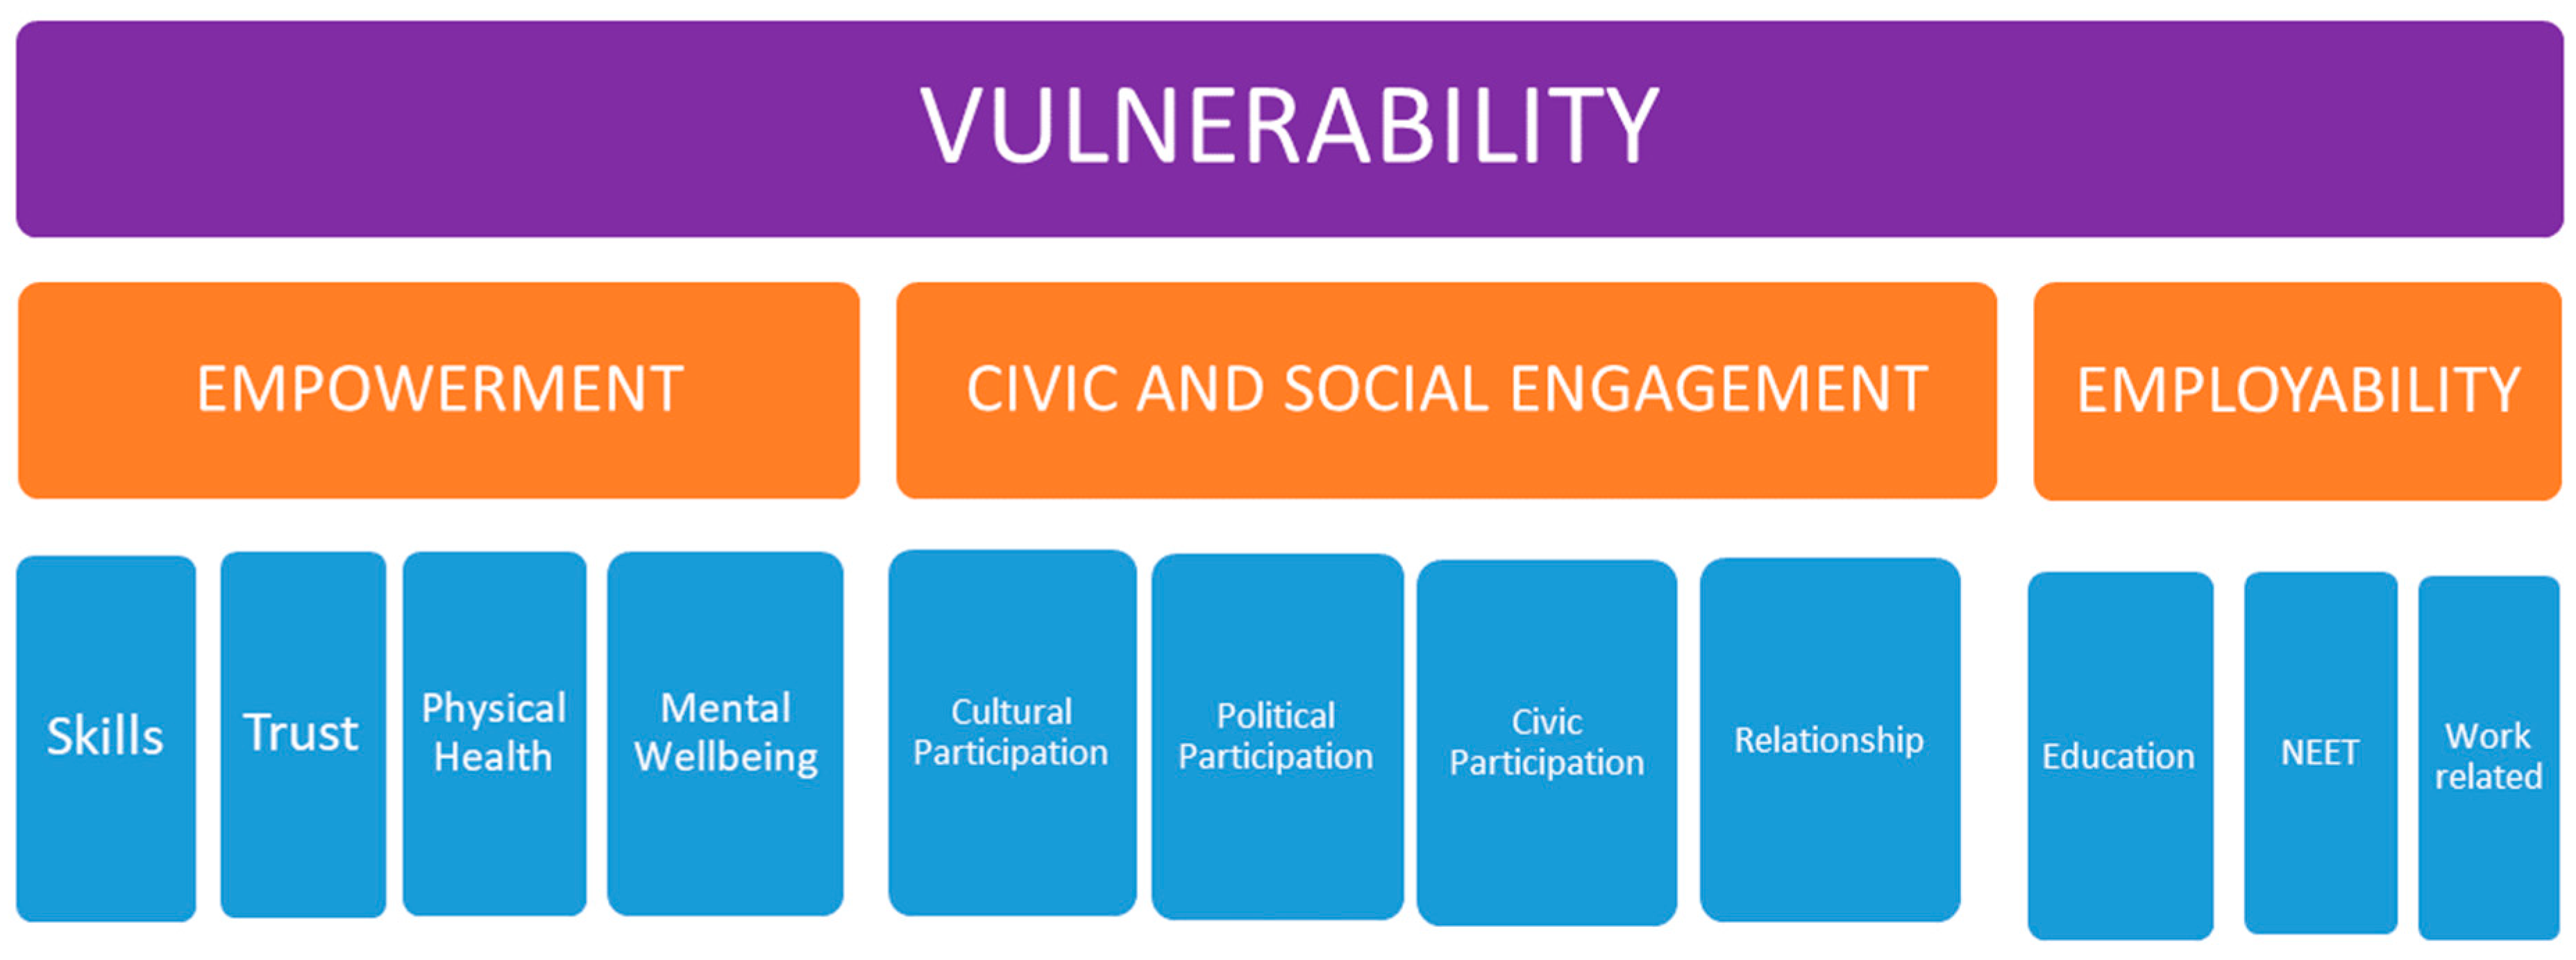
We have choosen a methodological approach appropriated for reducing the macro information of the countries to several dimensions that provide us with a series of scores that generate a synthetic variable score of each country in each of the dimensions analyzed, using countries as unit of analysis.
Previous studies looked at macro-analysis of country situations used in the construction of indicators including the Active Citizenship Composite Indicator (ACCI) [36], the two-dimensional typology of youth welfare citizenship [37] and the synthetic index on adult education as a common good (IAECG) [38].
Chevalier’s work [37] about the development of a deductive two-dimension typology of ‘youth welfare citizenship’ is one of the main references that is worth highlighting. Chevalier combined two dimensions, social and the economic citizenship, in a bidirectional typology presenting varieties of ‘youth welfare citizenship’. This typology helped to better account for the situation of young people in Europe and the way welfare states take care of them or not.
In a similar way, inspired by Chevalier, we have looked for some indicators that allows us to establish the vulnerability of the young population according to the ENLIVEN vulnerability model identified previously. On this occasion, following Schuller [39], we have unified the dimensions in such a way that we worked with three. Although ‘social relations’ and ‘active citizenship’ have been separated into objectives, in this chapter they have been analysed together as ‘Civic and social engagement’ seeking greater parsimony, as the statistical interpretation of the four-dimensional analysis has increased the complexity of the graphs and the results.
Another inspiration for our macro-analysis was the research carried out by Boyadjieva and Ilieva-Trichkova [38], where they measure adult education as a common good. Based on data from the Adult Education Survey (AES), the Economically Active Population Survey (EAPS) and the Continuing Vocational Training Survey (CVTS) of 24 European countries, the authors developed a composite index (IAECG), based on these four dimensions, which measure the degree to which adult education is practised as a common good in a given country.
For the calculation of the IAECG, they followed the methodology used by Lessenski [40], because “it offers very clear guidelines for all statistical procedures and it allows exploring the dynamics of the indexes over time as a next step of the analysis.” (p. 349). They demonstrate how the index of fairness in participation in adult education can help in exploring the meanings of adult education and the obstacles to adults’ participation in education [38].
These investigations have been used as a model for the confection of the different indicators as well as the importance of their weighting. So, our model consist in three dimension that are based on the score of eleven sub-dimensions, twenty-three variables, thirty-three indicators that make up the different issues, and which we have collected from the aforementioned official sources (Eurostat, Eurobarometer and OECD). The objective of this procedure is to segment the countries into different groups. Each of the three dimensions—empowerment, civic and social engagement and employability—contains different scores of basic indicators (thirty-three):
(1)
‘Empowerment’, which covers the proportion of vulnerable young people relating development of skills, trust in the system, physical health and mental well-being. The skills mentioned in the empowerment dimension are mainly related to literacy and numeracy (OECD) and digital skills (Eurostat). These skills are basic to ensure a mini-mum personal capacity for empowerment in today’s world and have been pointed out in The 2030 Agenda for Sustainable Development, more specifically in its Target 4.6, vis “By 2030, ensure that all youth and a substantial proportion of adults, both men and women, achieve literacy and numeracy”.
(2)
‘Civic and social engagement’, which covers vulnerable young people’s involvement in cultural, political, civic participation and the relationship with friends and relatives. This subdimension has been measured through a battery of indicators from official sources such as active participation in artistic/musical activities, cultural participation score, voting, participation in political parties, in trade unions, taking part in official organizations, active participation in society, volunteering, social interaction and family relations
(3)
‘Employability’, which covers vulnerable young people’s involvement in education, and work-related skills, the unemployment rate and the NEET rate. The work-related skills mentioned in the employability dimension relate to the main skills collected by Eurostat in the Continuing and vocational training courses (CVT) section. Specifically they are general IT skills, professional IT skills, management skills, team working skills, customer handling skills, problem solving skills, office administration skills, foreign language skills, technical, practical or job-specific skills, oral or written communication skills, numeracy and/or literacy skills and other skills and competences. In our analysis, and in order to simplify the information of this indicator, we have selected the values of technical, practical or job-specific skills.
We assign different relevance to each indicator within a given sub-dimension, calculated either by dividing the overall weight of the sub-dimension by the number of indicators or by their relative importance. For the sake of transparency, the weights are provided in Table 1. Although lifelong learning could be aimed at employment, the continuity of education is considered one of the ways to improve the possibilities of labour insertion. For this reason, the list of indicators related to the employability dimension includes incorporation into educational programs.
After the weighting, we constructed the final score for each of the dimensions, where the value comprises all the sub-dimensions; we then calculated it for the 28 European countries. The scores range between 0 and 100 (percentage) with a lineal interpretation. In order to achieve this linear sense, following other studies on the construction of indicators [41], we have reconverted to negative values those indicators whose increase represents a negative value on the analyzed sub dimension.
In order to ensure the maximum possible reliability in the calculation of the dimensions, several criteria have been established in the selection of the indicator scores that refer to the data extracted from secondary sources and statistics that meet the requirements of:
  • Reliability of sources. The data collected for this analysis have been selected from sources of high reliability: official EU statistical institutions (Eurostat, Eurobarometer, and European Values Study) and OECD.
  • Geographical comparability. In order to carry out an analysis of the 28 EU countries, we have needed the data to be comparable with each other. The model presented in Table 1 corresponds to the dimensions, sub-dimensions and variables for the 28 European countries analyzed.
  • Periodicity. As one of the objectives of this analysis is to observe the evolution of the countries in the analyzed dimensions, collected data correspond to two different times. On the one hand, the first of these periods is before the implementation of the two lifelong learning programs chosen by the ENLIVEN political itinerary (Guarantee of youth and improvement of qualifications) (2013). On the other hand, the second moment is after their implementation, corresponding to the last update of available data (2017). This requirement of periodicity has not always been met in all the variables since there are measurements of indicators that are not carried out on a regular basis in the European Union. In the case of these indicators, in order to facilitate greater statistical adjustment, the score collected for the two moments of analysis has been maintained.
  • Availability by age range. In the indicators where it has been possible, the selected data have been disaggregated by age groups with the intention of selecting the scores corresponding to the population we study (from 15 to 29 years old).
  • Availability by educational attainment level. In the indicators where it has been possible, the selected data have been disaggregated by educational attainment level with the intention of selecting the scores from the population we study: vulnerable people (Less than primary, primary and lower secondary education—levels 0–2).

4. Results

The results of the analysis of data from the different countries are presented (Table 2) in the three proposed dimensions that provide us with a score by country in each of the two periods selected. These dimensions have been analyzed, taking into account the European average and its evolution in each country in the two historical moments (2013/2017).

4.1. Country Descriptions by Their Institutional Type

4.1.1. Empowerment

Empowerment is a complex multidimensional process of individuals change and discovery [24]. The ability of people to use their personal and social resources is a high indicator of (in)vulnerability. In this study we consider that overcoming vulnerability requires the conviction, in general terms, that increasing people’s freedom of choice and action to give them control over their own lives (resources and decisions). From this perspective, a sense of well-being and competence, related to the desire to act, is one of the first prerequisites for overcoming vulnerability [42].
An individual with a low level of capabilities is more vulnerable than another individual who is better equipped for addressing negative external circumstances. To understand empowerment our model includes four elements that encompass the skill development, physical health, and mental well-and trust or confidence in the system. To be more specific about skills, it is worth noting that the skills mentioned in the empowerment dimension are mainly related to literacy and numeracy and digital skills Both are basic to ensure a minimum personal capacity for empowerment in today’s world and have been pointed out in the 2030 Agenda for Sustainable Development, more specifically in its Target 4.6, vis: by 2030, ensure that all young people and a substantial proportion of adults, both men and women, achieve literacy and numeracy).
With regard to the empowerment, dimension in the average EU-28 European countries it can be observed that there has been a slight increase in the two moments analyzed. This increase has not occurred in all the sub-dimensions, being above all the greatest in the section corresponding to basic skills (literacy and numeracy (OECD) and digital skills).
Table 2. Empowerment dimension scores. EU-28 (%).
SkillsTrustPhysical HealthMental WellbeingEmpowerment
GEO/TIME2013201720132017201320172013201720132017
EU-2881.684.949.049.031.331.765.065.061.663.0
Belgium82.985.254.354.328.328.766.966.962.463.4
Bulgaria70.272.634.034.031.130.848.148.151.352.1
Czechia83.790.049.349.332.832.461.161.161.964.3
Denmark89.690.971.371.335.134.073.973.970.270.5
Germany86.488.452.752.730.632.369.569.564.866.1
Estonia89.290.953.053.026.024.864.464.463.664.0
Ireland73.278.947.747.729.929.472.072.059.561.7
Greece77.482.140.040.032.131.554.154.156.558.2
Spain78.080.739.339.332.634.257.957.957.859.2
France79.282.641.741.730.429.965.265.259.861.0
Croatia88.285.939.339.334.333.965.365.364.163.1
Italy72.075.741.341.330.532.354.154.154.156.0
Cyprus77.283.936.036.031.432.058.858.857.059.9
Latvia83.985.254.054.030.130.056.056.060.561.0
Lithuania84.988.358.758.733.732.465.965.964.765.7
Luxembourg88.691.254.054.034.031.670.670.667.067.4
Hungary79.981.252.752.732.032.464.964.961.462.1
Malta83.689.251.751.729.730.062.862.861.764.1
The Netherlands90.291.564.064.029.629.172.372.367.968.3
Austria87.290.257.057.029.027.170.070.065.366.0
Poland78.883.249.349.334.033.370.170.162.564.1
Portugal81.987.940.340.328.027.056.756.758.060.1
Romania62.971.660.360.331.431.562.362.354.658.1
Slovenia83.484.440.340.334.232.965.465.462.362.4
Slovakia87.488.446.346.334.434.268.968.965.465.7
Finland92.193.170.070.035.635.078.178.172.272.5
Sweden87.890.164.364.337.238.267.067.067.668.8
UK84.287.951.351.327.126.356.456.459.761.0
Table 2 shows that the average evolution of these countries increased by more than one point (1.4%) between the two periods. In the countries with lower previous scores they have increased their weight in this dimension, in some cases with notable percentage increases of more than two points (Czechia, Ireland, Cyprus, Malta, Portugal and Romania) in four years. On the other hand, as it seems likely the countries with the highest previous scores in this dimension (Denmark, Luxembourg, The Netherlands, Austria, Finland, and Sweden) have had well below-average increases in these four years.
Health is at the core of youth well being. The second and third subdimension are related to health, both physical and mental. We explore it two subdimensions related to this issues through a series of indicators both positive (life expectancy, physical exercise, frequency of being haappy, satisfaction) and negative (alcohol consumption, tobacco cosumption). Finnally, trust can be considered a requirement that enables people to feel safe and comfortable in public life. Under this heading we provide indicators that refer to three types of trust, self-confidence and institutional trust. As can be gauged from Table 2, which shows the average across the EU countries, in the three subdimensions, data related to physical and mental health vary between countries. Finland and Denmark are in first place, followed closely by a group of countries including The Netherlands, Luxembourg, Austria and Ireland. In relation to the development of basic skills, Table 2 underlines the evolution of seven countries that in this period have advance by 5 point or more: Czechia, Ireland, Greece, Cyprus, Malta, Poland, Portugal, and Romania. All of them except Greece, are the countered mentioned which have increased their weight in this dimension. On the other hand, Croatia and Luxembourg maintained the ratio or suffered a slight decreased (Croatia). In the case of Croatia due to a decrease in basic skills and Luxembourg accused a decrease in the index of physical health.

4.1.2. Civic and Social Engagement

Social engagement appears to be broadly accepted as a conceptual definition in the research literature on social capital engagement in community activities [18]. Among the difficulties encountered by young people in their transition to adulthood, Xie et al. [6], mentions the importance of establishing trusting relationships. in this sense Castel [8] includes social relationships and bonding as one of the supports in the process of overcoming social exclusion. For this reason, this dimension involves a subdimension related to the social engagement of youth population. Another aspect is related to social relationships through family networks and peer-to-peer sociability. Our proposal devoted this dimension to issues related to the engagement of youth people in social, political an cultural life.
With regard to this dimension in the average EU-28 European countries (Table 3), it can be observed that there has been a slight increase in the two moments analyzed. This rise has not occurred equally in all the subdimensions. Thus, “cultural participation” has decreased, while the subdimension “relationship” has remained stable. However, “civic participation”, and especially “political participation”, has increased considerably, leading to an overall increase in this dimension.
As in the empowerment dimension, in this case the average evolution is more than one point between the two periods analyzed (1.4%). A number of countries increased their weight in this dimension with notable percentage increases of more than two points (Bulgaria, Germany, Greece, Spain, Croatia, Italy, Lithuania, Poland) in four years. Nevertheless, other countries reduced their weight in this dimension (Belgium, Czechia, Cyprus, Hungary, Slovenia, and Slovakia) with decreases in participation in the four years analyzed.
This evolution was varied, unevenly affecting different subdimensions in the countries. For instance, there was a decrease of cultural participation in sixteen countries. Among those that stand out Italy (6 points), Cyprus and Slovakia (5 points), Malta (4 points). Another group of countries dropped around 3 points (Greece, Spain, Croatia, Hungary, and Bulgaria) or 2 points (Belgium, Portugal and UK) and the rest of countries one point or less (Germany, Poland, Slovenia and Sweden). On the other hand, it is remarkable the increase of other countries in this subdimension as Ireland (6 points).
Following the previous proposal by Hoskins and Crick [18] we considered that civic competences are related to “the ability to engage effectively with others in the public domain, and to display solidarity and interest in solving problems affecting the local and wider community. This involves critical and creative reflection and constructive participation in community or neighbourhood activities as well as decision-making at all levels” p. 8. In terms of political participation, in general terms it is an increase of participation (6 points in the average data of the EU) in a very irregular manner. Political participation increased significantly among young people in Bulgaria, Germany, Spain, Italy, Lithuania, Croatia, Poland, Austria, UK and Sweden. In all those countries, it increased more than seven points, with Malta highlighted with more than 16 points. In the rest of the countries, it is lower (between 4 and 7 points in Estonia, France; The Netherlands, Portugal, Romania, and Finland; less than four in Greece, Cyprus, Latvia, Hungary, Ireland, Belgium and Denmark). Nevertheless, young people in Czechia, Slovenia and Slovakia seemed to disrupt the political commitment, maintaining the levels in Luxembourg.
Overall, speaking, civic participation also grew (3 point in the average of the European Union). Three countries had a great evolution with gains more than 10 points (Greece, Italy, and Bulgaria), followed by Romania (6 points); Spain and Poland (5 points); Malta and Portugal (4 points). The rest had a small improvement (Latvia, Ireland and Belgium) or kept the ratio (Denmark).

4.1.3. Employability

Becoming an adult entail becoming financially independent. The erosion of work organization is a fundamental rupture that lies in the weakening of the labor market as the main mechanism for social integration [1]. Consequently, increased job insecurity erodes the stability of employability and increases insecurity.
Based on the International Labor Organization [43], our proposal for the employability dimension refers to transferable skills and qualifications, taking advantage of education and training opportunities aimed at achieving secure and decent employment, progressing within the enterprise and training presented or changing jobs, and adapting to technological changes and labor market conditions. For this reason, we have included an indicator related to continuing education as a means of strengthening one’s position in the labor market, as well as skills related to taking advantage of job opportunities. In order to improve employability, two fundamental elements have been identified: firstly, the development of knowledge and skills necessary for integration into the world of work. The second factor is insertion into professional environments where the necessary professional, technical and soft skills are developed. For this reason, we have included the opportunities for particiaption in adult education as a way to improve the chances in the labour market. A third aspect that we have included refers to those youth people neither studying or working (so called NEET).
Under the “work related” category we include a set of indicators related to professional careers, from job opportunities, training developed with on-the-job training and the employment rate itself. (Table 4), it can be observed that there has been a slight increase in the two moments. This increase has not occurred in all sub-dimensions equally. Thus, the ‘NEET’ related sub-dimension has declined and ‘education’ as participation in adult education, has remained stable. However, the ‘work related’ sub-dimension has increased, leading to a general increase in the dimension analyzed.
Using employability dimension, we identified that the average evolution of these countries is an increase of 1.6% in four years (Table 4). A number of countries have increased their weight in this dimension with notable percentage increases of more than three points (Estonia, Ireland, Latvia, Lithuania, Hungary and Malta) in four years. However, some countries have maintained their scores in this dimension (Belgium, Czechia, Greece, Croatia, Italy, The Netherlands, Austria and Portugal) with increases close to average in the four years analyzed.
In relation to participation in lifelong learning course, there is a tendency to maintain the ratios in almost all countries, with slight increases or limited decreased. Two countries that moved away from this trend were Malta that increased 4 points, the same that Denmark descended.
Number of NEET has been one the main indicators of the lifelong learning policies. In this case, there is a widespread decline which was accentuated in countries that had a high number of young people who did not study or work (as the Mediterranean countries: Greece, Spain, Portugal (around ten points), except Italy (2 points). Bulgaria, Ireland and Latvia, Malta and Germany (descend around 5/6 points).
Regard the percentage of young people who have a better position in the labour market because they have improved their skills, participation or employment opportunities has in-crease slightly (the work related subdimension evolution was from 20.7 to 22.3 at the European Union). In this case, the evolution varied greatly between countries; On the one hand, the opportunities seemed to improve in the Baltic countries (Estonia, Lithuania, followed by Latvia). On the other hand, it worsened for the young people of the Mediterranean arch (Cyprus, Greece and Portugal) or remained stable (Spain). The situation also seemed to become more complicated for young people in Germany and Poland).

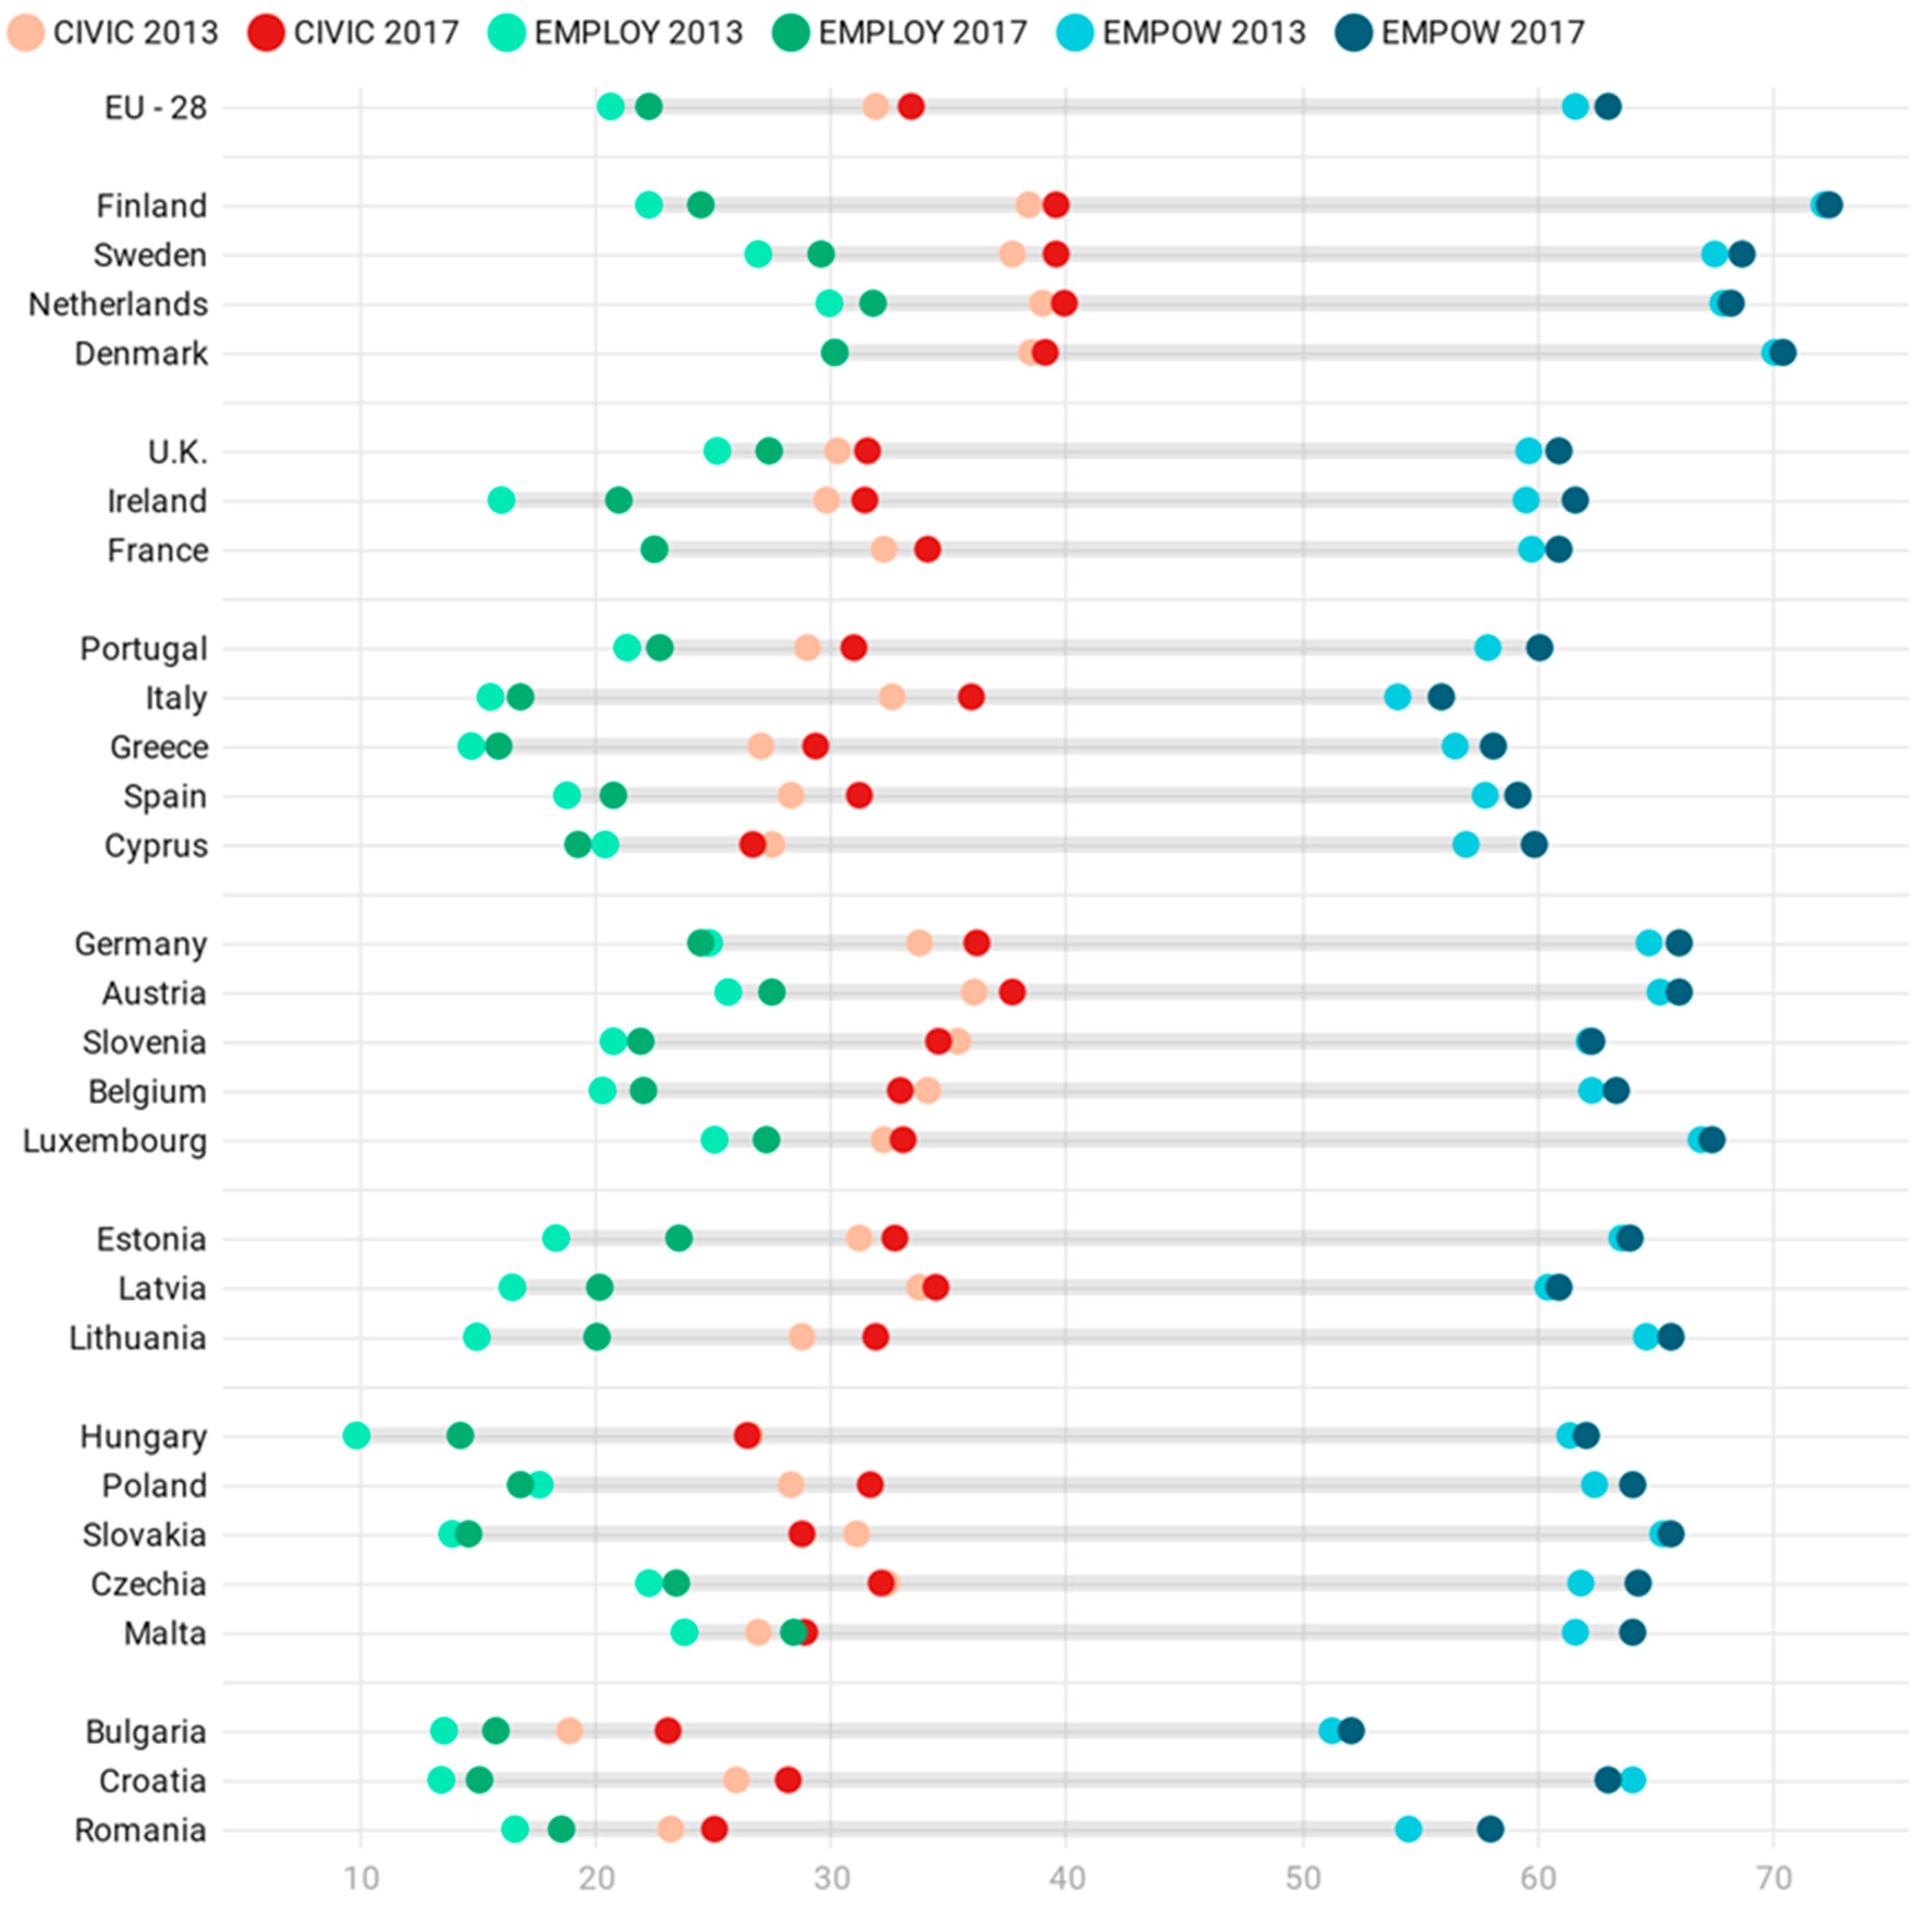
4.2. Combined Analysis of the Three Dimensions

After exploring the data for each of the dimensions, it is convenient to be able to rank and group the different countries as well as to have a vision of each of them with respect to the three dimensions in the two moments analyzed (2013/2017).
Table 5 shows the overall scores and the respective country rank for each of the dimensions. The countries are sorted according to their overall dimension score. Data demonstrates that differences occur between the country ranks depending on the three dimensions. For example, Finland, which occupies the first place according to its overall score in empowerment, ranks third on civic and social engagement, and tenth on the Employability dimension. These differences indicate that measuring vulnerability outcomes is a complex phenomenon and that, in this respect, structural aspects that mediate in the improvement of outcomes appearing in all countries should be taken into consideration.
These data also show that the countries differ considerably in relation to employability and empowerment—the difference between the highest and lowest score is 22.8 and 16.4 percentage points respectively. The differences between countries in relation to civic and social engagement, however, are much more reduced—the highest scores are 40 (The Netherlands, Finland, Sweden) and the two lowest 23.1 (Bulgaria).
To deepen our analysis, we have identified distinctive groups of countries based on their overall score with the objective of providing an overview of the intersection between the levels of the three dimensions analyzed. To make this grouping, we took as a basis the study by Roosmaa and Saar [14], which theoretically distinguished seven types of countries, corresponding to the typology based on varieties of capitalism, welfare state regimes and their extensions. In previous articles this approach has been used in the analysis of lifelong learning [35] in this case, it is used as a contextual framework to analyze the situation of vulnerability of young Europeans.
The countries that Roosmaa and Saar [14] did not cover in their typology (Spain, Belgium, and Czechia, France) have been assigned by affinity. As for their analysis, the main objective was to have a representation of the key countries in each of the typologies; however, our intention here is to be as descriptive as possible about the situation of the countries analyzed.
As noted above, we analyze the evolution of the three dimensions by comparing seven types of adult learning countries.
The more or less common division of countries is the four types of welfare states:
(1)
The Nordic or social democratic country type—Norway, Sweden, Finland and Denmark. The results of our analysis place The Netherlands in this category despite the fact that it does not share the same geographic location or social democratic orientation.
(2)
The liberal country type consists of the United Kingdom, Ireland and France.
(3)
Portugal, Italy, Greece, Spain and Cyprus are classified as southern European countries.
(4)
Germany, Austria, Slovenia, Belgium and Luxembourg constitute a continental or corporatist type of adult learning.
In addition, three types of Central and Eastern European or post-socialist countries are distinguished:
(5)
Neoliberal (Estonia, Latvia, Lithuania)
(6)
Embedded neoliberal (Hungary, Poland, Slovakia, Czechia and Malta)
(7)
Balkan countries (Bulgaria, Croatia and Romania)
In what follows, we will present the results by those groups of countries. According to the data analysed (Figure 2), the group of countries that are close to the European average are the liberal countries and the neoliberal Baltic countries. The highest percentage in all three dimensions is the Nordic or social democratic country type and in those countries with a continental or corporatist type of adult learning. On the other hand, the group of countries below the European average are the countries of southern Europe and those belonging to Eastern Europe or post-socialist countries of the embedded neoliberal type and the countries of the Balkans.
With regard to the analysis of the two time periods (2013/2017), it should be noted (Figure 2) that there are no substantial changes by the composition of the groups of countries, although there is a slight increase in the values of the dimensions, especially in employment, as described in the previous section. As can be seen, the analysis of countries based on these three dimensions does not fully reflect the differences corresponding to the typology of countries based on their variety of capitalism and welfare state regime [14]. Figure 2 shows how the different dimensions overlap in various countries. On the one hand, the Nordic countries and The Netherlands show similar patterns, with high scores on all three dimensions. Another group with similar results are Austria, Germany, Belgium, Luxembourg, Slovenia and Slovenia. Mediterranean countries show similar patterns, with lower levels of engagement, employment and empowerment. Among the Eastern European countries, there is some diversity, although the level of civic engagement appears to be lower. The commonalities within country types suggest the usefulness of this approach, especially when illustrating the value of the three dimensions considered and compared across country types.

5. Discussion and Conclusions

Vulnerability is a concept introduced to explain the exposure of the population to suffer the consequences of a complicated or risky situation [12]. This paper proposes a multidimensional approach to explore the situation of young people in Europe according to three dimensions of vulnerability: empowerment, civic-social engagement and employability. Rather than portraying vulnerability from a single angle, our proposal incorporates multiple international data that together offer a global view of a complex phenomenon. We present a proposal as a bounded system. This represents a step forward in the debate on vulnerability, since it offers a broad view of the population through a series of indicators (N: 33) that can provide a comparative approach between different territories. To this end, we have studied the evolution of the 28 European countries through secondary data.
As a target group, we have chosen young people (in the age range 15 to 29 years) because as their transition to adulthood is increasingly complex in contemporary society they are considered as one of the new social risk groups [44]. However, studies addressing the variety of situations of this group are still scarce [37]. In terms of time, we have identified two different moments; the first was the year 2014 when the Youth Guarantee program was launched one of the main projects aimed at overcoming the difficulties of entry into the labor market for young Europeans. It should be remembered that the labor dimension is the main feature of identification of vulnerable groups in European policies [34].
Although the proposal is exploratory, this paper provides empirical evidence on different dimension of vulnerability across Europe. Previous research has showed the existence of imbalances between many European countries related to the labor market integration [15]. In line with existing evidence, our analysis confirms territorial variations which potential impact on the life of European youth population. Despite the convergence of European youth policies, Corrales-Herrero & Rodriguez-Prado [15] draw attention to the fact that the combination of structural and macroeconomic factors leads to complex situations in some countries (such as the Mediterranean area) limiting the effectiveness of such policies. The model presented here incorporates a dimension of social, political and cultural participation that provides a broader view of this social group and offers a more complex picture of the phenomenon under study. When discussing the degree of social participation among the population of the Member States, researchers are referring to significant differences and obvious geographic pattern [19]. Along with certain patterns similar to the employability data, our analysis reveals some different features. On the one hand, Northern countries (Sweden and Denmark) that combine an inclusive education system with supportive labor market policies offers more possibilities to overcome risks and become involved in the labor market as well as in socio-political and cultural life. On the other hand, it seems that social and cultural involvement is a more widespread feature among certain countries such as Italy or Latvia.
The existing body of research has drawn attention to the risks of using the concept of vulnerability to specific collectives as it labels and singles out such collectives, without remembering that vulnerability as a complex phenomenon hides the capacities of the adjectivized people [5]. The empowerment dimension that we have identified is based on certain skills necessary both for participation (such as confidence) and basic skills for job search. This encompasses not only personal capacities but also acknowledge alternatives tools as they support active scope of activities [42]. It has been shown how the structure of opportunities affects the transition between education and employment [45]. The connection between contextual characteristics should not be directed only to the labor market. The data presented here indicate a crucial step by also incorporating the socio-civic engagement of these young people.
Research on regimes of youth transitions could help to explain the logic behind. Table 4 provides a comparison that allows an understanding of transnational diversity in the various dimensions of vulnerability. As an exploratory study, it provided a preliminary view of the configuration of European youth. The results indicate that the different dimensions overlap, although not completely. Chevalier [37] identified a cluster of countries comprising Northern countries, such as Finland, plus liberal countries (such as UK) and The Netherlands which encompass economic citizenship, whose education system seeks to provide some skills to all young people (skills for all), resulting in few school early school leavings, and an individualized system of social, together with a selective strategy. As can be seen in Table 6, this group of countries also reaches the highest levels in our study. In this case, it seems that education and employment policies have the function of “enhancing human capital” and training, together with a more independent view of young people that allows them a certain independence also protects them from vulnerability. Chevalier [37] considers that in terms of social and citizenship policies, the Mediterranean countries form another group characterized by family dependency and difficulties of access to the labor market. In our study, several of these countries are repeated in the three dimensions studied. By incorporating the Eastern European countries, we can see that this situation is shared with other young people from Eastern European countries, who are also in the same situation. Our findings also highlight that the analyzed countries could be assigned by affinity in line with the typology developed by Roosmaa and Saar [14].
However, this tendency is not always the case. The multidimensional approach allows identifying different areas of divergence that offer a much more nuanced view. It is perhaps informative—and important—that, according to all the dimensions we have considered, all types of countries (and all countries) have room to aspire to improve their performance compared to the criteria theoretically established for the indicators. When comparing countries with each other, in this respect we have been able to see how the countries with the highest scores belong to the Nordic or social democratic type or the continental or corporatist type, while those that are further below the European average are classified as Southern European, embedded neoliberal and Balkan countries (Table 6).
It is also worth noting that our macro-data analysis highlights the importance of incorporating structural and institutional factors to understand outcomes better. This analysis stimulates the discussion on the influences by structural factors; the classification does not explicitly describe the mechanisms underlying this differentiation. Drawing upon our findings, we argue in this respect that the adoption of a multidimensional approach to vulnerability clearly has important implications for the design and evaluation of protection policies designed for the inclusion of groups considered vulnerable. The results of this study illustrate how the diversity of situations of the same age group whose capacities and possibilities offer a varied panorama that goes beyond the need for incorporation into the labor market. It brings other ways to seeing the vulnerability and thereby enrich our view of this complexity. It is reasonable to assume that a large part of the European youth population is exposed to a diverse spectrum of risks, so we suggest a combined approach, incorporating specific measures targeting several dimensions, while trying to define or identify the skills to be developed. We therefore conclude by questioning the generalist discourse on youth, which runs the risk of not responding adequately to the new profiles and risks stigmatizing.
For this reason, it might be useful to further analyze macro-level factors, such as the general level of inequality, the characteristics of the education system, the regulation of the labor market and the social protection provided by the welfare state, which are relevant to understanding the different types and patterns of outcomes identified. In this paper we present an exploratory study, our intention here has been to explore the situation of the European countries. Regarding the limitations of working with country-level variables, two important aspects go unnoticed in this type of analysis. Namely, the different levels of governance (regional and transnational), and the lack of statistical testing and validation in the construction of some of the typologies based on these data [38]. In this regard, the national focus of the study hides regional divergences, often more important than the differences between nations [45]. This article has not taken into account the analysis of structures to cope the risks or any situation. Among the methodological limitations of this study, we should point out the accessibility of secondary data. Indeed, by using a set of indicators from different sources (OECD; European Union) and different surveys, the data is not always available in similar formats. For example, the same age groups do not always disaggregate them or the periodicity of the surveys is not the same for all the variables studied.
In this article, we present the situation of vulnerability among European youth. Because of our analysis, we argue that it is important to take these three dimensions into account when referring to the social outcomes in vulnerability. While we do acknowledge our selection of indicators was limited to availability, our proposal suggests this approach is feasible, informative, and thus useful to understand countries’ relative position towards each other and EU average as well as their changes over time. It is reasonable to assume that additional or different aspects could be included in the future. This points out to the necessity of following studies to clarify the relationships among the different dimensions, particularly for testing the impact of COVID 19 pandemic on these dynamics.

Author Contributions

Conceptualization, C.M.-O. and Á.M.; methodology, Á.M. and J.S.; writing—original draft preparation, Á.M. and C.M.-O.; writing—review and editing, Á.M. and J.S. All authors have read and agreed to the published version of the manuscript.

Funding

This research was undertaken within the ENLIVEN project and received funding from the European Union (EU), Horizon 2020 research and innovation program under grant agreement No. 693989.

Institutional Review Board Statement

Not applicable.

Informed Consent Statement

Not applicable.

Data Availability Statement

Not applicable.

Conflicts of Interest

The authors reported no potential conflict of interest.

References

  1. Ranci, C. Social Vulnerability in Europe: The New Configuration of Social Risks; Palgrave Macmillan: Basingstoke, UK, 2010. [Google Scholar]
  2. Spini, D.; Bernardi, L.; Oris, M. Vulnerability Across the Life Course. Res. Hum. Dev. 2017, 14, 1–4. [Google Scholar] [CrossRef] [Green Version]
  3. Gandarias Goikoetxea, I. Resistir Desde La Vulnerabilidad: Narrativas De Mujeres Subsaharianas Sobre Su Tránsito Hacia Europa. Pap. Del CEIC 2019, 2019, 205. [Google Scholar] [CrossRef]
  4. Ippolito, F. Protecting Vulnerable Groups: The European Human Rights Framework; Hart Publishing: Oxford, UK, 2017. [Google Scholar]
  5. Zimmerman, A. Social Vulnerability as an Analytical Perspective. Population Europe Discussion Papers, Discussion Paper 4. Available online: https://population-europe.eu/sites/default/files/pe_discussionpaper4_final_web.pdf (accessed on 10 May 2021).
  6. Xie, R.; Sen, B.; Foster, E.M. Vulnerable youth and transitions to adulthood. New Dir. Adult Contin. Educ. 2014, 2014, 29–38. [Google Scholar] [CrossRef]
  7. Maiztegui-Oñate, C.; Roosalu, T. Report on Utilisation of Lifelong Learning Policies and Funding Schemes Promoting Social and Economic Inclusion of Vulnerable Groups in EU and Australia, 2019. Available online: https://ec.europa.eu/research/participants/documents/downloadPublic?documentIds=080166e5c43c63dd&appId=PPGMS (accessed on 15 August 2021).
  8. Castel, R. The Rise of Uncertainties. Crit. Horiz. 2016, 17, 160–167. [Google Scholar] [CrossRef]
  9. Silver, H. The Contexts of Social Inclusion; DESA Working Paper No. 144; United Nations: New York, NY, USA, 2015. [Google Scholar]
  10. Vandekinderen, C.; Roets, G.; Van Keer, H.; Roose, R. Tackling social inequality and exclusion in education: From human capital to capabilities. Int. J. Incl. Educ. 2018, 22, 1–20. [Google Scholar] [CrossRef]
  11. Osgood, W.; Foster, M.E.; Courtney, M.W. Vulnerable Populations and the Transition to Adulthood. Future Child. 2010, 20, 209–229. [Google Scholar] [CrossRef]
  12. Adger, W.N. Vulnerability. Glob. Environ. Chang. 2006, 16, 268–281. [Google Scholar] [CrossRef]
  13. Milana, M.; Klatt, G.; Vatrela, S. Europe’s Lifelong Learning Markets, Governance and Policy. Using an Instruments Approach; Plagrave Mc Millan: Cham, Switzerland, 2020. [Google Scholar]
  14. Roosmaa, E.-L.; Saar, E. Adults who do not want to participate in learning: A cross-national European analysis of their perceived barriers. Int. J. Lifelong Educ. 2017, 36, 254–277. [Google Scholar] [CrossRef]
  15. Corrales-Herrero, H.; Rodríguez-Pardo, B. Measuring youth living conditions in Europe: A multidimensional cross-country approach. Soc. Indic. 2021, 155, 1–41. [Google Scholar]
  16. European Commission. Analysis of the Performance of Youth Guarantee in the EU Member States 2013–2015; Short Analytical Web Note 2/2016; European Commission: Brussels, Belgium, 2016. Available online: http://ec.europa.eu/social/main.jsp?catId=113&langId=en (accessed on 5 August 2021).
  17. Scandurra, R.; Cefalo, R.; Kapezov, Y. Drivers of youth labour market integration across European regions. Soc. Indic. Res. 2021, 154, 835–856. [Google Scholar] [CrossRef]
  18. Hoskins, B.; Crick, R. Competences for Learning to Learn and Active Citizenship: Different currencies or two sides of the same coin? Eur. J. Educ. 2010, 45, 121–137. [Google Scholar] [CrossRef]
  19. Lelkes, O. Social participation and social isolation. Income and living conditions in Europe. In Income and Living Conditions in Europe; Atkinson, A., Marlier, E., Eds.; Eurostat: Luxembourg, 2010; pp. 217–240. [Google Scholar] [CrossRef]
  20. Zeleke, T.; Beyene, F.; Deressa, T.; Yousuf, J.; Kebede, T. Vulnerability of Smallholder Farmers to Climate Change-Induced Shocks in East Hararghe Zone, Ethiopia. Sustainability 2021, 13, 2162. [Google Scholar] [CrossRef]
  21. Arístegui, I.; Beloki, U.; Diez, A.; Silveste, M. Vulnerabilidad social percibida en contexto de crisis económica. Rev. Española Sociol. 2017, 26, 17–39. [Google Scholar] [CrossRef] [Green Version]
  22. Ranci, C.; Brandsen, T.; Sabatinelli, S. Social Vulnerability in European Cities: The Role of Local Welfare in Times of Crisis; Springer: Basingstoke, UK, 2014. [Google Scholar]
  23. Chowa, H.; Masa, R.; Manzanares, M.; Bilotta, N.; Barrington, C. A systematic literature review of positive youth development impacts on marginalized and vulnerable youth, Youth Power. Learn. Eval. 2021. [Google Scholar] [CrossRef]
  24. Bukowski, M.; Kreissl, K. Empowerment, poverty and vulnerability. In No Poverty, Enciclopedia of the UN Sustainable Developments Goals; Leal Filho, W., Ed.; Springer: Cham, Switzerland, 2021. [Google Scholar] [CrossRef]
  25. Ranci, C.; Migliavacca, M. Social Vulnerability: A Multidimensional Analysis. In Social Vulnerability in Europe. The New Configuration of Social Risks; Ranci, C., Ed.; Palgrave Macmillan: New York, NY, USA, 2010; pp. 219–249. [Google Scholar]
  26. Carney, T. Vulnerability: False Hope for Vulnerable Social Security Clients? Univ. New South Wales Law J. 2018, 41, 783–817. [Google Scholar]
  27. Virokannas, E.; Liuski, S.; Kuronen, M. The contested concept of vulnerability—A literature review. Eur. J. Soc. Work. 2018. [Google Scholar] [CrossRef]
  28. Ståsett, S. The Ethics of Vulnerability, Social Inclusion and Social Capital. Forum Dev. Stud. 2007, 34, 45–62. [Google Scholar] [CrossRef]
  29. Boyadjieva, P.; Ilieva-Trichkova, P. Adult Education as Empowerment. Re-imagining Lifelong Learning through the Capability Approach, Recognition Theory and Common Goods Perspective; Palgrave Macmillan: Cham, Switzerland, 2021. [Google Scholar]
  30. Novkovska, S.; Serafimovic, G. Recognizing the vulnerability of generation Z to economic and social risks. UTMS J. Econ. 2018, 9, 29–37. [Google Scholar]
  31. Benedicto, J. La ciudadanía juvenil: Un enfoque basado en las experiencias vitales de los jóvenes. Rev. Latinoam. Cienc. Soc. Niñez Juv. 2016, 14, 925–938. [Google Scholar]
  32. Castel, R. Los riesgos de exclusion social en un contexto de incertidumbre. Rev. Int. Sociol. 2014, 72, 15–24. [Google Scholar] [CrossRef] [Green Version]
  33. Castel, R. The Roads to Disaffiliation: Insecure Work and Vulnerable Relationships. Int. J. Urban Reg. Res. 2000, 24, 519–535. [Google Scholar] [CrossRef] [Green Version]
  34. Maiztegui-Oñate, C.; Roosalu, T. Report on Successful Educational Programmes. 2019. Available online: https://ec.europa.eu/research/participants/documents/downloadPublic?documentIds=080166e5cc010ff3&appId=PPGMS (accessed on 15 August 2021).
  35. Silver, H. Social Exclusion. In The Blackwell Encyclopedia of Sociology; Ritzer, G., Ed.; Blackwell: Oxford, UK, 2007; pp. 4419–4421. [Google Scholar]
  36. Hoskins, B.; Jesinghaus, J.; Mascherini, M. Measuring Active Citizenship in Europe; European Commission Institute for the Protection and Security of the Citizen; Springers: Luxembourg, 2006; Available online: https://ec.europa.eu/jrc/sites/default/files/jrc-coin-measuring-active-citizenship-2006_en.pdf (accessed on 15 August 2021).
  37. Chevalier, T. Varieties of youth welfare citizenship: Towards a two-dimension typology. J. Eur. Soc. Policy 2016, 26, 3–19. [Google Scholar] [CrossRef]
  38. Boyadjieva, P.; Ilieva-Trichkova, P. Adult education as a common good: Conceptualisation and measurement. Int. J. Lifelong Educ. 2018, 37, 345–358. [Google Scholar] [CrossRef]
  39. Schuller, T. Understanding the social outcomes of learning. In Proceedings of the Second OECD World Forum on Statistics, Knowledge and Policy, Istanbul, Turkey, 27–30 June 2007. [Google Scholar]
  40. Lessenski, M. Don’t panic: Findings of the European Catch-Up Index 2015; OSI-Sofia: Sofia, Bulgaria, 2016. [Google Scholar]
  41. Tudela, P.; Alemany, E.; Calderón, D.; de Miguel, V.; Calvo, E.; Megías, E.; Sanmartín, A. Índice Sintético de Desarrollo Juvenil Comparado 2020; Centro Reina Sofía sobre Adolescencia y Juventud: Madrid, Spain, 2020. [Google Scholar] [CrossRef]
  42. Narayan, D. Conceptual frameworks and Methodological challengues. In Measuring Empowerment; The World Bank: Washington, DC, USA, 2005; pp. 3–38. [Google Scholar]
  43. International Labor Organization. Skills Mismatch in Europe: Statistics Brief; ILO: Geneva, Switzerland, 2014. [Google Scholar]
  44. Bonoli, G. The Political Economy of Active LaborMarket Policy. Politics Soc. 2010, 38, 435–457. [Google Scholar] [CrossRef] [Green Version]
  45. Cefalo, R.; Scandurra, R.; Kazepov, Y. Youth Labor Market Integration in European Regions. Sustainability 2020, 12, 3813. [Google Scholar] [CrossRef]
Figure 1. Analytical model for vulnerability dimensions.
Sustainability 13 09252 g001
Figure 2. Evolution of Overall score (%) on the three analyzed dimensions (2013–2017) by EU-28.
Sustainability 13 09252 g002
Table 1. Composition of the ENLIVEN model and weighting of indicators.
DimensionSubdimensionVariableIndicator (+Code)Code & WeightingSource
EmpowermentSkills (40%)Improved ability to communicate (reading, listening, writing) Proportion of adults (25–64 year-olds) achieving at least a fixed level of proficiency (score 226) in functional numeracy skillsSK1/33%OECD
Use of new technologies Internet use and activities (isoc_bde15cua)SK2/33%EUROSTAT
Developed problem-solving capacities Individuals’ level of digital skills (isoc_sk_dskl_i)SK3/33%EUROSTAT
Trust (10%)Trust in peopleTrust in others Average rating of trust (ilc_pw03)TR1/33%EUROSTAT
Trust in institutionsTrust in legal system (ilc_pw03) TR2/33%EUROSTAT
Trust in political system (ilc_pw03) TR3/33%EUROSTAT
Physical Health (25%)Sharpened mindSelf-perceived health (hlth_silc_02)PH1/20%EUROSTAT
Healthier behaviourSmoking of tobacco products (hlth_ehis_sk1e)PH2/–20%EUROSTAT
Frequency of alcohol consumption (hlth_ehis_al1c) PH3/–20%EUROSTAT
Performing health-enhancing physical activity (hlth_ehis_pe9d)PH4/20%EUROSTAT
Less illnessHealthy life years (hlth_hlye)PH5/20%EUROSTAT
Mental Wellbeing (25%)Increased happinessFrequency of being happy in the last 4 weeks (ilc_pw08)MW1/50%EUROSTAT
Average rating of satisfaction (ilc_pw01) MW2/50%EUROSTAT
Civic and Social EngagementCultural Participation (25%)Active participation in artistic/musical activitiesFrequency of practicing of artistic activities (ilc_scp07) CLP1/50%EUROSTAT
Cultural participation scoreParticipation in any cultural or sport activities in the last 12 months (ilc_scp01)CLP2/50%EUROSTAT
Political Participation (25%)VotingParticipation in political elections at the local, regional, national level During the last 3 years percentage of voting in any political election.PP1/33%EUROBAROMETER
Participation in political partiesPolitical party/group membershipPP2/33%European Values Study
Participation in trade unionsTrade-union membershipPP3/33%European Values Study
CIVIC Participation (25%)Taking part in official organizationsIn the last 12 months, have you participated in any activities of the following organisations? Total “at least one activity”. From 15 to 30 yearsCVP1/33%EUROBAROMETER
Active participation in societyActive citizens (ilc_scp19).CVP2/33%EUROSTAT
VolunteeringIn the last 12 months, have you been involved in any organised voluntary activities? Total “Yes”. From 15 to 30 yearsCVP3/33%EUROBAROMETER
Relationship (25%)Social interaction Frequency of getting together with friends (ilc_scp09). RL1/25%EUROSTAT
Frequency of contacts with friends (ilc_scp11).RL2/25%EUROSTAT
Family relationsFrequency of getting together with family and relatives (ilc_scp09).RL3/25%EUROSTAT
Frequency of contacts with family and relatives (ilc_scp11)RL4/25%EUROSTAT
EmployabilityEducation (25%)Participation in adult programmePersons participating in training related to professional activity (ilc_ats10)ED1/50%EUROSTAT
Participation rate in non-formal education and training (last 4 weeks) (yth_educ_060)ED2/50%EUROSTAT
NEET (25%)NEET ratesYoung people neither in employment nor in education and training by sex, age and educational attainment level (yth_empl_160)NE1/–100%EUROSTAT
Work-Related (50%)Improvement in job prospects (career opportunities and job promotions)Participants in CVT courses (trng_cvt_12s) WR1/15%EUROSTAT
Employed persons whose work experience and job skills would be helpful to find another job by age (source: Eurofound) (qoe_ewcs_6_5) WR2/15%EUROSTAT
Employed persons perceiving that their job-related non-formal education and training helped to improve the way they work by age (source: Eurofound) (qoe_ewcs_6_3) WR3/15%EUROSTAT
Skills related to job performanceMain skills targeted by CVT courses (trng_cvt_29n2)WR4/15%EUROSTAT
Labour force participation rateYouth employment (yth_empl_010)WR5/40%EUROSTAT
Table 3. Civic and social engagement dimension scores. EU-28 (%).
CULT. PART.POLIT. PART.CIVIC PART.RELATIONS.CIVIC & SOCIAL
GEO/TIME2013201720132017201320172013201720132017
EU-2850.146.020.226.627.030.330.830.832.033.4
Belgium47.745.121.219.830.529.837.437.434.233.0
Bulgaria24.321.518.427.811.321.621.521.518.923.1
Czechia49.650.625.421.624.126.130.430.432.432.2
Denmark55.356.035.136.835.135.128.728.738.639.1
Germany57.756.118.426.533.036.626.026.033.836.3
Estonia50.552.514.918.224.225.235.135.131.232.8
Ireland45.451.214.817.837.335.321.521.529.831.5
Greece45.842.820.222.216.126.526.126.127.129.4
Spain44.841.415.524.922.327.631.131.128.431.3
France48.248.720.825.130.833.129.629.632.334.1
Croatia47.443.315.327.019.220.522.022.026.028.2
Italy48.942.718.927.822.233.540.240.232.636.0
Cyprus48.643.314.717.721.921.324.724.727.526.7
Latvia50.953.924.826.825.423.434.034.033.834.5
Lithuania49.252.114.823.620.921.630.430.428.831.9
Luxembourg51.753.917.717.732.733.727.327.332.333.1
Hungary44.941.516.117.615.917.229.629.626.626.5
Malta40.536.311.227.226.622.629.729.727.028.9
The Netherlands56.657.825.029.539.637.334.934.939.039.9
Austria49.949.825.732.732.432.036.536.536.137.7
Poland48.147.616.825.818.923.929.529.528.331.7
Portugal46.444.516.221.524.628.928.928.929.031.0
Romania21.421.325.526.915.121.430.930.923.225.1
Slovenia52.151.827.421.828.831.433.333.335.434.6
Slovakia51.946.525.423.519.517.527.827.831.128.8
Finland59.060.032.038.928.625.334.434.438.539.6
Sweden55.954.027.335.836.837.830.930.937.739.6
UK40.438.913.823.232.729.734.434.430.331.6
Table 4. Employability dimension scores. EU-28 (%).
EducationNEETWork RelatedEmployability
GEO/TIME20132017201320172013201720132017
EU-289.39.518.715.146.147.420.722.3
Belgium4.05.219.014.648.148.920.322.1
Bulgaria2.73.131.224.941.442.613.615.8
Czechia10.09.910.09.444.546.822.323.5
Denmark23.619.97.39.552.355.130.230.1
Germany7.07.115.310.953.951.024.924.5
Estonia8.09.911.511.838.548.218.423.6
Ireland4.04.919.211.939.745.516.021.0
Greece4.86.920.210.537.433.614.815.9
Spain13.212.428.219.845.245.318.820.8
France15.515.917.016.045.845.122.522.5
Croatia2.22.112.08.431.933.313.515.1
Italy4.35.224.322.741.242.415.616.8
Cyprus11.19.411.910.241.339.120.419.3
Latvia5.45.114.78.737.742.216.520.2
Lithuania7.26.610.66.831.740.215.020.1
Luxembourg11.613.26.06.647.451.225.127.3
Hungary2.83.720.717.628.835.69.914.3
Malta7.411.821.815.854.859.023.828.5
The Netherlands12.012.28.67.258.361.330.031.9
Austria12.213.411.712.151.154.325.727.5
Poland2.43.09.98.739.236.617.716.9
Portugal10.811.617.88.946.244.321.422.8
Romania2.43.020.519.442.445.516.618.6
Slovenia9.710.59.87.441.742.320.821.9
Slovakia2.22.313.417.133.436.713.914.6
Finland11.211.611.110.344.748.422.424.5
Sweden30.730.37.88.142.448.126.929.6
U.K.14.913.823.719.054.757.525.227.4
Table 5. Total score and rank on the three analyzed dimensions (2017) by EU-28 (%).
EmpowermentCivic and Social EngagementEmployability
Finland73The Netherlands40The Netherlands32
Denmark70Finland40Denmark30
Sweden69Sweden40Sweden30
The Netherlands68Denmark39Malta28
Luxembourg67Austria38Austria27
Germany66Germany36U.K.27
Austria66Italy36Luxembourg27
Slovakia66Slovenia35Germany25
Lithuania66Latvia35Finland25
Czechia64France34Estonia24
Malta64EU-2833Czechia24
Poland64Luxembourg33Portugal23
Estonia64Belgium33France23
Belgium63Estonia33EU-2822
EU-2863Czechia32Belgium22
Slovenia62Lithuania32Slovenia22
Hungary62Poland32Ireland21
Ireland62U.K.32Spain21
Latvia61Ireland32Latvia20
U.K.61Spain31Lithuania20
France61Portugal31Cyprus19
Portugal60Greece29Poland17
Cyprus60Malta29Italy17
Spain59Slovakia29Greece16
Greece58Cyprus27Bulgaria16
Italy56Hungary27Slovakia15
Bulgaria52Bulgaria23Hungary14
Table 6. Ranking countries on the three analyzed dimensions (2017) by EU-28 (%).
EmpowermentCIVIC and Social EngagementEmployability
Top FiveFinland72.5The Netherlands39.9The Netherlands31.9
Denmark70.5Finland39.6Denmark30.1
Sweden68.8Sweden39.6Sweden29.6
The Netherlands68.3Denmark39.1Austria27.5
Luxembourg67.4Austria37.7U.K.27.4
AverageEU-2863.0EU-2833.4EU-2822.3
Lowest FiveCyprus59.9Malta28.9Italy16.8
Spain59.2Slovakia28.8Greece15.9
Greece58.2Cyprus26.7Bulgaria15.8
Italy56.0Hungary26.5Slovakia14.6
Bulgaria52.1Bulgaria23.1Hungary14.3
Publisher’s Note: MDPI stays neutral with regard to jurisdictional claims in published maps and institutional affiliations.

