Article

A Systematic Technique to Prioritization of Biodiversity Conservation Approaches in Nigeria

by
Valentine E. Nnadi
1,*,
Christian N. Madu
1,2 and
Ikenna C. Ezeasor
1
1
Shell Centre for Environmental Management & Control, University of Nigeria, Enugu Campus, Enugu 400241, Nigeria
2
Department of Management and Management Science, Lubin School of Business, Pace University, 1 Pace Plaza, New York, NY 10038, USA
*
Author to whom correspondence should be addressed.
Sustainability 2021, 13(16), 9161; https://doi.org/10.3390/su13169161
Submission received: 8 July 2021 / Revised: 12 August 2021 / Accepted: 13 August 2021 / Published: 16 August 2021
(This article belongs to the Special Issue Environmental Planning and Modeling)

Abstract

:
There are generally no acceptable views on the conservation of biodiversity because there are no known best approaches to that. This has presented a challenge on what and how to conserve in developing countries like Nigeria. This paper used a multi-criteria decision-making model based on the Analytic Hierarchy Process (AHP) to elicit experts’ opinions on biodiversity conservation approaches and their corresponding conservation targets. The rationality of the experts was checked by measuring their consistency in the decision-making process. A greedy search algorithm based on linear programming application was also used for resource allocation. This technique is holistic and allows the decision maker to consider all pertinent factors. The approach allows policy makers to integrate worldviews; culture; diverse flexibility of concerned communities and other stakeholders in identifying conservation practices to achieve sustainability. In terms of current performance for the biodiversity conservation approaches; the conservation experts rated their performance on Ecosystem-service-based approach high with the priority index of 0.460. Their performances on Area- and Species-based approaches are ranked second and third with priority indexes of 0.288 and 0.252 respectively. Conversely; in the case of expectations; Ecosystem service is the most important with a priority index of 0.438 followed by Area-based with a priority index of 0.353 and Species–based with a priority index of 0.209. The Ecosystem-service based approach has the highest contribution coefficient. Resources are allocated accordingly; in form of capacity building; based on the priorities that were obtained. The research is a rights-based tool for capacity building; and a paradigm shift from the purely scientific approach to decision-making. It is designed to bridge a scientific gap between policy formulation and resource allocation in biodiversity conservation.

1. Introduction

Ecosystem dehydration may lead to the endangerment of some species [1,2,3,4,5]. Several studies have identified both social and ecological criteria to evaluate biodiversity [6,7,8,9,10,11,12]. Emphasis has been made in identifying the important criteria for approaches used in the conservation of biodiversity [13,14]. Many studies have also explained the way a number of approaches can be used to examine the social preferences of stakeholders for various situations involving biodiversity and the natural ecosystems [15,16,17,18,19,20,21]. For instance, in identifying different stakeholder perceptions of diverse ecosystem services using an ecosystem service-based approach, local actors preferred drinking water, fresh air and climate change control, genetic pool of plant communities and educational value [15].
However, no mention was made of prioritizing the different conservation approaches and their targets by considering the multiple criteria that may be involved. Priorities are sometimes established for conservation at the species level [22,23] but not for the evaluation of the conservation approaches. Similarly, priorities are also often set for hotspots, representing transitions, but not for all targets of biodiversity conservation [24,25,26]. Despite the existence of many research studies on biodiversity conservations, only a few emphasize the modeling aspect [27,28]. The majority of the studies are conceptual. The few models as noted by [29] are not complete in terms of application because they do not present a consolidative strategy and seem to overstress the significance of the economic and ecological aspects of biodiversity conservation. These articles seldom emphasize the conservation subsystems—the targets. Furthermore, no effort is made to put together these subsystems to form a general framework for modeling biodiversity conservation approaches. The shortcomings of the noted models led [29] to apply Analytic Hierarchy Process (AHP) as a model for making choice on biodiversity preserved areas. However, the author did not investigate the biodiversity conservation approaches (BCAs) and their conservation targets (CTs).
This paper extends the work of [29] by developing a ranking system for BCAs and the CTs. This is done through the application of AHP to develop priority indices for both BCAs and the corresponding CTs. This paper further used an input–output model. As a result, the concept of ‘‘mutual dependence’’ amongst the different units of the conservation approaches is introduced and used in building a model for limited resource allocation strategies. By mutual dependence, we mean that some approaches may yield more benefits if there are other approaches in existence that may serve as supports for their activities. For instance, output from area-based conservation may be an input for species-based conservation and vice versa, or an output for species-based conservation may be an input for ecosystem-service based conservation. This situation may or may not be a two-way process. Nevertheless, the reality of such mutual dependence between or amongst different approach types may present synergistic benefits.
Every nation faces the issue of limited resources, especially developing countries, in terms of funding. There are many social services demanding financial support. Therefore, there is a need to optimize the nation’s limited resources and further cascade down to all the units to ensure that these resources are properly utilized to address the most important needs. Ecological management is a forefront issue in Nigeria as the country aims to sustain increasing population, unemployment and other social issues. The long-term goal of building a biodiversity conservation capacity to effectively support Nigeria’s economy may be attained through the effective prioritization of BCAs and their CTs using expert opinion. A functional procedure for the allocation of Nigeria’s limited resources is developed. The process recognizes all major factors considered by the experts.
This paper presents a balanced approach for making decisions that permit a holistic consideration of biodiversity conservation opportunities and the final creation of a new dimension of conservation approach capable of improving prospects for conservation in Nigeria. The study is based on measuring the perceptions of biodiversity conservation experts. Madu and Madu [30] described such group decision-making used to gain acceptance of the decisions made as a bargaining window. Even though we focus on applications to Nigeria’s biodiversity conservation management, the approach followed here can be widely applied in other developing countries where data collection is usually rough and may not be available in certain cases. Thus, the emphasis in Nigeria is illustrative but the modeling approach presented here is the major contribution of the paper. The research is a rights-based tool for capacity building, and it is designed to bridge a scientific gap between policy formulation and resource allocation in biodiversity conservation. It supports the 15th goal of the 2030 UN agenda for Sustainable Development, designed to halt biodiversity loss.

2. Methodology

Analytic Hierarchy Process (AHP)

This study used a Multi-Criteria Decision-Making (MCDM) technique. The technique requires the use of experts to consider multiple criteria that may affect biodiversity conservation decisions. Specifically, an Analytic Hierarchy Process (AHP) is applied here to prioritize the approaches and targets of biodiversity conservation. In Figure 1 below, the biodiversity conservation approaches are displayed along with the conservation targets for evaluation using AHP. What this implies to the Area-based approach for instance is that, in its target, it is either that the area is preserved because it is endemic or that it is conserved to protect a non-endemic area.
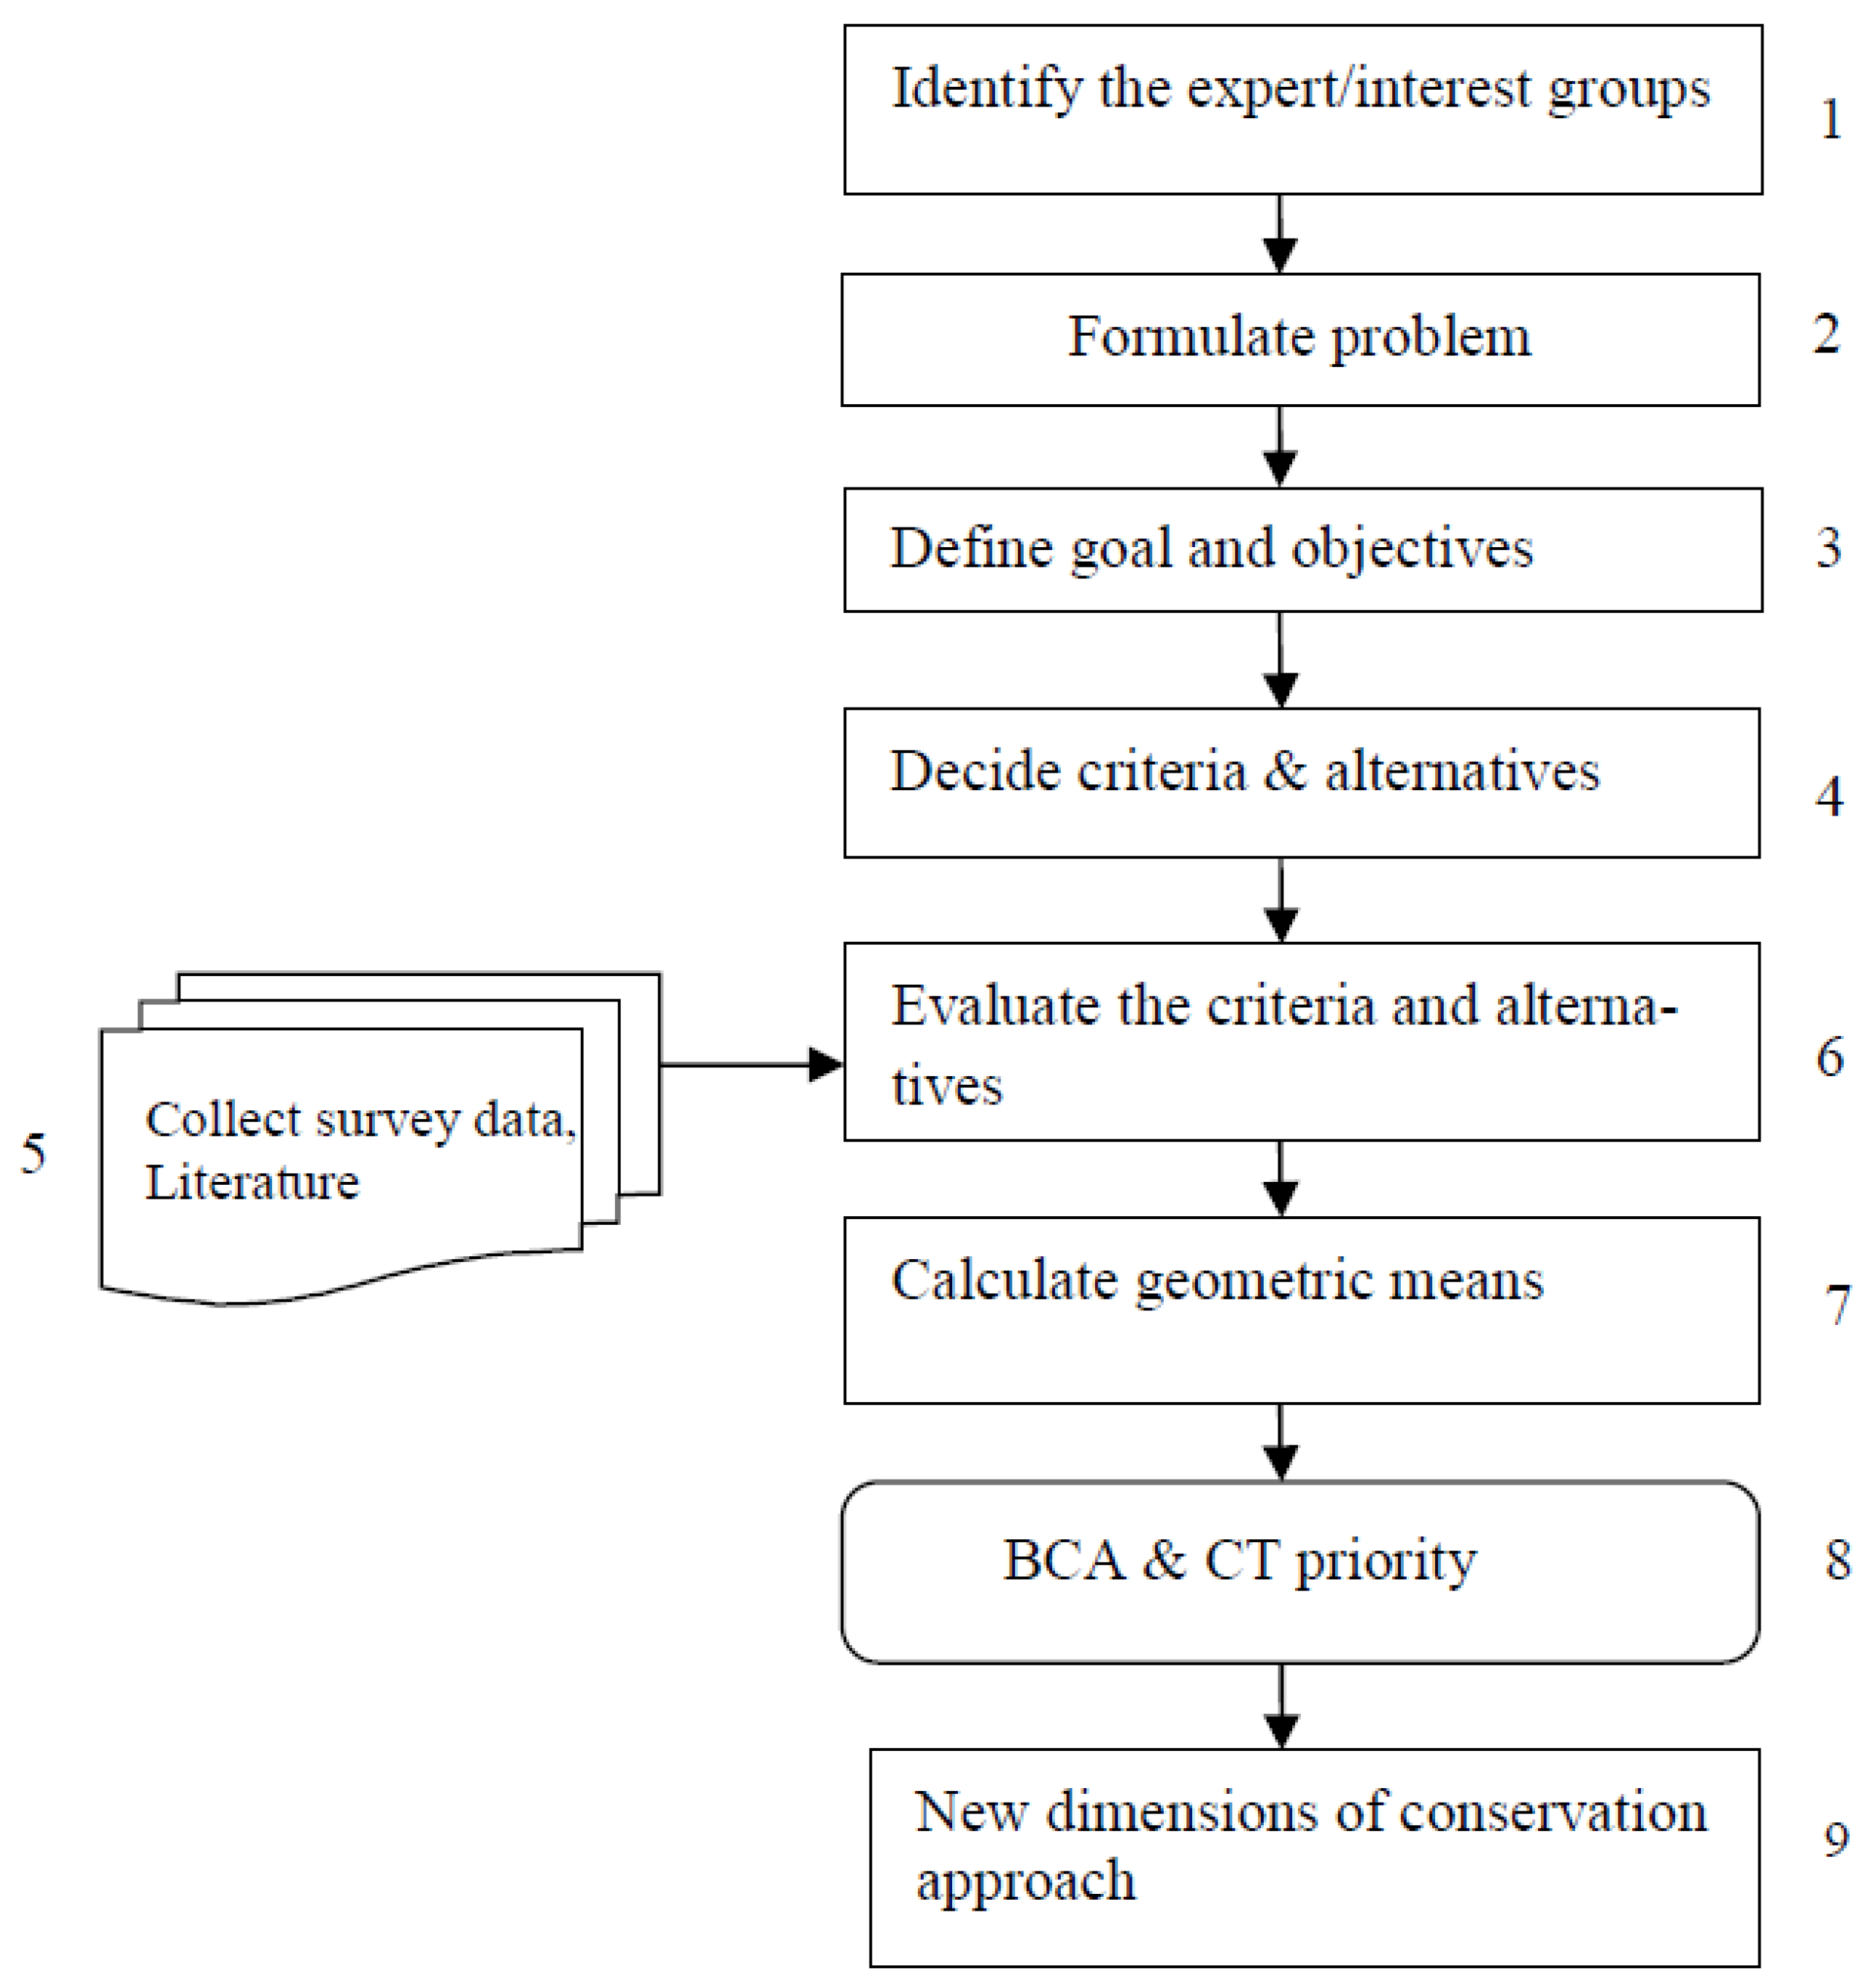
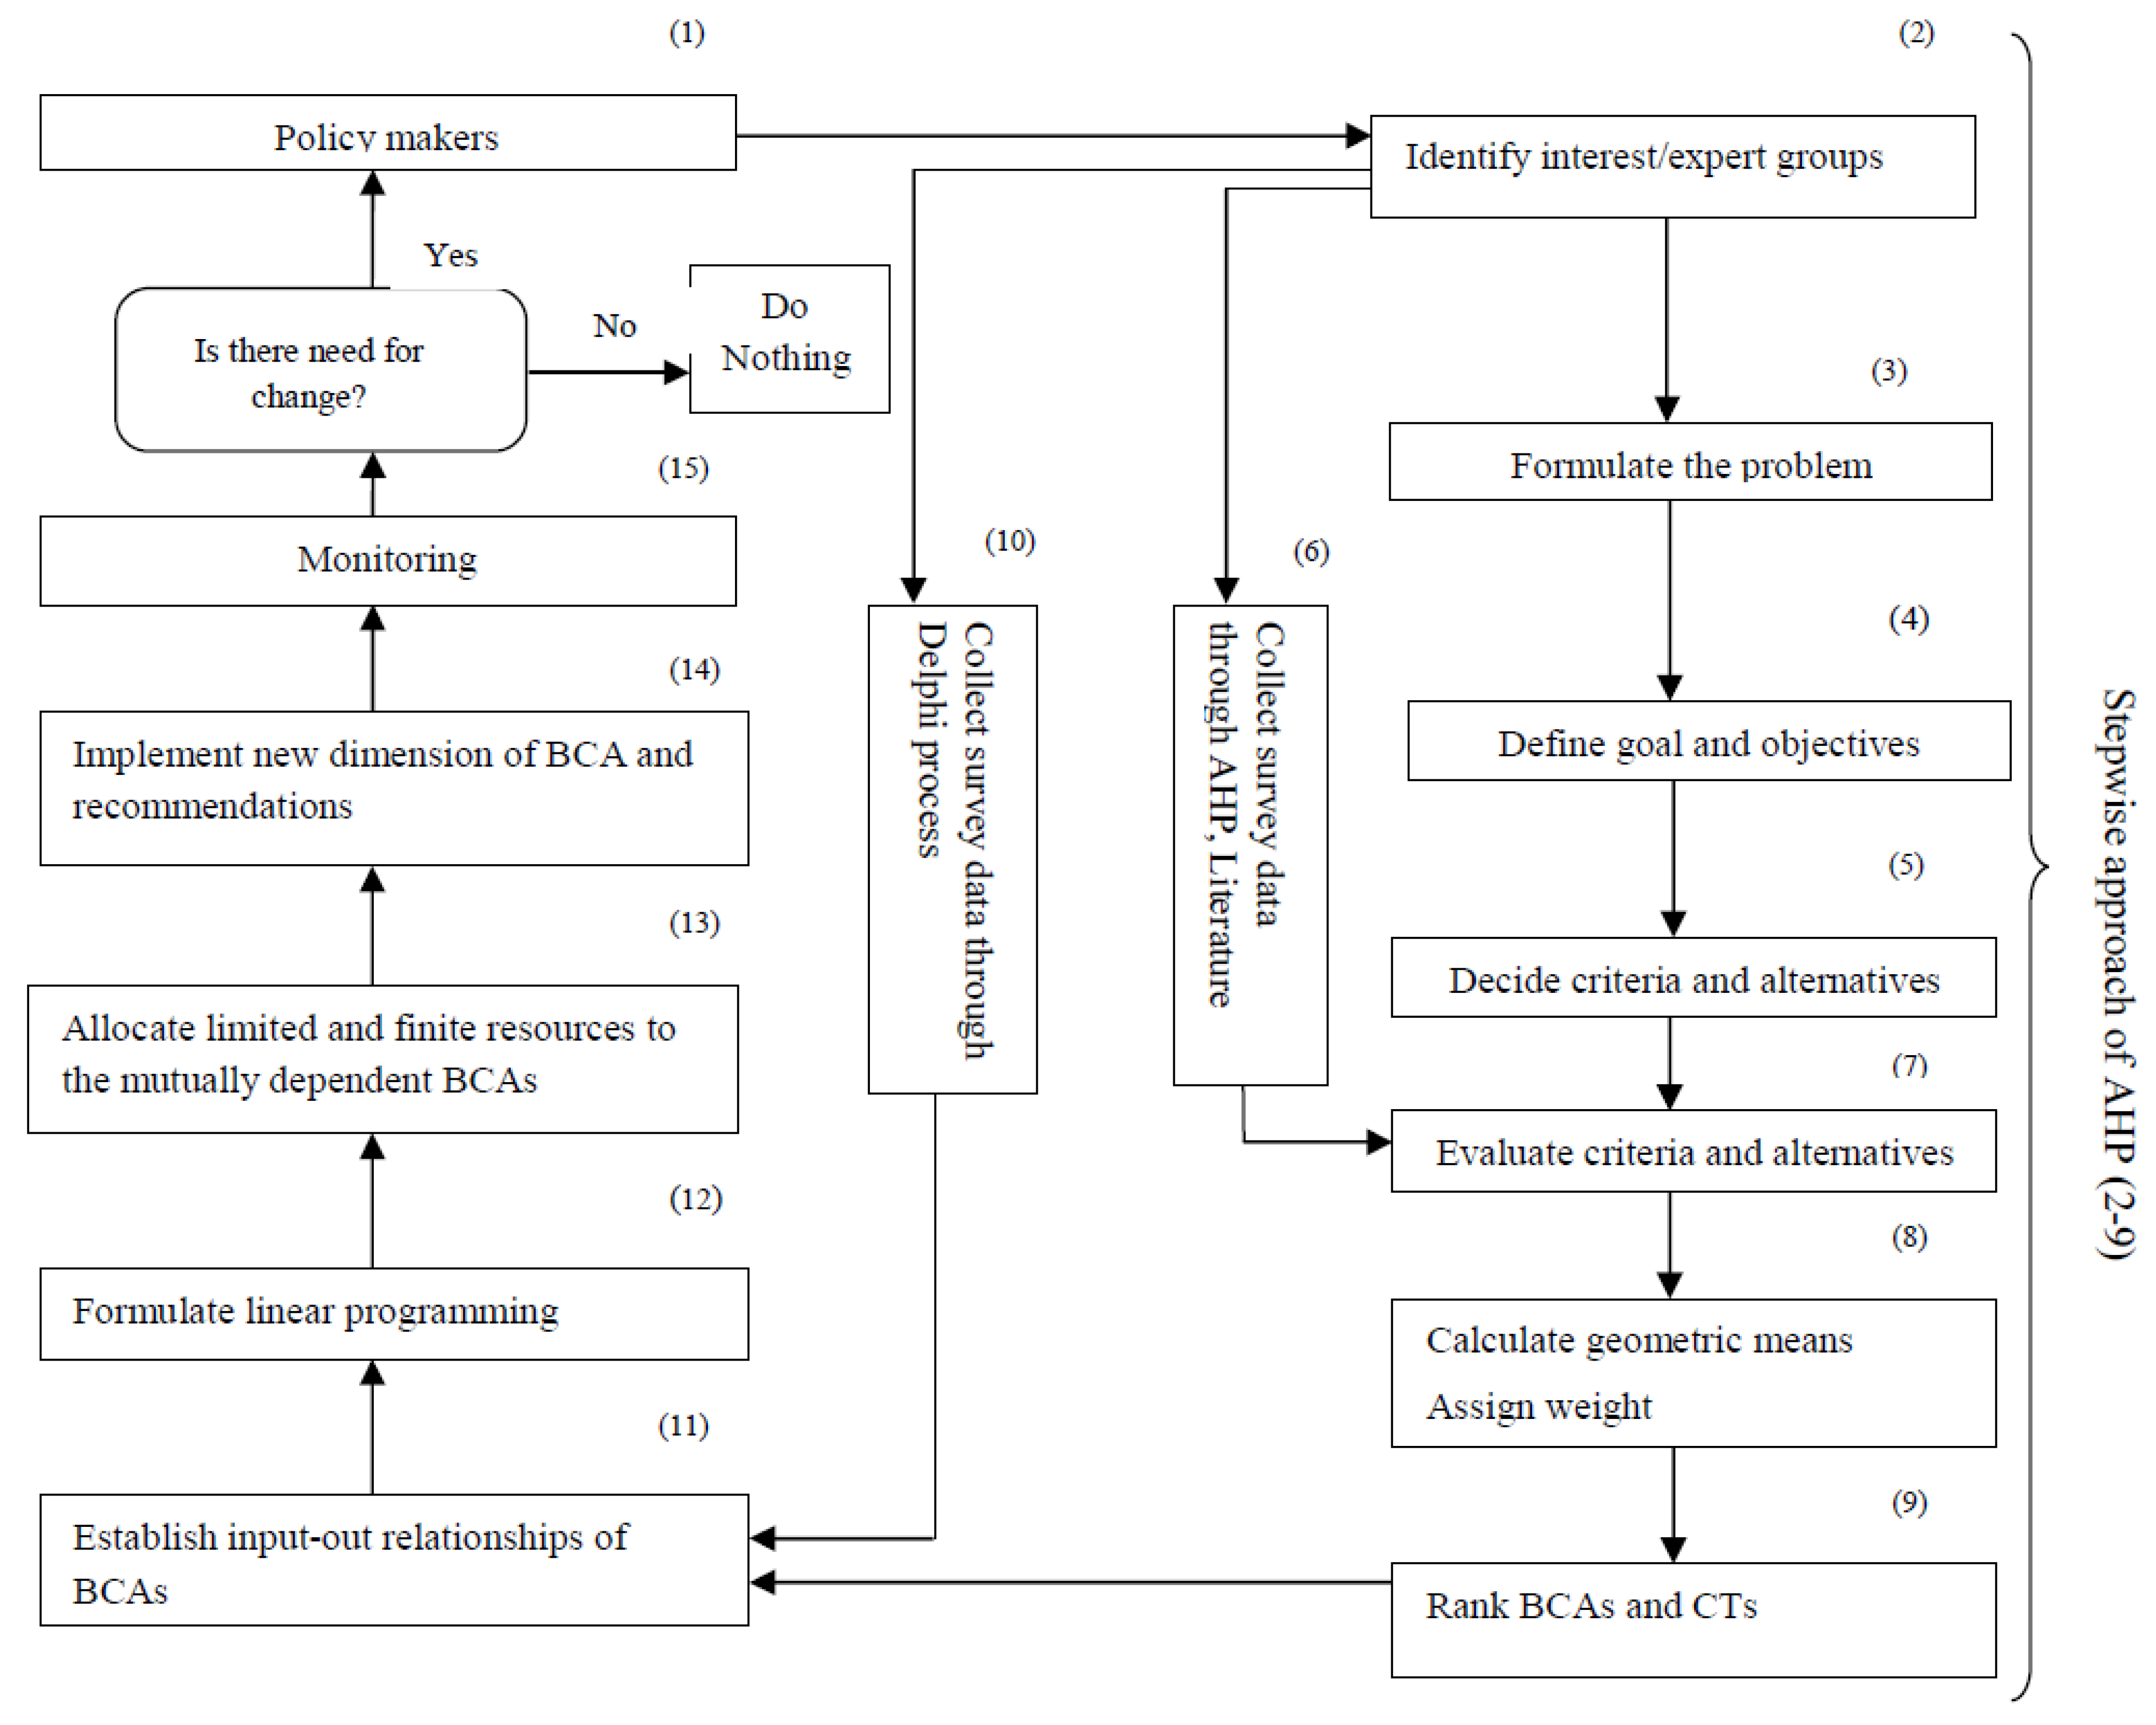
The AHP is a special form of MCDM that is used here and has a wide range of applications in different disciplines [31,32,33,34,35,36]. The multi-criteria decision-making structure based on AHP is presented in Figure 2 below and integrated as steps 2–9 in Figure 3. This structure provides an opportunity for stakeholder/expert judgments for the choice of biodiversity conservation approaches (BCAs) and conservation targets (CTs). Specifically, the steps represented in blocks and numbered in the figures are discussed briefly in the ensuing discussions.
First, the experts are identified (Figure 2). Policy makers in Nigeria participate actively in decisions to conserve biodiversity. Their active participation may include making decisions on the right approaches to conserve biodiversity, the allocation of resources to improve biodiversity conservation, socioeconomic, legal and ecological management and others. As a result of these, the structure of Figure 3 starts with the policy maker (1) as the initiator of conservation policies. It is presumed that the policy maker is aware of the importance of biodiversity conservation as a major part of ecosystem balancing and intends to make it an integral part of ecosystem management plan.
There are several interest groups and individuals who may partake in such decisions or policy making. Consequently, in Figure 3, the policy maker identifies interest and/or expert groups (2) whose ideas, opinions and perceptions may affect the decisions related to the successful conservation of biodiversity. The interest groups/experts here comprise the local people who are working with Biodiversity Conservation Community-Based Organisations (BC-CBOs). By involving this set of people, local or indigenous knowledge is incorporated. Experts are also drawn from non-governmental organizations (NGOs) and government agencies and parastatals whose primary objectives are on biodiversity conservation.
In step 3 of Figure 3 which is the second stage in Figure 2, the conservation problem is formulated as a ‘‘mess’’ [37]. The “mess” here is the case of depleting biodiversity against all efforts to conserve it. Step 4 of Figure 3, which is the third stage of Figure 2, suggests defining the goals, objectives and sub-objectives. Immediately the objectives are defined, the strengths and weaknesses are outlined. Subsequently, a set of criteria are identified to achieve these objectives in line with [31,32]. Consequently, step 5 of Figure 3 (the fourth stage of Figure 2) calls for deciding and/or evaluating the performance criteria and alternatives for each major objective. Marcot et al. [38] define objectives as ‘‘the long-range aspirations of the decision makers and stakeholders,” and can include ecological, economic, recreational, spiritual, cultural and aesthetic dimensions in the case of biodiversity conservation. Primary objectives may oftentimes be structured into hierarchies, as can be observed in the decision alternatives of biodiversity conservation. For instance, there may be several ecological and economic objectives for biodiversity conservation plans, with some potentially conflicting with each other. Organizing these fundamental objectives in a hierarchical order can be helpful in explaining tradeoffs and priorities amongst many objectives.
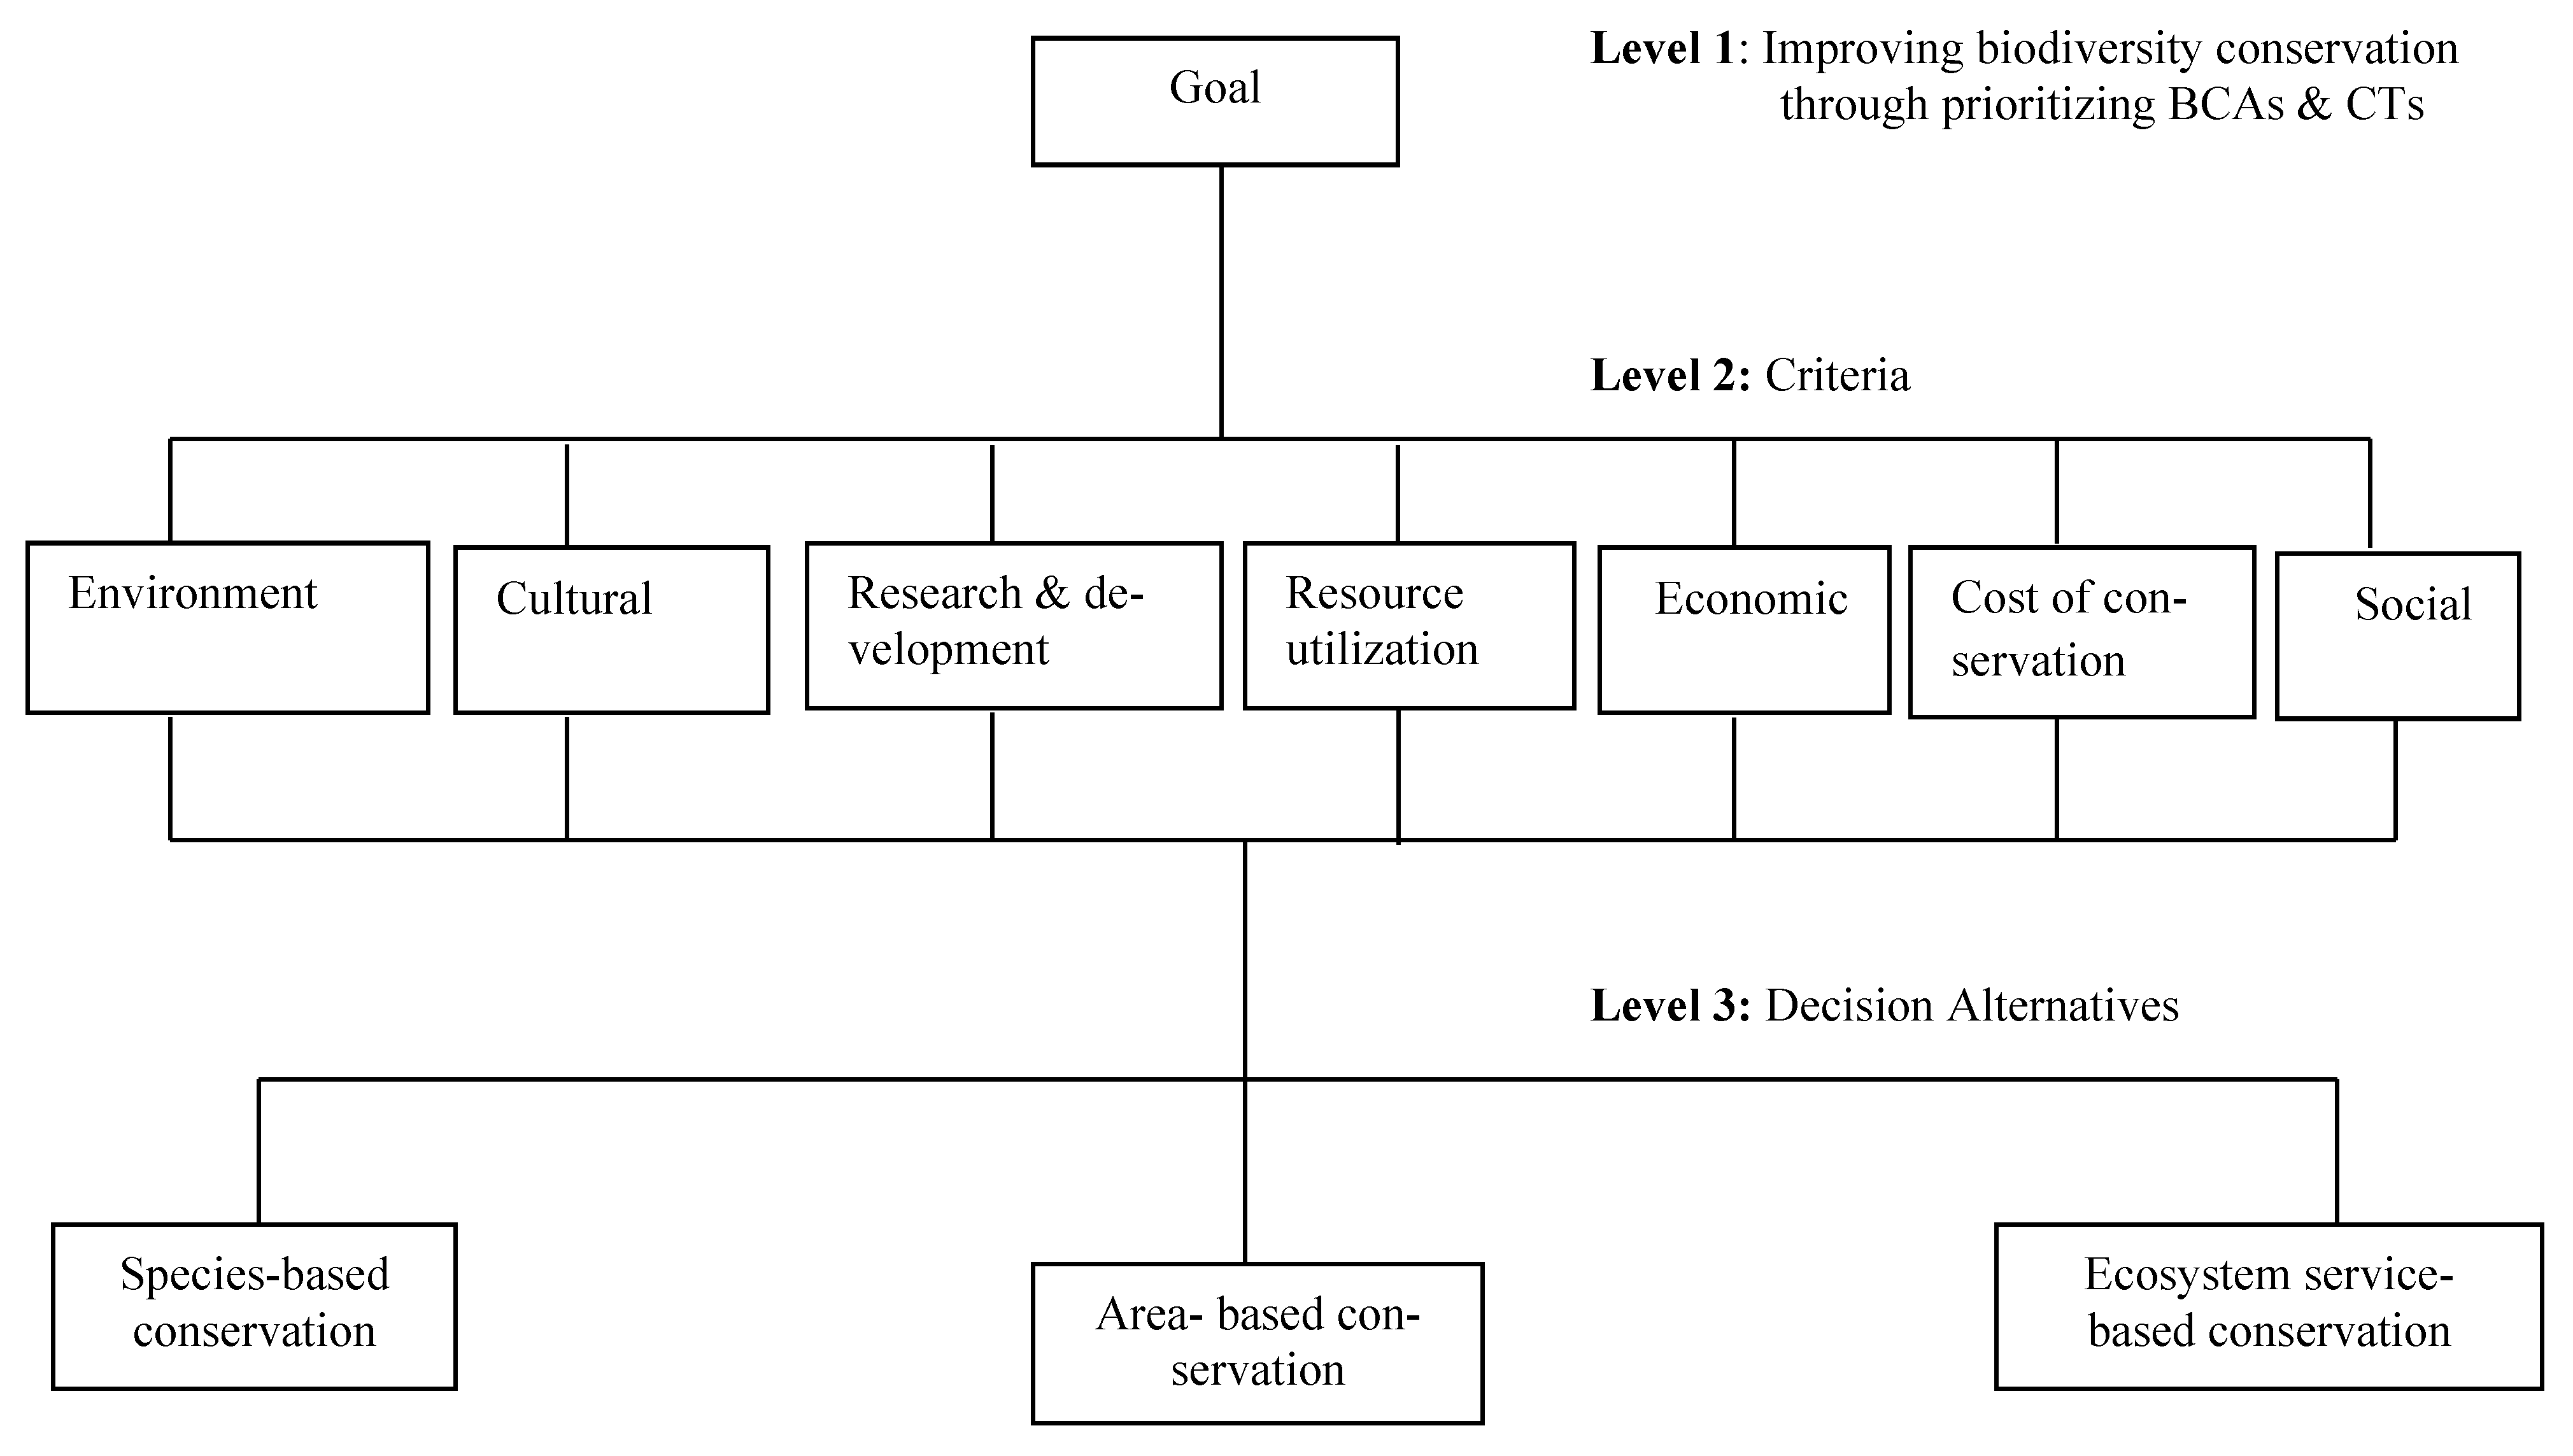
In Figure 4 below, level 1 is the goal of the project, which is to improve biodiversity conservation. There are certain criteria established at level 2, in line with the demands of step 5 of Figure 3 to achieve this set goal. Many variables such as species populations, species traits, community composition, ecosystem structure and ecosystem function have been used in quantifying these criteria [39,40], though they differ across various biodiversity conservation initiatives. However, to the best of our knowledge, no single study integrates all of these criteria. First, we reviewed the ecological and economic criteria applied in various initiatives to determine the main criteria common in most initiatives. Second, we then synthesized the biodiversity conservation variables needed to inform these criteria. These criteria give direction on the direct assessment of approaches important for biodiversity conservation as well as the conservation targets. These criteria are social, economic, environment, cultural, research and development, resource utilization and the cost of conservation. These are constraints to the decision variables or decision alternatives at level 3 in Figure 4. In other words, the decision alternatives ought to be prioritized considering the criteria to achieve the set goal. Deciding the decision alternatives includes first identifying exact decision variables (the items that are controllable) and the ranges that are acceptable for the variables (e.g., species- or ecosystem service-based approach) and, second, generating alternatives based on those variables. Here, a list of the conservation projects (species-based, ecosystem service-based and area-based approaches) as well as the conservation targets form the alternative portfolio for the domain experts to compare and rank. However, the caveat of this study is the absence of landscape scale in the biodiversity conservation approaches considered. This could be an important area to consider for future research.
Step 6 of Figure 3 and stage 5 of Figure 2 suggest survey data collection using AHP. In this context, the survey data are the information from the domain conservation experts. For the application of the AHP in this study, a survey research design that is based on pairwise comparison of the decision makers’ judgment is used. The survey instrument has three sections, namely, A, B and C. Section A is designed to elicit the demographic data of the experts. In sections B and C, a 9-point scale is used to conduct pairwise comparisons on the conservation approaches and conservation targets of each of the approaches, respectively, for the expectation or capacity building. The 9-point scales are defined as follows: 1 = equal importance; 3 = moderate importance; 5 = strong importance; 7 = very strong importance; 9 = extreme importance of one action over the other. The even numbers 2, 4, 6, and 8 are used for compromise while reciprocals are used to show inverse comparisons. This is the standard scale that is normally used with AHP. However, alternative scales could be used. Conservation experts ascertained the comprehensiveness of the top-level conservation approaches and their targets. Through the AHP, a sequence of pairwise comparison is performed between alternative actions or decisions (i.e., biodiversity conservation approaches and the conservation targets). A purposive sampling technique was used in selecting 28 biodiversity conservation organizations that participated in the study. This sampling technique is effective when studying a cultural domain with knowledgeable experts within [41]. The organizations have people who work directly on biodiversity conservation and our interest is to tap into their expert knowledge. Selection of participants for this study is based on the specialized education, knowledge, experience, skill and training acquired that qualified them as domain experts.
The pairwise comparison survey instrument was administered to two biodiversity conservation experts in each of the 28 organizations. Thus, 56 pairwise comparison survey instruments were distributed. The returned instruments were evaluated using the AHP. This process requires several iterations that demand back-and-forth communication with the experts to address areas of inconsistent judgment. Some of the experts did not follow through with some of the iterations and, therefore, did not complete the process. As a result, they were dropped. Thus, 27 experts were dropped along the line, and only 29 experts completed the iteration processes. This number is significant in group decision making since group decision making does not require large samples to avoid potential conflict and achieve timely decisions. Furthermore, in using expert judgment, representation is measured by the quality of the experts and not by the numerical size [42]. Several research works have adopted similar approach [1,31,32,43,44,45,46,47,48,49,50,51,52]. Therefore, this research design is proper for the intent of this study. The AHP technique is used in this context because it allows us to measure the consistency of the experts’ judgment, which is a function of their rationality. The rationality of the experts was checked by measuring their consistency, through the AHP, and a Critical or Consistency Ratio (CR) < 0.10 shows consistency in judgment.
Steps 7 and 8 of Figure 2 and Figure 3, respectively, suggest we calculate the geometric means. The method of the AHP was used to analyze the matrices. For ease of analysis, the independent matrices are unified into one matrix by finding the geometric means of each of the cells in the matrices, which are the objects for further analysis or AHP application (see Appendix A). Aczel and Saaty [53] explain that the use of the geometric mean is essential to conserve the reciprocal property of the objects. Stage 8 of Figure 2 corresponds to block (9) of Figure 3 and suggests ranking of the BCAs and CTs. Here, the priority indices are computed for each of the cells in the matrices and ranked using the values of the priority indices. The rank order portrays the order of importance attached on the criteria and alternatives [54]. The ranking of the criteria and alternatives of the BCA is performed to ensure that importance or preference is placed on the most important BCAs and CTs.
Given that the data required to set up the input–output relationship of the BCAs may not be solely quantitative, the Delphi technique is used to gather the data (see Block (10) of Figure 3). The Delphi technique is premised on the principle that decisions made in a structured environment is more accurate than unstructured ones [55]. In this paper, a modified Delphi technique is applied such that a questionnaire is designed with a 5-point linear Likert scale of: 1 = not at all important; 2 = slightly important; 3 = moderately important; 4 = very important; 5 = absolutely important on perceived importance of the interdependence between a given pair of the BCAs. Expert participants are also drawn from the government organizations, Biodiversity Conservation Community-Based Organizations (BC-CBOs) and other NGOs. The questionnaire was shared to the expert participants for rating using the Likert scale, after having the results of the AHP questionnaire. Each of the participants performed the task anonymously to keep away from group behavioral influences. They were asked to review their weight assignments, taking into consideration the reasons stated by other participants so they can justify their original weight assignments. Three iterations were made in the process, and we observed some convergence of opinions. Geometric means were calculated to reflect the consensus of the group in accordance with the guideline provided by [56,57]. The data from the Delphi process suggest that there is tendency that each of the BCAs may be feeding on the other. There is therefore need to explore the mutual dependence between the BCAs.
Block (11) of Figure 3 suggests establishing input–output relationships. The relationships are very important since resource allocation cannot be based mainly on priorities when there may be interdependencies existing. This means that there is need for optimization in the face of limited resources, and therefore, there is need to introduce Leontief input–output model. The input–output table (matrix) developed from the data elicited through Delphi is then used with the priority indices on the expectations of the three BCAs for application of the Leontief input–output model (see Appendix B). Again, block (12) of Figure 3 suggests the formulation of a linear programming (LP) problem (see Appendix C) since the efficient utilization of resources is a requirement to achieving the targets of the BCAs in environmental planning and management.

3. Results and Discussion

Using the AHP, the priority indices of the BCAs are computed (see Appendix A). The pairwise comparison matrices of the three BCAs and their corresponding CTs are based on the relative importance ratings of both their expectations and actual performances. The aim is to generate data for prioritizing the BCAs and the CTs to see how we are faring and perhaps identify areas for capacity building and to efficiently allocate limited resources.

3.1. Prioritizing the Conservation Approaches

In the case of expectations for the three biodiversity conservation approaches, as shown in Table 1, the ecosystem-service-based approach is perceived to be the most important with a priority index of 0.438, followed by the area-based approach with a priority index of 0.353, and the species-based approach ranked third with a priority index of 0.209.
However, in terms of current performance as also shown in Table 1, it is clear that the respondents rated their performance on ecosystem-service-based approaches high, as is evident in the priority index of 0.460. Their performances on area-based and species-based approaches are ranked second and third, respectively, with priority indices of 0.288 and 0.252, respectively. Furthermore, the Consistency Ratio (CR) of 0.094 shows that the experts are consistent in reaching this conclusion.
The technique we used permits us to rank, in order of priorities, the three BCAs and the CTs related to each of the approaches. The generated priority indices of the three BCAs (BCA1, BCA2 and BCA3) suggest that there is varying perceived importance of each approach in contributing to biodiversity conservation. The matrix implies that BCA3 and BCA2, with priority indices of 0.438 and 0.353, respectively, should have the highest priorities. On the other hand, BCA1 seems to have the least preference based on all the criteria considered. Though we underscore the importance of all the approaches, their rank order of importance is relative, and to achieve the goal of biodiversity conservation, emphasis should be on the approaches with the most perceived importance. Conversely, in terms of actual performance, the ecosystem-service-based approach (BCA3) is perceived to be the most important. The perceived importance is in line with the preference given to the approach in the MEA report [58]. The participants’ reason for placing higher preference on BCA3 may be that the approach cuts across all sections of sustainability (economic, social and environment) and so it is holistic. This agrees with the reports of [59,60,61,62,63]. We also seem to do relatively well in each of the other two conservation approaches, that is, the area-based and species-based approaches. This may suggest a wide coverage on the different approaches. However, the lower rank order of BCA1 and BCA2 may be linked to emphasis being shifted from these approaches after the UN convention on biological diversity (CBD) that showed preference to the ecosystem-services approach (CBA3). Our results are consistent with the reports of the [64,65]. It is also noteworthy that since the expectations of the area-based approach are high in importance but low in the case of performance, it suggests that improvement through capacity building and provision of resources to support the approaches is required. The result shows that the rank order for the conservation approaches in terms of actual performance coincides with the rank order for expectations. In the area-based approach, the perceived importance is higher in expectation than in current performance. However, the perceived importance of expectations is slightly lower in the species-based and ecosystem-service-based approaches in comparison with their current performance. This may partly explain the institutional development or local/city governance issues. The results of the pairwise comparison matrices show that a gap exists between the perceived expectation and the actual or current performance.

3.2. Prioritizing Conservation Targets under the Species-Based Approach

In Table 2, the rank order for both expectation and performance is preserved for the targets under the species-based approach. However, as seen in Figure 5, the perceived importance to build capacity (expectations) on the targets is slightly lower in CT2 (Ecological important Species) whereas CT4 (Species of non-use to human) is slightly higher when compared to their priority indices in the current performance. Again, in capacity building, CT3 (Species of use to human) completely dominates CT1 (Threatened Species), CT2 (Ecological important Species) and CT4 (Species of non-use to human). CT4 is of the least perceived importance here, lower than CT2 and CT1, which are ranked second and third, respectively, though their margin is very slim.
Though the rank order is maintained in the case of current performance as it is in expectation, there is variation in the priority indices of the CTs, except for CT1 (Threatened species), which is exactly the same in both expectations and actual performance, as shown in Table 2. In terms of current performance, the priority index of CT3 (0.393) is higher than that of CT1 (0.190), CT2 (0.209) and CT4 (0.175). The priority index of CT2 is marginally higher than CT1 but clearly above CT4. The experts are consistent in their judgment, as is evident in the CR value of 0.074.
As expected, CT3 (Species of use to human) is perceived to be the most important, and it is significantly higher in preference than the other targets, both in expectations and in actual performance. CT4 (species of non-use to man) as expected is the least in both expectations and actual performance. However, the participants perceive that more capacity needs to be built on CT4 probably because of the need for future use. CT2 (Ecological important Species) is ranked second, after CT3, in both expectations and actual performance. This may be because of the fact that any species of ecological importance promote environmental sustainability and, as such, partly contributes to the eco-efficiency and effectiveness. The reason may not be far from why CT2 is referred to as the “hubs of network”. CT1 (Threatened species) is ranked third probably because Nigeria’s biodiversity richness may be protective of many of these species. Furthermore, efficient and effective hubs of networks (CT2) may also protect threatened species.

3.3. Prioritizing Conservation Targets under the Area-Based Approach

In order of importance in both expectations and actual performance, the area-based conservation approach is ranked second over the species-based approach. There are two set targets to this approach: CT5 (Endemic area—hotspot) and CT6 (Non-endemic areas) [29]. In terms of capacity building, we notice that the CT5 is of higher perceived importance than CT6 for the targets to be achieved (Table 3). This supports the work of [66]. However, in terms of current performance, there is no dominance between the targets (i.e., CT5 and CT6). They are of equal ranking with priority indices of 0.500 each. Meanwhile, as expected, the rank order of CT5 is higher in expectations than in actual performance, but the perceived importance of CT6 is higher, with a priority index of 0.500 over that of expectations with 0.394. There is consistency in the judgment of the experts since the CR value is 0.031.
As also expected, the CT5 (Endemic areas), referred to as “hotspots”, are perceived higher than the CT6 (non-endemic areas) in terms of expectation, probably because endemic areas are losing biodiversity to the built environment. This may be because of our poor institutional development or city/local governance where personal interests override sustainable development goals, as reported by [67]. The agreement on the perceived importance in terms of actual performance may perhaps be due in part to their struggles to develop non-endemic areas, which create balance for the lost endemic areas. However, the experts may choose to have equal preference in CT5 and CT6 probably because conservation of any one of them is not guaranteed by the current public policies. Situations arise where the public sector does not consider endemic or protected areas over non-endemic areas. Infrastructural developments are often approved to the detriment of the endemic areas.

3.4. Prioritizing Conservation Targets under the Ecosystem-Service-Based Approach

The ecosystem-service-based approach is the first in terms of expected priority ranking and even in terms of actual performance. In other words, it is perceived to be of most importance of all in both expectations and current performance. The approach sets three targets: protection of water bodies (CT7), protection of land (CT8) and protection/preservation of living resources (CT9) [15,21], as shown in Table 4. In terms of actual performance, CT7 (water) is ranked to have low performance, with a priority index of 0.121. Therefore, there may be need for capacity building here. CT9 (Living resources) is ranked first, as is evident from the high priority index of 0.268 above CT8 (land) and CT7 (water) with priority indices of 0.247 and 0.121, respectively. The result of our evaluation shows that the priority indices generated for each of these CTs are relatively close to each other, thus suggesting the perceived importance of each in effective use of this approach.
In the case of expectations in Table 4 above, CT9 is ranked first with a priority index of 0.273 above CT8 (0.251) and CT7 (0.204). CT7 is ranked third with a priority index of 0.204. The CR value of 0.083 shows that the experts are consistent in reaching this conclusion.
More so, the CT7 (Water), CT8 (Land) and CT9 (Living resources) share the same rank order (first, second and third, respectively) in terms of both expectations and actual performance and show that much is actually being done. This is evidenced in the dredging of some of the waterways and sensitization on the dangers of dumping wastes into the available rivers, the clean-up of oil spill sites, erosion control and other sustainability activities. However, a gap exists which shows that much is also expected or that there is need for capacity building in that order. The rank order, in terms of performance on CT9 (preserving the living resources), may be due to the unsustainable pattern of consumption in the country. This may perhaps explain the need to do more in using area- and species-based conservation approaches as stated earlier. Again, the low ranking of CT7 (preserving or protecting the water bodies) in terms of actual performance may be due to the negative effects of some anthropogenic activities in Nigeria. For instance, the common practice or attitude of dumping wastes or other hazardous substances into the water bodies often contribute to the massive flooding that is experienced in the country. Even though we do well in CT8 (land protection) as shown in Table 4, expectations are high and require that capacity needs to be built in protecting land to enjoy the land-related benefits of BC3. Although some of these processes such as land restoration are natural phenomena, without taking care of the land, the ecosystem service benefits may not be realized. Expectation through capacity building on the ecosystem-service-based approach is required, as shown in the ratings. It is observed that although the ratings differ amongst the three CTs in terms of actual performance, their priority indices are relatively close and may suggest same level of perceived performance.
Generally, it is expected that high rank order conservation targets should consume more resources. However, considering the holistic process of BCA3 (ecosystem-service-based approach) from a management point of view, it may be better to satisfice rather than optimize. In other words, rather than distribute the resources disproportionately to the targets with significantly higher rank order, it may be more preferable to allocate such resources more equitably to encourage the achievement of all set targets and/or benefits in the approach.
In fact, we must emphasize that the rank order of the majority of the expectations of the BCAs and related CTs coincides with their respective actual performances. In other words, there seems to be some conformity in the ranking of some BCAs and CTs in both cases. However, there is notable difference in their priority indices. Consequently, we can stress that virtually all the BCAs and related CTs are important. Their order of importance is relative. Attention should therefore be given to the BCAs with the highest perceived importance but also given equitably to CTs. The rating of the current performance facilitates the identification of the gaps in deployment and underscores what we may not be doing at present. The expected importance rating provides vital information because it demonstrates in a rank order where interest should be channeled to, to achieve robust biodiversity conservation.

3.5. The Input–Output Relationships

Block (11) of Figure 3 recommends establishing input–output relationships of the BCAs. Table 5 is the priority indices of expectations in the three top-level biodiversity conservation approaches. Table 6 is an outcome of the established input–output relationship of the three conservation approaches obtained through the Delphi technique. The coefficients in the (i,j) cells are weighted by the αi (Table 5) and αj (Table 6), respectively, and a summation is made over each row to obtain the dependence vector matrix β [30,68] given as Table 7. This matrix presents the adjusted weights for all BCAs. The matrix considers both the originally derived expectation priorities in case of the criteria for improving biodiversity conservation with the interdependencies among the conservation approaches. The αi and αj are eigenvectors derived for the BCAs.
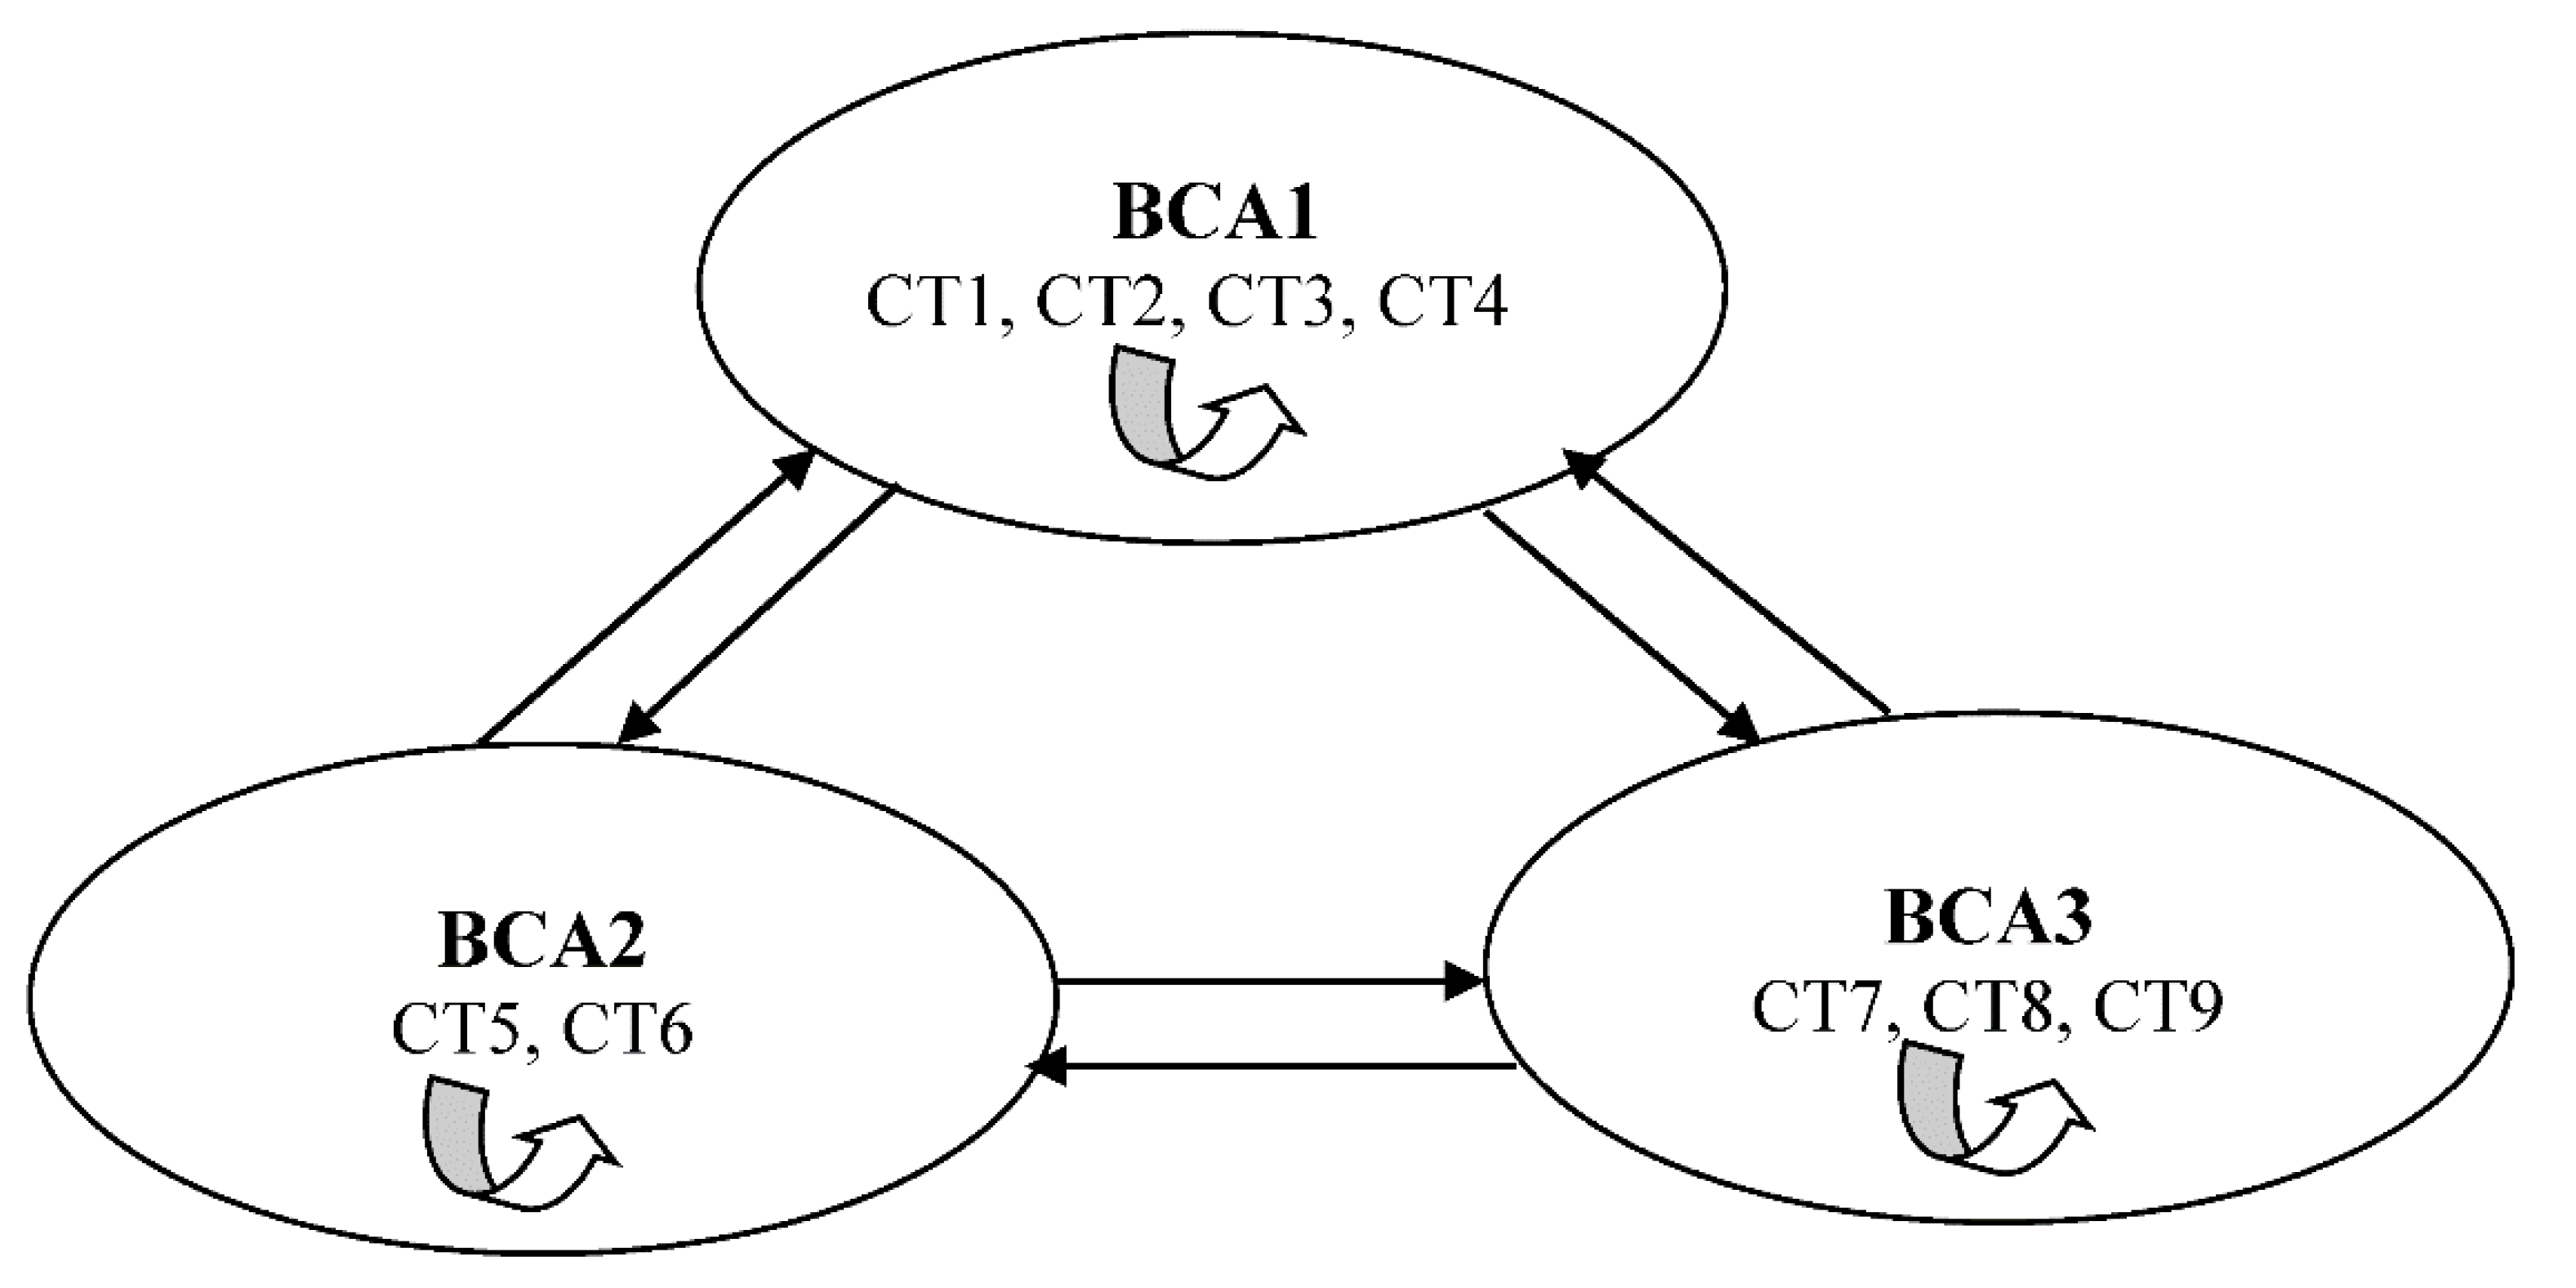
The values of the geometric means of the participants’ responses, from the Delphi process, fall between 3.60 and 4.54. This implies that the perceived importance of the interdependence between a given pair of the BCAs is either moderately important or very important from the range of Likert scale adopted. This means that there is flow amongst the three conservation approaches (BCA1, BCA2 and BCA3). They exhibit interdependence to an extent. Steps to use one may ease the other showing that they are mutually dependent on one another. This synergistic influence may aid in allocating resources to achieve set targets. Notice also that a BCA may be partly dependent on itself; that is, a conservation approach may partially depend on itself, hence some of its output is retained for internal use to improve the approach itself. The observed interdependence between the three BCAs necessitates the use of linear programming for resource allocation.
The network of interdependence for the three BCAs is shown in Figure 6. The outside straight arrows that connect the spheres in the diagram show the interflow amongst the BCAs. This means that each of the BCAs (BCA1, BCA2 and BCA3) feeds on each other and are therefore mutually dependent. An attempt to use one may enhance the other. Again, the curved right arrows inside the spheres show the internal use of the outputs by each of the BCAs or that some of the outputs are retained internally to keep the system working.

3.6. Allocate Limited and Finite Resources to the Mutually Dependent BCAs

Block (13) of Figure 3 in the methodological framework proposes the allocation of scarce funds to the mutually dependent BCAs. This resource allocation system uses the input–output matrix and the priority indices generated for the different approaches. Table 8 shows the resource needs for these approaches.
For purposes of clarity, we found that in 2019 a specific budget of NGN 100 million is committed to accomplishing the goal of biodiversity conservation in Nigeria. Assume that each of the units that cover the three approaches have submitted their resource requirements as shown in Table 8. There must be allocation of appropriate resources in order to consider all identified criteria and their matching priorities in maximizing the country’s biodiversity conservation.
Using Equations (A4)–(A6) (see Appendix C), the step followed in [30,31,32,68], we can develop the linear programming model for the following problem:
Maximum z = 0.778w1 + 1.397w2 + 1.708w3
Subject to
  • 0 ≤ w1 ≤ 0.39
  • 0 ≤ w2 ≤ 0.33
  • 0 ≤ w3 ≤ 0.43
and
w1 + w2 + w3 = 1
where the β vector matrix presents the coefficients of the objective function while the upper bounds of the first three constraints are the ratios of the funds needed by each BCAs to the NGN 100,000,000 fund allocation. The decision variables represent the ratio of funds allotted to the three BCAs, as illustrated in Figure 7. The results found here are rather intuitive even though the challenge can be handled by applying specialized LP software package such as LINDO [69], OpenSolver or R.
The technique used here is a greedy search algorithm whereby the most important approach gets its maximum requirements in that order of priority and if in the end anything is left, it will be allocated to the least priority approach. In other words, the optimal allocation decision can be made by a simple ranking of the BCAs on the grounds of their β-matrix values (contribution coefficients) and, after that, using the constraints to fund approaches to their needed resource until the fund is depleted. For instance, from the coefficients of the objective function z, we find that BCA3 has the highest contribution coefficient of 1.708. Thus, w3 = 0.43, meaning that BCA3 will receive its complete resource need. Given that we have a balance of (1 − 0.43 = 0.57), we have enough to meet the complete resource needs of BCA2. Again, 1.397 for BCA2 is the next highest contribution coefficient, implying that w2 = 0.33.
Note that the last constraint in the model is w1 + w2 + w3 = 1. Therefore, w2 + w3 = 0.76. The next conservation approach is BCA1 with the least contribution coefficient of 0.778. This presents w1 to be assigned w1 = 1 − 0.76 = 0.24. It is observed that all approaches with the exception of BCA1 received their full allocation of funds. The balance of 0.24 is less than the 0.39, which is the proportion of need for BCA1. Therefore, we do not have sufficient resources to contain that need. Generally, this analysis is called “greedy heuristic” because the allocation of resources to the approaches follows a non-increasing order of the contribution coefficients until all the resources are exhausted. For this problem, the resource allocation based on the greedy heuristic algorithm is shown in Table 9.

3.7. Implement New Dimension of BCA and Recommendations

Block (14) of Figure 3 suggests the implementation of new dimensions of BCA. Successful implementation of a decision in biodiversity conservation involves taking into account the risks and benefits, time and cost related to the implementation. In this case, the time and cost of implementing this new dimension of biodiversity conservation approach ought to be considered alongside the risks involved, if any, and the benefits of the implementation. The step also considers the feasibility of the developed framework and the level of impact of the implementation to avoid failure. It is expected that the decisions will have the support of considerable interest groups that are represented by the expert respondents since the decisions are founded on the converging opinions of the stakeholders. The results, in addition, provide a negotiating tool to the policy maker, who may possibly have to give reasons to different groups why a particular conservation approach was emphasized on importance and why limited resources should be channeled appropriately.

3.8. Monitor the Implementation Process

Block (15) of Figure 3 emphasizes the importance of continual monitoring of the prioritized BCAs to achieve corresponding targets. The continual monitoring process is a kind of control designed to make sure that Nigeria’s commitment to conservation of biodiversity is being fulfilled. Monitoring design is most useful when it emanates from the decision background. The standards of monitoring and the process for monitoring should be identified based on the information requirements of the decision maker. The framework of Figure 3 suggests a feedback loop to continuously monitor the planning process. For example, if, in the block (15), there is a need to adjust, the policy maker may decide to identify new interest groups to evaluate the problem. These interest groups may follow the step-by-step approach presented in Figure 3. Conversely, if there is no need for change, then nothing needs to be done other than to continue with periodic review.

4. Policy Implications/Suggestions for Policy Recommendations

Several policy implications emerge from this research work and are identified as follows:
(1) When decision/policy makers use the concept and tools of this research, they may be able to make quality decisions in conservation planning and management since all quality decisions are rational but not all rational decisions lead to a quality outcome. The systematic technique can provide the fundamental principles and deal with the complexities of natural resource planning and management in several places.
(2) This study is a paradigm shift from the purely scientific approach to decision making. This approach is instrumental in ensuring that the different worldviews and perceptions including local knowledge are considered in policy formulation.
(3) Often, we adopt international standards and guidelines without evaluating our peculiar situations. Lack of local content may lead to the unsuccessful implementation of such programs. The inclusion of local content is crucial in biodiversity conservation decision making. The use of the stakeholder approach presents an opportunity for all important interest groups to partake in policymaking.
(3a) Stakeholders may have varying views and premises. They are able to share these views and also understand the worldviews of others. It is through these kinds of teams that conflicts could be resolved and made productive.
(3b) Adoption of the stakeholders’ recommendations may gather support for implementation. This may also be helpful in terms of resource allocation as members of the team would likely defend the decisions which they participated in making.
(4) Since the United Nations has identified biological diversity loss as a worldwide issue to tackle, it is very important to prioritize the approach to meet set goals at both the national and global level. In other words, needful approaches that best suits several circumstances in different geographical regions under different environmental challenges should be adopted in cognizance of global needs.
(5) The BCAs involve multiple objectives that need to be established as set targets. Once a country ranks its actual performance low in any of the BCAs it perceives to be critical to preserve biodiversity loss, it is suggested that there is need for new strategies or to realign existing ones, reallocate resources and possibly build capacities that may be required to achieve the set targets.
(6) Many developing countries such as Nigeria are at the risk of losing their biological diversity. Some of these countries may not have the capacity to conserve biodiversity at any level, such as species, areas or ecosystem, perhaps because of their consumption patterns. Many of them also may not have the economic capacity to conserve and may depend on foreign donors for funding. Therefore, we need to make a choice based on scale of preference or perceived importance. It is imperative to methodically allocate the limited resources so that key targets can be met.
(7) This study presents a rational decision-making process to prioritizing BCAs. It surely may not deal with all important problems or assure an optimum solution however, it may present a consolidative, systems perspective of this pertinent problem.

5. Conclusions

The method followed here presents a logical technique to ecosystem planning and management by putting together all factors that are considered significant and influential in the prioritization of biodiversity conservation approaches. Though the interest groups suggest the implementation of their decision, it is not assured that the policy maker will do so. It does not seem unusual, for instance, for policy makers to go by their instincts; however, at the very least, the process used here guarantees that most of the issues concerning the question of biodiversity conservation will be effectively considered. Models as used here serve as decision supports only.
This research work deals with four major challenges to advancing the BCA for coming years: stakeholder inclusiveness, capacity building, resource allocation and local content adaptation. We set out to deal with these to form a baseline, in both future research and practice, in finding a solution to effectively conserve biodiversity and halt its loss. Nigeria is used as a case study so that we can understand the challenges. Considerable changes to the robust ecosystem and being proactive against biodiversity loss can be realized through the application of the processes and techniques present in this work. We found the process of group elicitation to address conservation planning highly effective. The members of the group could retrospectively provide the logic and reasoning responsible for developing the criteria ranks because a formal decision-making model was applied. This approach allows policy makers to integrate worldviews, culture, diverse flexibility of concerned communities and other stakeholders, perceptions, values, attitudes and behaviors in policy making.

Author Contributions

V.E.N.: conceptualization, methodology, data curation, writing—original draft preparation. C.N.M.: supervision, validation, writing—review and editing. I.C.E.: project administration, resources, visualization. All authors have read and agreed to the published version of the manuscript.

Funding

This research received no external funding.

Institutional Review Board Statement

Not applicable.

Informed Consent Statement

Not applicable.

Conflicts of Interest

The authors declare that they have no known competing financial interests or personal relationships that could have appeared to influence the work reported in this paper.

Appendix A

Appendix A.1. Geometric Means and Priority Indices Section A

Table A1. Geometric means and the priority indices of the Biodiversity Conservation Approa hes (BCAs) both in expectations and current performance.
a: Geometric mean of the three BCAs on expectations/capacity building
Species-based
(BCA1)
Area-based
(BCA2)
Ecosystem-service-based
(BCA3)
Species-based (BCA1)10.420.65
Area-based (BCA2)2.4010.57
Ecosystem-service-based
(BCA3)
1.531.761
b: Row average operation of the three BCAs on expectations/capacity building
Species-based
(BCA1)
Area-based
(BCA2)
Ecosystem-service-based
(BCA3)
Priority Index (Row Average)
Species-based (BCA1)0.2030.1320.2930.209
Area-based (BCA2)0.4870.3140.2570.353
Ecosystem-service-based (BCA3)0.3100.5530.4500.438
c: Geometric mean of the three BCAs on actual/current performance
Species-based
(BCA1)
Area-based
(BCA2)
Ecosystem-service-based
(BCA3)
Species-based
(BCA1)
10.540.85
Area-based
(BCA2)
1.8810.37
Ecosystem-service-based
(BCA3)
1.182.721
d: Row average operation of the three BCAs on actual/current performance
Species-based
(BCA1)
Area-based
(BCA2)
Ecosystem-service-based
(BCA3)
Priority Index (Row Average)
Species-based (BCA1)0.2460.1270.3830.252
Area-based (BCA2)0.4630.2350.1670.288
Ecosystem-service-based (BCA3)0.2910.6380.4510.460

Appendix A.2. Geometric Means and Priority Indices Section B

Table A2. Geometric means and the priority indices of the Conservation Targets (CTs) both in expectations and current performance.
a: Geometric mean of the four CTs of the species-based approach on expectations/capacity building
Threatened species
(CT1)
Ecological important species (hubs of network)
(CT2)
Species of use to human
(CT3)
Species with non-use values
(CT4)
Threatened species (CT1)10.590.361.79
Ecological important species (hubs of network) (CT2)1.7010.320.97
Species of use to human (CT3)2.773.1711.61
Species with non-use values (CT4)0.561.030.621
b: Row average operation of the four CTs of the species-based approach on expectations/capacity building
Threatened species
(CT1)
Ecological important species (hubs of network) (CT2)Species of use to human
(CT3)
Species with non-use values
(CT4)
Priority Index (Row Average)
Threatened species (CT1)0.1660.1020.1570.3330.190
Ecological important species (hubs of network) (CT2)0.2820.1730.1390.1810.194
Species of use to human (CT3)0.4590.5470.4350.3000.435
Species with non-use values (CT4)0.0930.1780.2700.1860.82
c: Geometric mean of the four CTs of the species-based approach on actual/current performance
Threatened species
(CT1)
Ecological important species (hubs of network) (CT2)Species of use to human (CT3)Species with non-use values
(CT4)
Threatened species (CT1)1 0.630.491.28
Ecological important species (hubs of network) (CT2)1.5910.321.12
Species of use to human (CT3)2.043.1311.22
Species with non-use values CT4)0.780.890.821
d: Row average operation of the four CTs of the species-based approach on actual/current performance
Threatened species
(CT1)
Ecological important species (hubs of network)
(CT2)
Species of use to human
(CT3)
Species with non-use values
(CT4)
Priority Index (Row Average)
Threatened species (CT1)0.1850.1120.1860.2770.190
Ecological important species (hubs of network) (CT2)0.2940.1770.1220.2420.209
Species of use to human (CT3)0.3770.5500.3800.2640.393
Species with non-use values (CT4)0.0140.1580.3120.2160.175
e: Geometric mean of the two CTs of the area-based approach on expectation/capacity building
Endemic areas (hotspots) CT5)Non-endemic areas (CT6)
Endemic areas (hotspots) (CT5)11.54
Non-endemic areas (CT6)0.651
f: Row average operation of the two CTs of the area-based approach on expectation/capacity building
Endemic areas (hotspots) (CT5)Non-endemic areas
(CT6)
Priority Index (Row Average)
Endemic areas (hotspots) (CT5)0.6060.6060.606
Non-endemic areas (CT6)0.3940.3940.394
g: Geometric mean of the two CTs of the area-based approach on actual/current performance
Endemic areas (hotspots) (CT5)Non-endemic areas
(CT6)
Endemic areas (hotspots) (CT5)11.00
Non-endemic areas (CT6)1.001
h: Row average operation of the two CTs of the area-based approach on actual/current performance
Endemic areas (hotspots) (CT5)Non-endemic areas
(CT6)
Priority Index (Row Average)
Endemic areas (hotspots) (CT5)0.5 0.50.5
Non-endemic areas (CT6)0.50.50.5
i: Geometric mean of the three CTs of the ecosystem-service-based approach on expectations/capacity building
Water (CT7)Land (CT8)Living Resources (CT9)
Water (CT7)10.280.43
Land (CT8)3.5910.47
Living Resources (CT9)2.322.151
j: Row average operation of the three CTs of the ecosystem-service-based approach on expectation/capacity building
Water
(CT7)
Land
(CT8)
Living Resources
(CT9)
Priority Index (Row Average)
Water (CT7)0.1040.1540.1040.204
Land (CT8)0.3740.1940.1140.251
Living Resources (CT9)0.2420.4170.2430.273
k: Geometric mean of the three CTs of the ecosystem-service-based approach on actual/current performance
Water (CT7)Land (CT8)Living Resources (CT9)
Water (CT7)11.190.84
Land (CT8)0.8410.85
Living Resources (CT9)1.191.181
Column Total3.033.372.69
l: Row average operation of the three CTs of the ecosystem-service-based approach on actual/current performance
Water
(CT7)
Land
(CT8)
Living Resources (CT9)Priority Index (Row Average)
Water (CT7)0.2130.2880.2300.121
Land (CT8)0.2550.2370.2620.247
Living Resource (CT9)0.2530.2860.2730.268

Appendix B

Step 11: Establish Input–Output Relationship of the Biodiversity Conservation Approaches

Practically, the importance of this model is utilized here to show such interdependence using:
x = ( I A ) 1 d
where
  • x = vector of total output (dependence vector);
  • I = identity matrix;
  • A = matrix of coefficients aij (geometric mean of the Delphi data);
  • d = vector of final demand (α matrix which is the priority indices on expectations of the BCAs).
Since the interflow matrices (I − A) have a multiplicative inverse, then this depicts a linear system of equations having a unique solution, and so, given final demand vectors, we find the needed output.

Appendix C

Step 12: Formulating Linear Programming (LP)

Let rk represent the resource need for BCAk where k (the decision variables) = 1, 2, 3.
R = k = 1 3 r k
where R = objective function and r = coefficient of objective function corresponding to the decision variables.
Then:
w k = r k R
where   w k = the vector of the decision variables to be determined.
The specific objective here is to maximize the use of resources for the BCA in order to minimize depletion of biological diversity. Therefore, following Satty and Alexander (1981), Madu and Madu (1993) and Madu et al. (2017), an LP model can be established more compactly as:
Max βTw
Subject to:
0     w k     r k R
and
k = 1 3 w k = 1
where w is a real matrix that corresponds to the coefficients on k1, k2 and k3 in the constrains of the LP problem, and Max βTw is the objective function.

References

  1. Josh, D.; Ian, O.; Julian, W. Consensus when experts disagree: A priority list of invasive alien plant species that reduce ecological restoration success. Manag. Biol. Invasions 2018, 9, 329–341. [Google Scholar]
  2. Spies, T.A.; Ripple, W.J.; Bradshaw, G.A. Dynamics and pattern of a managed coniferous forest landscape in Oregon. Ecol. Appl. 1994, 4, 555–568. [Google Scholar] [CrossRef] [Green Version]
  3. Lathrop, R.G.; Bognar, J.A. Applying GIS and landscape ecological principles to evaluate land conservation alternatives. Landsc. Urban Plan. 1998, 41, 27–41. [Google Scholar] [CrossRef]
  4. Bradley, J.C.; Duffy, J.E.; Gonzalez, A.; Hooper, D.U.; Perrings, C.; Venail, P.; Narwani, A.; Mace, G.M.; Tilman, D.; Wardle, D.A.; et al. Biodiversity Loss and Its Impact on Humanity. Nature 2012, 486, 59–67. [Google Scholar] [CrossRef]
  5. Sam, I.E.; Nnaji, E.S.; Asuquo, E.E.; Etefia, T.E. Impact of Overpopulation on the Biological Diversity Conservation in Boki Local Government Area of Cross River State. Niger. Am. J. Environ. Eng. 2014, 4, 94–98. Available online: http://article.sapub.org/10.5923.j.ajee.20140405.02.html (accessed on 26 October 2018).
  6. Regan, H.; Davis, F.; Andelman, S.; Widyanata, A.; Freese, M. Comprehensive criteria for biodiversity evaluation in conservation planning. Biodivers. Conserv. 2007, 16, 2715–2728. [Google Scholar] [CrossRef]
  7. Pearce, D.; Moran, D. The Economic Value of Biodiversity; Earthscan: London, UK, 1994; p. 186. [Google Scholar]
  8. Costanza, R.; D’arge, R.; De Groot, R.; Farber, S.; Grasso, M.; Hannon, B.; Limburg, K.; Naeem, S.; O’neil, R.V.; Paruelo, J.; et al. The value of the world’s ecosystem services and natural capital. Nature 1997, 387, 253–260. [Google Scholar] [CrossRef]
  9. Jones, P.G.; Beebe, S.E.; Tohme, J.; Galwey, N.W. The use of geographic information systems in biodiversity exploration and conservation. Biodivers. Conserv. 1997, 6, 947–958. [Google Scholar] [CrossRef]
  10. Mariuki, J.N.; De Klerk, H.M.; Williams, P.H.; Bennun, L.A.; Crowe, T.M.; Berge, E.V. Using patterns of distribution and diversity of Kenyan birds to select and prioritize areas for conservation. Biodivers. Conserv. 1997, 6, 191–210. [Google Scholar] [CrossRef]
  11. Rubino, M.J.; Hess, G.R. Planning open spaces for wildlife 2: Modeling and verifying focal species habitat. Landsc. Urban Plan. 2003, 64, 89–104. [Google Scholar] [CrossRef]
  12. Smallwood, K.S.; Wilcox, B.; Leidy, R.; Yarris, K. Indicators assessment for habitat conservation plan of Yolo County, California, USA. Environ. Manag. 1998, 22, 947–958. [Google Scholar] [CrossRef]
  13. Roberts, C.M.; Andelman, S.; Branch, G.; Bustamante, R.H.; Carlos Castilla, J.; Dugan, J.; Halpern, B.S.; Lafferty, K.D.; Leslie, H.; Lubchenco, J. Ecological criteria for evaluating candidate sites for marine reserves. Ecol. Appl. 2003, 13, 199–214. [Google Scholar] [CrossRef] [Green Version]
  14. Gilman, E.; Dunn, D.; Read, A.; Hyrenbach, K.D.; Warner, R. Designing criteria suites to identify discrete and networked sites of high value across manifestations of biodiversity. Biodivers. Conserv. 2011, 20, 3363–3383. [Google Scholar] [CrossRef] [Green Version]
  15. Bidegain, I.; Cerda, C.; Catala’n, E.; Tironi, A.; Lo’pez-Santiago, C. Social preferences for ecosystem services in a biodiversity hotspot in South America. PLoS ONE 2019, 14, e0215715. [Google Scholar] [CrossRef]
  16. Jacobs, S.; Dendoncker, N.; Martı’n-Lo’pez, B.; Barton, D.N.; Gomez-Baggethun, E.; Boeraeve, F.; McGrath, F.L.; Vierikko, K.; Geneletti, D.; Sevecke, K.J.; et al. A new valuation school: Integrating diverse values of nature in resource and land use decisions. Ecosyst. Serv. 2016, 22, 213–220. [Google Scholar] [CrossRef]
  17. López-Santiago, C.A.; Oteros-Rozas, E.; Martin-López, B.; Plieninger, T.; Martin, E.G.; González, J.A. Using visual stimuli to explore the social perceptions of ecosystem services in cultural landscapes: The case of transhumance in Mediterranean Spain. Ecol. Soc. 2014, 19, 27. [Google Scholar] [CrossRef]
  18. Ode, A.; Fry, G.; Tveit, M.S.; Messager, P.; Miller, D. Indicators of perceived naturalness as drivers of landscape preference. J. Environ. Manag. 2009, 90, 375–383. [Google Scholar] [CrossRef]
  19. Nijnik, M.; Zahvoyska, L.; Nijnik, A.; Ode, A. Public evaluation of landscape content and change: Several examples from Europe. Land Use Policy 2008, 26, 77–86. [Google Scholar] [CrossRef]
  20. Tveit, M.; Ode, A.; Fry, G. Key concepts in a framework for analysing visual landscape character. Landsc. Res. 2006, 31, 229–255. [Google Scholar] [CrossRef]
  21. Martín-López, B.; Iniesta-Arandia, I.; García-Llorente, M.; Palomo, I.; Casado-Arzuaga, I.; Amo, D.G.; Gómez-Baggethun, E.; Oteros-Rozas, E.; Palacios-Agundez, I.; Willaarts, B.; et al. Uncovering ecosystem service bundles through social preferences. PLoS ONE 2012, 7, e38970. [Google Scholar] [CrossRef] [Green Version]
  22. Vane-Wright, R.I.; Humphries, C.J.; Williams, P.H. What to protect—systematics and the agony of choice. Biol. Conserv. 1991, 55, 235–254. [Google Scholar] [CrossRef]
  23. Roberge, J.M.; Angelstam, P. Usefulness of the umbrella species concept as a conservation tool. Conserv. Biol. 2004, 18, 76–85. [Google Scholar] [CrossRef]
  24. de Lima, R.A.F.; Souza, V.C.; de Siqueira, M.F.; ter Steege, H. Defining endemism levels for biodiversity conservation: Tree species in the Atlantic Forest hotspot. Biol. Conserv. 2020, 252, 108825. [Google Scholar] [CrossRef]
  25. Moreira, F.; Allsopp, N.; Esler, K.J.; Wardell-Johnson, G.; Ancillotto, L.; Arianoutsou, M.; Clary, J.; Brotons, L.; Clavero, M.; Dimitrakopoulos, P.G.; et al. Priority questions for biodiversity conservation in the Mediterranean biome: Heterogeneous perspectives across continents and stakeholders. Conserv. Sci. Pract. 2019, 1, e118. [Google Scholar] [CrossRef]
  26. Bosso, L.; Ancillotto, L.; Smeraldo, S.; D’Arco, S.; Migliozzi, A.; Conti, P.; Russo, D. Loss of potential bat habitat following a severe wildfire: A model based rapid assessment. Int. J. Wildland Fire 2018, 27, 756–769. [Google Scholar] [CrossRef] [Green Version]
  27. Smeraldo, S.; Bosso, L.; Fraissinet, M.; Bordignon, L.; Brunelli, M.; Ancillotto, L.; Russo, D. Modelling risks posed by wind turbines and electric power lines to soaring birds: The black stork (Ciconia nigra) in Italy as a case study. Biodivers. Conserv. 2020, 29, 1959–1976. [Google Scholar] [CrossRef]
  28. Chandra, N.; Singh, G.; Lingwal, S.; Jalal, J.S.; Bisht, M.S.; Pal, V.; Rawat, B.; Tiwari, L. Ecological niche modeling and status of threatened alpine medicinal plant Dactylorhiza Hatagirea, D. Don in Western Himalaya. J. Sustain. For. 2021, 1–17. [Google Scholar] [CrossRef]
  29. Shmelev, S.E. Working Paper Number 181. In Multi-criteria Assessment of Ecosystems and Biodiversity: New Dimensions and Stakeholders in the South of France; University of Oxford: Oxford, UK, 2010. [Google Scholar]
  30. Madu, C.N.; Madu, A.A. A systems approach to the transfer of mutually dependent Technologies. Socio-Econ. Plan. Sci. 1993, 27, 269–287. [Google Scholar] [CrossRef]
  31. Madu, C.N.; Ozumba, B.C.; Kuei, C.-H.; Madu, I.E.; Nnadi, V.E.; Ezeasor, I.C.; Eze, H.I.; Odinkonigbo, U.; Ogbuene, E.; Ewoh, J.; et al. Hyogo Framework for Action (HFA): A case study of Nigeria. Curr. Environ. Manag. 2019, 6, 196–209. [Google Scholar] [CrossRef]
  32. Madu, C.N.; Kuei, C.H.; Madu, I.E.; Ozumba, B.C.; Odinkonigbo, I.L.; Ezeasor, I.C.; Nnadi, V.E.; Ogbuene, E.B.; Ewoh, J.C.; Mmomh, P.C. Priority Assessment of the Hyogo Framework for Action (HFA): A case study of Nigeria. In Hand Book of Disaster Risk Reduction and Management, 1st ed.; Madu, C.N., Kuei, C.H., Eds.; World Scientific Publishing: Hackensack, NJ, USA, 2017. [Google Scholar]
  33. Schmidt, K.; Aumann, I.; Hollander, I.; Damm, K.; Schulenburg, J.G. Applying the Analytic Hierarchy Process in healthcare research: A systematic literature review and evaluation of reporting. BMC Med. Inform. Decis. Mak. 2015, 15, 112. [Google Scholar] [CrossRef] [Green Version]
  34. Joshi, V.; Narra, V.R.; Joshi, K.; Lee, K.; Melson, D. PACS Administrators’ and Radiologists’ Perspective on the Importance of Features for PACS Selection. J. Digit. Imaging 2014, 27, 486–495. [Google Scholar] [CrossRef] [Green Version]
  35. Cheever, M.A.; Allison, J.P.; Ferris, A.S.; Finn, O.J.; Hastings, B.M.; Hecht, T.T.; Mellman, I.; Prindiville, S.A.; Viner, J.L.; Weiner, L.M.; et al. The prioritization of cancer antigens: A national cancer institute pilot project for the acceleration of translational research. Clin. Cancer Res. 2009, 15, 5323–5337. [Google Scholar] [CrossRef] [Green Version]
  36. Liberatore, M.J.; Nydick, R.L. The analytic hierarchy process in medical and health care decision making: A literature review. Eur. J. Oper. Res. 2008, 189, 194–207. [Google Scholar] [CrossRef]
  37. Kleindorfer, P.R.; Partovi, F.Y. Integrating Manufacturing strategy and technology choice. Eur. J. Oper. Res. 1990, 47, 139–270. [Google Scholar] [CrossRef]
  38. Marcot, B.G.; Thompson, M.P.; Runge, M.C.; Thompson, F.R.; Cleaves, D.; Tomosy, M.; Fisher, L.A.; Bliss, A. Recent advances in applying decision science to managing national forests. For. Ecol. Manag. 2012, 285, 123–132. [Google Scholar] [CrossRef]
  39. Asaad, I.; Lundquist, C.J.; Erdmann, M.V.; Costello, M.J. Ecological criteria to identify areas for biodiversity conservation. Biol. Conserv. 2017, 213, 309–316. [Google Scholar] [CrossRef]
  40. Pereira, H.M.; Navarro, L.M.; Martins, I.S. Global biodiversity change: The bad, the good, and the unknown. Annu. Rev. Environ. Resour. 2012, 37, 25–50. [Google Scholar] [CrossRef] [Green Version]
  41. Tongco, M.D.C. Purposive Sampling as a Tool for Informant Selection. Ethnobot. Res. Appl. 2007, 5, 147–158. Available online: https://scholarspace.manoa.hawaii.edu/bitstream/10125/227/4/I1547-3465-05-147.pdf (accessed on 15 August 2021). [CrossRef] [Green Version]
  42. Powell, C. The Delphi technique: Myths and realities. J. Adv. Nurs. 2003, 41, 376–382. [Google Scholar] [CrossRef] [Green Version]
  43. Besaw, L.E.; Rizzo, D.M.; Kline, M.; Underwood, K.L.; Doris, J.J.; Morrissey, L.A.; Pelletier, K. Stream classification using hierarchical artificial neural networks: A fluvial hazard management tool. J. Hydrol. 2009, 373, 34–43. [Google Scholar] [CrossRef]
  44. Saffron, J.O.; Tim, J.O.; Mike, H.; Irene, L.; Andrew, R.W. Using expert knowledge to assess uncertainties in future polar bear populations under climate change. J. Appl. Ecol. 2008, 45, 1649–1659. Available online: https://besjournals.onlinelibrary.wiley.com/doi/pdf/10.1111/j.1365-2664.2008.01552.x (accessed on 15 August 2021).
  45. Wooldridge, S.; Done, T.; Berkelmans, R.; Jones, R.; Marshall, P. Precursors for resilience in coral communities in a warming climate: A belief network approach. Mar. Ecol. Prog. Ser. 2005, 295, 157–169. [Google Scholar] [CrossRef] [Green Version]
  46. Krayer von Krauss, M.P.; Casman, E.A.; Small, M.J. Elicitation of expert judgments of uncertainty in the risk assessment of herbicide-tolerant oilseed crops. Risk Anal. 2004, 24, 1515–1527. [Google Scholar] [CrossRef] [PubMed]
  47. Mariëlle, Z.; Wenneke, S.H.; Herbert, H.; Rens, S. Application and Evaluation of an Expert Judgement Elicitation Procedure for Correlations. Front. Psychol. 2017, 8, 90. Available online: https://journals.plos.org/plosone/article/file?id=10.1371/journal.pone.0198468&type=printable (accessed on 15 August 2021).
  48. Murray, J.V.; Goldizen, A.W.; O’Leary, R.A.; McAlpine, C.A.; Possingham, H.P.; Low Choy, S. How useful is expert opinion for predicting the distribution of a species within and beyond the region of expertise? A case study using brushtailed rock-wallabies Petrogalepenicillata. J. Appl. Ecol. 2009, 46, 842–851. [Google Scholar] [CrossRef]
  49. Martin, T.G.; Kuhnert, P.M.; Mengersen, K.; Possingham, H.P. The power of expert opinion in ecological models using Bayesian methods: Impact of grazing on birds. Ecol. Appl. 2005, 15, 266–280. [Google Scholar] [CrossRef] [Green Version]
  50. Brouwer, R.; De Blois, C. Integrated modelling of risk and uncertainty underlying the cost and effectiveness of water quality measures. Environ. Model. Softw. 2008, 23, 922–937. [Google Scholar] [CrossRef]
  51. Fish, R.; Winter, M.; Oliver, D.M.; Chadwick, D.; Selfa, T.; Heathwaite, A.L.; Hodgson, C. Unruly pathogens: Eliciting values for environmental risk in the context of heterogeneous expert knowledge. Environ. Sci. Policy 2009, 12, 281–296. [Google Scholar] [CrossRef] [Green Version]
  52. Montangeroa, A.; Belevib, H. Assessing nutrient flows in septic tanks by eliciting expert judgement: A promising method in the context of developing countries. Water Res. 2007, 41, 1052–1064. [Google Scholar] [CrossRef]
  53. Aczel, J.; Saaty, T. Procedures for Synthesizing Ratio Judgments. J. Math. Psychol. 1983, 27, 93–102. [Google Scholar] [CrossRef]
  54. Brans, J.P.; Vincke, P.; Mareschal, B. How to select and how to rank projects: The promethee method. Eur. J. Oper. Res. 1986, 24, 228–238. [Google Scholar] [CrossRef]
  55. Rowe, G.; Wright, G. Expert Opinions in Forecasting. Role of the Delphi Technique. In Principles of Forecasting: A Handbook of Researchers and Practitioners; Armstrong, J.S., Ed.; Kluwer Academic Publishers: Boston, MA, USA, 2001. [Google Scholar]
  56. Fink, A.; Kosecoff, J.; Chassin, M.; Brook, R. Consensus Methods: Characteristics and Guidelines for Use; RAND: Santa Monica, CA, USA, 1991. [Google Scholar]
  57. Hsu, C.; Sandford, B.A. The Delphi Technique: Making Sense of Consensus. Pract. Assess. Res. Eval. 2007, 12, 10. [Google Scholar] [CrossRef]
  58. MEA. Ecosystems and Human Well-Being: Synthesis Report; Island Press: Washington, DC, USA, 2005.
  59. Seppelt, R.; Dormann, C.F.; Eppink, F.V.; Lautenbach, S.; Schmidt, S. A quantitative review of ecosystem service studies: Approaches, shortcomings and the road ahead. J. Appl. Ecol. 2011, 48, 630–636. Available online: http://onlinelibrary.wiley.com/doi/10.1111/j.1365-2664.2010.01952.x/full (accessed on 15 August 2021). [CrossRef]
  60. Franklin, J.F. Preserving biodiversity: Species, ecosystems, or landscapes? Ecol. Appl. 1993, 3, 202–205. [Google Scholar] [CrossRef] [Green Version]
  61. Vuilleumier, S.; Prelaz-Droux, R. Map of ecological networks for landscape planning. Landsc. Urban Plan. 2002, 58, 157–170. [Google Scholar] [CrossRef]
  62. Phua, M.; Minowa, M.A. GIS-based multi-criteria decision making approach to forest conservation planning at a landscape scale: A case study in the Kinabalu Area, Sabah, Malaysia. Landsc. Urban Plan. 2005, 71, 207–222. Available online: www.elsevier.com/locate/landurbplan (accessed on 16 August 2017).
  63. Washington Biodiversity Council. Washington Biodiversity Conservation Strategy: Sustaining Our Natural Heritage for Future Generations. 2007. Available online: http://www.rco.wa.gov/documents/biodiversity/WABiodiversityConservationStrategy.pdf (accessed on 5 September 2017).
  64. UNCED. The United Nations Conference on Environment and Development. 1992. Available online: http://www.unesco.org/education/pdf/RIO_E.PDF (accessed on 16 August 2017).
  65. MEA. Ecosystems and Human Well-Being—A Framework for Assessment; World Resources Institute Island Press: New York, NY, USA, 2003.
  66. Myers, N.; Mittermeier, R.A.; Mittermeier, C.G.; da Fonseca, G.A.B.; Kent, J. Biodiversity hotspots for conservation priorities. Nature 2000, 403, 853–858. [Google Scholar] [CrossRef]
  67. Barends, E.; Rousseau, D.M.; Briner, R.B. Evidence-Based Management: The Basic Principles. Amsterdam: Center for Evidence-Based Management. 2014. Available online: https://www.cebma.org/wpcontent/uploads/Evidence-Based-Practice-The-Basic-Principles.pdf (accessed on 16 August 2017).
  68. Saaty, T.L.; Alexander, J.M. Thinking with Models; Pergamon Press: Oxford, UK, 1981. [Google Scholar]
  69. Schrade, L. User’s Manual for the Linear, integer, and Quadratic Programming with LINDO; Scientific Press: Redwood City, CA, USA, 1987. [Google Scholar]
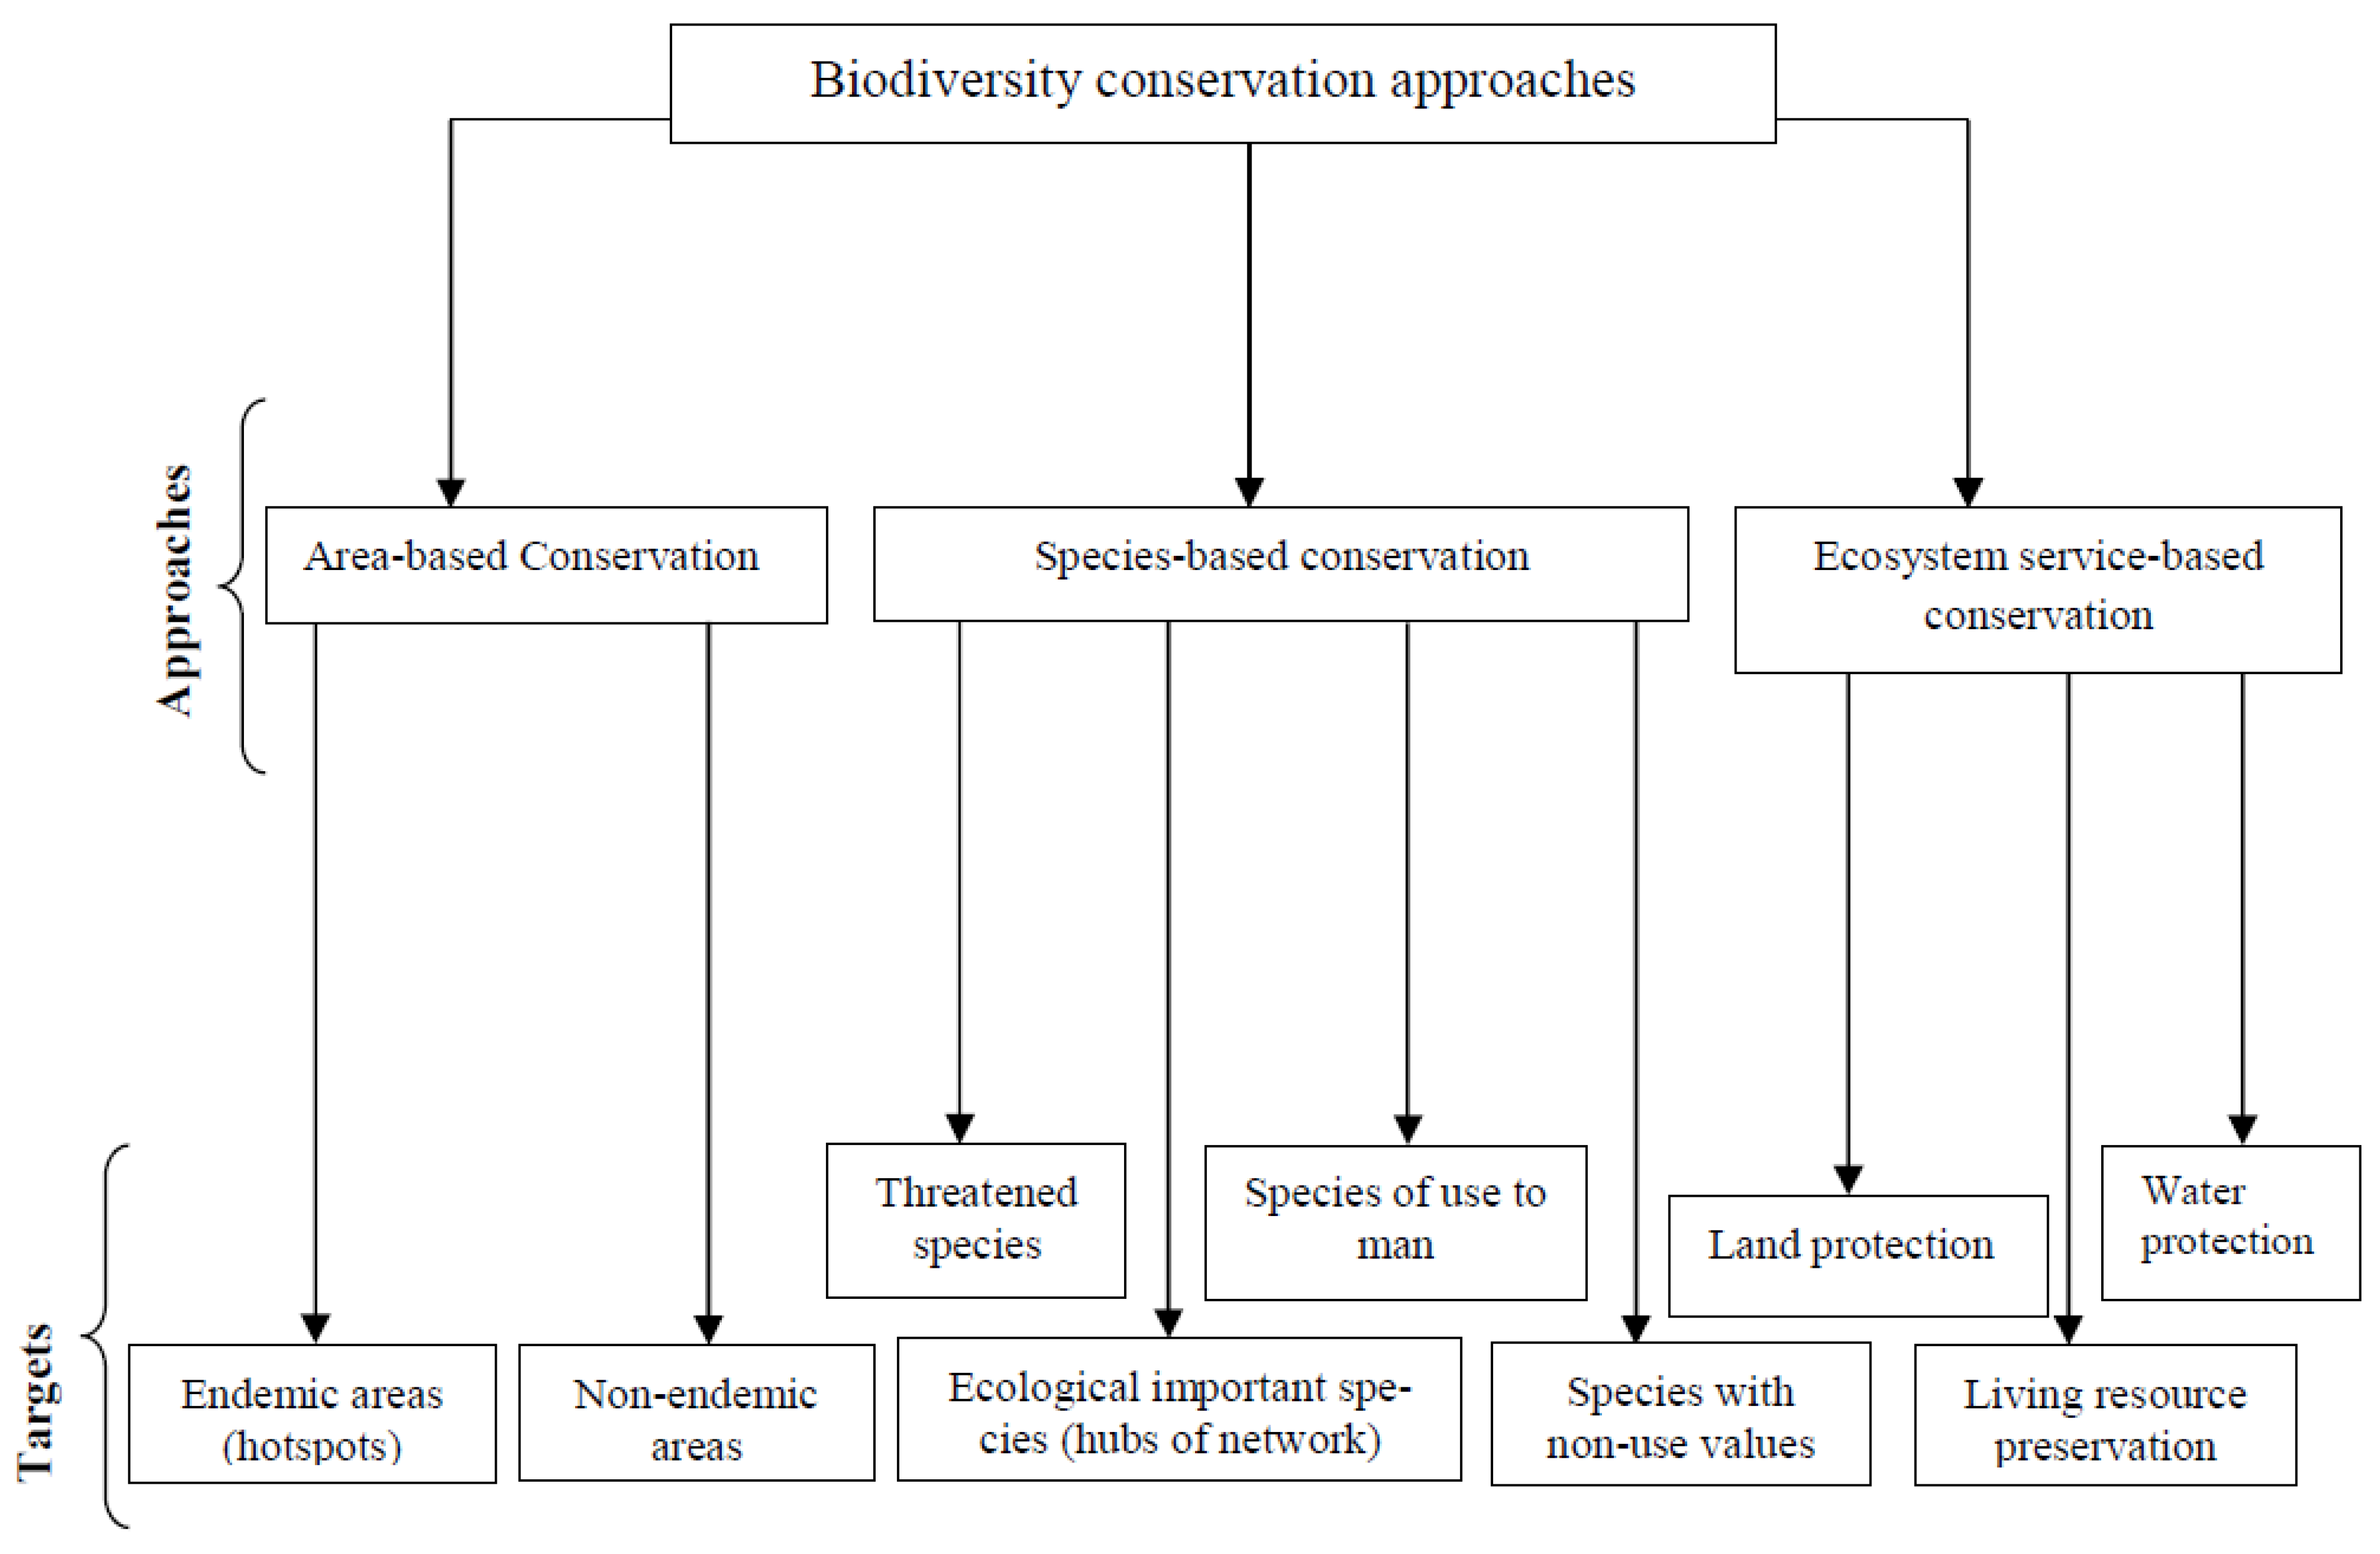
Figure 1. Biodiversity conservation approaches (BCAs) and their corresponding specific conservation targets (CTs).
Sustainability 13 09161 g001
Figure 2. Methodology of analytical hierarchy process (AHP) for prioritizing biodiversity conservation approaches (BCAs) and conservation targets (CTs).
Sustainability 13 09161 g002
Figure 3. A systematic method to improving biodiversity conservation approach.
Sustainability 13 09161 g003
Figure 4. A network structure for prioritizing biodiversity conservation approaches (BCAs).
Sustainability 13 09161 g004
Figure 5. Chart of the perceived performance and expectation of the species-based approach (BCA1).
Sustainability 13 09161 g005
Figure 6. Interdependence network of the three biodiversity conservation approaches (BCAs).
Sustainability 13 09161 g006
Figure 7. Biodiversity conservation resource allocation priority.
Sustainability 13 09161 g007
Table 1. Prioritizing the biodiversity conservation approaches (BCA)—Expectation vs. actual performance.
ExpectationPerformance
Conservation (Top-Level) ApproachesPriority IndexRankingPriority IndexRanking
Species-based 0.20930.2523
Area-based0.35320.2882
Ecosystem-service-based 0.43810.4601
CR = 0.094.
Table 2. Prioritizing the conservation targets under the species-based approach—Expectation vs. actual performance.
ExpectationPerformance
Conservation Target (CT)IndicatorsPriority IndexRankingPriority IndexRanking
CT1Threatened species0.19030.1903
CT2Ecological important
Species
0.19420.2092
CT3Species of use to human0.43510.3931
CT4Species of non-use to
human
0.18240.1754
CR = 0.074.
Table 3. Prioritizing the conservation targets under the area-based approach—Expectation vs. actual performance.
ExpectationPerformance
Conservation Target (CT)IndicatorsPriority IndexRankingPriority IndexRanking
CT5Endemic areas
(hotspot)
0.60610.5001
CT6Non-endemic areas 0.39420.5001
CR = 0.031.
Table 4. Prioritizing the conservation targets under the ecosystem-service-based approach—Expectation vs. actual performance.
ExpectationPerformance
Conservation Target (CT)IndicatorsPriority IndexRankingPriority IndexRanking
CT7Water 0.20430.1213
CT8Land0.25120.2472
CT9Living Resources0.27310.2681
CR = 0.083.
Table 5. α matrix for the biodiversity conservation approaches (BCAs).
BCA10.209
α = BCA20.353
BCA30.438
Table 6. The input–output matrix for the biodiversity conservation approaches (BCAs).
BCA1BCA2BCA3
BCA13.603.993.56
BCA23.624.543.65
BCA33.443.754.24
Table 7. The dependence vector matrix for the biodiversity conservation approaches (BCAs).
BCA10.778
β = BCA21.397
BCA31.708
Table 8. Sharing of the NGN 100,000,000 budget allocation for the biodiversity conservation approaches (BCAs).
Biodiversity Conservation
Approaches (BCAs)
Resource Requirement
(Millions of NGN)
Real Matrix (w)
(Resource Requirement/Total)
BCA1390.339
BCA2330.287
BCA3430.374
Total1151
Table 9. Resource allocation based on the “greedy heuristic” algorithm for the biodiversity conservation approaches (BCAs).
Biodiversity Conservation Approaches (BCAs)Resource Allocation (Millions of NGN)
BCA124
BCA233
BCA343
Publisher’s Note: MDPI stays neutral with regard to jurisdictional claims in published maps and institutional affiliations.