Article

Urban Form and Natural Hazards: Exploring the Dual Aspect Concept of Urban Forms on Flood Damage

Department of Urban Planning and Engineering, Pusan National University, Busan 46241, Korea
*
Author to whom correspondence should be addressed.
Sustainability 2021, 13(16), 9007; https://doi.org/10.3390/su13169007
Submission received: 7 July 2021 / Revised: 9 August 2021 / Accepted: 9 August 2021 / Published: 12 August 2021

Abstract

:
The purpose of the paper is to explore the dual aspect concept of the impact of urban forms on flood damage. Theoretically, urban form has the dual aspect concept of increasing or decreasing flood damage. Recent issues such as climate change and pandemics are increasing the need to re-discuss the relationship between urban forms and natural hazards. By revisiting the dual aspect concepts of urban forms such as aggregation and dispersion, we can effectively respond to specific urban problems that present complex issues at the city level. Accordingly, this paper once again considers what is a more resilient and ideal urban form for natural hazards by exploring dual aspect concepts of urban form for flood damage spatially and quantitatively from a macroscopic point of view.

1. Introduction

Urbanization around the world has continued steadily for the past 40 years, and urbanization is accelerating, with the number of people living in cities with more than 50,000 people more than doubled compared with before. Approximately half of the world’s population currently lives in cities, and given the current rise, 55% of the world’s population is expected to live in cities by 2050 [1]. With this trend of urbanization, many cities are exposed to natural hazards such as floods and sea level rise, as climate change has become more serious recently. According to Table 1, global urban population growth has occurred in three patterns: increasing the number of cities, increasing the density of existing cities, and expanding urban space. First, a quarter of the increased urban population was caused by more than doubling the number of cities with a population of more than 50,000 from about 5000 to 10,000, and secondly, half of the increased urban population was caused by urban densification within existing urban boundaries. It is analyzed that the remaining quarter is due to the expansion of the existing urban space, which has nearly doubled the area compared with previously. Such urban growth patterns can affect the damages caused by natural hazards in terms of urban form, which is deeply related to flood damage. The issue here is that certain urban growth patterns can increase or decrease flood damage. For example, a high-density urban form may have more concentrated damage than a low-density urban form on an equivalent exposed land unit, but, at the same time, may reduce damage because it is less likely to include hazardous areas such as floodplains. As such, the impact of urban forms on flood damage can appear in various ways, and this paper intends to name them as “dual aspect concepts”.
The dual aspect concepts implied by urban forms have been revealed in several studies, and representatively, there is a debate about sprawl and compact city by Gordon and Richardson [2] and Ewing [3], both published in the Journal of the American Planning Association in 1997. The two studies had different perspectives on the same urban form. Gordon and Richardson [2] viewed “compactness” as a high-density or mono-nuclear development [3,4], while Ewing [2] viewed “compactness” as a high-density development with spatial connectivity, strong centrality, and mixed land use, as well as good accessibility [4]. In this regard, urban problems can be interpreted differently depending on the viewpoint of urban forms, if there are various viewpoints and interpretations of compact city or sprawl.
Among the many urban problems, it is necessary to discuss natural hazards, especially in various ways, and to redefine the relationship between natural hazards and urban forms. The issues caused by climate change are increasing the need to deal with the impact of natural hazards in cities, and the impact of natural hazards is likely to be interpreted differently, depending on the perspective of the urban form. In addition, previous studies that analyzed natural hazards in terms of urban forms did not show the same results [5,6,7,8,9]. Therefore, this paper explores the dual aspect concepts of urban form for flood damage spatially and quantitatively from a macroscopic point of view, under the judgment that the discussion of dual aspect concepts for urban form is also valid for natural hazards.

2. Literature Review

2.1. Debates and Questions on Urban Form

As urban problems arise in various fields, such as environment, energy, climate, and transportation, discussions on the urban form with which to solve such problems have continued. Discussions on the urban form have been made between the sprawl form, which aims to provide an inexpensive and comfortable residential environment through the development of the outskirts, and the compact form, which develops around the city center and provides public services to take advantage of aggregation. The sprawl form refers to an outwardly diffused urban form, such as a low-density, decentralized development, and development outside the city center [10], while compact city refers to an energy-efficient city formed by developing a city with high density and compactness [11]. As the concept of sustainability has become more important, the discussion of the ideal urban form has continued, and the compact city has been regarded by some scholars as a symbol for modern urban planning [12]. However, negative discussions about the compact city are also increasing, such as the discussion that the lower the density of the city and the larger the ratio of open space, the more conducive to welfare provision, and that high density causes problems such as traffic congestion, increased air pollution, and decreased quality of life [13,14,15]. Recently, a discussion has been made on whether the compact city is an ideal urban form from the viewpoint of mitigating disasters.
The debate between Gordon and Richardson [2] and Ewing [3] is representative of the discussion on the impact of urban form or various other questions, as stated in the introduction. According to Ewing [16], the sprawling urban form increases the mileage of automobiles from the city center by spreading the development of the outskirts of the city center, causing problems such as with environment and energy. On the other hand, Gordon and Richardson [2] argue that there are still questions about the efficiency of compact cities in terms of economics and resources, and that sprawling urban forms have strengths compared with compact cities in terms of quality of life and equity. Through a counterpart review of Gordon and Richardson [2], Ewing [3] pointed out that it is necessary to distinguish between urban forms in terms of accessibility and self-sufficiency (degree of development cluster) rather than simply by classifying urban forms in terms of density. In other words, there is a possibility that the sprawling urban form that seems to deviate when the urban form is classified only in terms of density, and the “dual aspect concepts” of the compact city, may coexist if accessibility and self-sufficiency are considered. Therefore, to discuss the impact of urban form, it is necessary to consider various aspects such as accessibility and self-sufficiency, as well as density.
Recently there has been a discussion that it is necessary to consider not only the development density but also the connectivity and self-sufficiency that can indicate the degree of clustering of the development area. When urban forms are classified only in terms of urban density, some studies indicate that compact urban forms are suitable [17,18]. However, other studies argue that compact cities are unsuitable for mitigating disasters [19]. The reason for this conflicting empirical analysis result is that urban form is defined only in terms of development density [20]. When determining the urban form of a metropolitan area by focusing only on the urban density, there is a possibility that the degree of sprawl in the multi-nuclear or decentralized metropolitan area is measured to be low, resulting in a different analysis result than the actual one [21]. In addition, the Organisation for Economic Co-operation and Development (OECD) [14] classifies city types based on development density and proximity, and defines a city with a high density and proximity as a compact city. In other words, in order to distinguish between urban forms such as sprawling and compact cities, not only the density but also the proximity of the development area (the degree of clustering) must be considered.
As the importance of urban forms to building sustainable and resilient cities is being emphasized [22,23], discussions on urban forms will continue. For the purpose of solving the urban problem through the urban form approach, a clear operational definition of the city form is required, and it is necessary to analyze the impact on the city problem by considering the dual aspect concepts of the urban forms together.

2.2. Impact of Urban Form on Flood Damage

Climate change affects flood damage by increasing the severity or frequency of disasters, but meteorological factors are not the only factors that increase flood damage. Risks that influence natural hazards are defined differently according to studies, but, according to the Intergovernmental Panel on Climate Change (IPCC) [24], three factors influence the risk of natural hazards: weather and climate events, exposure, and vulnerability. Of these, exposure refers to the presence of human beings, livelihoods, ecosystems, environmental services and resources, and infrastructure, or economic, social, and cultural assets, in a position that may be adversely affected [25]. This means that the location or type of land use within a city can influence the risk of natural hazards.
The mechanism for the impact of urban forms on flood damage occurs in the process of urbanization. Lundgren [26] explained the effect of urbanization on flood damage in two aspects. First, urbanization affects flood damage by increasing the proportion of land surface covered by impermeable surfaces, and, secondly, it affects flood damage by reducing the land cover that has a natural drainage function. Land cover, such as greenery, can block a significant amount of incoming rainfall and direct a significant portion of the rainfall to the subsurface water flow [27,28]. On the other hand, if the impermeable surface covers more of the surface, it inhibits the penetration of storm water and significantly increases the surface runoff volume and peak discharges, resulting in an increased risk of urban flooding [29].
These land-covered mechanisms link the impact of urban forms to flood damage. This is closely related to urban density, aggregation, and proliferation, where high-density development exposes more population, residential and commercial buildings, and infrastructure to risk than low-density development on equivalent land units. In this case, the high-density urban form may pose a greater risk to life or property damage than the low-density sprawl form, if policies or efforts for disaster mitigation are not promoted [6]. In addition, the high-density development pattern can concentrate the runoff volume of stormwater over the entire area due to the aggregation on the impermeable surface [5]. On the other hand, some studies argue that the high-density form of development instead has an advantage at reducing flood damage. Brody et al. [7] argue that sprawl can increase runoff due to the fragmentation of the drainage network as a result of vast expansion of impermeable surfaces and low-density development. In addition, Xu et al. [9] found that the development of high-density forms in the neighborhood unit increased the amount of surface runoff, but on the urban scale the total amount of surface runoff decreased. This indicates that, when the scale is extended to the city level, high-density development rather than low-density development is effective at reducing runoff in terms of drainage infrastructure. In addition, as sprawl-type development patterns are more likely to include more hazardous areas, compact development patterns focus development on low-risk areas, further minimizing the population and property exposed to risks such as flooding [7,8].
As various studies have presented different results on the effect of urban aggregation and the spread of flood damage, it is necessary to examine the urban form in detail and consider more diverse aspects in demonstrating urban form. In relation to this, some recent studies have used land cover pattern variables rather than simply using impermeable surfaces [7,8,30,31], or used centrality and clustering variables based on population and area [32,33] in analyzing the impact relationship between urban forms and flood damage to reflect the various characteristics of urban forms.

3. Research Design

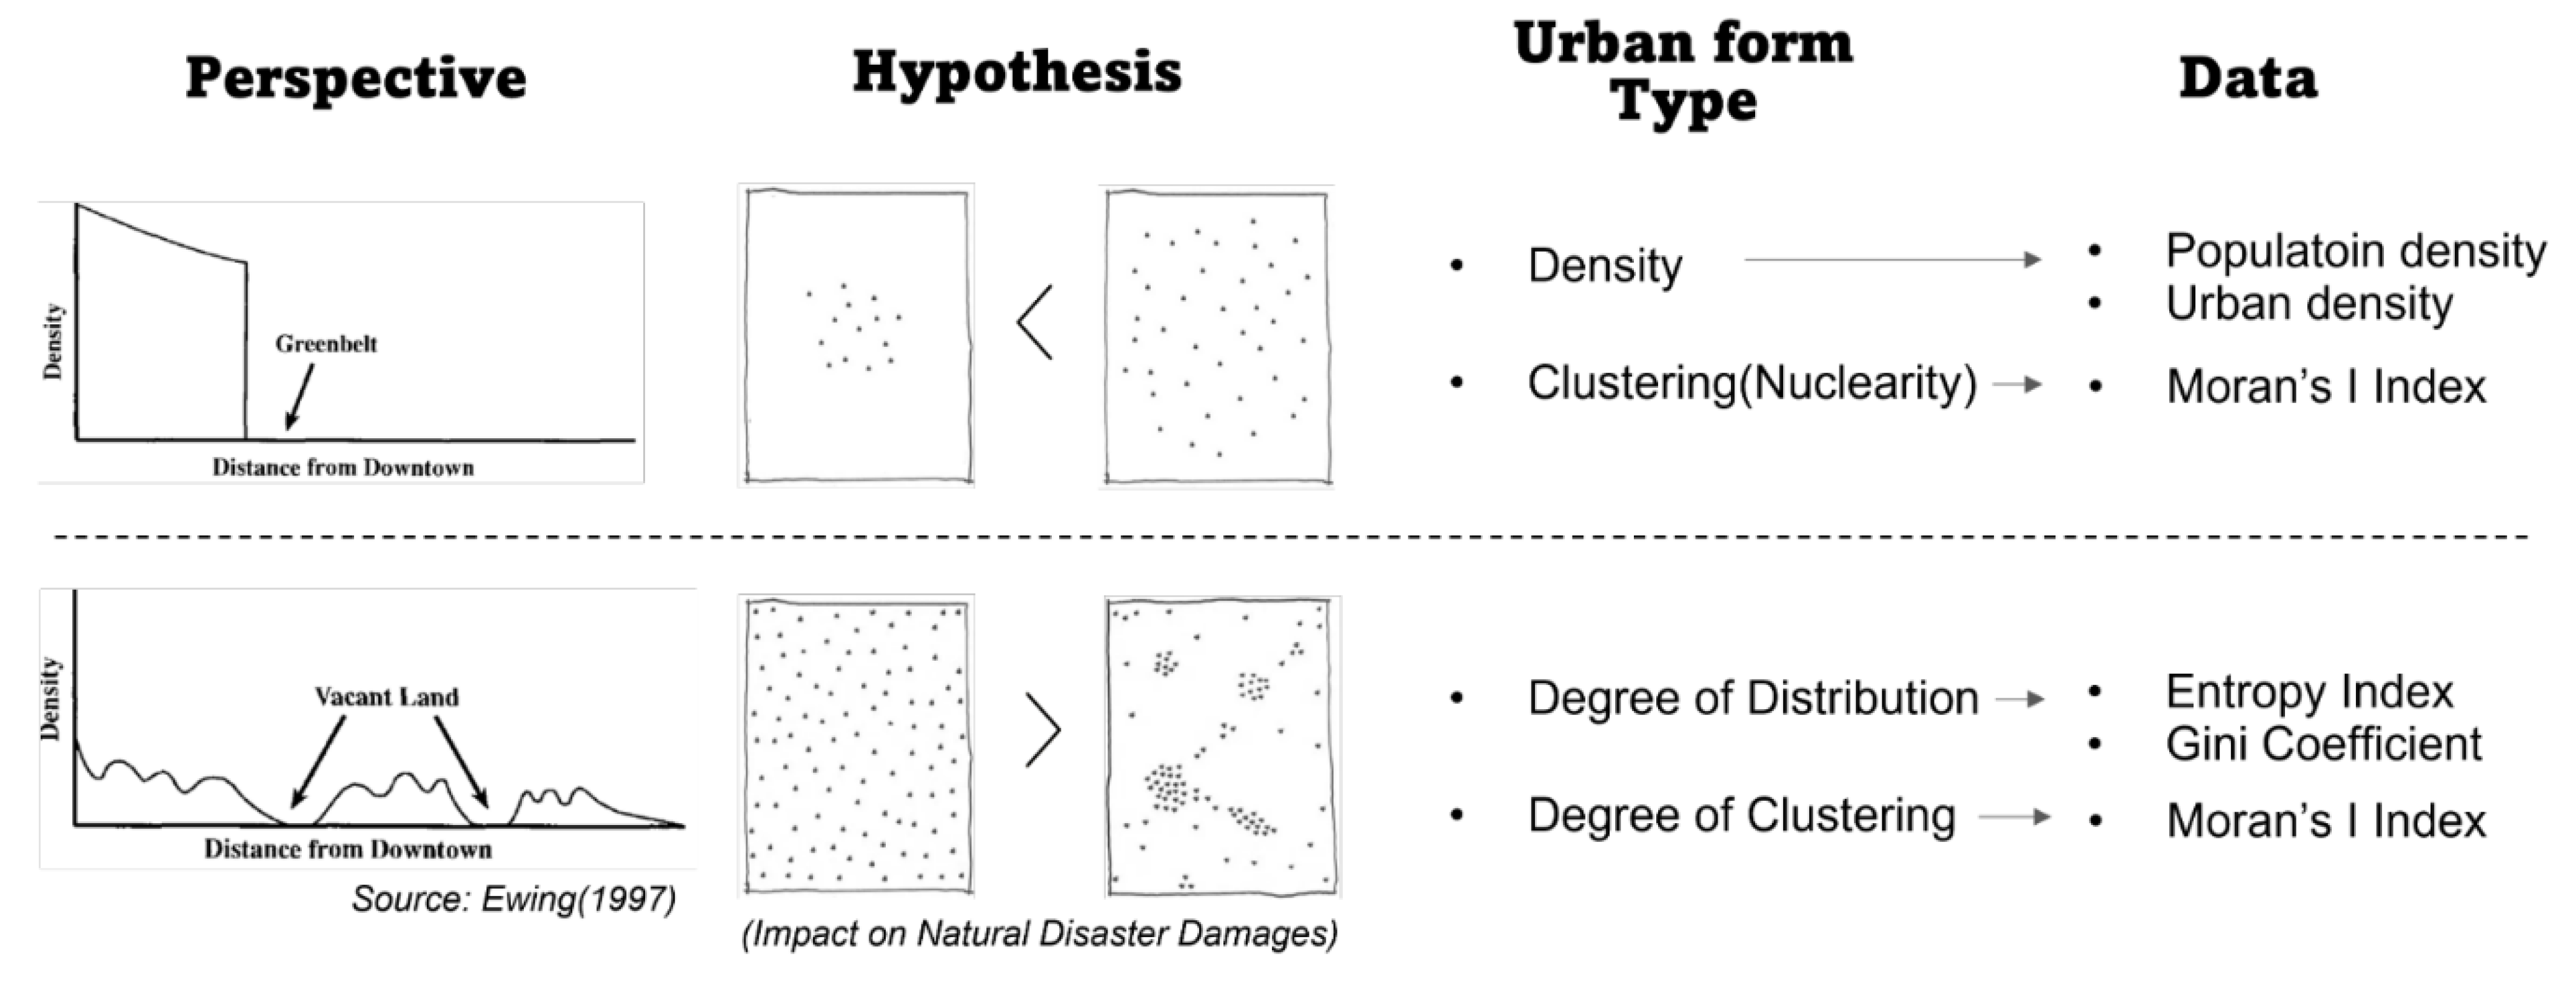
3.1. Research Rationale

Dual aspect concepts for urban forms and the fact that they can influence natural disaster damage by a series of mechanisms were confirmed through theoretical reviews and previous research. In the discussion of previous studies, this paper attempts to understand the impact of urban forms on flood damage by considering all the dual aspect concepts that urban forms have. The dual aspect concepts of the urban form presented in the literature review are represented by two view points, that one urban form may be vulnerable to flood damage or may be effective at reducing damage. Expanding the scope may show a variety of urban forms, but the compact and sprawling urban forms that have been discussed mainly in the field of urban planning are addressed. The relevant conceptual framework is shown in Figure 1.
[Perspective 1: The compact urban form is not effective at reducing flood damage]
Null Hypothesis 1.
The more compact cities are, the less the flood damage will be.
[Perspective 2: The compact urban form is effective at reducing flood damage]
Null Hypothesis 2.
Flood damage will increase as cities show undispersed patterns.
Null Hypothesis 3.
Flood damage will increase as cities show clustered patterns.
[Whether dual aspect concepts exist in urban forms for flood damage]
Null Hypothesis 4.
The aggregation of urban development will affect flood damage in one direction only.
If a compact urban form is simply interpreted as a high-density city, flood damage can be concentrated as a result of the aggregation effect of population or property. However, some studies have argued that flood damage can decrease in densely developed cities [7,8,9]. As such, the flood damage reduction effects of compact cities are contradictory. In other words, the impact of compactness on flood damage depends on how compactness is measured.
Meanwhile, Galster et al. [34] pointed out that the concept of sprawl is difficult and is interpreted differently in each study from the related literature, and introduced eight land-use patterns that can measure sprawl. This is a multidimensional urban scale that includes factors such as density, continuity, concentration, clustering, centrality, nuclearity, heterogeneity, and proximity. The scales related to flood damage were categorized and used for the literature review (Table 2). In addition, the population and area were focused on the properties of the city so as to measure the urban form.

3.1.1. City Size and Density

The size of a city is a quantitative indicator that distinguishes whether a city is a large city or a small city. Two widely used measures for city size are population and area [35]. There is a linear relationship between the population and the area, indicating that the density increases to a certain level as the area of the city increases [33,35]. On the other hand, the term urban density includes a multifaceted and broad urban attribute, and most studies on urban density are limited to demographic and human settlement attributes [36]. As a means to capture the various characteristics of urban forms and reflect the land cover mechanism, population and area were used as attributes representing urban density, as well as equally applied attributes of other urban form scales.

3.1.2. Degree of Distribution

Sprawled urban form has been frequently cited as a cause of flooding in several studies, and has been proven in many cities around the world [6,37,38,39,40,41]. In order to develop discussions on urban forms and flood damage, it is necessary to understand which characteristics of urban sprawl cause flood damage. The degree of distribution among the characteristics of sprawl is the main variable of the paper. Among the characteristics of urban sprawl suggested by Ewing [3], scattered development indicates how the land use is fragmented, and can be seen as a major urban form characteristic of sprawl. In addition, the literature discussion of how the more a city is fragmented with low density, the more dangerous areas can be included, provides the basis for using the degree of variance as a major variable representing the characteristics of urban forms for flood damage [7,8].
The degree of distribution is used as an index indicating that the population or urban area is unevenly distributed, which is in contrast with the strong centrality of compact cities presented by Ewing and Hamidi [4]. There are roughly 50 indicators that can measure the degree of distribution, but the most well-known of them is the Gini coefficient [42]. The Gini coefficient is applied to measure the inequality of population or employment distribution by a spatial unit in urban areas, and ranges from 0 to 1. Based on the population, if the Gini coefficient is calculated close to “0,” it means that the population of the city is very evenly distributed. Therefore, if a city has a sprawl-shaped spatial structure, the value of the Gini coefficient will be relatively low, and if the city has a compact structure, the value of the Gini coefficient will be relatively high [10]. In addition, Tsai [42] proposed a relative-entropy index along with the Gini coefficient as an indicator of urban distribution. As the entropy index is not affected by the number of subspace units, size, shape, etc., it is suitable for comparing the sprawl–compactness of the spatial unit [10,43]. The values range from 0 to 1, and the closer the value is to 0, the more the structure is sprawled, and the closer it is to 1, the more the structure is compact.

3.1.3. Degree of Clustering
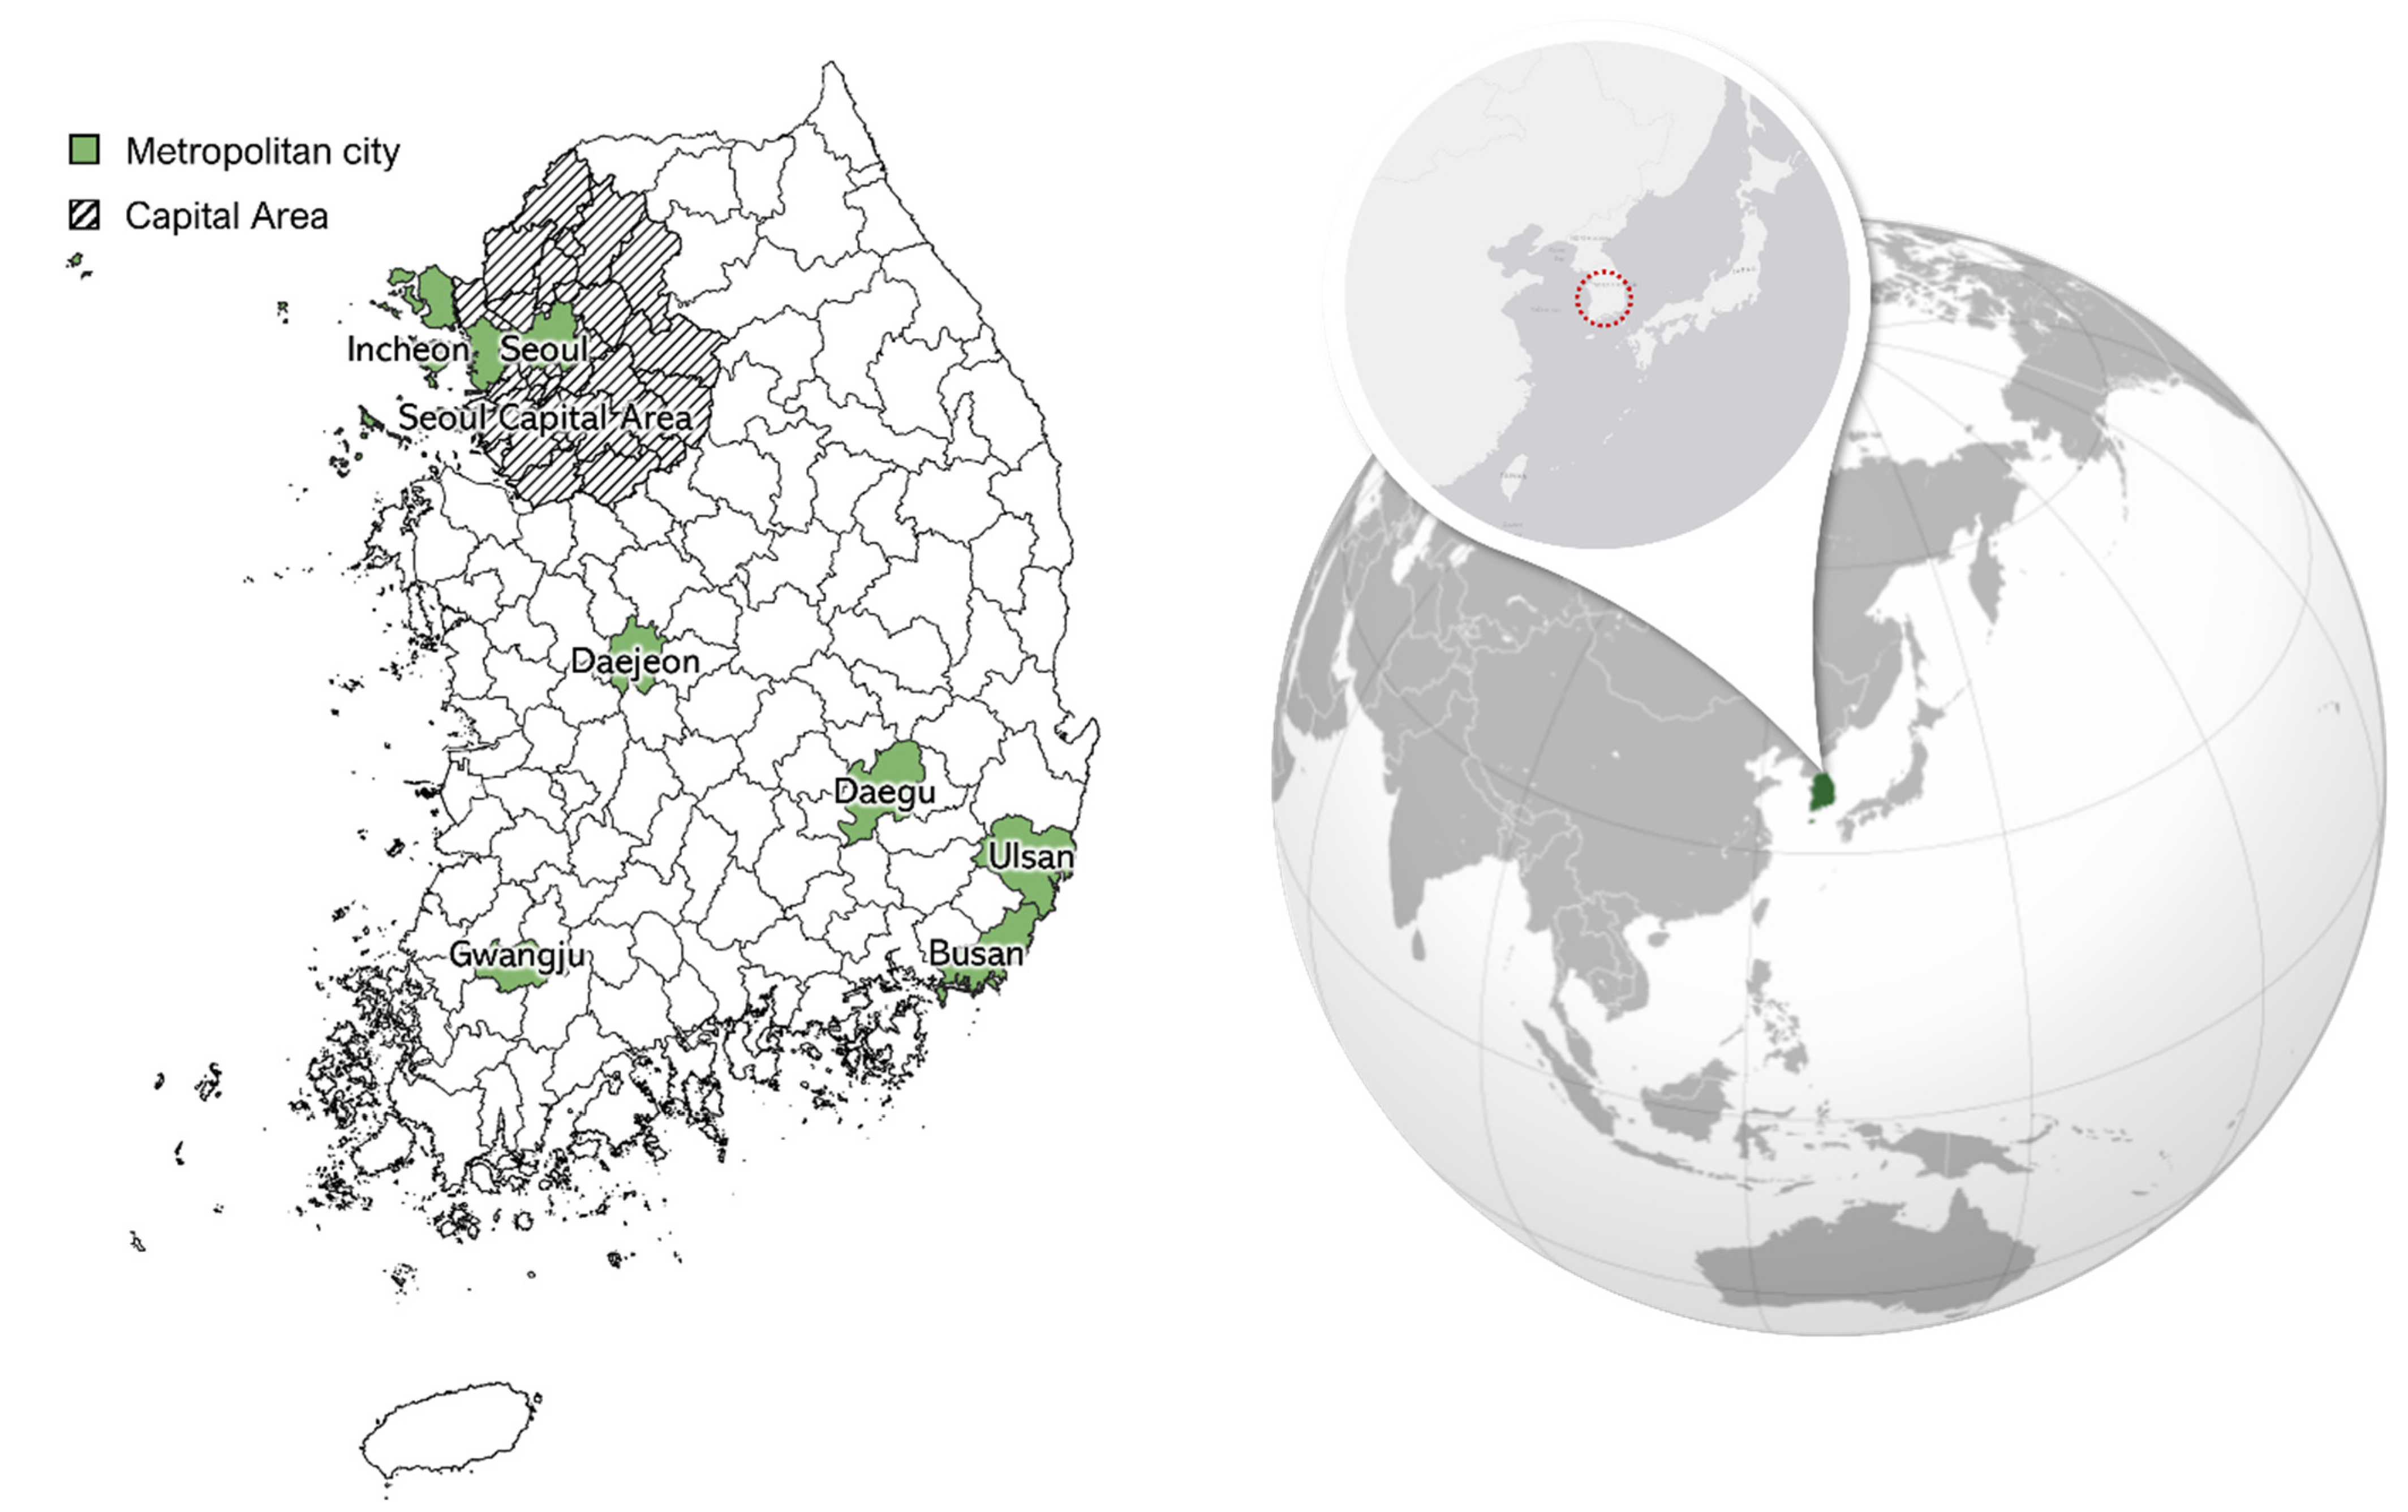
Ewing [3] argued that Gordon and Richardson [2] had identified of “compact development” as high-density or monocentric development, which includes concentration of employment or clustering of residential areas. In this way, the degree of clustering can be used as a measure of urban form indicating compactness, and, by using a clustering scale such as poly-centricity or mono-centrictiy, researchers can better understand the dispersion of population or infrastructure in a space [33]. Theoretically, the level of clustering can be estimated through the global Moran’s I coefficient, which measures spatial autocorrelation, and it is possible to identify, to some extent, whether the city has a mononuclear structure or a multinuclear structure [10,42].
The impact of the degree of clustering on flood damage can be explained by the land cover mechanism. The compact form of development can more effectively avoid vulnerable areas and focus development on the most suitable land that can avoid the threat of disaster [6], such that the compact form of development is not a simple high-density characteristic. That is, theoretically, the flood damage can be reduced as the development area is clustered. In this regard, Brody et al. [7] showed a result that more clustered and denser development patterns reduce property damage caused by floods through empirical analysis.

3.2. Study Area

The case area is South Korea (Figure 2). In order to measure the degree of distribution and clustering of the population and development area, cities and counties (9 metropolitan cities, self-governing provinces, and 151 cities and counties) were set as analysis units, excluding island areas that are not large enough to reveal the distribution and clustering. As cities and counties are the administrative districts of South Korea, the basic unit of regional jurisdiction, and the main body of the urban comprehensive plan, the impact of the urban form index based on land use is considered to be best revealed.
South Korea is a country that has experienced rapid growth that is hard to find in the world. Because of its narrow territory, overpopulation continues, and urbanization has also progressed rapidly due to rapid economic growth. As a result of these characteristics, it is highly likely that Korean cities have different urban morphological characteristics from cities in other highly-developed countries, such as the United States. In particular, metropolitan areas, such as the Seoul metropolitan area, show very high population density and urbanization rates, whereas small- and medium-sized cities are experiencing rapid population decline, and economic growth and urbanization rates are also showing a large gap from those of large cities [44]. As a way to understand in detail the impact of urban forms on flood damage, cities with various morphological characteristics must exist within the case area, and South Korea is highly likely to show morphological differences between cities, so it was selected as the case area.

3.3. Method and Data

Table 3 shows the data list. The dependent variable is the amount of flood damage, and the independent variables are the urban form indices. First, for the dependent variable, the amount of flood damage from the statistical yearbook of natural hazards provided by the Ministry of the Interior and Safety were used. Flooding is the most common disaster in Korea, and, as damage has occurred in most regions of Korea, the data contain the least statistical error when compared with the other natural hazards. The latest decade (2010–2019) of data were collected based on the year of the latest statistical yearbook of natural hazards, so as to minimize missing values in the data. The independent variables were constructed according to the types of urban forms, and data were constructed in the same range (2010–2019) as the dependent variables. Population density, area, urban area, and urban density data were collected for urban size and density types, and the entropy index and Gini coefficients were collected for the degree of distribution type. Finally, for the degree of clustering type, global Moran’s I index was collected. Calculations for urban form indices, such as the entropy index, Gini coefficients, and global Moran’s I index, are shown in Table 4. In addition, control variables related to flood damage were added, such as the average per capita tax amount and precipitation, so as to determine the impact of urban forms on flood damage.
The spatial regression model was used as a methodology for the statistical hypothesis verification. When estimating a model containing variables with spatial autocorrelation using an ordinary least squares (OLS) regression model, the model violates the assumptions to which the OLS regression model must adhere, and the spatial autocorrelation of errors becomes severe. Therefore, if spatial autocorrelation exists in the variables to be input into the analysis, the spatial regression model should be used. The spatial regression model is largely divided into the spatial lag model and the spatial error models. If spatial autocorrelation exists in the dependent variable, an error occurs in which the parameter estimate of the OLS regression model is biased. To solve this problem, the influence on the dependent variable must be converted into a variable and be inserted into the regression model as an explanatory variable [45], which is called a spatial lag model. On the other hand, when the error has spatial autocorrelation, the covariance of the prediction error is not independent when estimating in the OLS regression model, resulting in a large covariance. In this case, an error covariance to control the spatial autocorrelation that exists between errors must be created and considered in the regression model, which is called the spatial error model [46]. In the case of the model, the possibility of the existence of spatial autocorrelation for the amount of flood damage, which is a dependent variable, was confirmed in previous studies [47,48]. There is a high possibility that spatial autocorrelation exists in error, because the spatial units where flood damage are aggregated and the extent to which flood damage are actually occurring do not exactly match. Thus, it is theoretically applicable for both types of spatial regression models. Therefore, the model that proved to be more suitable was used, by grasping the fit of the spatial regression model through a robust Lagrange multiplier test.

4. Results

4.1. Exploring the Spatial Characteristics of Variables and Model Suitability

Some necessary statistical tests were conducted before performing spatial regression analysis. First, Moran’s I statistic was verified by searching for spatial autocorrelation of the dependent variable. Through Moran’s I test, it was confirmed that there is spatial autocorrelation in the amount of flood damage, which is the dependent variable, with a Moran’s I value of 0.24 (p < 0.01). Next, four tests were conducted for normality and spatial heterogeneity (Table 5). As a result of the Jarque−Bera test, it was confirmed that the error term of the analysis model did not follow the normal distribution. In addition, as a result of the Breusch−Pagan, Koenker−Bassett, and White tests, it was confirmed that there was a heteroskedasticity. These test results mean that the model should be analyzed using a spatial model rather than an OLS (ordinary least squares) model. In addition, the log likelihood value increased in the order of the OLS model, SLM (Spatial Lag Model), and SEM (spatial error model), meanwhile the AIC (Akaike Information Criterion) and SC (Schwartz information Criterion) values decreased (Table 6). With these results, SEM showed a relatively high coefficient of determination ( R 2 ), which means SEM was best fit to the model.

4.2. Analysis Results

Table 6 shows the results of the spatial regression analysis. The research results are intended to be interpreted according to the type of variable and the set hypothesis. The type of size and density was constructed to express the view that the compact urban form would not be effective at reducing flood damage (Null Hypothesis 1). In this type, all variables except the urban area were found to have a significant effect on the amount of flood damage. First, the impact of the urban development area can be seen as a result of proving the land-covered mechanism that impermeable surfaces increase the flood damage. The next thing to note in terms of size and density type is that population and urban development density affected flood damage in different directions. Population density was found to have a positive effect, while urban development density was found to have negative effect on the amount of flood damage. From these results, it can be interpreted that the aggregation effect of the population increases flood damage, while the aggregation of developed land reduces flood damage. This is the same as the results of previous studies, in which high-density development was found to reduce flood damage [7,8,9].
The distribution and clustering types were set to show the view that the compact urban form is effective at reducing flood damage. The distribution type consists of the variables associated with Null Hypothesis 2, and the clustering type consists of the variables associated with Null Hypothesis 3. The entropy index showed a statistically significant effect on flood damage in terms of the distribution and clustering type. Unlike other urban form indices, the reason the entropy index appears to have a significant effect seems to be because it is relatively unaffected by the number, size, and shape of subspace units. The entropy index was found to have a negative effect on the amount of flood damage. As a lower entropy index means that the city has a sprawled urban form, it can be interpreted that the amount of flood damage increases as the city sprawls. Considering the results of entropy index with the urban development density, it can support the discussion of previous studies that the more developed land is aggregated, the less exposure it has to natural hazard risks, thereby reducing damage. In other words, in terms of land cover, an aggregated urban form can reduce flood damage. However, the aggregation of developed land means the aggregation of the population. As the result of the analysis of Hypothesis 1 showed that population aggregation increased flood damage, it can be confirmed that the “aggregation” represented by the high-density urban form has a dual aspect concept for damage from urban floods.
Self-sufficiency and precipitation, which are dependent variables, were shown to have significant effects. In detail, it was found that the lower the average per capita tax amount, the higher the amount of flood damage. This means that the lower the city’s financial self-sufficiency, the less well-allocated the budget for disaster prevention facilities or disaster mitigation policies, resulting in a relative increase in flood damage. Precipitation was shown to have positive effect as it is the main natural cause of flood damage.
Four hypotheses were established according to the effect of the compact urban form on flood damage reduction. First of all, Null Hypothesis 1( H 0 ), related to urban density, cannot be rejected, and accordingly, the alternative hypothesis, that high-density development will increase flood damage, cannot be accepted. This is because the effect of population density supports the rejection of Hypothesis 1, but the effect on urban development density does not. In other words, flood damage is more related to the area of urban development rather than population. Next, Null Hypothesis 2( H 0 ), related to the degree of distribution, is rejected due to the result of the entropy index. Accordingly, it seems that it is possible to accept the alternative hypothesis that the compact city shows less flood damage. On the other hand, Null Hypothesis 3( H 0 ), related to the degree of clustering, cannot be rejected, as s Moran’s I index did not a show statistically significant effect. Finally, Null Hypothesis 4( H 0 ) is rejected and an alternative hypothesis can be adopted. This is because, in terms of population, the high-density urban form increases the flood damage, but in terms of land cover, it reduces the flood damage.
In summary, perspective 1 (the compact urban form has no effect on reducing flood damage) cannot reject the related Null Hypothesis, so it can be interpreted that compact urban forms in terms of density reduce flood damage. Perspective 2 (the compact urban form is effective in reducing flood damage) can reject the Null Hypothesis 2, so it can be interpreted that the compact urban form is also effective at reducing flood damage when viewed in terms of distribution. However, this is true for the compact urban form in terms of land cover, while in terms of population, it shows the opposite consequences, and the compact urban form is not fully effective at reducing flood damage.

4.3. Spatial Interpretation of Analysis Results

For the purpose of understanding the impact of urban forms on flood damage from various aspects, the paper analyzed the impact of urban forms on flood damage in terms of various perspectives. In this case, all cities were interpreted identically according to one equation. However, in the case of the global estimation, there are many cases where the relationship between variables or spatial association is not applied equally to all regions [46], and actual cities are likely to have different morphological characteristics. Therefore, additional analyses considering the morphological characteristics of each city are needed.
Among the results derived from spatial regression analysis, the effect of urban development density (Perspective 1) and the entropy index (Perspective 2) is noticeable. Figure 3 is a bubble chart for the entropy index, urban development density, and flood damage. The x-axis is the urban development density, the y-axis is the entropy index, and the bubble is the flood damage of each city. The larger the value of the flood damage, the more reddish and larger. Looking at the bubble chart, it is confirmed that the smaller the urban development density and entropy index, the more the bubbles with high flood damage. However, when looking at Figure 3, there are two cities that do not coincide with the results of the spatial regression. The two cities, Seoul and Busan, have a compact urban structure according to the entropy index, and have a high urban density. According to the regression equation, flood damage should increase as cities have a sprawled structure and a lower urban density, but, in the bubble chart, the two cities are positioned as outliers. Seoul and Busan, which appear as outliers, are the first and second largest cities in South Korea, and are characterized by very high population density.
Figure 4 shows a cartogram map for the entropy index and urban density (left), as well as a map that divides flood damage values into five classes through GIS Natural Breaks Classification (right). In the cartogram map, the size of the circle is the entropy index (the higher the value, the greater the size), and the color indicates the urban density (the higher the value, the more reddish the color). On the cartogram map, outliers (red circle) for the entropy index and city density can be identified. Seoul Metropolitan City and the surrounding metropolitan area, which is an outlier in the bubble chart, form a cluster of outliers.
Compared with the flood damage distribution map, in terms of the entropy index, the area with a small circle size (low entropy index which means sprawled urban form) has a generally high amount of flood damage. However, outliers different from the regression equation are clustered when the results are interpreted in terms of density. According to the regression equation, as the color of the circle becomes red (high density city), the amount of flood damage decreases. In particular, the metropolitan area clusters identified on the cartogram map show a high flood damage, similar to that of the Seoul Metropolitan City. In summary, the global-level estimates performed were not applied equally to all regions, and there were different outliers from the regression equation in Seoul Metropolitan Areas and Busan. As South Korea experienced rapid economic growth within a narrow area, the density of cities became abnormally high. In particular, in the case of large cities, the population density and urbanization rate are relatively very high. It is believed that the outliers appeared because of this high density. In order to understand the detailed reasons for these outliers, it is necessary to understand the context and characteristics of each city. This is beyond the scope and will be discussed in later research.

5. Conclusions and Discussions

Recently, a macro-level urban form approach has been discussed to solve various urban problems. Discovering a sustainable urban form to solve urban problems will be an important concern for researchers in urban planning. Urban form cannot be defined simply, and several factors must be included to express one urban form. The complexity of urban forms can often be confusing to researchers when analyzing the impact of urban forms, which can be seen on flood damage. In other words, a “dual aspect concept” that can increase or decrease flood damage in one urban form can appear, and this seems to be caused by different perspectives on the urban form.
For discussion, the fact that the compact urban form is a form that can aggravate or reduce flood damage is presented through the related literature, and it has been empirically analyzed regarding whether the compact urban form is effective at reducing flood damage through various urban form indices. The analysis results, using spatial regression models, bubble charts, and cartograms, are summarized as follows. First, it was expected that the high density, classified in terms of density of urban development during the hypothesis-setting process, would increase flood damage, but instead, high density was found to have an effect on the reduction of flood damage. Second, it was found that compact urban forms classified according to the degree of distribution or clustering of urban development had an effect on the reduction of damage caused by floods. However, when the degree of clustering of urban development was measured by Moran’s I, the effect of the compact urban form on flood damage reduction was not statistically significant. This is interpreted as a problem that appeared because it contains outliers with a very high population density, such as Seoul and Busan, as can be seen from the results of the bubble chart and cartogram analysis. Third, the fact that the characteristics of high density in terms of population increases flood damage confirmed that the compact urban form could increase or decrease flood damage. These results mean that the urban form of “dual aspect concept” discussed in this paper actually appears in flood damage. Therefore, researchers should be aware that the analysis results may appear in several directions rather than one direction when analyzing the impact of urban forms on flood damage.
This suggests that various aspects need to be considered when analyzing the relationship between urban form and flood damage. In other words, more diverse approaches about the relationship between urban form and flood damage should be considered. In addition, in Hypothesis 3, the fact that the compact urban forms measured by Moran’s I did not have a statistically significant effect, unlike the entropy index, suggests that it is also important to define the urban form in more detail beyond density, distribution, and clustering. In particular, when analyzing using bubble charts and cartograms, it was found that the result values may be distorted due to the outliers in Seoul and Busan, so it is necessary to review the indicators to define a compact urban form that reflects the context and characteristics of each city.
Based on the results of the empirical analysis, the implications and policy suggestions are as follows. As the compact urban form in terms of land cover affects the reduction of flood damage, if disaster prevention measures related to land cover are implemented, the effect of reducing flood damage, along with the aggregation of developing land, can be added. In other words, active application of green infrastructure and low-impact development techniques that can improve the water circulation of the city while pursuing compact urban forms is needed [49]. Especially in South Korea, the institutional foundations for the application of green infrastructure and low-impact development techniques are not sufficient. So, it is necessary to provide an institutional foundation such as zoning and planning regulation through local government incentives to improve urban water circulation [50].
The results suggest that various aspects of urban forms should be considered, reflecting the context and characteristics of each city. Accordingly, it is necessary to re-discuss the impact on urban problems such as the environment, energy, transportation, and new infectious diseases by using various urban form indicators that reflect the characteristics of each city. For example, in the era of the new infectious disease after COVID-19, the discussion of sustainable urban form has only been conducted in terms of density. However, as mentioned in the theoretical discussion related to urban forms, dual aspect concepts exist in urban forms, and if urban forms are classified only in terms of density, there is a possibility that the analysis results will be distorted. Therefore, it is necessary to continuously discuss the future sustainable urban forms using the urban form index and considering various characteristics.
The paper differs from previous studies on the following points. First, urban form indices such as density, variance, and clusters are utilized in terms of population and land cover to explore the dual aspect concepts of urban form for flood damage. Second, it was suggested that the characteristics of each city should be reflected when analyzing the relationship between urban forms and flood damage. However, there are limitations that require additional research on the characteristics of urban forms. In future research, it is necessary to conduct additional research that can present a sustainable urban form through urban form classification and empirical analysis that considers the context and characteristics of each city, along with more diverse aspects, as well as the population and land cover aspects.

Author Contributions

Conceptualization, S.K., J.Y. and J.J.; methodology, S.K.; formal analysis, S.K.; investigation, J.Y.; writing—original draft preparation, S.K.; writing—review and editing, J.Y. and J.J.; visualization, S.K.; supervision, J.J. All authors have read and agreed to the published version of the manuscript.

Funding

This research was supported by the Prime Cooperative Laboratory Program funded by Korea Maritime Institute. This work is financially supported by Korea Ministry of Land, Infrastructure and Transport(MOLIT) as 「Innovative Talent Education Program for Smart City」.

Institutional Review Board Statement

Not applicable.

Informed Consent Statement

Not applicable.

Conflicts of Interest

The authors declare no conflict of interest.

References

  1. OECD. Cites in the World: A New Perspective on Urbanization; OECD Urban Studies: Paris, France, 2020; pp. 1–171. [Google Scholar]
  2. Gordon, P.; Richardson, H.W. Are Compact Cities a Desirable Planning Goal? J. Am. Plan. Assoc. 1997, 63, 95–106. [Google Scholar] [CrossRef]
  3. Ewing, R. Is Los Angeles-Style Sprawl Desirable? J. Am. Plan. Assoc. 1997, 63, 107–126. [Google Scholar] [CrossRef]
  4. Ewing, R.; Hamidi, S. Compactness versus sprawl: A review of recent evidence from the United States. J. Plan. Lit. 2015, 30, 413–432. [Google Scholar] [CrossRef]
  5. Federal Emergency Management Agency (FEMA). The Natural Beneficial Functions of Floodplains: Reducing Flood Losses by Protecting and Restoring the Floodplain Environment; FEMA Report no. 409; FEMA: Washington, DC, USA, 2002.
  6. Berke, P.R.; Song, Y.; Stevens, M. Integrating Hazard Mitigation into New Urban and Conventional Developments. J. Plan. Educ. Res. 2009, 28, 441–455. [Google Scholar] [CrossRef]
  7. Brody, S.D.; Gunn, J.; Peacock, W.; Highfield, W.E. Examining the Influence of Development Patterns on Flood Damages along the Gulf of Mexico. J. Plan. Educ. Res. 2011, 31, 438–448. [Google Scholar] [CrossRef]
  8. Brody, S.; Kim, H.; Gunn, J. Examining the Impacts of Development Patterns on Flooding on the Gulf of Mexico Coast. Urban Stud. 2012, 50, 789–806. [Google Scholar] [CrossRef]
  9. Xu, C.; Rahman, M.; Haase, D.; Wu, Y.; Su, M.; Pauleit, S. Surface runoff in urban areas: The role of residential cover and urban growth form. J. Clean. Prod. 2020, 262, 121421. [Google Scholar] [CrossRef]
  10. Im, E.S.; Lee, J.Y.; Lee, H.Y. Measurement of Urban Form in Urban Growth Management: Urban Sprawl versus Compactness. Korea Spat. Plan. Rev. 2006, 51, 223–247. [Google Scholar]
  11. Jang, C.H.; Song, J.M. Do High-Density Cities Have Better Proximity?: Global Comparative Study on Urban Compactness Using Nighttime Light Data and POI BIG Data. J. Korea Plan. Assoc. 2020, 54, 148–158. [Google Scholar] [CrossRef]
  12. Lee, S.-C. Exploring Compatibility of Density and Safety: An Inquiry on Spatial Planning Shift in COVID-19 Era. J. Korea Plan. Assoc. 2020, 55, 134–150. [Google Scholar] [CrossRef]
  13. Garcia, D.; Riera, P. Expansion versus Density in Barcelona: A Valuation Exercise. Urban Stud. 2003, 40, 1925–1936. [Google Scholar] [CrossRef]
  14. OECD. Compact City Policies: A Comparative Assessment; OECD Green Growth Studies: Paris, France, 2012; pp. 1–287. [Google Scholar]
  15. Kotharkar, R.; Bahadure, P.; Sarda, N. Measuring Compact Urban Form: A Case of Nagpur City, India. Sustainability 2014, 6, 4246–4272. [Google Scholar] [CrossRef] [Green Version]
  16. Ewing, R.H. Characteristics, Causes, and Effects of Sprawl: A Literature Review. Urban Ecol. 2008, 21, 519–535. [Google Scholar] [CrossRef]
  17. Hamidi, S.; Sabouri, S.; Ewing, R. Does Density Aggravate the COVID-19 Pandemic? Early Findings and Lessons for Planners. J. Am. Plan. Assoc. 2020, 86, 495–509. [Google Scholar] [CrossRef]
  18. Dye, C. Health and Urban Living. Science 2008, 319, 766–769. [Google Scholar] [CrossRef]
  19. Glaeser, E. Cities, Productivity, and Quality of Life. Science 2011, 333, 592–594. [Google Scholar] [CrossRef] [PubMed]
  20. Yeom, J.; Kang, S.; Ha, D.; Jung, J. The Impact of Urban Form on the Spread of Infectious Diseases: Focusing on COVID-19 Outbreak in the Seoul Metropolitan Area. J. Environ. Policy Adm. 2020, 28, 73–95. [Google Scholar] [CrossRef]
  21. Yang, J.; Song, H.; Kang, K.; Gwon, M.; Shin, H.-S. Metropolitan Sprawl Measures Using Multi-Facility Accessibility: A Case Study of Gwangju Metropolitan Area. J. Korean Urban Geogr. Soc. 2008, 21, 77–91. [Google Scholar] [CrossRef]
  22. Creutzig, F.; Lohrey, S.; Bai, X.; Baklanov, A.; Dawson, R.; Dhakal, S.; Lamb, W.F.; McPhearson, T.; Minx, J.C.; Munoz, E.; et al. Upscaling urban data science for global climate solutions. Glob. Sustain. 2019, 2, 1–25. [Google Scholar] [CrossRef]
  23. Gleeson, B. Critical commentary. The urban age: Paradox and prospect. Urban Stud. 2012, 49, 931–943. [Google Scholar] [CrossRef]
  24. Intergovernmental Panel on Climate Change. Managing the Risks of Extreme Events and Disasters to Advance Climate Change Adaptation: Special Report of the Intergovernmental Panel on Climate Change; Cambridge University Press: New York, NY, USA, 2012. [Google Scholar]
  25. Intergovernmental Panel on Climate Change. Climate Change 2014: Mitigation of Climate Change; Cambridge University Press: New York, NY, USA, 2015; Volume 3. [Google Scholar]
  26. Lundgren, L.W. Environmental Geology; Prentice Hall, Inc.: Upper Saddle River, NJ, USA, 1999. [Google Scholar]
  27. Armson, D.; Stringer, P.; Ennos, A. The effect of street trees and amenity grass on urban surface water runoff in Manchester, UK. Urban For. Urban Green. 2013, 12, 282–286. [Google Scholar] [CrossRef]
  28. Rahman, M.A.; Moser, A.; Anderson, M.; Zhang, C.; Rötzer, T.; Pauleit, S. Comparing the infiltration potentials of soils beneath the canopies of two contrasting urban tree species. Urban For. Urban Green. 2019, 38, 22–32. [Google Scholar] [CrossRef]
  29. Schoener, G. Urban Runoff in the U.S. Southwest: Importance of Impervious Surfaces for Small-Storm Hydrology. J. Hydrol. Eng. 2018, 23, 05017033. [Google Scholar] [CrossRef]
  30. Brody, S.D.; Highfield, W.E.; Blessing, R.; Makino, T.; Shepard, C.C. Evaluating the effects of open space configurations in reducing flood damage along the Gulf of Mexico coast. Landsc. Urban Plan. 2017, 167, 225–231. [Google Scholar] [CrossRef]
  31. Kang, S.; Lee, D.; Jung, J. The Impact of Urban Development Patterns on Natural Disaster Damages. J. Environ. Policy Adm. 2019, 27, 189–210. [Google Scholar] [CrossRef]
  32. Irajifar, L.; Sipe, N.; Alizadeh, T. The impact of urban form on disaster resiliency: A case study of Brisbane and Ipswich, Australia. Int. J. Disaster Resil. Built Environ. 2016, 7, 259–275. [Google Scholar] [CrossRef]
  33. Sharifi, A. Resilient urban forms: A macro-scale analysis. Cities 2019, 85, 1–14. [Google Scholar] [CrossRef]
  34. Galster, G.; Hanson, R.; Ratcliffe, M.R.; Wolman, H.; Coleman, S.; Freihage, J. Wrestling Sprawl to the Ground: Defining and measuring an elusive concept. Hous. Policy Debate 2001, 12, 681–717. [Google Scholar] [CrossRef]
  35. Louf, R.; Barthelemy, M. How congestion shapes cities: From mobility patterns to scaling. Sci. Rep. 2015, 4, 5561. [Google Scholar] [CrossRef] [PubMed]
  36. Roberts, B.H. Changes in urban density: Its implications on the sustainable development of Australian cities. In Proceedings of the State of Australian Cities National Conference, Adelaide, Australia, 28–30 November 2007; pp. 720–739. [Google Scholar]
  37. Barros, M.T.L.; Brandão, J.L.B.; Silva, O.F.; Ono, S. The Impact of Urban Sprawl on Flood Risk Areas. Manag. Watersheds Hum. Nat. Impacts 2005, 1–12. [Google Scholar] [CrossRef]
  38. Mbow, C.; Diop, A.; Diaw, A.T.; Niang, C.I. Urban sprawl development and flooding at Yeumbeul suburb (Dakar-Senegal). Afr. J. Environ. Sci. Technol. 2008, 2, 075–088. [Google Scholar]
  39. Franci, F.; Mandanici, E.; Bitelli, G. Remote sensing analysis for flood risk management in urban sprawl contexts. Geomat. Nat. Hazards Risk 2014, 6, 583–599. [Google Scholar] [CrossRef]
  40. Faccini, F.; Luino, F.; Paliaga, G.; Sacchini, A.; Turconi, L.; de Jong, C. Role of rainfall intensity and urban sprawl in the 2014 flash flood in Genoa City, Bisagno catchment (Liguria, Italy). Appl. Geogr. 2018, 98, 224–241. [Google Scholar] [CrossRef]
  41. Devi, N.N.; Sridharan, B.; Kuiry, S.N. Impact of urban sprawl on future flooding in Chennai city, India. J. Hydrol. 2019, 574, 486–496. [Google Scholar] [CrossRef]
  42. Tsai, Y.-H. Quantifying Urban Form: Compactness versus ‘Sprawl’. Urban Stud. 2005, 42, 141–161. [Google Scholar] [CrossRef]
  43. Smith, D.M. Patterns in Human Geography; David and Charles: Newton Abbot, UK, 1975. [Google Scholar]
  44. Ha, S.K. Future tasks and challenges of urban planning and urban policy. J. Environ. Stud. 2013, 52, 19–26. [Google Scholar]
  45. Anselin, L. Spatial Econometrics: Methods and Models; Kluwer Academic Publishers: Boston, MA, USA, 1988. [Google Scholar]
  46. Lee, H.Y.; Shim, J.H. GIS Geographical Information; Bubmunsa: Seoul, Korea, 2011. [Google Scholar]
  47. Yoon, D.; Kang, J.E.; Brody, S.D. A measurement of community disaster resilience in Korea. J. Environ. Plan. Manag. 2015, 59, 436–460. [Google Scholar] [CrossRef]
  48. Jeong, S.; Yoon, D.K. Examining Vulnerability Factors to Natural Disasters with a Spatial Autoregressive Model: The Case of South Korea. Sustainability 2018, 10, 1651. [Google Scholar] [CrossRef] [Green Version]
  49. Kang, J.E.; Lee, M.J.; Koo, Y.S.; Cho, Y.H. Development and Application of Green Infrastructure Planning Framework for Improving Urban Water Cycle: Focused on Yeonje-Gu and Nam-Gu in Busan. J. Environ. Policy Adm. 2014, 13, 43–73. [Google Scholar]
  50. Kim, Y.G.; Son, Y.H. Study on the Green Infrastructure Application with Planning System—Focused on Green Infrastructure Planning and Policy in the UK. J. Korea Plan. Assoc. 2012, 47, 69–86. [Google Scholar]
Figure 1. Conceptual framework of research.
Sustainability 13 09007 g001
Figure 2. Case area map.
Sustainability 13 09007 g002
Figure 3. Bubble chart.
Sustainability 13 09007 g003
Figure 4. Cartogram map and flood damage distribution map.
Sustainability 13 09007 g004
Table 1. City population and area growth in % for 1975–2015 (Sources from OECD, 2020).
Towns Growing into CitiesCity ExpansionCity DensificationTotal
Population change (%)
1975–199023.926.449.7100
1990–200018.329.352.4100
2000–201515.524.859.7100
Area change (%)
1975–199030.569.50.0100
1990–200022.877.20.0100
2000–201522.677.40.0100
Table 2. Land use patterns used in this study.
Data TypeLand Use Pattern of Galster et al. (2001)
City size and densityDensity
Degree of distributionCentrality and concentration
Degree of clusteringClustering and nuclearity
Table 3. Descriptive statistics for variables.
Data TypeVariablesMeanSDMinMax
Flood damageFlood damage746,736.41,382,617947.410,705,164
Size and DensityPopulation Density1063.4232485.48519.7608816,573.99
Area661,606,281.1358,619,789.733,292,0512,050,269,165
Urban Area110,090,932.9156,279,894.13,710,000941,729,711.6
Urban Density0.2488580.3146190.005331
DistributionEntropy Index0.0953510.1221450.0105521.056198
Gini Index0.6103050.1575310.2459340.871855
ClusteringMoran’s I index0.0789610.114103−0.130540.984742
Self-sufficiencyTax Burden16,434.7844,986.54367.395196,483.3
PrecipitationPrecipitation1291.857134.149990.23281817.393
Table 4. Formulae of urban form indices.
Data Formula
Entropy Index E n t r o p y = ln n i = 1 n P i ln ( 1 / P i )
where P i   is the population ratio of sub-area of I jurisdiction
Gini Coefficient G i n i = 0.5   i = 1 n | X i Y i |
where N is the number of sub-areas; X i   is the proportion of land area in sub-area i; and Y i   is the proportion of population or employment in sub-area i
Global Moran’s I index M o r a n s   I = N i = 1 n j = 1 n W i j ( X i X ¯ ) ( X j X ¯ ) i = 1 n j = 1 n [ W i j i = 1 n ( ( X i X ¯ ) 2 ]
where N is the number of sub-areas; W i j   is the weight of I, j sub-area;
X i   is the population of I sub-area; X j is the population of j sub-area;
X   ¯ is average population
Table 5. Pre-test for analysis.
Error Type TestValue & Prob
NormalityJarque−Bera test568.62 ***
HeteroskedasticityBreusch−Pagan test249.84 ***
Koenker−Bassett test49.64 ***
White test94.05 ***
Spatial
Autocorrelation
Moran’s I (error) 6.61 ***
Lagrange Multiplier (lag)31.21 ***
Robust LM (lag) 0.325
Lagrange Multiplier (error)33.82 ***
Robust LM (error)2.94 *
* p < 0.1. *** p < 0.001.
Table 6. Analysis results.
Data TypeVariablesOLSSLMSEM
Size & DensityPopulation Density146.712 **149.961 **130.922 **
Area−0.00023−0.00016−0.0003
Urban Area0.0044 ***0.0044 ***0.0046 ***
Urban Density−1.99 × 10⁶ **−2.16 × 10⁶ ***−2.24 × 10⁶ ***
DistributionEntropy Index−1.67 × 10⁶ *−1.21 × 10⁶−1.40 × 10⁶ *
Gini Index204753−382678−1.03E+06
ClusteringMoran’s I index−727719−814801−754333
Self-sufficiencyTax Burden−4.76012 *−5.26298 **−7.25814 **
PrecipitationPrecipitation2510.18 ***2226.49 ***2603.35 ***
ρ 0.419966 ***
λ 0.532659 ***
Constant−2.32 × 10⁶ *−1.99 × 10⁶ *−1.69 × 10⁶
R 2 0.2390.3630.403
Log likelihood−2467.5−2456.282453.11
AIC49554934.574926.23
SC4985.754968.44956.98
* p < 0.1. ** p < 0.05. *** p < 0.01.
Publisher’s Note: MDPI stays neutral with regard to jurisdictional claims in published maps and institutional affiliations.

