Article

The Informal Seed Business: Focus on Yellow Bean in Tanzania

1
SeedSystem, Sherman, CT 06784, USA
2
Alliance of Bioversity International and The International Center for Tropical Agriculture (CIAT), Kampala, Uganda
3
Alliance of Bioversity International and CIAT, Arusha, Tanzania
4
Alliance of Bioversity International and CIAT, Nairobi, Kenya
5
Tanzanian Agricultural Research Institute (TARI), Maruku, Bukoba, Tanzania
6
Independent Consultant, Dalton, GA 30720, USA
*
Author to whom correspondence should be addressed.
Sustainability 2021, 13(16), 8897; https://doi.org/10.3390/su13168897
Submission received: 3 July 2021 / Revised: 30 July 2021 / Accepted: 3 August 2021 / Published: 9 August 2021

Abstract

:
This article explores the informal seed business, focusing on the yellow bean in Tanzania. The yellow bean is a major bean type traded, yet little is known about the seed supply that fuels it. The survey research in 2019 encompassed larger grain traders, informal seed traders, and retailers, covered major production, distribution and sale hubs, and was complemented by GIS mapping of seed and grain flows and DNA fingerprinting of yellow bean samples. Results showed that traders buy and sell grain and informal seed: it is not one business or the other, but both. Informal seed is an important moneymaker, representing between 15 and 40% of trader business in non-sowing and sowing periods, respectively. In the year monitored, 100% of the yellow bean seed was drawn from the informal sector, amounting to $US 4.35 million just among those sampled. Nevertheless, the informal and formal sectors are clearly linked, as over 60% of the beans sampled derived from modern varieties. Informal traders prove key for: sustaining the grain business, serving the core of the seed business, and moving varieties at scale. More explicit efforts are needed to link the informal sector to formal research and development partners in order to achieve even broader impacts.

1. Introduction

The informal seed sector is widely recognized as the one smallholder farmers in Africa mainly use to access seed for their range of crops. Multiple researchers have calculated that between 80 and 90% of smallholder seed comes from informal systems with the exact proportion differing by crop [1,2]. For instance, data for maize seed systems across nine African countries show that 73.3% of the seed is sourced from the informal sector (as maize is the crop most vended by seed companies and their formal outlets), while for legumes as a cluster, the figure rises to 86.6% [3].
Informal seed channels are generally characterized as embracing several components: farmers’ own saved stocks, seed accessed through social networks, and that bought at local markets. Recent studies show that local markets are important for smallholders as a source for seed, including especially poor and stressed farmers [4,5]. While not all the supplies offered at markets are suitable for planting, farmers who aim to sow actively scout out materials that are adapted, visibly clean, often of a known variety, and from a seller they trust. This subset of grain, purposely selected for planting, has been variously termed ‘potential seed’, ‘implicit seed’, ‘local seed’, or ‘informal seed’, but for ease of reference, we use herein the single term informal seed. Note that farmers may expressly produce and select informal seed, starting from the first steps of sowing and management in their fields. Hence, not all informal seed is simply a subset of selected grain; some is destined to be used as seed from the start [6,7].
While much has been written about smallholders and informal seed from the demand or user side [8,9], very little has been written about how the supply side functions, and particularly about the informal seed business. Just as the informal seed sector dwarfs the formal sector in terms of numbers of farmers’ use (demand), it logically follows that the informal sector dwarfs the formal in terms of volume provided. The informal seed sector ultimately functions as a gigantic business in its aggregate, although its functioning from the supply side has been relatively little examined to date.
This article explores the informal seed business, focusing on the high-profile value chain linked to yellow beans (Phaseolus vulgaris) in Tanzania. Recent research has documented that the yellow bean is one of most traded types in Tanzania, covering 32% of bean area or about 340,000 ha [10]. It is second in production volume of major bean types and its market share has grown rapidly especially within the last 10 years [10]. Nevertheless, information on the specifics of production and sale hubs, and on the grain versus seed trade, has remained scattered and mostly anecdotal. A comprehensive study to fill in some of knowledge gaps was conducted in late 2019 and included the mapping of the production, distribution, and sale hubs, the charting of the geographic grain flows within Tanzania and cross-border, the tracing of geographic seed flows within Tanzania (as the seed trade tends to be localized), and the analysis of the genetic profile of the yellow types (to distinguish modern variety releases vs. other materials). This article focuses on a subset of this study, mainly on the yellow bean seed trade (informal seed trade) so as to allow for the first in-depth analysis of an informal seed business. The yellow bean seed work benefits from the larger contextual analysis as well as from the multiple cross-check methods, going well beyond classic survey to include DNA fingerprinting of samples and GIS analysis of bean movements (see Materials and Methods section).
This article has several broad goals. It aims to document the state of the seed trade relative to overall bean trade (seed and grain) and to give insight into its distinct character: inter alia, volume, seasonality, and flows. It aims to examine some of its internal functioning, sketching quality management actions, and patterns of source and sale. It also aims to suggest, practically, how the informal sector as a business might be leveraged systematically, especially via actions that can accelerate farmer access to new varieties and improve seed quality. Ultimately, the article works to give recognition to the informal sector as the business giant it is—enhancing food and seed security—while also emphasizing that the informal seed sector and formal seed sector, together, can mutually benefit from more integrated and explicit planning and operations.

2. Materials and Methods

2.1. The Overall Approach

The comprehensive study of the yellow bean value chain was carried out July to August 2019 and explored both the seed and grain trade. It embraced an array of methods, including survey work, GIS mapping, and DNA fingerprinting, with each being sketched below. While the prime focus was on the yellow bean types in Tanzania, supplementary data were collected on other major bean types and on the trade patterns within and beyond Tanzania’s boundaries to examine the regional grain flows. The research was guided by a ‘corridor approach’ which examines major flows of a crop between areas of production and consumption, connected by distribution networks, including within and across borders. While this article focuses on Tanzania, as the local seed trade tends to be within country, mapping of the full flows shows that the yellow bean grain corridor extends beyond Tanzania to the region at large: Burundi, Democratic Republic of Congo (DRC), Kenya, Rwanda, Uganda, and Zambia. The Pan-Africa Bean Research Alliance (PABRA) has identified nine bean corridors across Africa, of which the yellow bean is one [11].

2.2. Partners and Sites

PABRA, under the Alliance of Bioversity International and International Center for Tropical Agriculture (ABC), led the yellow bean study in close collaboration with several zonal centers of the Tanzania Agricultural Research Institute (TARI) at Maruku, Selian, and Uyole, and Catholic Relief Services. The major production hubs surveyed included: Northern Zone (Arusha, Kilimanjaro and Manyara), Lake Zone (Kagera), Western Zone (Kigoma), and the Southern Highlands (Iringa, Mbeya, Njombe, Sumbawanga, and Songwe). Major markets or consumption hubs were specifically evaluated in Arusha, Dar es Salaam, and Shinyanga. The distribution hubs were charted at Kagera (Uganda border), the Arusha/Kilimanjaro regions to Kenya and Tunduma on route to DRC and Zambia. In the Northern zone, the hubs combined production, distribution, and consumption functions.

2.3. Sample: Selection and Size

The traders interviewed were identified first via a full listing of the traders in the districts’ target regions. The lists were acquired from market authorities in the survey locations as well as by consulting TARI researchers at each adjacent research station. In many cases, work was eased by prior collaborative relationship between researchers and traders. All popular markets for common beans were also included in the sample and a minimum of 6–8 traders from each were interviewed. For those dealing in informal seed, a second layer of questioning was needed: larger traders (wholesalers and collectors), those often with substantial depots, were directly asked if they dealt in such seed during sowing or other periods and if they had insights into the seed trade specifically. At open markets, retailers were also approached who had yellow bean stocks on offer that potentially could be used for sowing. A retailer may have a small stand or kiosk in or around the selling space. In total, the full report draws insights from 298 grain traders (ranging from retailers to exporters), 23 larger informal seed traders (wholesalers and collectors), and 41 retailers who were selling yellow bean local seed at the time of the fieldwork. To achieve this important sample size required almost three weeks of fieldwork, with dispersed teams working in three or four regions simultaneously. It bears emphasis that the grain vs. seed distinctions in terms of trader type were originally research-labelled ones and that the divisions proved incorrect when verified on the ground. The so-called informal seed traders (both the larger ones and retailers) always also sold grain, and most grain traders interviewed (over half of the bigger sample) recognized that their customers were also buying seed, especially prior to and during the peak sowing time.
Table 1 provides more detail on the geographic distribution for all the samples. No retail informal seed traders were interviewed in the large urban market of Dar es Salaam (‘Coastal’) and no large informal seed traders were located in the Lake zone surveyed.

2.4. Survey Methods and Analysis

For the yellow bean trader survey work, data were collected via android devices using structured questionnaires that were subsequently coded in Open Data Kit (ODK). Themes were wide-ranging, including trader identification of the yellows they vended, seasonality of business, volumes, constraints, and opportunities. A pilot testing phrase helped sharpen the content of the survey as well as the potential response codes on the mobile devices. The final collected data were transmitted to an online cloud server that was hosted on the SurveyCTO platform. This computer-aided personal interviewing (CAPI) was selected over a paper interview format so as to improve data quality and reduce the time spent in post-collection data processing. STATA statistical packages were used to process the range of basic descriptive statistics.

2.5. GIS Mapping Method and Analysis

The mapping of seed and grain flows (charting the sites of sourcing and sale) was performed with data downloaded from the general SurveyCTO platform and later analyzed using Excel. Basically, traders were asked to detail where they routinely sourced yellow bean seed and grain and where each was sold, using place names and printed maps to indicate key specific sites and zones. Coordinates were then transferred into Esri Arc/GIS/Arc Map 10.5 software where they were projected into World Geodetic System (WGS 84) ellipsoid. District boundaries from The Tanzania National Bureau of Statistics were also added, along with traders’ coordinates. After the maps were produced in the GIS software, the maps were moved into Microsoft word documents and arrows charting the bean flows of seed and grain were added. Town/city, road, and water body information was derived from FAO data [12].

2.6. DNA Method and Fingerprinting Analysis

In the course of the survey work, yellow bean samples were collected from all traders interviewed (who freely shared samples, for no payment). The total samples encompassed between 10 and 20 yellow bean variety types and were initially distinguished by visible differences (shape, color, size) and trader’s naming. The practical aim was to determine the precise varieties being traded within the yellow bean chain as well as their relative market proportions.
Variety market share based on surveys can have some important limitations. For instance, traders may not know the formal names, varieties may have multiple popular names, and visible differences can be hard to discern, especially when varieties are bred to have similar physical seed characteristics. Field follow-up to address some of these constraints can be labor-intensive, e.g., visiting fields to observe plant growth characteristics, collecting further sample materials from farmers (i.e., photos, seeds/plant tissues), and providing but partial verification. DNA fingerprinting, on the other hand, and the chosen method of this research, offers a reliable method that accurately identifies the grain/seed traded. DNA fingerprints, resembling barcodes, are unique to the individual variety and can be used in much the same way as conventional fingerprints to identify individuals with absolute certainty [13]. Finger printing has been employed to support variety identity studies in rice and wheat in Ethiopia [14] and beans in Zambia [15] and is increasingly being used for quality control purposes in many breeding programs.
Within the yellow bean fieldwork, a total of 501 yellow bean samples were collected, of which 461 samples were eventually genotyped (the others were discarded due to low quality). The samples collected from traders were compared with 14 known referents: 11 released varieties (from the Tanzania National Agricultural Research System, NARS, and also characterized by The Tanzania Official Certification Institute, TOSCI) plus three landraces provided by the ABC gene bank located in Kawanda, Uganda. In overview, yellow bean samples were first collected from grain and seed sellers at the end of the interviews. Samples were sent to the ABC research office in Uganda to be planted. Leaves were harvested at two weeks, transferred to deep well plates, and then sent to Intertek Laboratories in Alnap, Sweden. Genotyping was conducted using 48 previously identified quality control (QC) single-nucleotide polymorphism (SNPs) molecular markers [16].
A dataset consisting of 1312 biallelic SNP data from 48 single nucleotide polymorphic (SNP) markers was generated by the Intertek lab. The cleaned data set was imported into the Adegenet R package [17]. Preliminary analysis was carried out to identify and remove any non-informative SNP markers using the same program. Data were analyzed using discriminatory analysis of principal components (DAPC) and a similarity matrix to the 14 reference lines was calculated using the program TASSEL [18] (See [19] for an in-depth description of the DNA methodology used). Note that the cost of the DNA analysis amounted to $US 5 per single sample.
Below, we report the results on the yellow bean seed trade that emerged across sites. For the full description, analyses, and results, see [19]. The document includes the comprehensive findings from both grain and seed work, and the DNA fingerprinting and variety-specific findings.

3. Results

In this section, we present together the results of trader survey, GIS, and DNA work as they reinforce and cross-check with each other. Select results from the grain survey work are also shared so as to illustrate some of the informal seed and grain relationships and interactions. The results are grouped under four major themes: seed and grain distinctions; the seed and grain business; informal seed and modern varieties; and sources for seed and grain.

3.1. Seed and Grain Distinctions

Field data showed that there are clear distinctions made within the local markets between informal seed and grain from both the buyer and the supplier perspectives.
From the buyer side, farmers use multiple signals with sellers indicating that they, as customers, are seeking seed specifically. Table 2 reports the signals most commonly noted by retail traders. Sometimes farmer-buyers overtly say that they are looking for seed. Other times, the signals are more nuanced: buyers seek out specific varieties or search for especially clean stocks; they may press the stocks hard to assess their dryness; or other practices. Traders are often familiar with these types of seed-seeking messages.
From the seller side, traders particularly interested in capturing part of the informal seed market also employ clear practices. Research across Africa in the last decade has identified a set of 12 actions that traders may use to manage informal seed [4]. In the Tanzania fieldwork, larger seed traders employed on average 6.7 of these practices, with retailers using on average 5.5 practices. A cluster of these core seed-linked practices are of particular note: keeping the varieties pure; sorting out the waste like dust and pebbles; sorting out the bad and immature grains; and keeping freshly harvested stocks apart. In addition, a good number of traders in Tanzania sell seed and grain separately and at different prices, recognizing that they are indeed distinct commodities. Note that very few traders conduct germination tests or even seem to know about them (Table 3).
In terms of informal seed management, the nuances of traders grading bean stocks (practice #7) may be particularly important to highlight. The traders’ general management premise is that better graded stocks: (a) fetch higher prices, and/or (b) sell faster. The discussions of grading during the fieldwork were key for the details shared but also because ‘lower quality’ was one of the major concerns raised by traders when reflecting on improvements needed for the future (Discussion section, below).
The grading and quality concerns raised by traders embraced issues of both variety type (that is, ‘variety quality’) and seed quality per se (health, germination issues). Traders noted that they might sell the ‘less-preferred’ varieties to institutions such as schools, or routinely mix them with more-preferred varieties to boost the price. In terms of seed quality, traders raised the negative issue of farmers mixing different variety types, along with the complaint that waste (dirt, sticks, pebbles) was not sorted out sufficiently. To improve issues of grading, traders shared some concrete examples of their actions. One large trader (in Kilimanjaro) instructed his collectors to look for seed that was ‘good’ and even asked for an accompanying photo (to be sent by phone) prior to purchase. One retailer (in Karagwe/Kyerwa) explained that she has two strategies when farmers come to her with beans of low quality to sell: she either negotiates a low price and then pays someone else to sort, or asks the farmer to sort (at home) and come back with a cleaner batch, at which time the retailer will pay the normal price.
Therefore, grading is actively performed, and the maintenance of more uniform levels of variety quality and seed quality seems important to a range of traders.

3.2. Seed and Grain Businesses

We now move to the business side of the informal trade and ask: are grain and seed separate enterprises for traders? If so, what might be the relative importance of each?
Field findings showed that traders conduct trade in grain and informal seed: it is not one business or the other, but generally both. Both grain and informal seed can bring traders revenue and these different goods form part of their seasonal cycles of business. For the grain traders of yellow bean (n = 298), 54% stated that some of their sales are used for local seeds. In parallel, for the seed-linked large traders and retailers combined (n = 64), 98% indicated they also sell grain. Only a single one, in Karagwe/Kyerwa (at the Uganda border), indicated he only sold seed. His seed stocks were explicitly treated with pesticides in July for eventual sale in October, at sowing time.
The qualitative survey work further identified multiple direct interactions between trader seed and grain management, deliberately planned. As two examples, several traders described supplying farmers with seed with whom they had arrangements to buy back grain later. Select traders, anticipating future informal seed purchase, also asked their collaborating farmers not to mix different varieties at harvest.
The question is then raised about the importance of each business. While grain sourcing and grain sale dominate, even for the seed-linked traders, informal seed is recognized as an important and distinct moneymaker. For the larger seed traders (n = 23), the seed business occupies about a third of their business during sowing periods, and 1/7 during non-sowing periods. For the retailers (n = 41), the informal seed business is recognized as even more important, and such retailers have a direct interface with farmer-buyers. At its highs, informal seed represents almost 40% of retailer business during sowing and 20% during non-sowing periods (Table 4).
While the seed business is markedly seasonal, it can embrace continual transactions year-round. For instance, a single large grain trader in Arusha (selling 2300 MT annually of yellow bean) described how he had put aside seed received from a shipment for his own use, some 4 MT, as the grain stocks received (during non-sowing period) visually seemed to be ‘very good’ in quality. Farmers, conversely, have been known to buy seed throughout the year, especially when they come across a special variety that might become scarcer as the sowing period approaches.
For the larger grain traders, figures on informal seed sales were also collected. Close to 50% of their transactions (216 out of 444 transactions) involved the sale of yellow beans as seed. Among those who sold seed, the median quantity sold per trader per variety was 1 MT, with some large grain traders selling as much as 30 to 50 MT of seed. The amount of informal yellow bean seed sale on an annual basis from mainly grain traders amounted to a total of 582.8 MT.
Note within our three samples (that included just those directly interviewed and not the full informal seed universe), the amount of yellow bean seed traded in a single year, 1200 MT, matches and usually dwarfs the full amount produced by the formal sector annually (see Discussion section). This impressive amount from the informal seed sector emerged even with the modest sample sizes.

3.3. Informal Seed and Modern Varieties

The field findings presented so far have focused on informal seed as trader emphasis was within each sector. In fact, in terms of yellow bean seed, 100% of the seed bought and sold by traders within the sample was drawn from the informal seed sector. For the larger seed traders (n = 23), none drew from or traded in stocks of certified seed or QDS. Additionally, it was not clear if the seed quality types were known by many. For the retailers (n = 41), the trend was the same. None traded in the current period in either certified seed or QDS. One retailer had had a single experience selling QDS. The traders interviewed across zones proved to have little-to-no direct interface with the formal seed sector.
However, probing further, what did the field results show about interfaces with the formal breeding sector, that is, with modern varieties? Both survey work and subsequent DNA fingerprinting analyses shed light on this issue.
Traders interviewed in the direct survey clearly noted that they did trade in modern varieties (improved varieties). Of the larger seed traders, 39% stated they sometimes trade modern varieties and 17% of the seed retailers confirmed they do so (with about 15% in both cases not knowing the difference). Few traders were aware of the precise names and range of modern varieties actually released and put on offer, so DNA analysis has helped confirm and identify the exact yellow bean types being marketed.
In reference to the yellow bean, the DNA fingerprinting processes to identify the genetic base of the varieties collected and traded are described in depth elsewhere [19]. In brief, the methodologies used and subsequent principal component analysis were able to explain about 85% of the observed variance around yellow bean types (that is, their genetic origins). The market samples taken clustered around 11 of the 15 reference varieties (see Material and Methods section), with six clear clusters emerging (Table 5). Results showed that traders generally deal in mixed populations (modern varieties, landraces, and types that could not be identified), and not in single-variety types. Having made this qualification, three of the TARI released yellow beans within the mixes accounted for 61.3% of yellow beans sample:, the varieties Selian 13, Uyole 16, and Njano Uyole. Hence, the DNA analysis of yellow bean samples (all informal sector seed) showed over 60% were derived from modern, released varieties, that is, from formal sector breeding.
Remarkably, Selian 13 (Group 1), released in 2018 (one year before the field survey), contributed to 44.9% of the yellow beans collected, and thus seems to have successfully penetrated the markets with both quick speed and wide geographic spread. It has very desirable consumer and sower attributes, including fast cooking time, being highly palatable, and possessing drought tolerance. The spread of Uyole 16, released only in 2016, is also to be noted as fast and wide. Literature tells us that varieties can take decades to be accepted by farmers and sold at scale by traders, with researchers and industry sometimes lamenting on what they assess as slow variety turnover [20,21]. The Tanzania yellow bean experience seems to present a different and promising case, especially if one is interested in variety innovation (see Discussion section for continuance on this theme).
In brief, while the seed trade remains based on informal seed quality, the genetics show considerable modern variety infusions, i.e., from formal sector breeding. These might usefully be explored further to understand better the speed, scale, and mechanisms of informal-formal interactions.

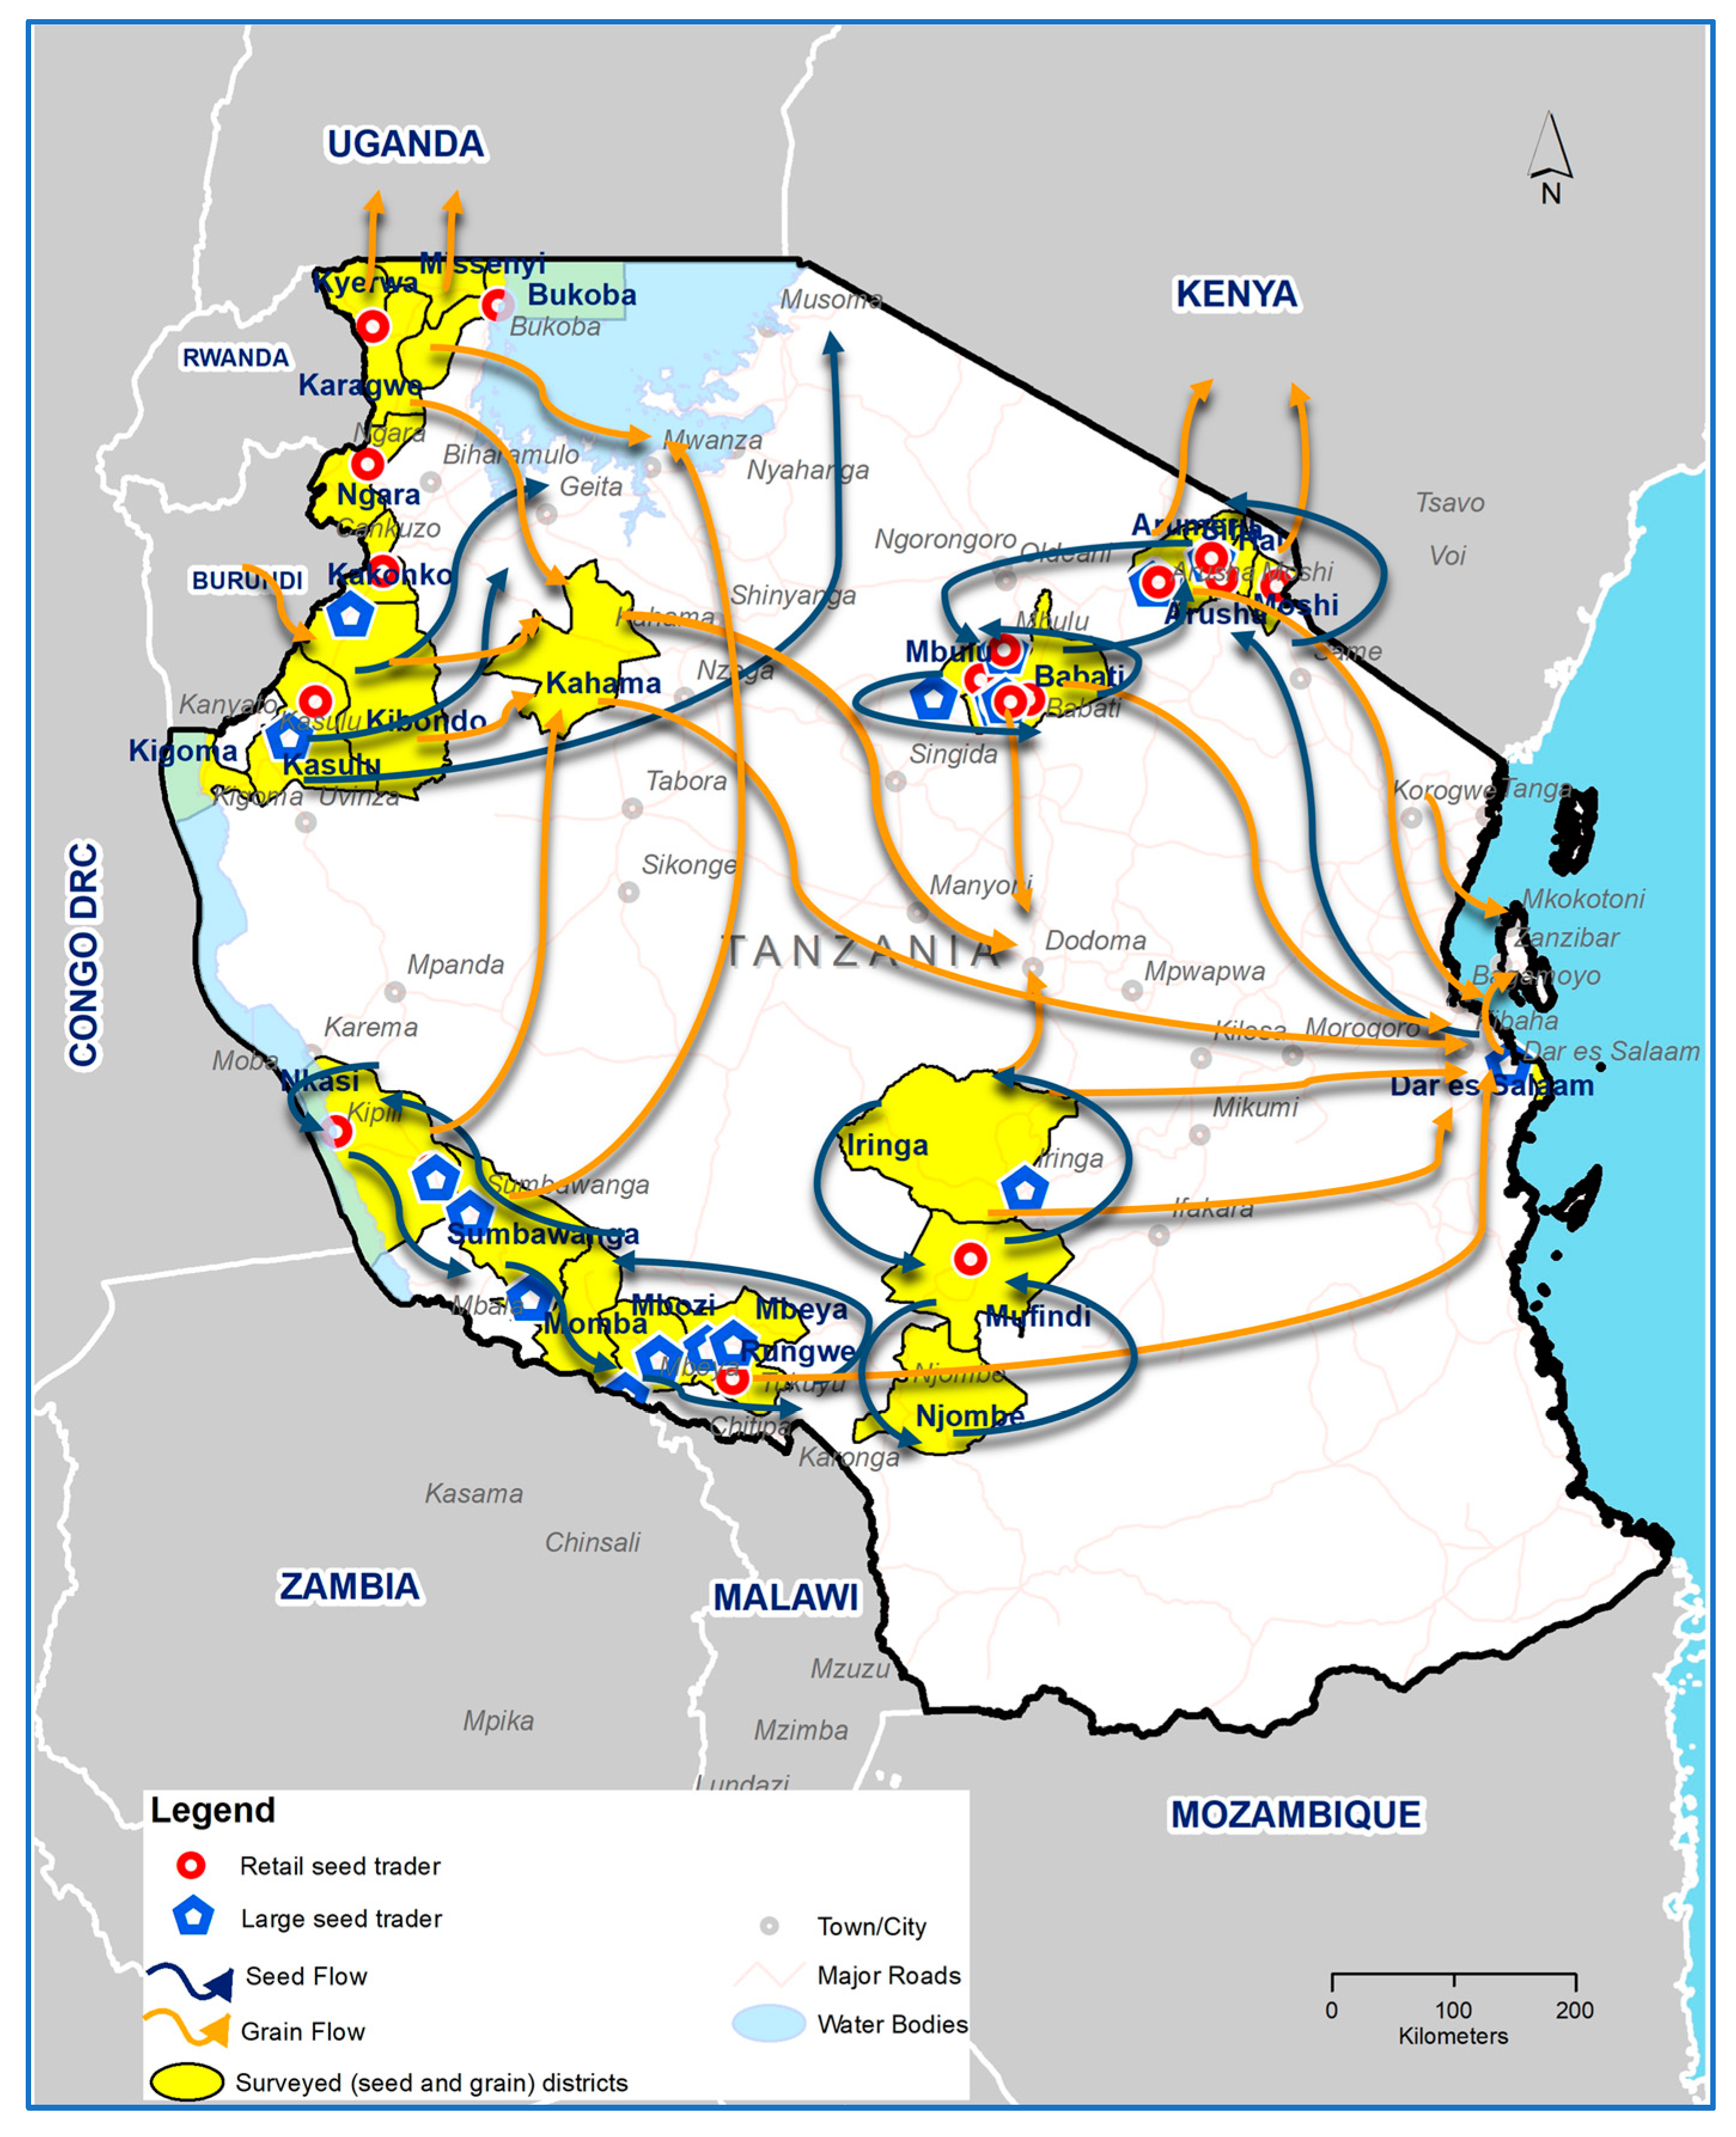
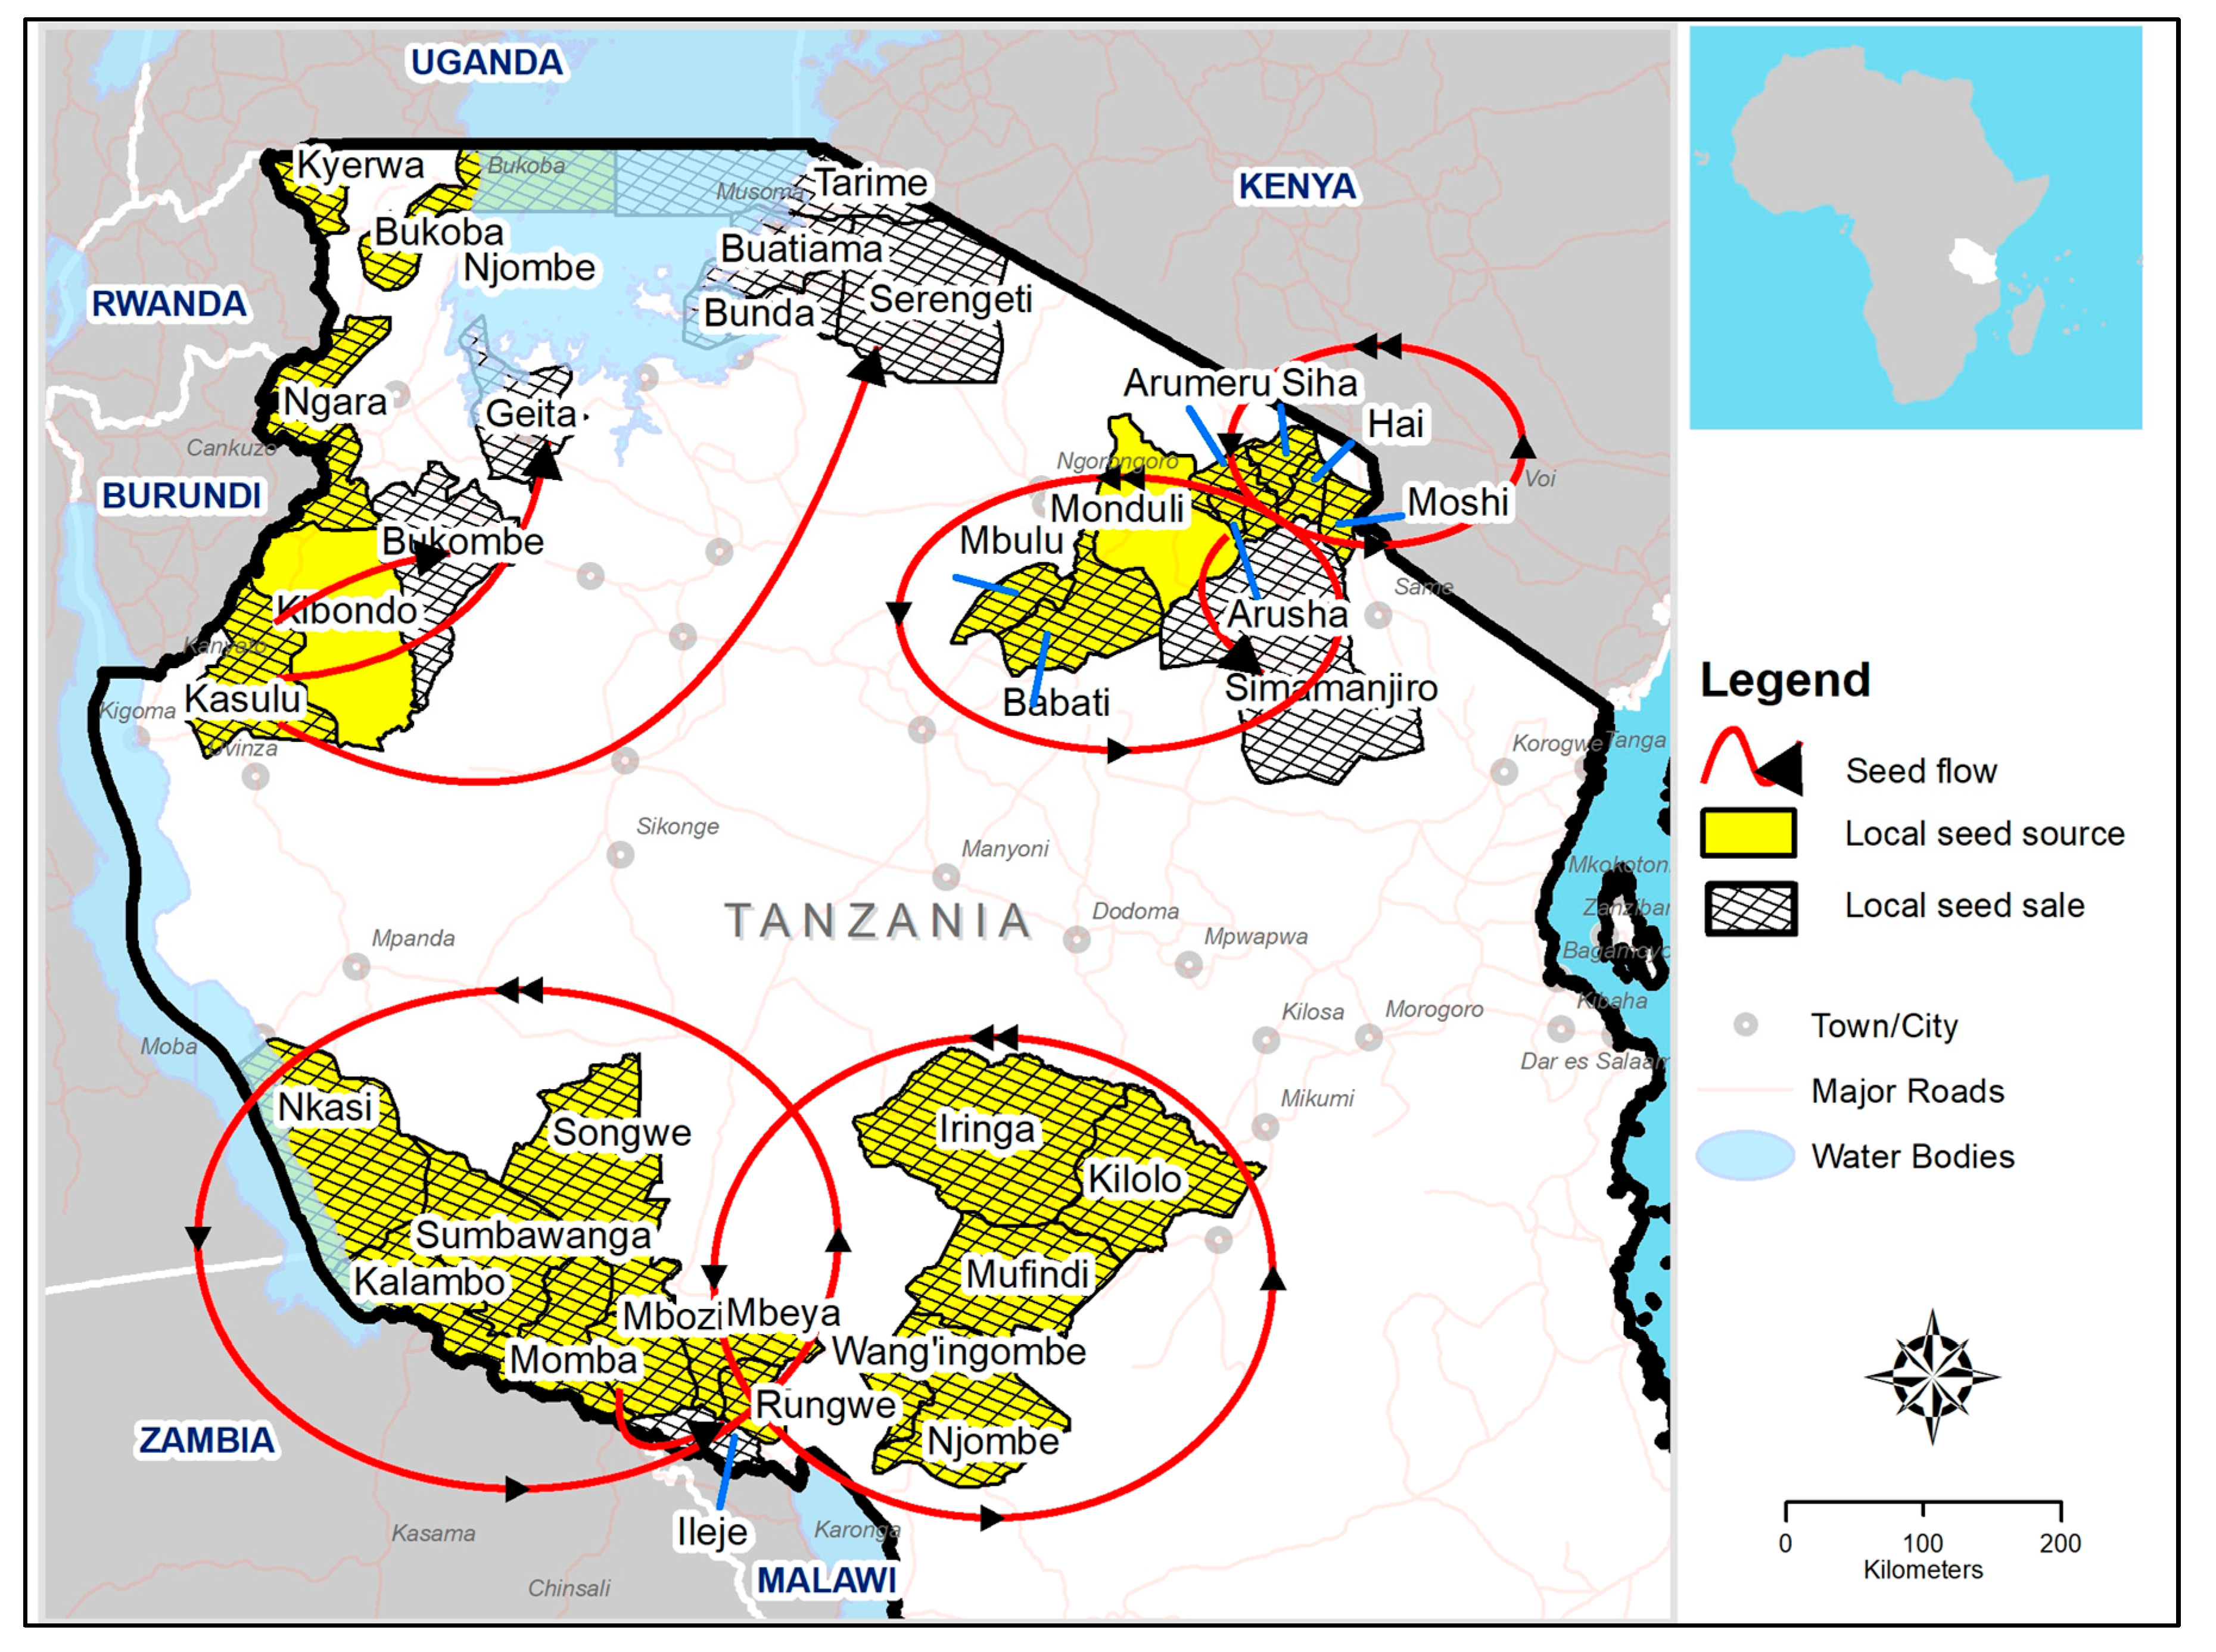
3.4. Sources for Seed and Grain

Lastly, results describe the sources of the yellow beans traded; from whom has grain and seed been procured, and from where geographically?
For all seed-linked traders, the type of actors providing seed and grain proved similar, that is, a trader interfaces with the same set of actors, no matter the product being sought. There are four main ones; sourcing from: one’s own production, directly from farmers, from collectors, or then from other traders (small and medium scale, and not the wholesalers (Table 6). The order of importance differs slightly between the larger traders and retailers. Larger traders rely more on collectors and other traders, while the retailers interact relatively more with farmers directly. Of particular note is the degree to which larger traders also self-produce. The near absence of grain or seed sourced from wholesalers, seed companies, QDS producers or NARS is documented in Table 6.
The geographic-sourcing of seed and grain showed a much more differentiated pattern. For the seed business, the regions of sourcing remain local and circumscribed in an area. In contrast, for the grain business, the mapping of flows showed grain moving to far-reaching areas on a routine basis and even crossing international boundaries (Figure 1).
Figure 2, probing further just on the seed business, confirms how very local both seed sourcing and seed sale remain. Buying and selling generally stay contained within the same region.
This section documented some distinct features of the yellow bean seed and grain business, but also suggested the degree to which the two are intertwined. The central finding that grain and informal seed are partially intermixed businesses suggests that efforts to improve seed markets might centrally engage both grain and seed informal traders and enterprises.

4. Discussion

This section further discusses the interlinked nature of the grain and informal seed businesses and also of the informal seed and formal seed sectors. Exploring the connections, and explicitly planning more strategic interfaces, might bring wins both to business and to smallholder farmers.

4.1. Scale and Interconnections of Trade

The scale of yellow bean grain trade is remarkable, over 42,000 MT annually just among the traders interviewed (all three data sets), but so is the scale of informal seed trade, over 1200 MT annually (from all three sets). This work starts to chart the extent to which the grain and informal seed trades are interlinked: the same traders vend in both, and they source from common actors and places. Selling areas are the major point of differentiation currently identified. It perhaps bears emphasis that these businesses are led and managed by private sector entrepreneurs, i.e., those engaged in informal sector trade. They are not project-based, which often causes results to phase out in the three-to-four-year period. Inherent in the system operations is equitable and open reach even to last mile areas: nearly all bean farmers access the informal system for some, if not the largest portion of their seed [22].
While researchers (including those keen on plant genetics/agrobiodiversity) have often noted the importance of informal systems for promoting biodiversity and serving as a platform for ensuring farmer’ rights [23,24], this yellow bean work equally shows that it makes food security and economic sense to bolster informal seed chains. In Tanzania, this initial research has estimated the value of yellow bean grain chains just in the sample at over US$ 29.1 million annually (calculated by actual the volumes moved among traders interviewed multiplied by the average price for grain at the time of fieldwork, US$ 679/MT). If informal seed chains are but 15% of this business, their value would rise over US$ 4.35 million every year, with gains also shared by small and medium-scale traders. These back-of-the envelope calculations need to be verified systematically, but the scope for income generation in seed as well as grain might best not be ignored, especially as this seed sector business is not subsidized and recurs annually on its own.

4.2. Extent of Modern Variety Use within Informal System

The extent of modern variety use within the yellow bean value chain is remarkable, both in the scale and speed at which variety diffusion seems to have occurred (one major type having been released in 2016 and another in 2018). However, equally of note, and puzzling, is that the field research identified no direct links between this informal seed business and either the formal plant breeding or formal seed sectors. Many (most) of the traders did not know the names of varieties and were unaware what certified and quality declared (QDS) seed even were. This disconnect seems particularly lamentable given that fieldwork interviewed many of the major traders in the major yellow bean production regions.
For its part, the Tanzanian NARS has been particularly dynamic in the last decade, releasing 15 bean varieties from 2011–2020, both yellow and other types. The formal seed sector (Tanzanian Official Seed Certification Institute—TOSCI) has also been working hard to scale up high quality seed production (certified and QDS), starting from a very modest base 2.2 MT for all yellows in 2013 and then most often averaging between 300 and 500 MT/year [25]. Varied forms of outreach have been programmed, including numerous on-farm demonstrations and field days. How these outreach mechanisms have connected, or not, with informal seed traders, still remains to be determined.
As a basic challenge, one might ask how to better merge the dynamism of the informal seed traders, who drive one core of the yellow bean business, with the growing vigor of the formal breeding and formal seed sector efforts? Up to now, links seem to have been ad hoc ones. While is it clear that traders highly value the modern varieties (as do their customers), the current demand for formal sector seed seems secondary. To inform farmer adoption decisions, calculations on the cost-benefit of modern varieties (the germplasm only) might be separated from analyses on the added cost-benefits of use of higher quality certified or QDS seed (also distinguishing these latter two seed standards).

4.3. Select Practical Interventions to Further Linkages

A prime challenge looms of how to promote further key ties between formal and informal systems, including by identifying ways that seed and grain businesses might be more practically linked. The overall goal would be to leverage each of these functioning systems rather than to ignore them, squash them, or disrupt the strategic elements that enable them to operate at scale and to serve a wide range of farmers.
During the course of the fieldwork, three immediate types of actions were suggested, based on constraints put forward by traders themselves. All presently point in the direction of the formal sector giving more support to the informal.
  • Make information in new varieties and the range of varieties more readily available.
While some traders knew of new varieties, a good number did not (and were not even clear about which varieties were local and which were modern). There are a number of diverse aspects here. Can the new varieties address specific problems, like flatulence or low fertility soils or climate variability? Are there new varieties that can stimulate business further and that buyers really want?
Traders should be actively linked to information on both local and modern yellow bean types and their full characteristics. Radio, SMS texts-typologies, and simple flyers might all prove useful. Even photo-classifications of the samples collected during the field research could serve as an immediate information aid.
Informal traders are also at the forefront of serving farmer-customers. Would it be useful for them to be more involved in feedback during the breeding process itself, e.g., [26]? Such involvement could help reinforce the PABRA/TARI practices of ‘demand-led breeding’, that is, of anticipating client needs from the very start [27]. Traders might be usefully invited to higher-level stakeholder planning meetings and field days. Note that traders often interface more with farmer-customers than researchers and extension officers.
  • Address variable seed quality concerns, especially mixing varieties and declining quality in storage.
Many traders complained about farmers’ mixing of varieties. This was linked to the unresolved issue of “who should pay for improving the quality, the trader or the farmer?” While some traders viewed the solution as simply training farmers better in grain and seed management, the issue may not be one of lack of knowledge, but rather of lack of financial incentive. If given a premium by traders, could farmers be encouraged to sort and select out varieties more consistently?
Linked to quality, traders lamented important storage losses. Reduction of storage losses should bring important economic gains relatively easily. For informal seed retailers, hermetic bags (whether Purdue Improved Crop Storage (PICS) or GrainPro, or other brands) are starting to be popularized in select countries in eastern Africa [28].
  • Share and develop more rigorous and ongoing market information for both grain and seed and for formal and informal types.
The variability in markets, as well as the general lack of knowledge about differentiation among markets, was raised repeatedly by traders in reference to both internal and international markets. Which varieties should be invested in and where? Which quality of seed? How are customers to be differentiated in terms of seed and grain wants and needs? The search for formal seed sector demand estimates is a frequent one, e.g., [29]. Given that the informal sector is the bigger supply chain, it might be imperative that informal seed demand estimates also be calculated.
Market information on yellow beans can benefit informal actors when available. However, being informal in nature, such information escapes attention of those who need to collect it and the economic contribution of yellow beans remains largely invisible. From a regional perspective, existing networks such as the Regional Agricultural Trade Intelligence Network managed by the East African Grain Council [30] could be a key contact point for integrating information on the informal yellow bean trade. At the moment, EAGC collects some informal trade data, though with a major focus on cross border trade.
All three of these suggested immediate actions are but initial steps in a larger effort to catalyze more integrated, but also potentially more impactful yellow bean seed and grain systems. Central to integration is that the informal seed system be recognized for what it is: a lion of a business that merits active leveraging. Rather than only focusing on the piecemeal actions outlined above, discussions might be best opened at higher levels, within the institutions, laws, and regulations that foster an enabling environment. Informal seed actors might best be represented in the stakeholder platforms that shape variety release, seed sale, and more general trade policies. Actions to strengthen and improve the informal sector itself might be comprehensively reviewed, as well as actions which strategically integrate the informal and formal sectors.
Practical maps for integrating the two have started to be shared in select public domains. Some work has focused on integrating most features at once, seed availability, access, and quality [31,32,33]. Other work focuses on perceived key bottlenecks such as seed quality or marketing processes [34].

5. Conclusions

This comprehensive fieldwork on the informal seed trade in Tanzania has documented the dominating importance of the informal seed business in the yellow bean trade. It has also documented the extent to which such seed trade is truly a business linked to, but also distinct from, the yellow bean grain business. Informal seed traders are functioning as private sector entrepreneurs who are key: for promoting the grain business, for serving at the core of the seed business (and farmers’ seed security), and for moving varieties at remarkable speed and scale. The informal seed business should be regarded as an all-present and dynamic force that might be explicitly linked to other research and development (R+D) partners aiming to broaden positive impacts among smallholder farmers.

Author Contributions

Conceptualization, L.S., E.B.; methodology, L.S., E.B., S.K., C.M., P.G.; software, S.K., M.M., C.M.; validation L.S., S.K., M.M., N.T., C.M.; formal analysis, L.S., M.M., N.T.; investigation, L.S., E.B., S.K., M.M., N.T., C.M., K.R., M.W., E.K.; resources, L.S., K.R., C.M., J.C.R.; data curation, M.M., S.K., N.T., C.M., P.G.; writing L.S., C.M.; review and editing, all authors; visualization, S.K., supervision, L.S., E.B., K.R.; project administration, J.C.R. funding acquisition, J.C.R. All authors have read and agreed to the published version of the manuscript.

Funding

This study was conducted under the Feed the Future Global Supporting Seed Systems for Development (S34D) project managed by Catholic Relief Services. The overall project is funded by the U.S. Government’s Feed the Future Initiative through the Bureau for Resilience and Food Security (RFS) and by the United States Agency for International Development (USAID) through the Bureau for Humanitarian Assistance (BHA). This particular research on the informal seed business was directed and implemented by The Alliance of Bioversity International and the International Center for Tropical Agriculture with the fieldwork spearheaded by The Pan African Bean Research Alliance (PABRA) in collaboration with The Tanzania Agricultural Research Institute (TARI).

Institutional Review Board Statement

Not applicable.

Informed Consent Statement

Traders engaged in this study were fully informed of its objectives and agreed to the use of the information shared in subsequent reports. All sources have been kept confidential.

Data Availability Statement

Full tables can be found in Birachi, E.A., Sperling, L., Kadege, E., et al. (2020) Analysis of the Yellow Bean Corridor in Tanzania. A Feed the Future Global Supporting Seed Systems for Development activity (S34D) report.

Acknowledgments

We thank Robin Buruchara, Dennis Mcharo, Nestory Shida, Agnes Ndunguru and Michael Kilinago for their help during field research and Allan Male Ssekamate and Bodo Raatz for specific collaboration in the DNA fingerprinting. We also thank the two anonymous reviewers. All your varied expertise has helped to strengthen this work.

Conflicts of Interest

The authors declare no conflict of interest.

Disclaimer

This work was funded in whole (or part) by the United States Agency for International Development (USAID) under Agreement 7200AA18LE00004 as part of Feed the Future Supporting Seed Systems for Development. Any opinions, findings, conclusions, or recommendations are those of the authors alone.

References

  1. Louwaars, N.; de Boef, W. Integrated seed sector development in Africa: A conceptual framework for creating coherence between practices, programs, and policies. J. Crop Improv. 2012, 26, 39–59. [Google Scholar] [CrossRef]
  2. Maredia, M.; Howard, J.; Boughton, D.; Naseem, A.; Wanzala, M.; Kajisa, K. Increasing Seed System Efficiency in Africa: Concepts, Strategies and Issues; Michigan State University International Development Working Paper; Department of Agricultural Economics-MSU: East Lansing, Michigan, 1999; pp. 12–13. [Google Scholar]
  3. Sperling, L.; Gallagher, P.; McGuire, S.; March, J. Tailoring legume seed markets for smallholder farmers in Africa. Int. J. Agric. Sustain. 2021, 19, 71–90. [Google Scholar] [CrossRef]
  4. Sperling, L.; McGuire, S. Understanding and strengthening informal seed markets. Exp. Agric. 2010, 46, 119–136. [Google Scholar] [CrossRef] [Green Version]
  5. Lipper, L.; Anderson, C.; Dalton, T.J. (Eds.) Seed Trade in Rural Markets: Implications for Crop Diversity and Agricultural Development; Earthscan: London, UK,, 2010. [Google Scholar]
  6. Almekinders, C.; Louwaars, N. Farmers’ Seed Production: New Approaches and Practices; Intermediate Technology publications, Ltd.: London, UK, 1999. [Google Scholar]
  7. Croft, M.; Marshall, M.; Odendo, M.; Ndinya, C.; Ondego, N.N.; Obura, P.; Hallett, S.G. Formal and informal seed systems in Kenya: Supporting indigenous vegetable seed quality. J. Dev. Stud. 2018, 54, 758–775. [Google Scholar] [CrossRef]
  8. Almekinders, C.; Louwaars, N.; de Bruijn, G.H. Local Seed Systems and Their Importance for an Improved Seed Supply in Developing Countries. Euphytica 1994, 78, 207–216. [Google Scholar] [CrossRef]
  9. Coomes, O.T.; McGuire, S.; Garine, E.; Caillon, S.; McKey, D.; Demeulenaere, E.; Jarvis, D.; Aistara, G.; Barnaud, A.; Clouvel, P.; et al. Farmer seed networks make a limited contribution to agriculture? Four common misconceptions. Food Policy 2015, 56, 41–50. [Google Scholar] [CrossRef]
  10. Agrilinks. 2020. Available online: https://www.agrilinks.org/post/yellow-bean-corridor-seed-grain-trade-potential (accessed on 2 April 2021).
  11. PABRA. Bean Corridors: A Novel Approach to Scale up National and Regional Trade in Africa. 2017. Available online: https://cgspace.cgiar.org/bitstream/handle/10568/80540/PABRA20_Bean_Corridors_BRIEF.pdf?sequence=5&isAllowed=y (accessed on 1 April 2021).
  12. Geonetwork Website. Food and Agriculture Organization of the United Nations. Available online: http://www.fao.org/geonetwork/srv/en/main.home (accessed on 13 May 2021).
  13. Bhat, K.V. DNA Fingerprinting and Cultivar Identification. National Research Centre on DNA Fingerprinting. Available online: https://www.researchgate.net/publication/242084842_DNA_FINGERPRINTING_AND_CULTIVAR_IDENTIFICATION (accessed on 1 June 2021).
  14. Yirga, C.T.; Traxler, G.; Kim, M.; Alemu, D. Using DNA Fingerprinting to Estimate the Bias of Farm Survey Identification of the Diffusion of Improved Crop Varieties in Ethiopia. In Proceedings of the 129th International Conference of Agricultural Economists, Milan, Italy, 9–14 August 2015. [Google Scholar]
  15. Maredia, M.; Reyes, B.; Manu-Aduening, J.A.; Dankyi, A.; Hamazakaza, P.; Muimui, K.; Rabbi, I.Y.; Kulakow, K.P.; Parkes, E.Y.; Katungi, E.; et al. Testing the effectiveness of different approaches of collecting variety-specific adoption data against the benchmark of DNA fingerprinting: The case of beans in Zambia. In Proceedings of the 29th International Conference of Agricultural Economists, Milan, Italy, 9–14 August 2015. [Google Scholar]
  16. Raatz, B.; Mukankusi, C.; Lobaton, J.D.; Male, A.; Chisale, V.; Amsalu, B.; Fourie, D.; Mukamuhirwa, F.; Muimui, K.; Mutari, B.; et al. Analyses of African common bean (Phaseolus vulgaris L.) germplasm using a SNP fingerprinting platform: Diversity, quality control and molecular breeding. Genet. Resour. Crop. Evol. 2019. [Google Scholar] [CrossRef] [PubMed] [Green Version]
  17. Jombart, T.; Ahmed, I. Adegenet 1.3-1: New tools for the analysis of genome-wide SNP data. Bioinformatics 2011, 27, 3070–3071. [Google Scholar] [CrossRef] [PubMed] [Green Version]
  18. Bradbury, J.P.; Zhang, Z.; Kroon, D.E.; Casstevens, T.; Ramdoss, Y.; Buckler, E. TASSEL: Software for association mapping of complex traits in diverse samples. Bioinform. Appl. Note 2007, 23, 2633–2635. [Google Scholar] [CrossRef] [PubMed]
  19. Feed the Future Global Supporting Seed Systems for Development Activity (S34D) Report. 2020. Available online: https://www.crs.org/our-work-overseas/program-areas/agriculture/feed-future (accessed on 1 June 2021).
  20. Spielman, D.J.; Smale, M. Policy Options to Accelerate Variety Change among Smallholder Farmers in South Asia and Africa South of the Sahara. 2017. Available online: http://ebrary.ifpri.org/cdm/ref/collection/p15738coll2/id/131364 (accessed on 2 March 2021).
  21. Rutsaert, P.; Donovan, J. Sticking with the old seed: Input value chains and the challenges to deliver genetic gains to smallholder maize farmers. Outlook Agric. 2020, 49, 39–49. [Google Scholar] [CrossRef] [PubMed] [Green Version]
  22. McGuire, S.; Sperling, L. Seed systems smallholder farmers use. Food Secur. 2016, 8, 179–195. [Google Scholar] [CrossRef] [Green Version]
  23. Andersen, R. Governing Agrobiodiversity—Plant Genetics and Developing Countries; Ashgate: Aldershot, UK, 2008. [Google Scholar]
  24. Andersen, R.; Winge, T. (Eds.) Realising Farmers’ Rights to Crop Genetic Resources; Routledge: Abingdon, UK, 2013. [Google Scholar]
  25. PABRA. PABRA Cumulative Narrative Report 2015–2019: Improving Food Security, Nutrition, Incomes, Natural Resource Base and Gender Equity for Better Livelihoods of Smallholder Households in Sub-Saharan Africa; CIAT: Nairobi, Kenya, 2019. [Google Scholar]
  26. Assefa, T.; Sperling, L.; Dagne, B.; Argaw, W.; Tessema, D.; Beebe, S. Participatory Plant Breeding with Traders and Farmers for White Pea Bean in Ethiopia. J. Agric. Educ. Ext. 2014, 20, 497–512. [Google Scholar] [CrossRef]
  27. Sygnenta Foundation for Sustainable Agriculture (SFSA). Demand-Led Breeding. 2020. Available online: https://www.syngentafoundation.org/demand-led-breeding-0 (accessed on 1 April 2021).
  28. Mutungi, C.; Affognon, H.D.; Njoroge, A.W.; Manono, J.; Baributsa, D.; Murdock, L.L. Triple-Layer Plastic Bags Protect Dry Common Beans ( Phaseolus vulgaris ) Against Damage by Acanthoscelides obtectus (Coleoptera: Chrysomelidae) During Storage. J. Econ. Entomol. 2015, 108, 2479–2488. [Google Scholar] [CrossRef] [PubMed]
  29. Teklewold, A.; Alemu, D.; Shiratori, K.; Kirub, A. Seed Demand Assessment: Practices, Challenges, and Options. Empowering Farmers’ Innovation Series No. 5. FRG II Project. Addis Ababa: Ethiop. Inst. Agric. Res. 2012. [Google Scholar] [CrossRef]
  30. East African Grain Council Website. Available online: http://eagc.org/services/ratin/ (accessed on 2 March 2021).
  31. Mulesa, T.H.; Dalle, S.P.; Makate, C.; Haug, R.; Westengen, O. Pluralistic seed system development. Agronomy 2021, 11, 372. [Google Scholar] [CrossRef]
  32. Sperling, L.; Gallagher, P.; McGuire, S.; March, J.; Templer, N. Informal Seed Traders: The Backbone of Seed Business and African Smallholder Seed Supply. Sustainability 2020, 12, 7074. [Google Scholar] [CrossRef]
  33. Sperling, L.; Boettiger, S.; Barker, I. Integrating Seed Systems. Planning for Scale, Brief #3. AgPartnerXChange. 2014. Available online: https://seedsystem.org/wp-content/uploads/2014/03/Integrating-Seed-Systems-.pdf (accessed on 1 April 2021).
  34. Kuhlmann, K.; Dey, B. Using Regulatory Flexibility to Address Market Informality in Seed Systems: A Global Study. Agronomy 2021, 11, 377. [Google Scholar] [CrossRef]
Figure 1. Overview of trader seed and grain flows for yellow bean in Tanzania (all three data sets). Blue arrows show the seed movements and orange the grain movements.
Sustainability 13 08897 g001
Figure 2. Zones of yellow bean sourcing and selling of informal seed in Tanzania (larger trader and retailer informal seed trader datasets combined).
Sustainability 13 08897 g002
Table 1. Distribution of yellow bean informal seed large traders, seed retailers, and grain traders by zone and transactions (%).
nSouthern
Highlands
NorthernWesternCoastalLake
Large Seed Traders23523594-
Transactions 146642862
Seed Retailers41245412-10
Transactions 6439418-13 2
Grain traders2983032121313
Transactions4443228111118
Note: 1 One trader may have done business in several yellow bean types, with each examined separately. Hence, a transaction is trader by yellow bean variety type. 2 The total reaches 101 due to rounding error. Note for both the informal larger seed traders and retail sellers, the sample fell between 30 and 65 years old. Women and men had good representation in both groups, although women were more visible at the retail level and men as larger traders.
Table 2. Yellow bean seed purchase signals by farmers (n = 41) at retailer outlets.
Signal from Farmers% Traders Recognizing Signal
Search for pure varieties, not mixed73
Search for stocks which are clean (no debris)85
Search for a specific variety by name85
Ask about the origin (place) where the stocks are from29
Ask how the stocks were stored/conserved49
Ask for a particular quantity44
Say they are buying seed85
Give other signals 17
Table 3. Informal seed management practices by large traders (n = 23) and retailers (n = 41).
#Type of Practice% Yes
(n = 41)
% Yes
(n = 23)
1Acquire grain from specific regions, with similar adaptation2239
2Seek out specific varieties to buy (which can be planted)7674
3Buy from specific growers who are known for high quality seed2730
4Ask growers (ahead of time) to multiply select varieties00
5Keep each variety pure—as a single variety7378
6Keep freshly harvested stocks apart7391
7Grade stocks (which grain/which seed)4670
8Do germination tests120
9Have special storage conditions (to help with seed viability)3948
10Sort out ‘waste’ (pebbles, dirt, dust)6683
11Sort out ‘bad grains/seed’-that is broken, or immature, or discolored6678
12Sell seed and grain separately, at different prices4674
Table 4. Seed and grain business proportions (percentage volumes).
CalculationTotal Volume (tons)Non-Sowing PeriodSowing Period
% Grain% Seed% Grain% Seed
Large Informal Seed Trader (n = 23)
Total volume2116.6
Average per trader48.184.1%15.9%66.4%33.6%
Informal Seed Retailer (n = 41)
Total volume295.3
Average per trader4.680.5%19.5%61.2%38.8%
Table 5. Proportion of yellow bean trader samples according to the reference varieties.
KeyReference Varieties% of SamplesGroup NameTypeReleased
Group 1Selian1344.9Selian 13Modern2018
Njano gololi 1
Masindiyellow long
Tz unlabeled2
Group 2Un-clustered18.9Unknown--
Group 3Masindi yellow short
Njano gololi 1
13.2Masindi YellowLandrace from Uganda
Group 4Uyole1611.4Uyole 16Modern2016
Group 5Moore 88002
Tz unlabeled1
Rushala
6.5MOORE 88002Modern1999 Released in Burundi, Uganda and DRC
unknown
Group 6Njano uyole5.0Njano UyoleModern2008
Uyole98
Njano uyole ndefu
Vwawa mkt mbuzi
1 There were two samples of Njano gololi in the reference set. One was collected by TARI-Selian staff from a nearby market (Njano gololi BUB in cluster 3) and another was a sample from the TARI-Selian station (cluster 1). Njano gololi is a common name that is used by traders and consumers in Tanzania for yellow beans and TARI is unsure of its clear identity and has not listed it among its released varieties.
Table 6. Transactions from a given source (%) *.
SourceGrainSeedBoth Grain and Seed
Large Seed Trader Transactions (n = 46)
Self-production32.634.828.3
Farmers directly73.976.165.2
Collectors (who source from farmers)71.756.552.2
Other traders, small and middle level54.341.334.8
Wholesalers4.30.00.0
Seed Companies0.00.00.0
QDS producers 0.00.00.0
Research/NARS0.00.00.0
Other0.02.20.0
Retail Trader Transactions (n = 64)
Self-production10.912.510.9
Farmers directly84.473.470.3
Collectors (who source from farmers)42.245.342.2
Other traders, small and middle level23.418.817.2
Wholesalers3.13.11.6
Seed Companies0.00.00.0
QDS producers 0.00.00.0
Research/NARS0.00.00.0
Other0.00.00.0
* 23 large traders had 46 transactions, as some worked with multiple yellow bean varieties; 41 retail traders had 64 transactions, as some worked with multiple yellow bean varieties. Note that a single trader for a single variety might also procure seed from several sources.
Publisher’s Note: MDPI stays neutral with regard to jurisdictional claims in published maps and institutional affiliations.

