Article

Spatiotemporal Differentiation of Land Surface Thermal Landscape in Yangtze River Delta Region, China

1
College of Geography and Environmental Science, Northwest Normal University, Lanzhou 730070, China
2
College of Earth and Environmental Sciences, Lanzhou University, Lanzhou 730000, China
*
Author to whom correspondence should be addressed.
Sustainability 2021, 13(16), 8880; https://doi.org/10.3390/su13168880
Submission received: 1 July 2021 / Revised: 1 August 2021 / Accepted: 6 August 2021 / Published: 9 August 2021

Abstract

:
Advancements in the integrated development of the Yangtze River Delta are changing the structure and function of the surface thermal landscape and triggering a series of ecological and environmental problems. Therefore, examining the spatiotemporal differentiation characteristics and evolution laws of this land surface thermal landscape has great theoretical and practical significance in the context of optimizing functional zoning and realizing the harmonious development of the economy, society and nature. The paper uses the LST (land surface temperature) data retrieved by MODIS (MOD11A2) remote sensing satellites in 2007, 2010, 2013, 2016 and 2019 to extract a land surface thermal rating map of the Yangtze River Delta region, and to analyze the spatiotemporal differentiation in the land surface thermal landscape, combining of the land surface thermal landscape strip profile and thermal landscape pattern indices. The results show that the LST in the Yangtze River Delta region has increased in the past 12 years, the proportion of middle-, sub-high- and high-temperature zones increased by 33.42%, and the high-temperature zone has gradually extended into inland areas. The high-temperature zones in the areas surrounding core cities such as Shanghai, Nanjing, and Hangzhou have expanded. The corridor effect of thermal changes on the surface is obvious. The degree of aggregation in the lower-temperature areas has gradually decreased. The degree of aggregation in the higher-temperature regions has increased. The patch types of thermal landscape pattern increase, and the distribution of landscape area among various types tends to be even. this trend is most significant in optimized development region.

1. Introduction

The deteriorating thermal environment in urban spaces has become one of the most significant features of global urban climate change [1,2]. Urban expansion will inevitably lead to significant changes in the spatial patterns of land use/cover change (LUCC) in urban areas [3,4,5], causing the land surface temperature (LST) to rise [6,7,8], which in turn affects the material structure and energy flow of urban ecosystems, and thus the quality of urban human settlements [9].
The Yangtze River Delta displays the highest level and fastest speed of urbanization of any region in China, and it is also core to international competition. Its development and evolution are the epitome of the integration and urbanization of China’s developed regions [10,11]. The evolution of this area reflects the complex processes by which human activities transform surface structure and function, which in turn affect the spatiotemporal evolution of the surface thermal landscape [12]. Therefore, reviewing the mechanisms of the spatiotemporal changes in this region’s surface thermal landscape is very important to formulating measures to alleviate the urban heat island effect [13,14,15], and to thus improve the modern urban ecological environment [16,17].
Urban space thermal environment research concerns the two key concepts of urban atmospheric heat island, and urban surface heat island [18]. With the continuous improvement of remote sensing and geographic information system (GIS) technology [19], many scholars have used remote sensing images to assess the LST and to characterize the urban thermal environment and urban heat island effect. Domestic scholars such as Chen et al. have used the research methods of landscape ecology for the first time, and in doing so proposed the concept of the thermal landscape, established a thermal landscape evaluation system, obtained urban surface temperature based on TM (land thematic mapper) images, and studied the spatial pattern of the thermal environment in Shanghai [20]. Qiao et al. used MODIS (moderate resolution imaging spectroradiometer) surface temperature data to characterize the evolution of Beijing’s surface thermal landscape from the perspective of quantity, shape, and structure, using the landscape index, a surface thermal grade change map, thermal landscape centroid migration, and other methods [21]. Yue used SPOT images to interpret the types of urban land use, while also using ETM+ (Enhanced Thematic Mapper Plus) images from a Landsat7 satellite to retrieve LST. By analyzing the relationship between land use spatial patterns and LST, they revealed the internal mechanism of the urban heat island effect [22]. Gebrekidan studied the relationship between LUCC, normalized difference vegetation index (NDVI), surface emissivity and surface temperature for a city in Ethiopia. The results showed that LUCC is the main factor that triggers increases in surface temperature [23]. There have also been many studies on the thermal environment in the Yangtze River Delta. For example, Xia analyzed the urban expansion of Wuxi and its heat island response [24]; Zhang et al. systematically described the spatiotemporal change trajectory and the characteristics of the thermal environment pattern in Nanjing, and revealed the driving factors of these changes [25]; Han et al. studied the changing characteristics of the thermal environment security patterns of 16 cities in the Yangtze River Delta [26]. Overall, most of the existing studies have had a small scale, or have focused on a single city and thus have shown less consideration of differences within a region. Therefore, from a meso-scale perspective, this paper uses the thermal landscape index to analyze the spatiotemporal differentiation characteristics of the surface thermal landscape in the Yangtze River Delta, and further identifies the relationship between the spatial structures of urban agglomerations (core area–peripheral area; core city–node city–general city; corridor–hinterland) in the region and the thermal landscape of its surface.

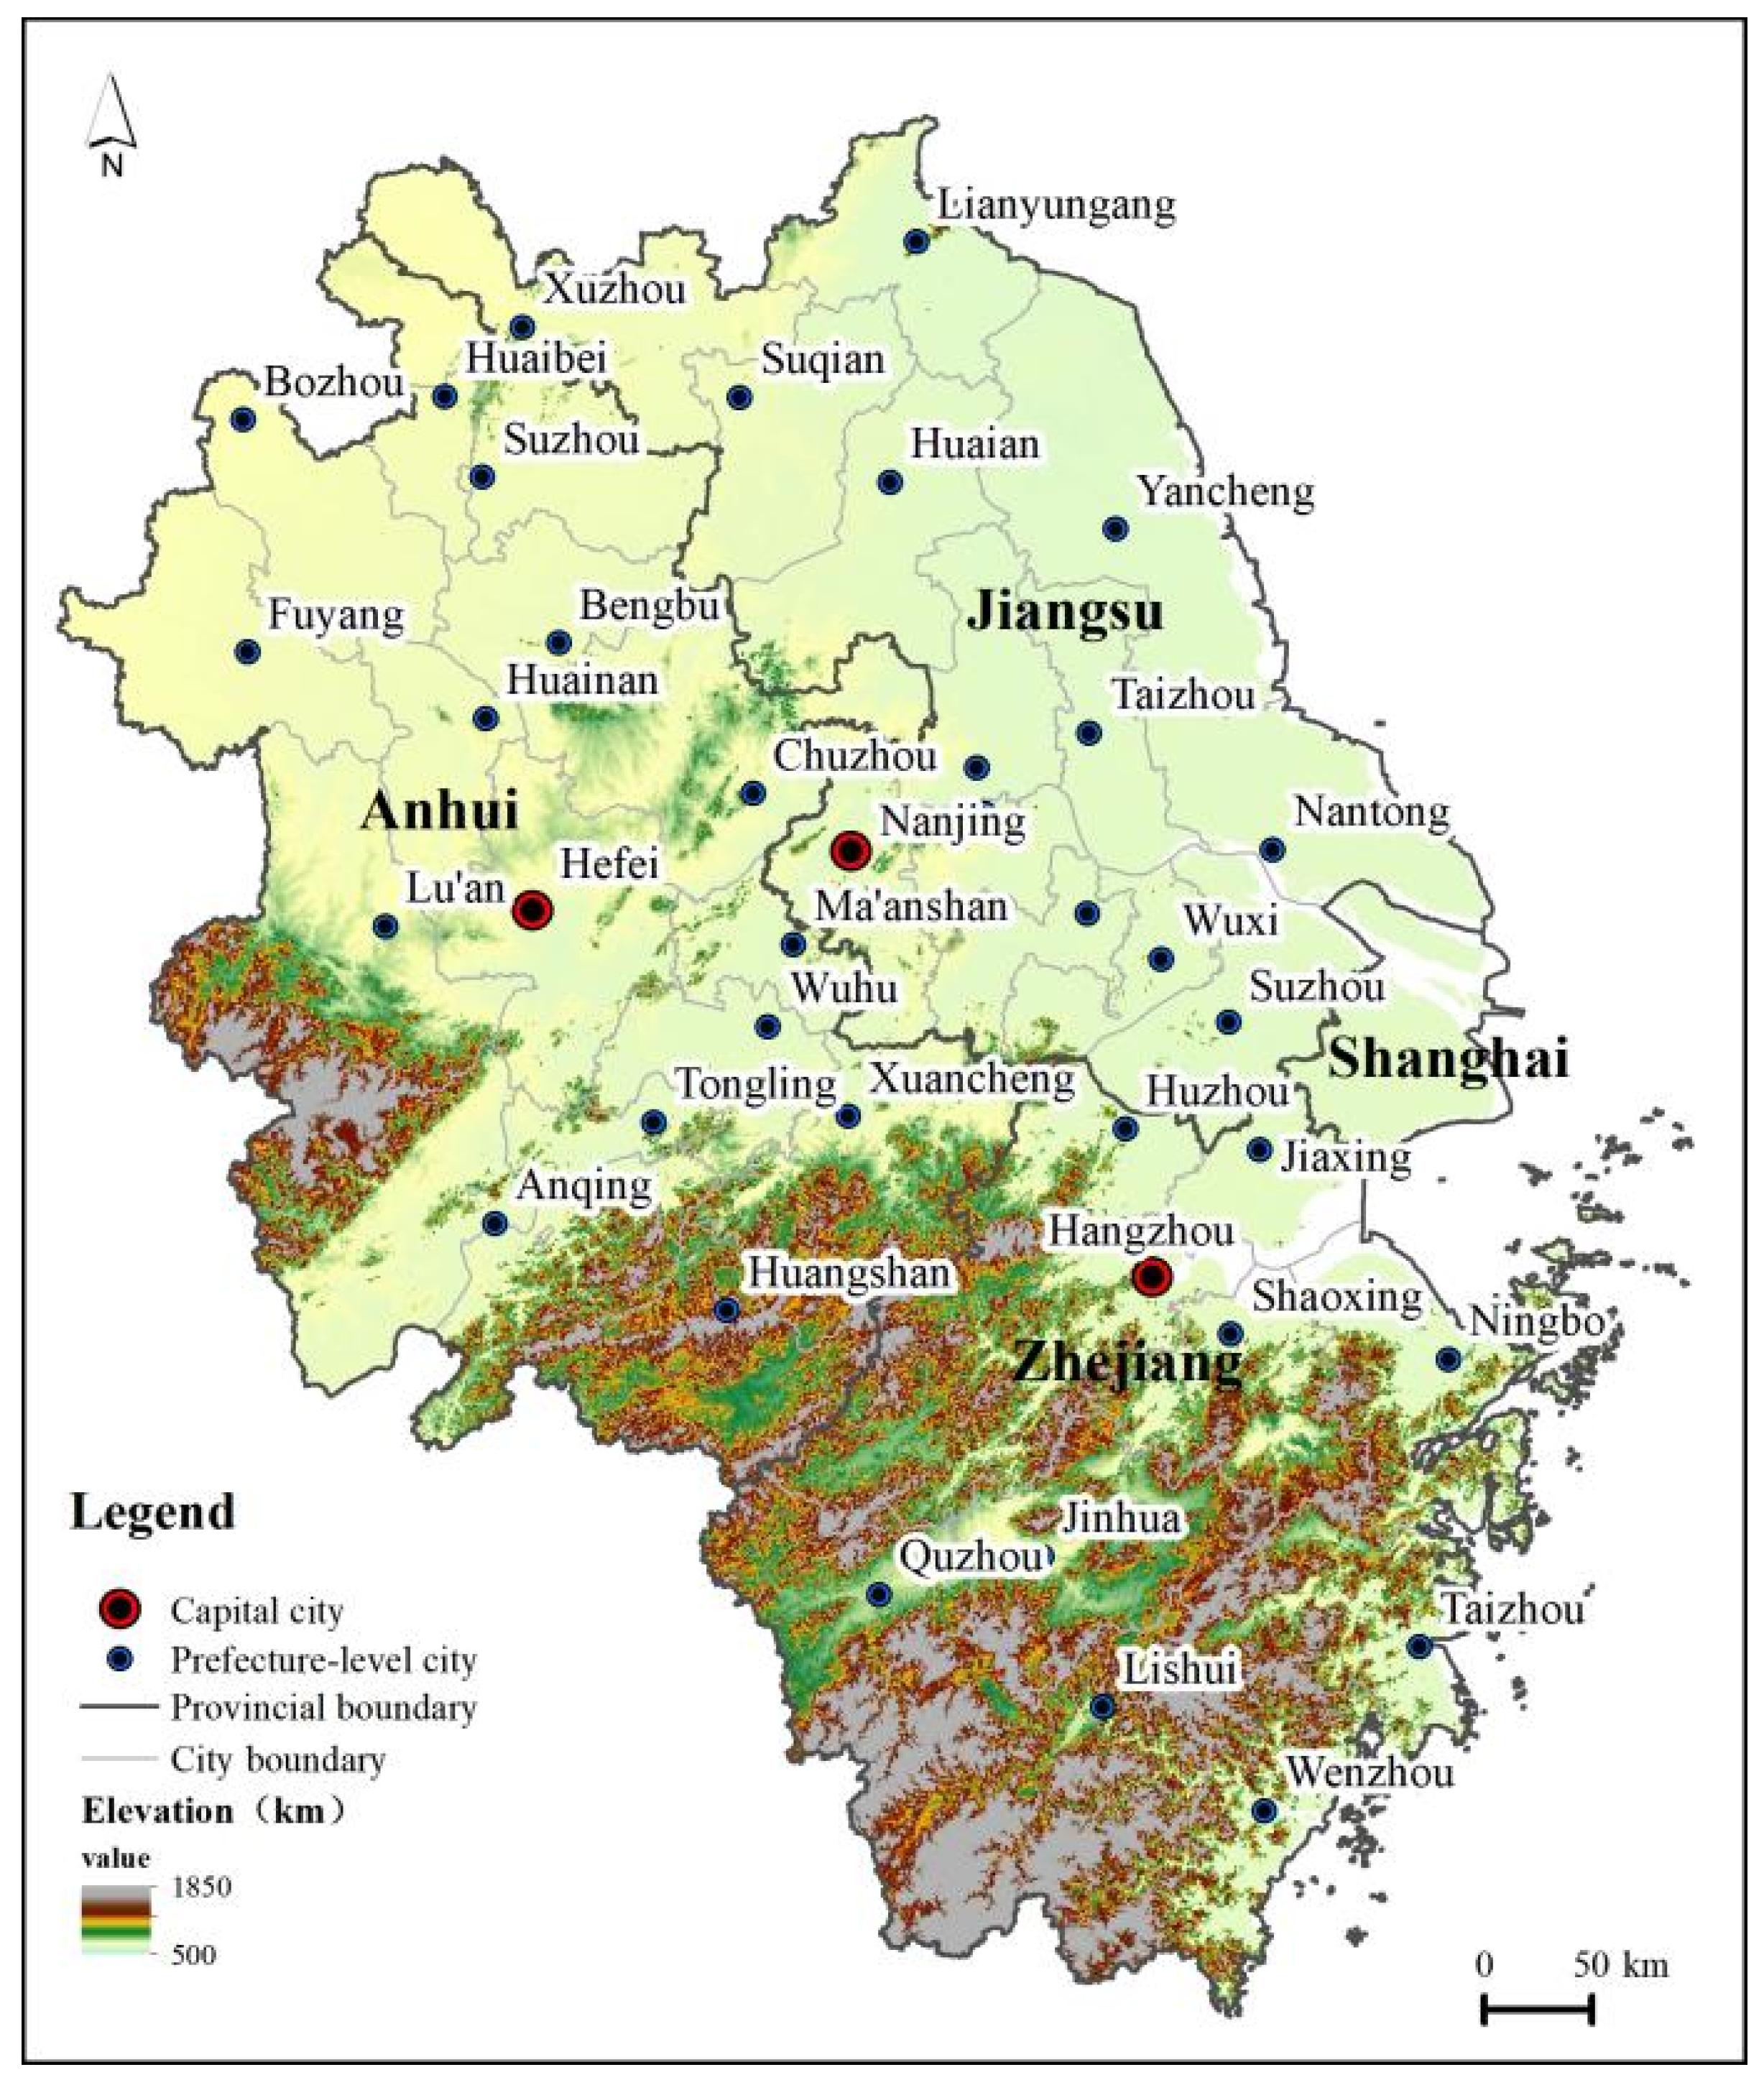
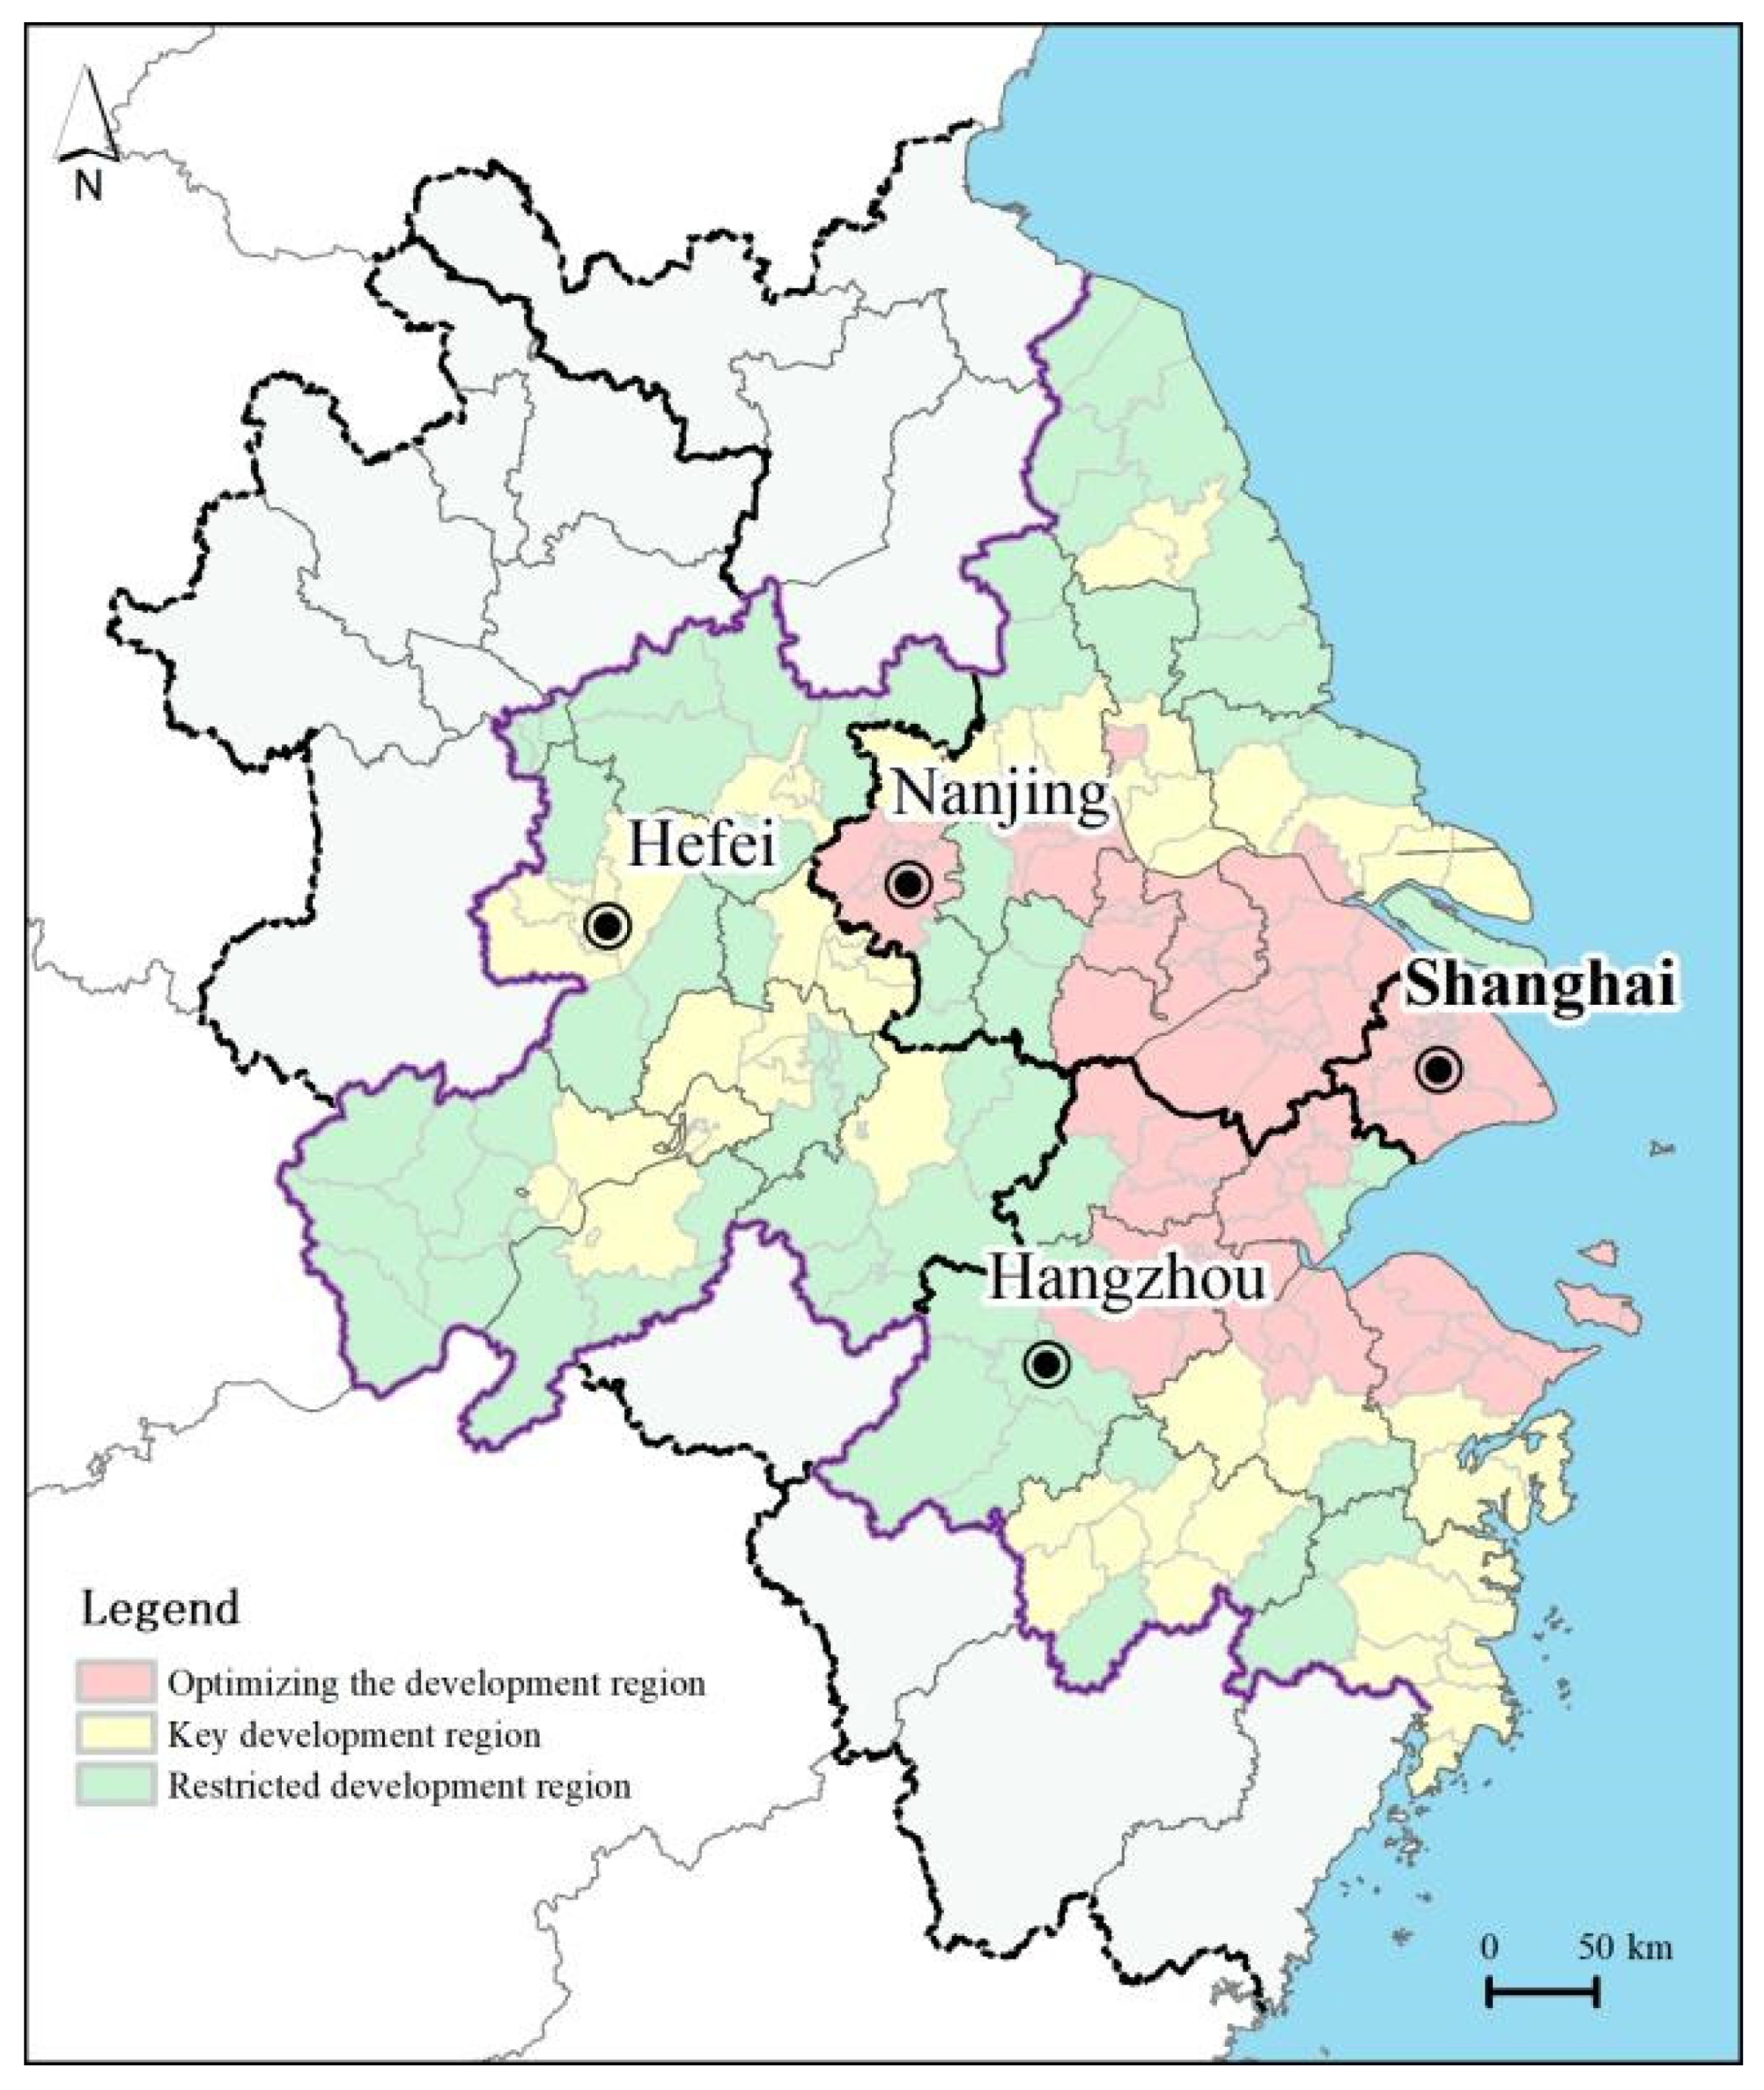
2. Regional Overview of the Study

The Yangtze River Delta is located in the lower reaches of the Yangtze River, east of the Yellow Sea and East China Sea. It is an alluvial plain formed by the Yangtze River entering the sea. It has a subtropical monsoon climate, with high temperatures and rain in the summer, mild rain in the winter, and small annual temperature differences. Its geographical position is highly favorable—the terrain is flat, and transportation is convenient, which is conducive to the development of external relations and imparts a broad geographical advantage on the hinterland. The Yangtze River Delta region studied in this paper incorporates Shanghai, Jiangsu Province, Zhejiang Province and Anhui Province (three provinces and one city), with 41 prefecture-level cities and a total area of 358,000 km² (Figure 1).
The Yangtze River Delta’s superior geographical location means its total economic output ranks among the highest in the country, with a solid economic foundation, developed manufacturing and high-tech industries, and a rapidly developing service industry. It only accounts for 2.5% of the country’s total area, but it contains 16% of the country’s population and contributes 24% of the total economic output (2019). The Yangtze River Delta has been integrated since 1982, and its scope of integration has increased since then (Table 1). In 2018, the integrated development of the Yangtze River Delta became a national strategy. From 2007 to 2019, the population density, power consumption, and proportion of built-up area in the Yangtze River Delta region showed upward trends (Figure 2). Changes in the urban environment have caused significant changes in the surface temperature of the region.

3. Data Sources, Preprocessing and RESEARCH Methods

3.1. Subsection Data Sources and Preprocessing

3.1.1. Remote Sensing MODIS Date

MODIS is the abbreviation of the moderate resolution imaging spectroradiometer. It is a detection instrument mounted on Terra and Aqua satellites. The ground resolution of MODIS data is 250, 500 and 1000 m [27], the scan width is 2330 km, and the observation data contain 36 discrete spectral bands [28]. This multi-wavelength observational equipment can closely scrutinize the dynamic changes of various features on the earth, such as changes in surface temperature [29], vegetation coverage [30], aerosol and atmospheric properties [31,32,33,34], etc. This paper employs the LST product retrieved by the land standard product MOD11A2 on the Aerra satellite (data source: https://ladsweb.modaps.eosdis.nasa.gov/search/ (accessed on 15 October 2020)). The spatial resolution is 1000 m, and the product contains 8d synthetic data. On average, four images are taken per month. As the weather in August is clear and cloudless, the ground features are clear and the quality of remote sensing images is good. Studies have shown that summer temperatures in urban areas are high, the heat island is strong, and its area is large; the calculation results are easily analyzable [34,35]. Therefore, this article uses the same four days (217th, 225th, 233rd and 241st day) for each year (2007, 2012, 2015 and 2019 year). We referred these to a MODIS China regional rank number, and selected the three areas of H27V05, H28V05, and H28V06 to cover the Yangtze River Delta.

3.1.2. MODIS Data Preprocessing

First, we used the MRT (MODIS Reprojection Tool) to splice the data of the three scenes, selected the band of LST_Day_1 km, and added the geographic coordinate system (WGS84); secondly, the band calculator (Band Math) was used to synthesize the data for the 217th, 225th, 233rd, and 241st days to derive the August surface temperature using the maximum value synthesis method, and we cropped the synthesized remote sensing data according to the vector boundary of the Yangtze River Delta In ENVI5.3. Thirdly, the image was reprojected (Reprojection coordinates: WGS1984 UTM Zone 50N); then, we converted the LST data from Kelvin to Celsius using the description of MODIS data [36]. The specific formula is shown in (1). After the temperature conversion, we derived the DN (Digital Number) value and eliminated the outliers; finally, the LST for August 2007, 2010, 2013, 2016 and 2019 was obtained.
MPVC = 0.02 MPVK − 273.1
where MPVK is MODIS pixel value in Kelvin, and MPVC is MODIS pixel value in Celsius.

3.2. Research Methodology

3.2.1. Spatiotemporal Distribution Pattern of Land Thermal Landscape

The function of data normalization is to summarize the statistical distribution of a unified sample. As such, the range of land temperature values is distributed between 0 and 1 [37] for further research and statistical analyses. We used the band calculator [38] to enter the Formula (2) into ENVI5.3:
T i * = T i T m i n T m a x T m i n
where T i * is the value after the normalization of the i pixel, T i is the actual land temperature of the i pixel, T m a x is the maximum LST in all the pixels, and T m i n is the minimum LST in all the pixels.
After normalization, using the reclassification tool [39] in ArcGIS 10.2, the standardized LST was divided into five levels (Table 2), based on which the classification map of the surface thermal landscape of the Yangtze River Delta region from 2007 to 2019 was produced (Figure 3).

3.2.2. Strip Profile of the Surface Thermal Landscape

The strip profile extraction method uses the principle of mathematical statistics to obtain elevation information for a buffer area in a direction perpendicular to the profile line [40]. This paper employs the strip profile extraction method to further analyze the changes in the surface thermal landscape of different regions in the Yangtze River Delta. The Development Plan for the Yangtze River Delta Urban Clusters proposes a networked spatial pattern of “one core, five circles and four belts”, wherein the four belts are the Shanghai–Nanjing–Hefei–Hangzhou–Ningbo Development Belt, the Yangtze River Development Belt, the Coastal Development Belt, and the Shanghai–Hangzhou–Jinhua Development Belt. These belts link 27 cities (Table 3). We used ArcGIS10.2 to extract surface thermal landscape strip profiles of the four development zones in 2007 and 2019, based on the classification map of the surface thermal landscape.

3.2.3. Thermal Landscape Pattern Indices

The thermal landscape pattern indices draw lessons from the research methods of landscape ecology and analyzes the evolution characteristics of thermal landscape through the calculation of landscape indices. The landscape pattern indices contain a wealth of landscape pattern information, which reflects the number, shape, and spatial features of each landscape area [21,41,42]. We used Fragstats 4.2 to calculate each landscape pattern indices based on the classification map of the surface thermal landscape (Table 4).
  • The AI concerns the aggregation of patches of a certain surface heat level [41]. It calculates the length of the common boundary between pixels in a certain level of the surface thermal landscape. When the common boundary value for all patches in the same level is largest, the aggregation index is largest, which means that the level of surface thermal integration is good. In some studies, the landscape distribution is relatively concentrated, while in others it is more scattered [43,44].
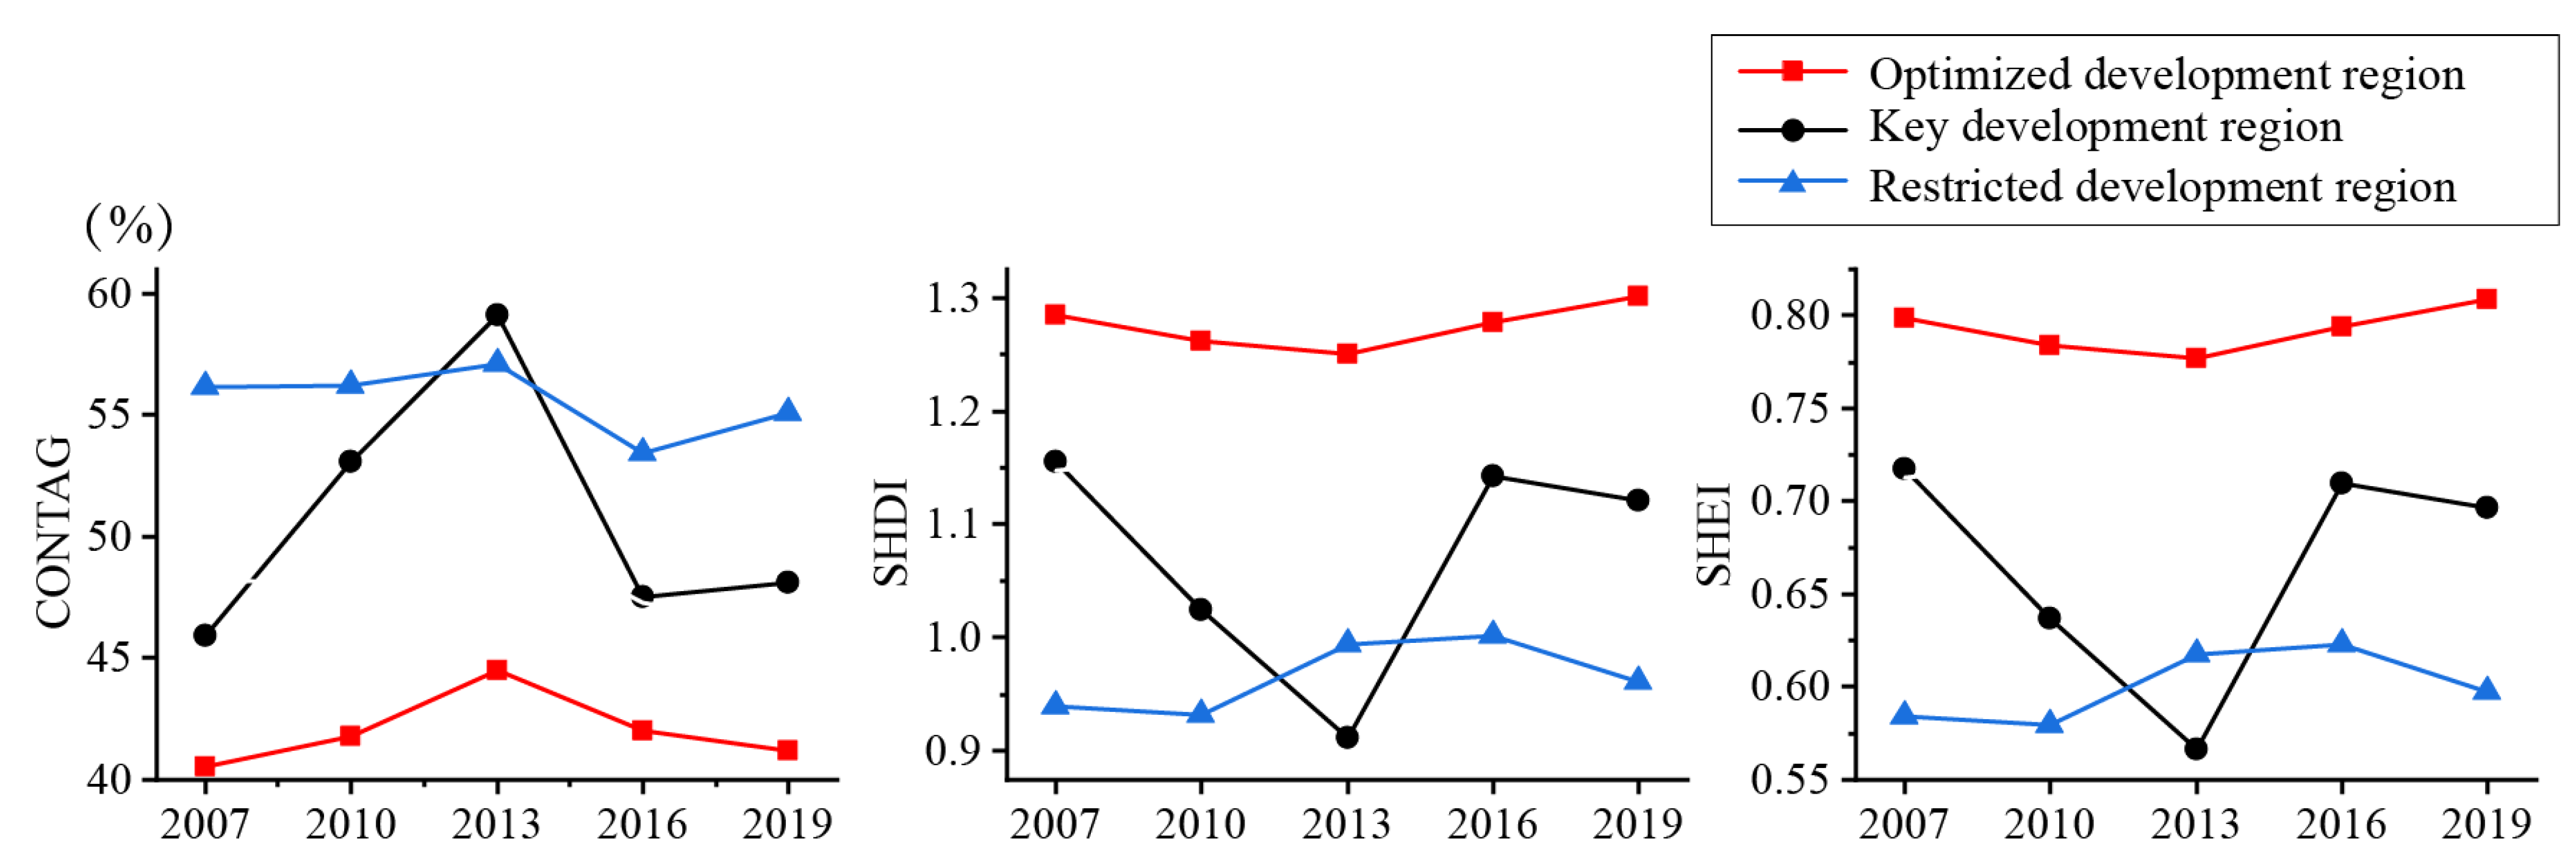
  • The CONTAG represents the trend in the extension of different surface heat levels throughout the entire landscape, and the discrete relationship between different patches [45]. When the CONTAG index increases, the connections between the dominant patches in the landscape are better. On the contrary, there are many types of patches in the landscape, and they are densely distributed, and the degree of fragmentation in the landscape is high.
  • The SHDI reflects the richness and complexity of the landscape pattern. When SHDI = 0, the landscape pattern is composed of patches of the same type. When the SHDI index increases, this means that the number of patch types increases, or the patch types are more evenly distributed in the landscape [46,47].
  • The SHEI reflects the uniformity of the distribution of patches in the landscape. In the study of surface heat, when the SHEI index increases, this indicates that heat levels of different types are homogeneously distributed throughout the entire landscape, and when it decreases, they are concentrated in some areas [47].

4. Results

4.1. The Universality of LST Rise

In 2007, about 85.54% of the Yangtze River Delta region was covered by sub-low- and middle-temperature zones; the sub-low-temperature zone accounted for about 42.60%, and the middle-temperature zones accounted for about 42.94%. The sub-high- and high-temperature zones accounted for only 14.46% (Figure 3 and Figure 4), mainly distributed in Shanghai, Nanjing, Hangzhou, Hefei, Suzhou (Jiangsu), Wuxi, Ningbo and other urban areas, forming scattered and independent patches; the sub-low- and low-temperature zones were mainly distributed in Jiangsu and northern Anhui, the hilly and mountainous areas in western and southern Anhui, the hills of western and eastern Zhejiang, the mountains of southern Zhejiang, and the regions with rivers and lakes, which are distributed continuously over a large area.
In 2010, the temperatures of the low-temperature zones decreased slightly, mainly located in northern Jiangsu, the thermal rating of which changed from low-temperature to sub-low-temperature, and the area of sub-low-temperature zones decreased significantly (to 28.09%). The sizes of middle-, sub-high- and high-temperature zone have increased compared with 2007, and their proportions have increased to 53.83%, 12.02%, and 2.05%, respectively. Most of the sub-low-temperature zones surrounded by middle-temperature zones has been upgraded to middle-temperature zones. The sub-high- and high-temperature zones are continuing to expand towards the peripheries of the cities, and a trend of continuous development has appeared.
In 2013, the areas of the sub-low-temperature zones continued to decrease, while the areas of the middle-, sub-high- and high-temperature zones continued to increase. The middle-temperature zones were more widely distributed, covering 58.19% of the total area of the Yangtze River Delta, and the mid-temperature area in southern Zhejiang has increased the most. The sub-high- and high-temperature zones in the western Hangzhou and Taihu Lake areas increased significantly.
In 2016, the proportion of low-temperature zones dropped slightly to 4.11%; the sub-low-temperature zones continued to decrease in size; the proportion of middle-temperature zones remained largely unchanged, while the sub-high- and high-temperature zones increased significantly, and the proportion of sub-low-temperature zones increased from 13.77% to 20.52%. Most areas in northern Jiangsu have changed from low- and sub-low-temperature zones to middle-temperature zones, but some areas in the mountainous region of southern Zhejiang came to show a lower thermal rating. The thermal rating of most areas around Taihu Lake increased, and the sub-high- and high-temperature zones were further strengthened. Around cities such as Nantong, Jinhua, Quzhou, Wenzhou and Taizhou (Zhejiang), high-temperature patches have gradually appeared. The warming effect in cities along the Yangtze River in Anhui is obvious, such as in Ma’anshan, Wuhu, Xuancheng, Tongling, Chizhou, Anqing, etc.
In 2019, the areas of the low-temperature zones remained unchanged, the areas of the sub-low- and middle-temperature zones decreased slightly, and the areas of the sub-high- and high-temperature zones continued to increase, to 22.0 and 6.43%, respectively. Compared with 2016, the area occupied by sub-high-temperature zones decreased to the west of Taihu Lake and along the Yangtze River in Anhui, but there was a significant increase in northern Anhui.
Overall, from 2007 to 2019, the proportions of low- and sub-low-temperature zones gradually decreased, and the proportions of middle-, sub-high- and high-temperature zones gradually increased. The low- and sub-low temperature zones were mainly distributed in the hills and mountains of northern Jiangsu, western and southern Anhui, western and eastern Zhejiang, southern Zhejiang, and around rivers and lakes. Northern Jiangsu is an important part of China’s coastal economic belt, an important node area of the “the Belt and Road”, an important region for economic growth in the Yangtze River Delta, and one of the fastest growing regions in China. Therefore, the effect of rising surface heat levels is relatively significant. The spatial pattern of urban development in the middle-, sub-high- and high-temperature zones exhibits a “Z”-shaped arrangement (Nanjing-Shanghai-Hangzhou-Ningbo) in the Yangtze River Delta; this has gradually expanded to peripheral areas and displays a continuous distribution trend.

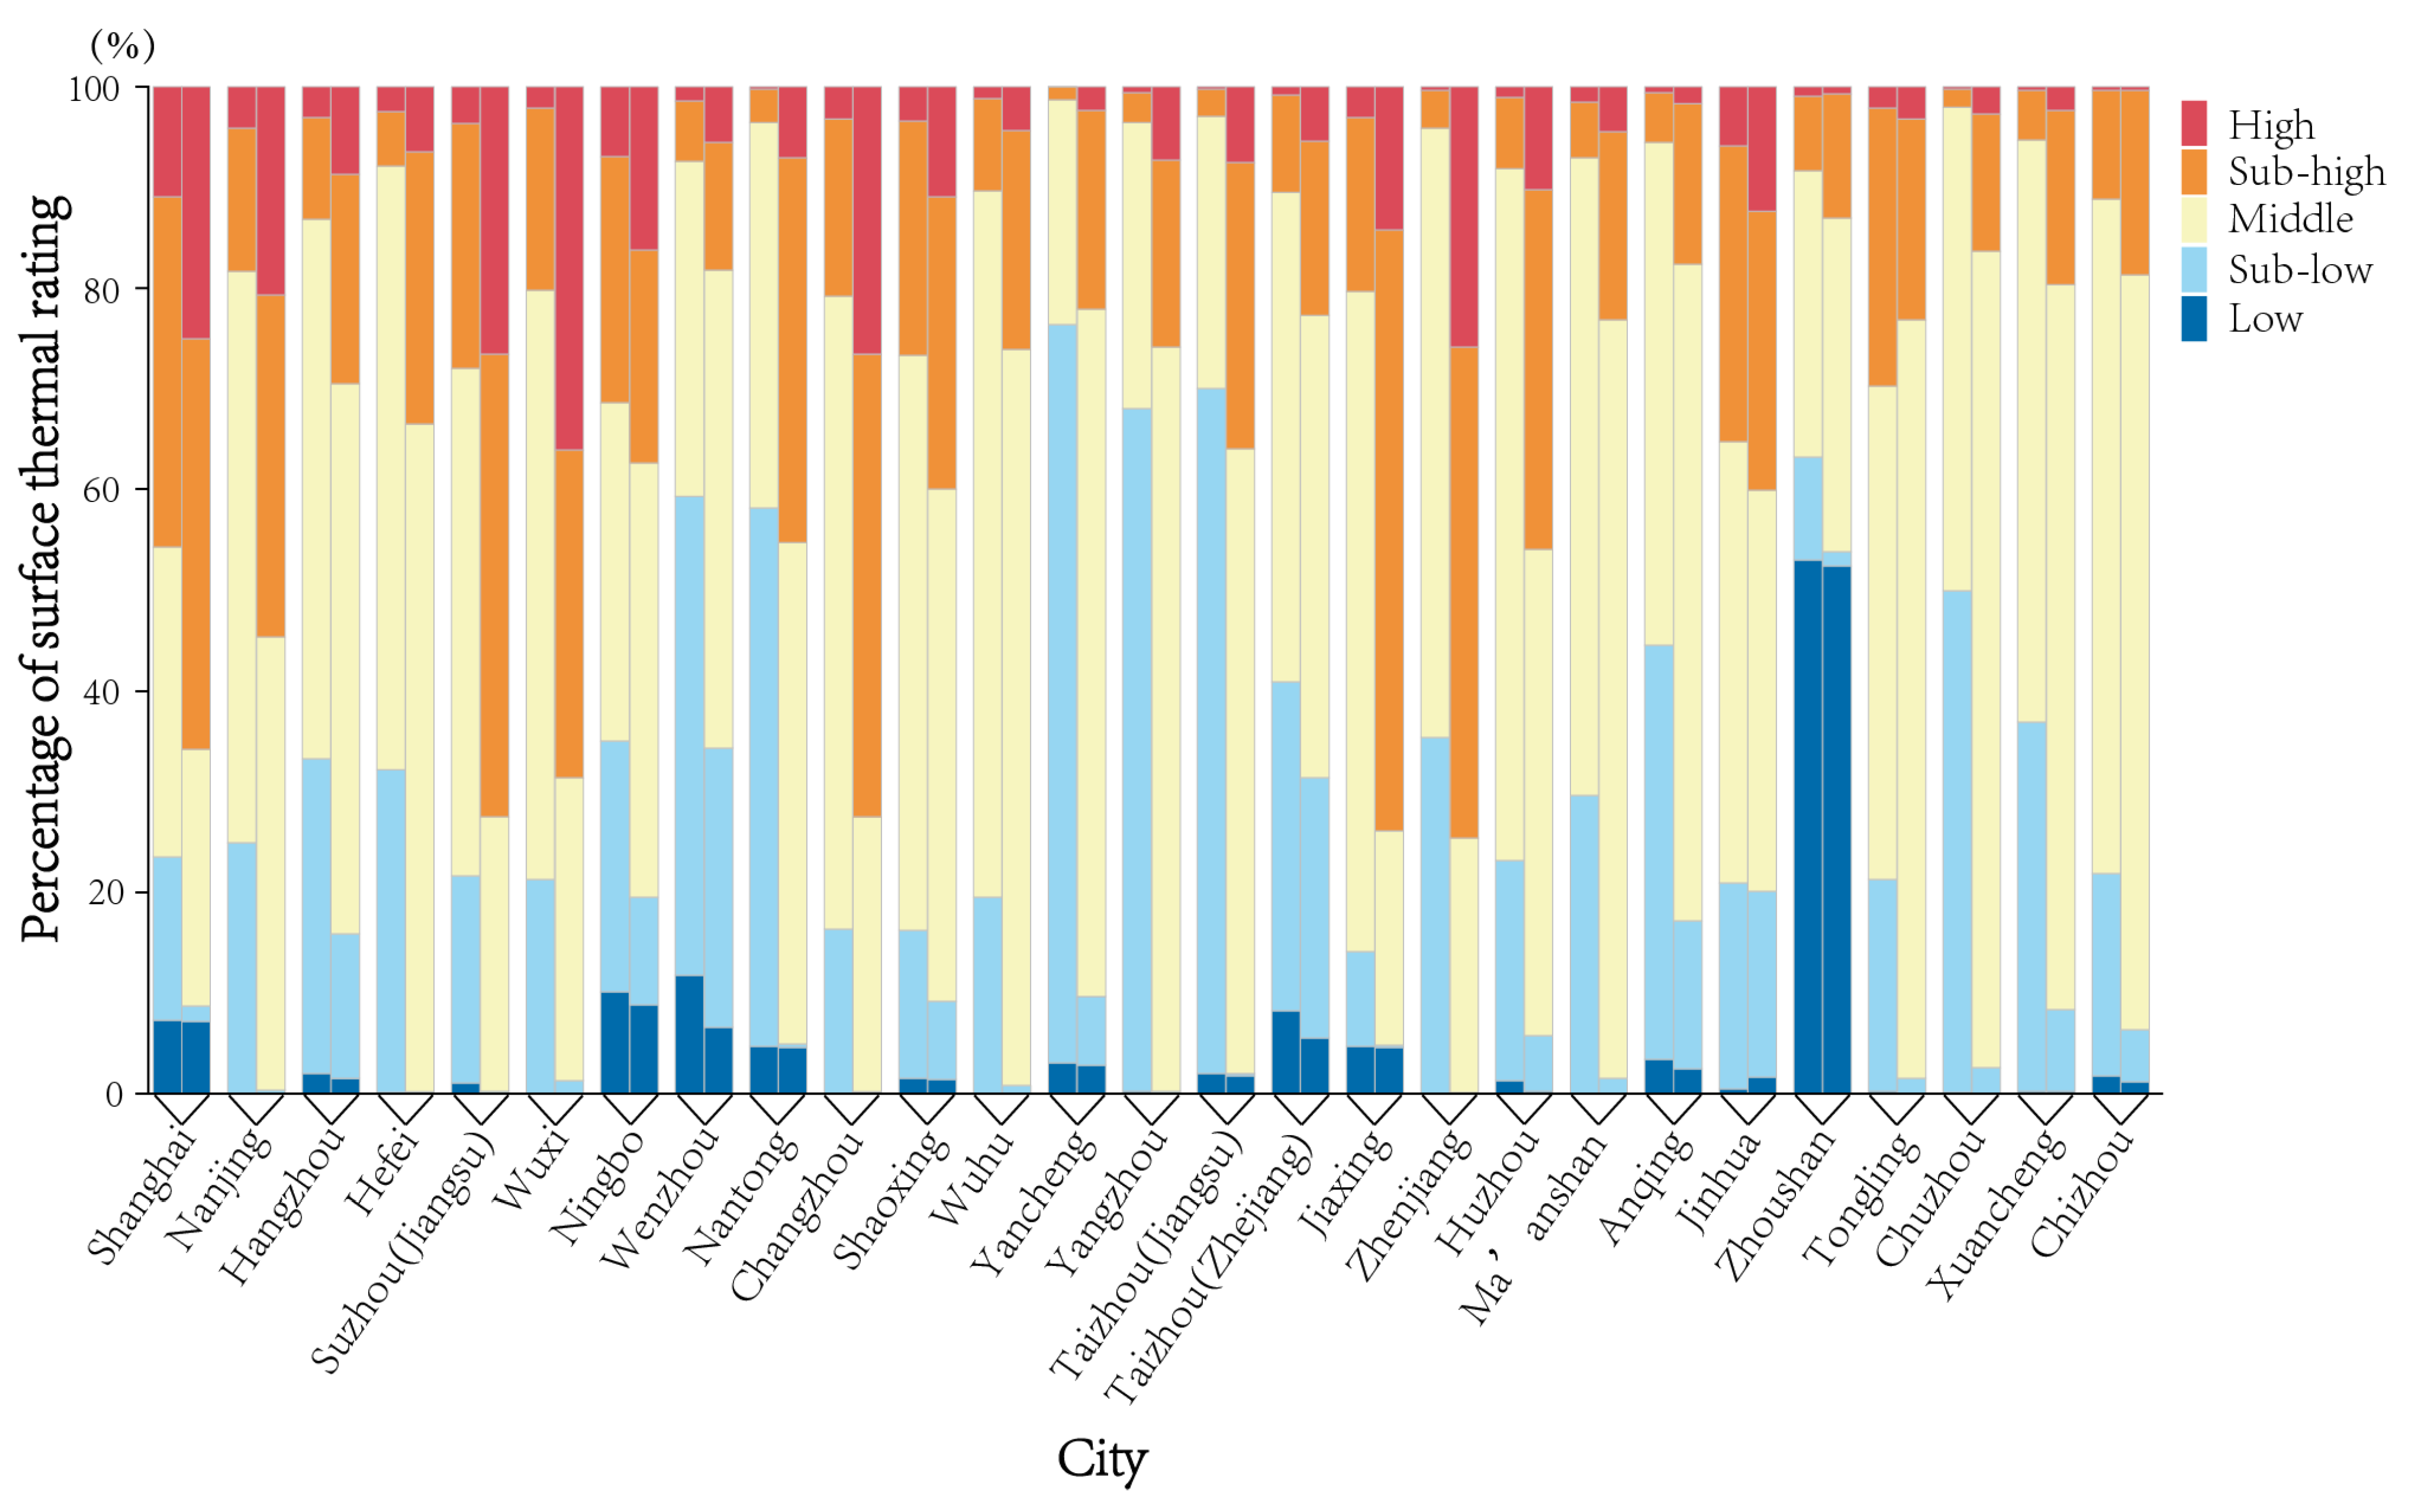
4.2. The Urban Hierarchical Order of LST Changes

There is an obvious relationship between LST changes and urban hierarchy: node cities around core cities display the most obvious temperature rise. The high-calorific value areas of high-level cities are broad and contiguous, while the high-calorific value areas of low-level cities are small and isolated.
From 2007 to 2019, among the 27 cities in the Yangtze River Delta region, the proportions of low- and sub-low-temperature zones showed a decreasing trend, except for in Jinhua (Figure 5). In total, 11 cities showed a decrease in their proportion of middle-temperature zones, including one super city (Shanghai), one mega city (Nanjing), one type I big city (Suzhou), four type II big cities (Wuxi, Changzhou, Shaoxing, Taizhou (Zhejiang)), and four medium-sized cities (Jiaxing, Zhenjiang, Huzhou, Jinhua). On the other hand, 16 cities showed increasing proportions, including two type I big cities (Hangzhou, Hefei), seven type II big cities (Wenzhou, Ningbo, Nantong, Wuhu, Yancheng, Yangzhou, Taizhou (Jiangsu)), three medium-sized cities (Ma’anshan, Anqing, Zhoushan), and four type I small cities (Tongling, Chuzhou, Xuancheng, Chizhou). The proportions of low- and sub-low-temperature zones showed a generally increasing trend, except for in Ningbo and Zhoushan.
We defined areas with a surface thermal rating >3 as high-calorific value areas. From 2007 to 2019, the nine cities with highest high-calorific value area ratio were Zhenjiang (71.14%), Jiaxing (53.70%), Changzhou (51.70%), Wuxi (48.44%), Suzhou (Jiangsu) (44.57%), Nantong (41.78%), Huzhou (37.90%), Nanjing (36.36%) and Taizhou (Jiangsu) (33.01%); except for Nanjing, which is a mega city, all of these are large and medium-sized cities. They are all distributed in peripheral areas around super cities and mega cities (Shanghai, Nanjing, Hangzhou), around Taihu Lake, or along the Yangtze River.

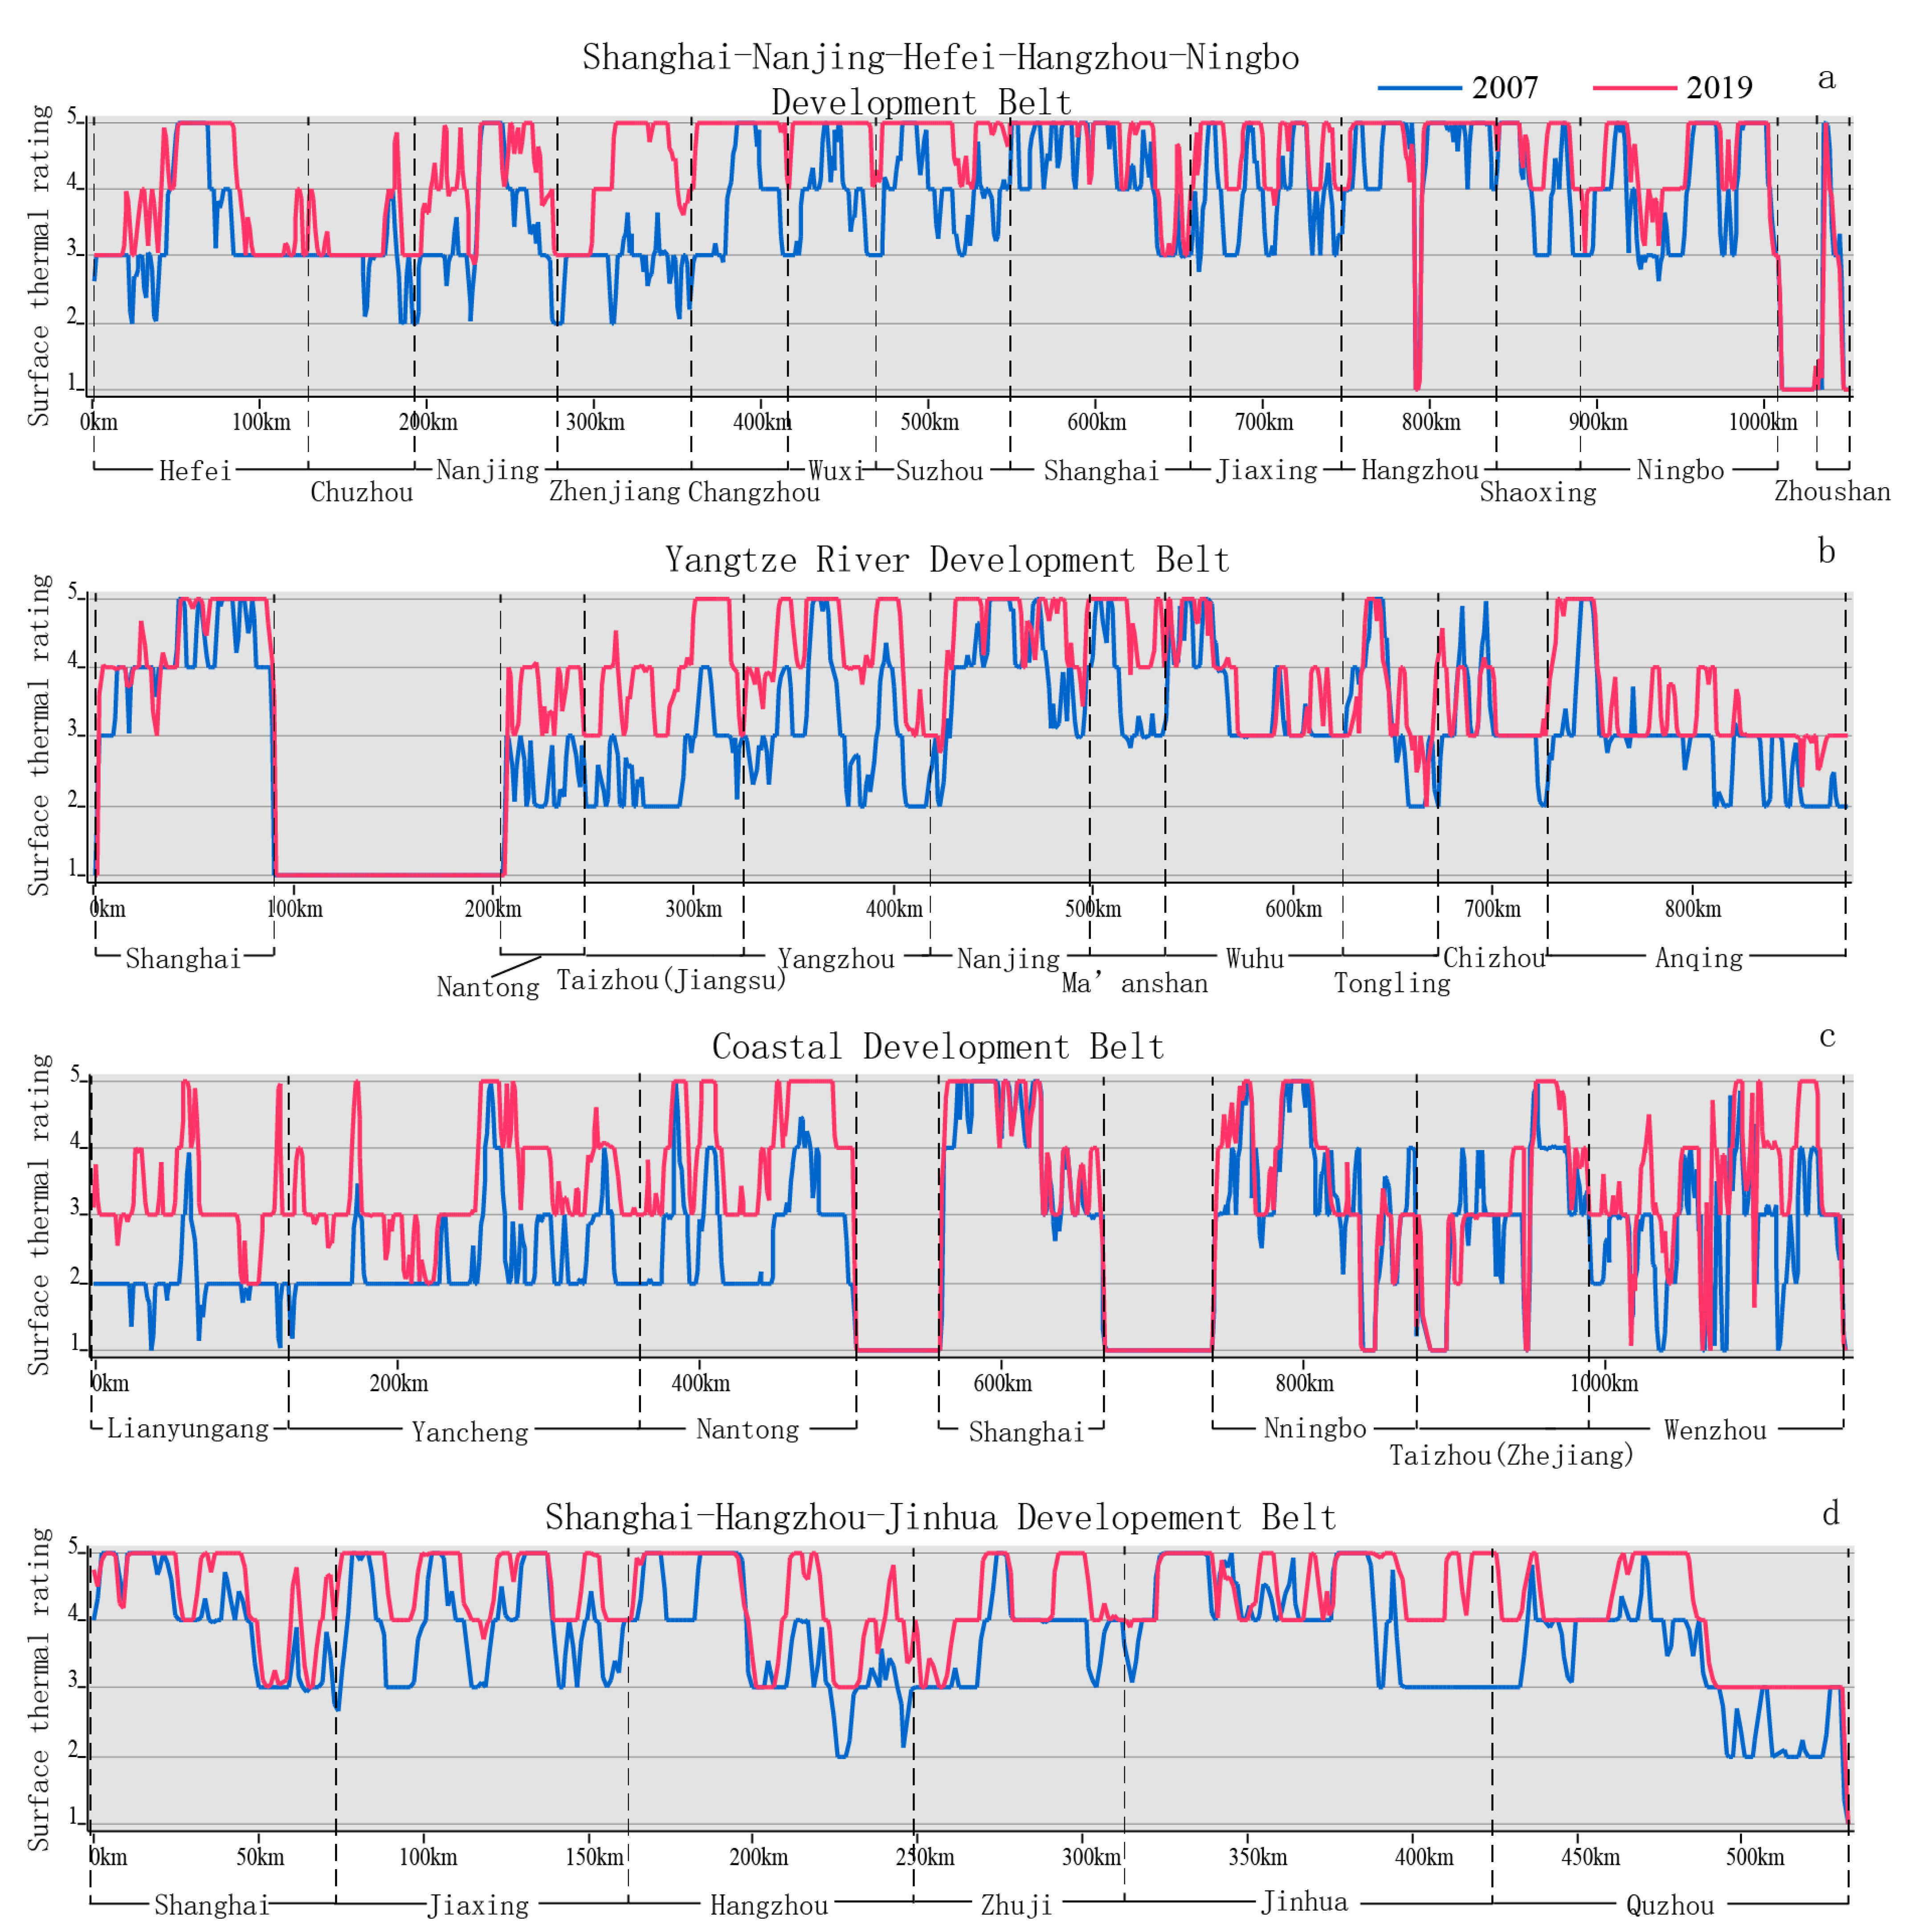
4.3. Corridor Effect of LST Changes

As shown in Figure 6a, in 2007, the high-calorific value areas of Shanghai and Hangzhou occupied a large stretch of the Shanghai–Nanjing–Hefei–Hangzhou–Ningbo Development Belt. As the main urban areas of Nanjing expanded along the Yangtze River, the high-calorific value areas of Nanjing along the Shanghai–Nanjing–Hefei–Hangzhou–Ningbo Development Belt slightly smaller, while the high-calorific value areas of Hefei and Changzhou were smaller than those of Shanghai and Hangzhou. The high-calorific value areas of cities such as Suzhou (Jiangsu), Wuxi, Ningbo, Shaoxing, Zhenjiang, and Jiaxing showed a narrower distribution, and each contain two or more high-calorific value centers. From 2007 to 2019, the surface thermal rating and the spatial distribution of high-calorific value areas along the Shanghai–Nanjing–Hefei–Hangzhou–Ningbo Development Belt showed an increasing trend, especially in the Nanjing–Shanghai–Hangzhou section, and the proportion of high-temperature areas increased significantly, which is consistent with the data for other cities where the high-calorific value has increased.
As shown in Figure 6b, relying on the Yangtze River Golden Waterway, the Yangtze River Development Belt is the main transportation corridor by which the Yangtze River Delta can expand inland, the main area of river–sea combined transportation below Nanjing, and the demonstration area of Wanjiang City Belt industrial transfer. In 2007, the cities with the largest areas with high calorific value were Shanghai and Nanjing, while around Yangzhou, Ma’anshan, Wuhu, Tongling, Chizhou, Anqing, etc., small areas of high-calorific value were formed. By 2019, Nanjing and the cities along the Yangtze River, such as Taizhou (Jiangsu), Yangzhou, and Ma’anshan, were warming significantly, forming a continuous region of high-temperature areas. Only inland areas such as Tongling, Chizhou, and Anqing were low-temperature areas.
As shown in Figure 6c, the Coastal Development Belt is relatively weak in the four regions, and especially northern Jiangsu and southern Fujian, that lack both deep-water ports and core cities; therefore, the north and south ends of the Belt are relatively deprived areas, except for the Hangzhou Bay coast. As reflected in the LST, in 2007, the large-scale high-calorific value areas were mostly found in Shanghai and Ningbo, followed by the type II big cities Yancheng, Nantong, Taizhou (Zhejiang), and Wenzhou. By 2019, the high-calorific value areas of Yancheng and Tongzhou significantly expanded, and the surface temperatures in coastal areas of northern Jiangsu and southern Fujian increased to varying degrees, although these areas still dominated by middle-temperature zones.
As shown in Figure 6d, the Shanghai–Hangzhou–Jinhua Development Belt relies on the Shanghai–Kunming Channel, connecting Shanghai, Jiaxing, Hangzhou, Jinhua, Quzhou, and other cities. The Hangzhou–Jinhua–Quzhou section is mainly located in the Jinqu Basin and proceeds northeast–southwest, and the high-calorific value areas in this region are large. In 2007, the large-scale high-calorific value areas were concentrated mostly in Jinhua, followed by Zhuji and Quzhou. By 2019, the sizes of the Zhuji, Jinhua, and Quzhou high-calorific value areas had increased, and high-calorific patches appeared between Zhuji and Yiwu and between Jinhua and Quzhou.
On the whole, the high-calorific value areas of cities in the Yangtze River Delta have continuously expanded over time, and expanded along four corridors, forming a trend of the continuous spread of high-temperature zones with a significant corridor effect. Out of the four corridors, along the Shanghai–Nanjing–Hefei–Hangzhou–Ningbo Development Belt and the Yangtze River Development Belt, which both have many cities connected in series, the surface heat level is generally higher, and the surface warming effect is obvious. In contrast, the Coastal Development Belt and the Shanghai–Hangzhou–Jinhua Development Belt contain fewer cities, with low levels and small scales of urban expansion, so the general surface heat here is low, and the surface warming effect is not significant.

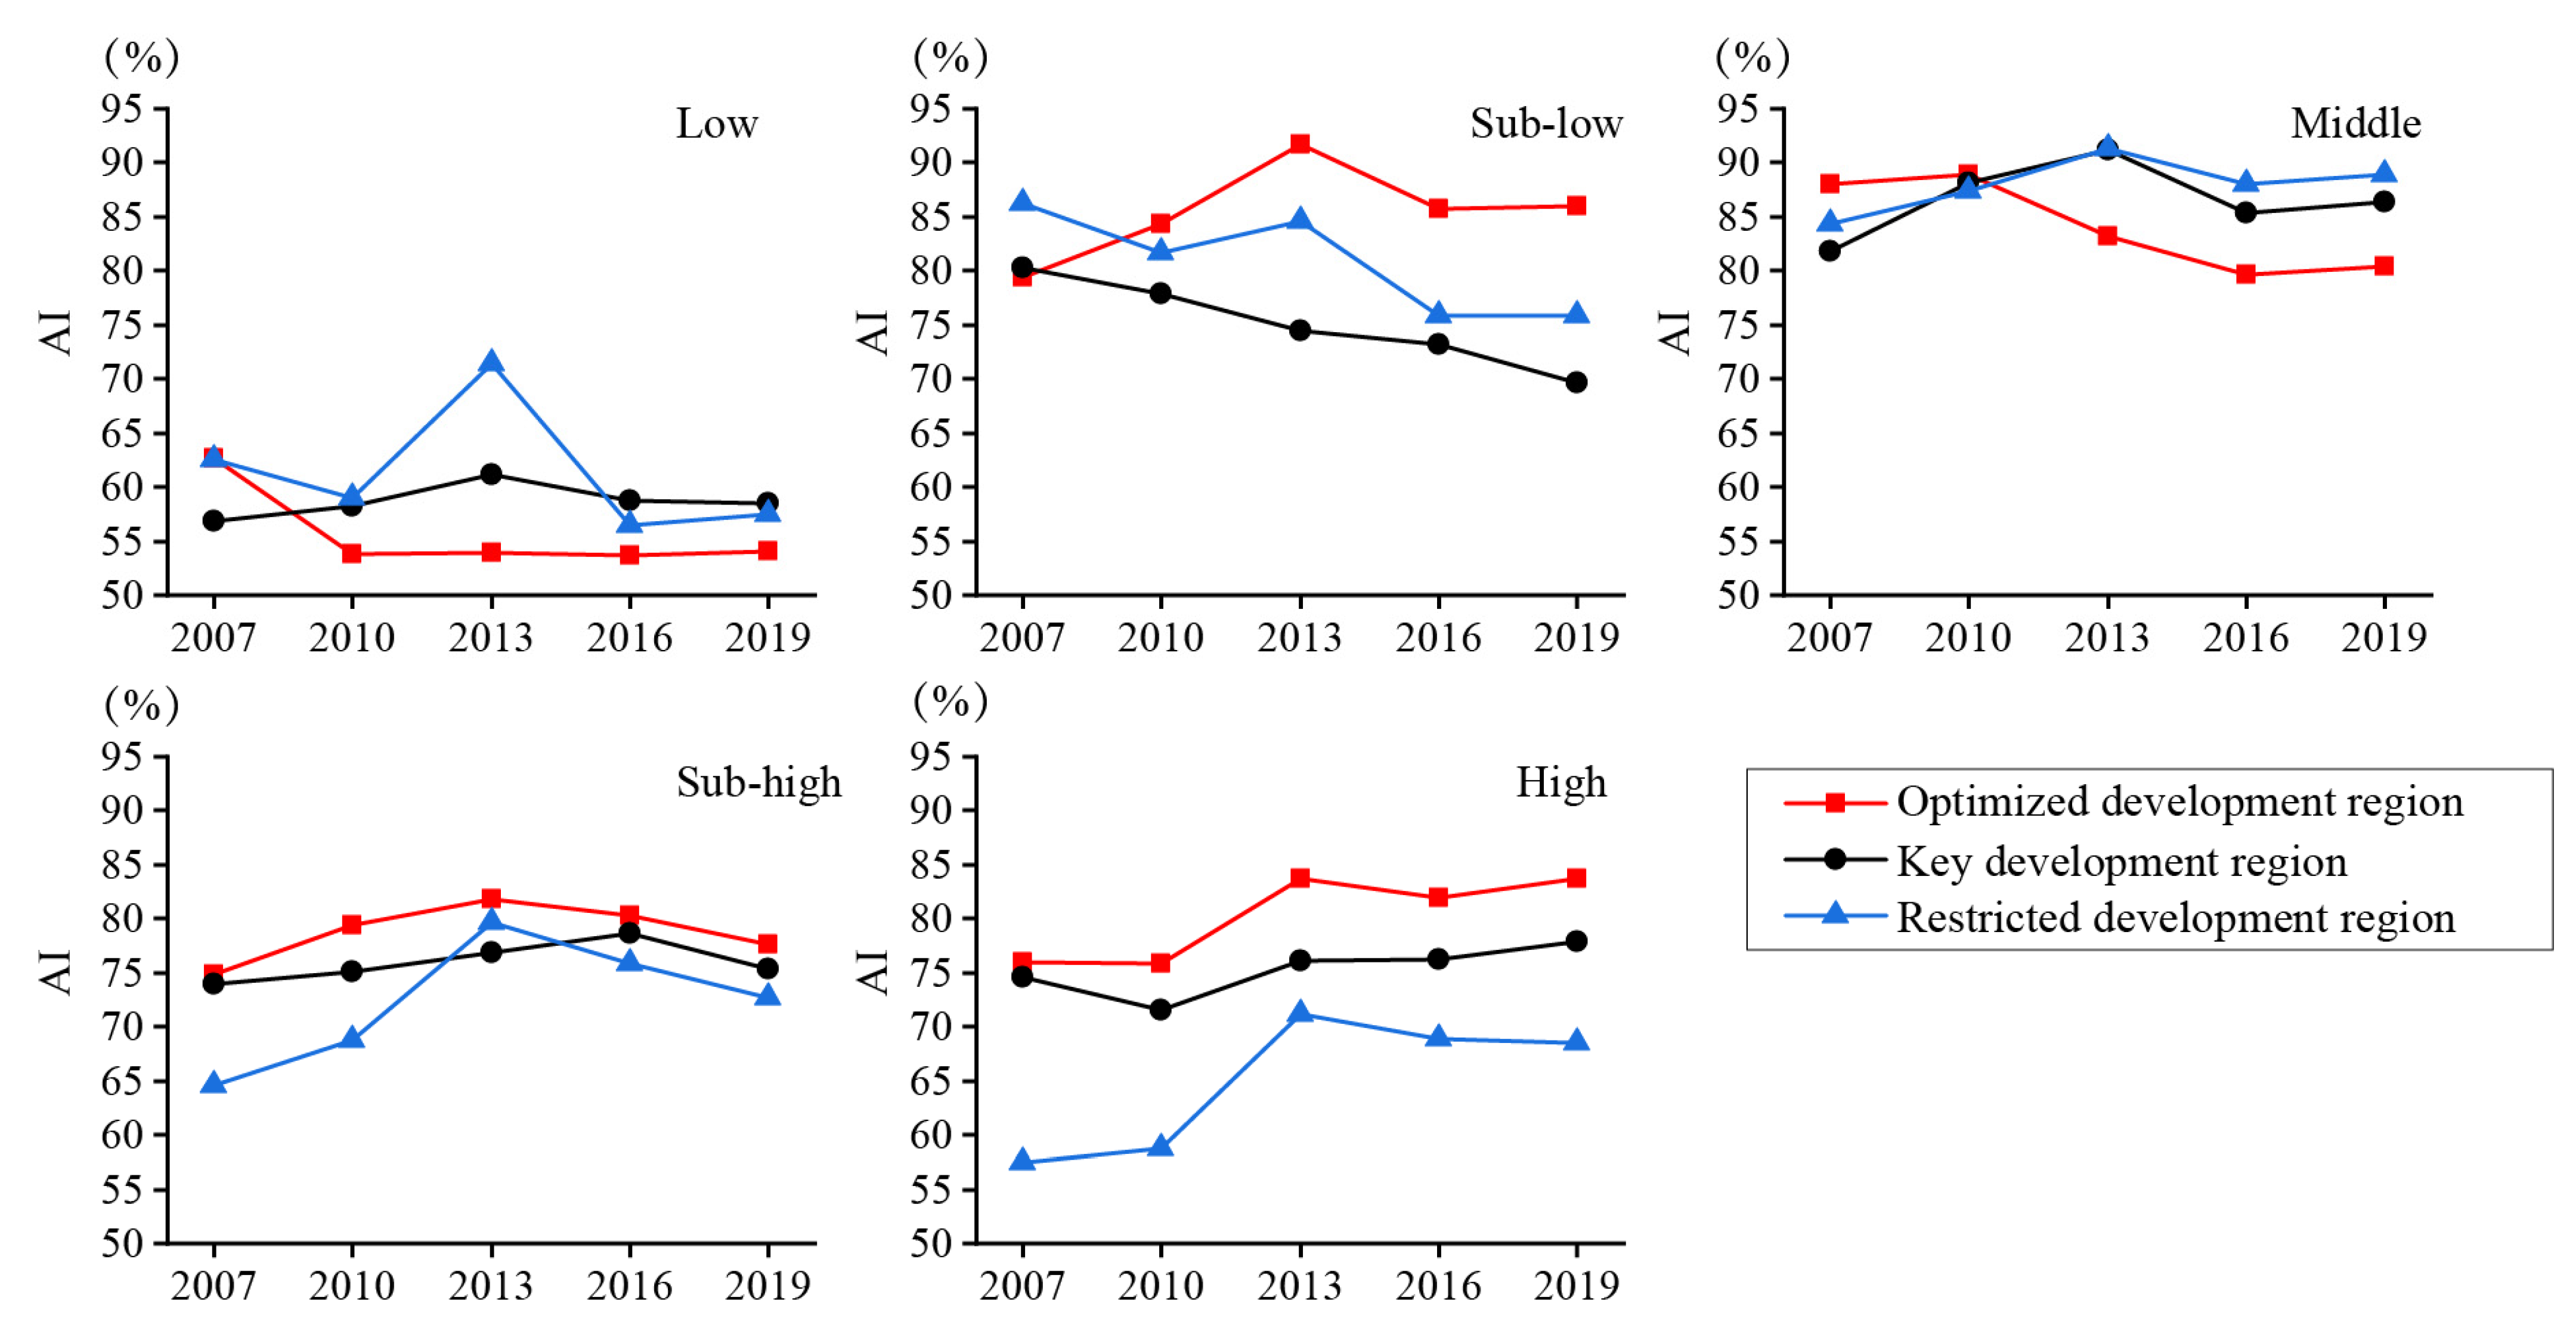
4.4. Regional Differences of LST Changes

In the Development Plan for the Yangtze River Delta Urban Agglomeration, based on the main functional plan for the zone, the land development intensity, the development direction, and the suitability of the population agglomeration and urban–rural construction, the land is divided into three types: optimized, key, and restricted development regions (Figure 7). Different development regions manifest different trends in the Aggregation Index (AI), Contagion Index (CONTAG), Shannon’s Diversity Index (SHDI), and Simpson’s Diversity Index (SHEI).
As shown in Figure 8, the AI of the high- and sub-high temperature zone showed restricted, key and optimized development regions, from high to low; the overall AI index in the middle- and low- temperature zones does not change significantly; the AI of the sub-low-temperature zones showed primarily optimized, restricted and key development regions, from high to low. Judging from the differences in changes in different temperature zone, the AI in the high- and sub-low-temperature zones has changed significantly in the three development regions in the past 12 years, while the AI in the other three temperature types has not changed significantly. Among them, the AI of the three development regions in the high-temperature zone has shown an upward trend year by year. The area where the high-temperature zone is located is generally the city center. With the rapid progress of urbanization in the Yangtze River Delta and the continuous expansion of urban dense areas, discrete high temperature patches are gradually connected through corridors, making the AI increase year by year. The performance of this trend optimized development zone is the most significant. The AI of sub-low-temperature zones in key and restricted development region shows a downward trend. This is mainly due to the fact that the key and restricted development regions have undertaken many enterprises that have been transferred from the original optimized development regions. As industries, population, and transportation continue to gather in cities and towns, the urban space continues to expand. Urban high-temperature grade patches are broken, leading to a downward trend in the AI, while the optimized development region as a whole shows an upward trend year by year. The reason is that this type is mainly distributed in the areas around Taihu Lake, such as Suzhou, Wuxi, Jiaxing, and Huzhou. With the rapid development of the Taihu Lake area, especially the cities on the east side, the sub-low temperature patches in the marginal areas of the original cities have gradually been invaded by the high temperature patches. the distribution area of sub-low-temperature is becoming less and less, and the middle- or even the sub-high-temperature zone invades the east side of Taihu Lake, and the AI rises.
As shown in Figure 9, the CONTAG is lowest in the optimized development regions and highest in the restricted development regions; the SHDI and SHEI are highest in the optimized development regions and lowest in the restricted development regions. This shows that the thermal landscape of the optimized development region is highly fragmented, while the overall thermal landscape of the restricted development zone is better, and the complexity and richness of the landscape type are not as good as the optimized development region. The key development zone is between the former two. Over the past 12 years, the CONTAG of the optimized development region first increased and then decreased, while the SHDI and SHEI first decreased and then increased, indicating that the degree of thermal landscape pattern fragmentation in the optimized development regions first decreased and then increased. The fragmentation of thermal landscape in key development regions fluctuated greatly. In 2013, the middle-temperature zone accounted for 71.31% of the area of the key development region, and the degree of fragmentation of the thermal landscape was minimized. After 2013, as the area of the middle-temperature zone decreased, its leading role in the thermal landscape decreased year by year, and the thermal landscape is gradually developing in the direction of diversification and fragmentation. The CONTAG of the restricted development region generally showed a downward trend, while the SHDI and SHEI show an upward trend, and the landscape pattern tended towards fragmentation. It shows that the types of urban thermal landscape patches are increasing, and the distribution of landscape area among various types tends to be even. This trend is most significant in optimized development zones.

5. Discussion

Global climate change and the intensification of urbanization have had a strong impact on the urban environment [9]. As an important aspect of these impacts, urban land surface thermal landscape has changed urban climate and air quality, and seriously threatened the health of urban residents. Therefore, the research on land surface thermal landscape based on the process of urbanization has attracted extensive attention of scholars [48].
Urban agglomeration has become a distinctive feature worldwide over recent decades [49,50,51], it are an inevitable outcome of industrialization and urbanization. Compared with a single city, it has more complex functions and structures. An urban agglomeration can cause a significant change in the thermal environment over a wide region compared to that generated by individual cities [52,53,54]. However, most studies are limited to the perspective of a single city, ignoring the impact of urban agglomeration [55]. In previous research studies, it has been determined that urbanization is one of the significant drivers of LST alteration across the world [56,57,58].
However, so far, an investigation of the spatiotemporal variation of regional thermal environment in urban agglomerations has not been carried out in detail, little is known about the spatiotemporal patterns and evolution of the LST. Therefore, a detailed research of the spatiotemporal evolution of the LST in urban agglomerations are crucial for the government to take more environment-friendly action in order to address adapted plans for mitigation and adaptation to these issues [53]. It has been widely acknowledged that urban agglomeration significantly enhances the LST [59,60,61]. However, the effect of LST involves all stages of development: single city, mega city and city agglomeration. Studies concerning this phenomena have so far largely focused on large cities, or on a single area within a city [62].

5.1. Spatial Differentiation of Thermal Environment in Urban Agglomerations

Compared with a single city, urban agglomeration involves more cities and larger regions. Therefore, LST effect is not only reflected in cities, but also in regions. The spatiotemporal changes of LST effect are more complex. In urban agglomeration areas, not only the high-temperature zones around core cities and important node cities are expanding, but also the high-temperature zones of adjacent cities tend to integrate into one; Along the complex traffic corridor, the high-temperature zone is also gradually integrated, and the corridor effect is very obvious. In the Pearl River Delta Metropolitan Region (PRDR), the isolated urban heat islands were gradually connected and interacted with each other, forming the regional heat island [63]. This is consistent with the research results of this paper (Figure 6). In Chengdu-Chongqing urban agglomeration, the heat island intensity in megacities was greater than other cities, and a significant correlation was observed between the built-up area and the daytime heat island intensity [64]. However, the high temperature center is not necessarily located in the city center, may be distributed in industrial areas and commercial intensive areas [65,66]. In Shanghai, except the city center, the intensive industrial parks at the urban fringe, docks and harbors, and major satellite towns outside the outer rings exhibited higher LST and remarkable variation in LST.
Many results show that LST generally decreases from the urban center to the suburb (or surrounding rural areas), and the low temperature is generally distributed in the area where a large area of green space and water body are located [67], this study also draws the same conclusion (Figure 3 and Figure 4). Initial observations of LST in recent years have indicated that LST has tended to increase in both urban and suburban areas [68].
There are also spatial differences in thermal landscape pattern changes. The degree of aggregation of high-level thermal landscape types is on the rise, the distribution of thermal landscape area among various types gradually tends to be even [69]. Similar conclusions were reached in this study (Figure 8 and Figure 9).

5.2. The Causes of Changes in Urban Thermal Environment

LST is a very important parameter in surface energy balance which associated with some dominant LUCC types. Urban agglomeration development has significantly transformed natural and semi-natural surfaces into impervious structures, which has disturbed the balance of the earth’s surface radiation and energy [63,70,71], leads to large-scale LUCC that result in changes to physical properties [72]. Many results confirmed the most obvious dependence of the LST on different land cover types [73]. The surface thermal distribution is seriously affected by the impervious surface coverage and vegetation coverage [74].
Urbanization, which is a form of land cover, occupies less than 2% of the global land surface, evidence shows that human disturbance due to urbanization has significantly altered the natural landscape all over the world. Due to urbanization and industrialization, the number of built-up areas are increasing and replacing the vegetation and land cover area. Human activity has led to an increase in impervious surfaces, a decrease in vegetated areas, and a rise in greenhouse gas emissions [75,76,77], which has resulted in an increase in the occurrence of urban heat island globally. The urban heat island is a condition wherein the temperature within an urban agglomeration is higher than that of the surrounding rural localities. LUCC are significant factor for the spatiotemporal variation of LST [78,79,80]. Natural land surfaces are gradually replaced by impervious surfaces [81], this change leads to different exchange processes of water, substances and energy between the land surface and the atmosphere. A larger urban area generally has more impervious surfaces, which can absorb more heat and raise the urban temperature [82]. Larger urban areas always mean a developed regional economy and higher energy consumption, which can expand the temperature gap between urban and suburban areas and increase the LST intensity.
LST is closely related to land cover types, meteorological conditions, anthropogenic heat sources, the size of the urban area, urban morphology [83]. Urban centers and industrial areas are generally high-temperature centers; on the other hand, the river, surface water reservoirs, forests, bigger city parks and wooded cemeteries are generally characterized by much lower temperatures than the average. Land cover type pattern are the consequence of different thermal properties of surfaces (conductivity and capacity); The vegetation cycle causes seasonal changes of thermal properties of particular land cover classes; Land relief and building structure insolated slopes and parts of buildings are warmer whereas shadowed surfaces are colder, creating a positive daytime energy balance of street canyon structure [73].
With the rapid urban expansion, many neighboring cities are socially and economically connected, and the infrastructure networks are interconnected, thereby forming a huge urban agglomeration [49]. The special micro-climate effect forms and introduces higher temperatures in the urban area than its surroundings. Higher levels of energy consumption indicate higher LST intensity [84]. The LST are not only influenced by land cover patterns and process but also significantly dominated by the specific land conversion processes [63].
In the Pearl River Delta Metropolitan Region, the cooling effects of ecological land loss and gain are significantly different, which provides evidence that the existing natural ecosystems (especially forests) are valuable for climatic adaptation because newly constructed ecological land does not provide the same cooling effect, the relationship between urbanization rate and temperature may conform to the Environmental Kuznets Curve [63]. In the Yangtze River Delta Urban Agglomeration, urban areas were significantly positively correlated with LST intensity, while the average wind speed and precipitation was significantly negatively correlated with LST intensity [52]. In the Central Guizhou urban agglomeration, about 96.8% of the regional area NDVI is negatively correlated with LST, and about 3.2% of the regional area is positively correlated [85]. In the Chang-Zhu-Tan urban agglomeration, 80.825% of all the pixels has changed to impervious areas [86].
In addition, the active factory may influence the changed pattern of LST. It was well documented that with the rapid urbanization and population growth, increase in built-up land and replace of natural lands with artificial buildings altered surface energy budgets, and may affect local, regional, and global climate by changing the surface physical properties [87]. LST has been usually regarded as the local or meso-scale climatic phenomenon associated with human activities, there were significant relationships between LST and fractional vegetation cover, population density, and road density [66]. In Shenyang, the built-up area has doubled in 1986–2007, most of which is converted from croplands around the urban fringe area. The built-up area has close association with the population increase, the gross domestic production, and fixed asset investments [74]. During this period, large amounts of impervious surfaces have replaced the semi-natural and natural landscape, especially in the high-rise city proper and newly emerging industrial parks as well as intensive residences along the outer traffic ring [66]. Over the past one decade many residents in CBD removed to the urban fringe and the surrounding satellite towns, owing to the recent urban regeneration. Thus, population density in the CBD significantly decreased and the former residences gave the way to newly emerging green spaces. Old residences in the city center were demolished, this resulted in significant population agglomeration and enhancement of infrastructures in the urban fringe and suburban towns [88]. Therefore, the former boundary between suburban satellite towns and the city center became unclear, and the urban form has shifted from the single-core to the hybrid of multi-nuclei and multiple axis-based sprawl.

6. Conclusions

This paper has analyzed the spatiotemporal differentiation characteristics of the surface thermal landscape in the Yangtze River Delta for the past 12 years, using MODIS surface temperature data. The research conclusions are as follows:
From 2007 to 2019, the LST in the Yangtze River Delta region generally increased (the proportion of middle-, sub-high- and high-temperature zones increased by 33.42%), and the higher temperature areas gradually expanded into their peripheral areas in accordance with the “Z”-shaped spatial pattern (Nanjing-Shanghai-Hangzhou-Ningbo) of urban development in the Yangtze River Delta. The relationship between LST changes and city hierarchy was apparent, in that the node cities around the core cities underwent a large temperature increase (Zhenjiang (71.14%), Jiaxing (53.70%), Changzhou (51.70%), Wuxi (48.44%), Suzhou (Jiangsu) (44.57%), Nantong (41.78%), Huzhou (37.90%), Nanjing (36.36%) and Taizhou (Jiangsu) (33.01%)), the high-calorific value areas of high-level cities were wide and contiguous, and the high-calorific value areas of low-level cities were small and isolated. The corridor effect of thermal changes on the surface was very significant, forming a trend of reciprocal integration and development. Among said corridors, the Shanghai–Nanjing–Hefei–Hangzhou–Ningbo Development Belt and the Yangtze River Development Belt showed obvious warming effects, followed by the Coastal Development Belt and the Shanghai–Hangzhou–Jinhua Development Belt. The changes in the surface thermal landscape index were subject to regional differences, The more significant change is the decrease in the degree of agglomeration in the sub-low-temperature zone (The AI of the sub-low-temperature zone in key development region dropped from 80.35 to 69.63); the degree of agglomeration in the high-temperature zone gradually increases (The AI of the high-temperature zone in the optimized development region increased from 75.94 to 83.68). The patch type of thermal landscape pattern increases, and the distribution of landscape area among various types tends to be even. This phenomenon is most significant in optimized development region (In 2019, the SHDI and SHEI were as high as 1.3015 and 0.8087 respectively).

Author Contributions

Conceptualization, T.W. and L.W.; methodology, T.W. and L.W.; software, T.W.; formal analysis, H.L.; investigation, T.W.; resources, T.W.; data curation, T.W.; writing—original draft preparation, T.W.; writing—review and editing, L.W. and H.L.; visualization, T.W.; supervision, H.L. All authors have read and agreed to the published version of the manuscript.

Funding

This research received no external funding.

Institutional Review Board Statement

Not applicable.

Informed Consent Statement

Not applicable.

Data Availability Statement

The data used in this study come from the MODIS data provided by NASA (https://ladsweb.modaps.eosdis.nasa.gov/search/ (accessed on 15 October 2020)).

Conflicts of Interest

The authors declare no conflict of interest.

References

  1. Li, B.C. China’s urban ecological environment problems and sustainable development. J. Arid Land Resour. Environ. 2006, 2, 1–6. [Google Scholar]
  2. Shao, Q.Q.; Sun, Z.Y.; Liu, J.Y.; Ban, Y.F.; He, J.F.; Kuang, W.H. The influence of China’s urban expansion on temperature observation and its overestimation. Acta Geogr. Sin. 2009, 64, 1292–1302. [Google Scholar]
  3. Ning, Q.M.; Ouyang, H.Y.; Tang, F.H.; Zeng, Z.W. Spatio-temporal evolution of landscape pattern in Dongting Lake area affected by land use change. Econ. Geogr. 2020, 40, 196–203. [Google Scholar]
  4. Yang, Q.K.; Duan, X.J.; Wang, L.; Wang, Y.Z. Research on the Interactive Mechanism of Urban Land Use and Ecological Environment Effects in the Yangtze River Delta. Prog. Geogr. 2021, 40, 220–231. [Google Scholar] [CrossRef]
  5. Wu, L.J.; Liu, Y.X.; Tong, X. Dynamic evolution analysis of land use (land cover) in Horqin Sandy Land based on long time series landsat data. Acta Ecol. Sin. 2020, 40, 8672–8682. [Google Scholar]
  6. Xie, Q.J.; Liu, J.H.; Hu, D.H. The influence of Wuhan’s urban expansion on the spatio-temporal evolution of the thermal field. Geogr. Res. 2016, 35, 1259–1272. [Google Scholar]
  7. Duman, T.; Huang, C.W.; Litvak, M.E. Recent land cover changes in the Southwestern US lead to an increase in surface temperature. Agric. For. Meteorol. 2021, 297, 108246. [Google Scholar]
  8. Edan, M.H.; Maarouf, M.R.; Hasson, J. Predicting the impacts of land use/land cover change on land surface temperature using remote sensing approach in Al Kut, Iraq. Phys. Chem. Earth 2021, 123, 103012. [Google Scholar] [CrossRef]
  9. Xiao, R.B.; Ouyang, Z.Y.; Li, W.F.; Zhang, Z.M.; Terver, J.G.; Wang, X.K.; Miao, H. Eco-environmental effects of urban heat islands. Acta Ecol. Sin. 2005, 25, 2055–2060. [Google Scholar]
  10. Hong, Y.X.; Wang, Z.; Zeng, G.; Teng, C.W.; Li, Z.; Wang, X.J.; Yu, H.S.; Li, N.; Zhang, Y. The New Trend of Integration in the Yangtze River Delta. Shanghai Econ. 2018, 4, 122–148. [Google Scholar]
  11. Yao, S.M.; Xu, L.T.; Zheng, T.; Ma, L.Y. The Mechanism and New Ideas of the Rapid Growth of China’s Urban Agglomerations—Taking the Yangtze River Delta Urban Agglomeration as an Example. Hum. Geogr. 2020, 35, 11–18. [Google Scholar]
  12. Beng, B.F.; Shi, Y.S.; Wang, H.F.; Wang, Y.L. The impacting mechanism and law of urban heat islands effect: A case study of Shanghai. Acta Geogr. Sin. 2013, 68, 1461–1471. [Google Scholar]
  13. Wang, Y.; Umberto, B.; Hashem, A. The Urban Heat Island Effect in the City of Toronto. Procedia Eng. 2015, 118, 137–144. [Google Scholar] [CrossRef] [Green Version]
  14. Kleerekoper, L.; Esch, M.V.; Salcedo, T.B. How to make a city climate-proof, addressing the urban heat island effect. Resour. Conserv. Recycl. 2012, 64, 30–38. [Google Scholar] [CrossRef]
  15. William, D.; Solecki; Cynthia, R.; Lily, P.; Greg, P.; Maria, C.; Jennifer, C.; Mary, W. Mitigation of the heat island effect in urban New Jersey. Environ. Hazards 2005, 6, 39–49. [Google Scholar]
  16. Gupta, J.; Vegelin, C. Sustainable development goals and inclusive development. Int. Environ. Agreem. Politics Law Econ. 2016, 16, 433–448. [Google Scholar] [CrossRef] [Green Version]
  17. United Nations (UN). Transforming Our World: The 2030 Agenda for Sustainable Development; General Assembley 70 Session; United Nations (UN): New York, NY, USA, 2015. [Google Scholar]
  18. Yao, Y.; Chen, X.; Qian, J. Research Progress of Urban Surface Thermal Environment. Acta Ecol. Sin. 2018, 38, 1134–1147. [Google Scholar]
  19. Li, T.W.; Sun, Y.Q.; Yang, C.X.; Li, M.X.; Zeng, C.; Shen, H.F. Regional PM2.5 inversion based on fusion of satellite remote sensing and ground station. J. Geomat. 2015, 40, 6–9. [Google Scholar]
  20. Chen, Y.H.; Li, X.B.; Shi, P.J.; He, C.Y. Analysis on the Spatial Pattern of Shanghai Urban Thermal Environment. Sci. Geogr. Sin. 2002, 22, 317–323. [Google Scholar]
  21. Qiao, Z.; Huang, N.Y.; Xu, X.L.; Sun, Z.Y.; Wu, C.; Yang, J. The temporal and spatial differentiation characteristics and evolution law of Beijing’s surface thermal landscape from 2003 to 2017. Acta Geogr. Sin. 2019, 74, 475–489. [Google Scholar]
  22. Yue, W.Z.; Xu, L.H. A Study on the Thermal Environment Effect of Urban Land Use Types and Patterns—A Case Study of the Central City of Shanghai. Sci. Geogr. Sin. 2007, 4, 243–248. [Google Scholar]
  23. Worku, G.; Teferi, E.; Bantider, A. Assessing the effects of vegetation change on urban land surface temperature using remote sensing data: The case of Addis Ababa City, Ethiopia. Remote Sens. Appl. Soc. Environ. 2021, 22, 100520. [Google Scholar]
  24. Xia, R.; Li, Y.H.; Wang, Q.; Wang, Y.F.; Jin, X.; Xu, E.H. Remote Sensing Analysis of Urban Expansion and Heat Island Response in Wuxi City. J. Geo-Inf. Sci. 2009, 11, 5677–5683. [Google Scholar]
  25. Zhang, M.H.; Dong, S.C.; Cheng, H.; Li, F.J. Spatio-temporal evolution of urban thermal environment and its driving factors: Case study of Nanjing, China. PLoS ONE 2021, 16, e0246011. [Google Scholar]
  26. Han, D.R.; Xu, X.L.; Li, J.; Sun, X.H.; Qiao, Z. Research on the Thermal Environment Security Pattern and the Impact of Land Use Change in the Urban Agglomeration of the Yangtze River Delta. J. Geo-Inf. Sci. 2017, 19, 39–49. [Google Scholar]
  27. Wan, Z.; Zhang, Y.; Zhang, Q.; Li, Z.L. Quality assessment and validation of the MODIS global land surface temperature. Int. J. Remote Sens. 2004, 25, 261–274. [Google Scholar] [CrossRef]
  28. Wang, J.K.; Wang, K.C.; Wang, P.C. Strength Analysis of Beijing Urban Heat Island (Cold Island) Based on MODIS Surface Temperature Products. Natl. Remote Sens. Bull. 2007, 11, 330–339. [Google Scholar]
  29. Zhan, W.F.; Ju, W.M.; Hai, S.P.; Ferguson, G.; Quan, J.L.; Tang, C.S.; Guo, Z.; Kong, F.H. Satellite-derived subsurface urban heat island. Environ. Sci. Technol. 2014, 48, 12134–12140. [Google Scholar] [CrossRef] [PubMed]
  30. Ethan, H.; Kirsten, B.; Braden, Q.; Geoffrey, H. Evaluation of the MODIS collections 5 and 6 for change analysis of vegetation and land surface temperature dynamics in North and South America. ISPRS J. Photogramm. Remote Sens. 2019, 156, 121–134. [Google Scholar]
  31. Wang, H.T.; Wang, Y.; Yuan, Q.Q. The temporal and spatial distribution and changing trend of MODIS multi-angle atmospheric correction aerosol products in China from 2008 to 2016. Remote Sens. Technol. Appl. 2021, 36, 217–228. [Google Scholar]
  32. Orimoloye, I.R.; Belle, J.A.; Ololade, O.O. Drought disaster monitoring using MODIS derived index for drought years: A space-based information for ecosystems and environmental conservation. J. Environ. Manag. 2021, 284, 112028. [Google Scholar] [CrossRef] [PubMed]
  33. Vijith, H.; Dodge-Wan, D. Applicability of MODIS land cover and Enhanced Vegetation Index (EVI) for the assessment of spatial and temporal changes in strength of vegetation in tropical rainforest region of Borneo. Remote Sens. Appl. Soc. Environ. 2020, 18, 100311. [Google Scholar] [CrossRef]
  34. Deng, Y.J.; Du, Y.D.; Wang, J.C.; Xu, J.; Xie, W.S. Spatiotemporal characteristics and driving factors of urban heat islands in Guangdong-Hong Kong-Marco Greater Bay Area. Chin. J. Ecol. 2020, 39, 2671–2677. [Google Scholar]
  35. Yin, M.H.; Ai, D.; Ye, J. Climate change and land use response of metropolis of the Yangtze River Economic Belt: A case study of Wuhan. J. China Agric. Univ. 2021, 26, 126–140. [Google Scholar]
  36. Meng, D.; Wang, M.Y.; Li, X.J.; Gong, H.L. A Comparative Study on the Evolution of Night Thermal Landscape Patterns in Beijing, Shanghai and Guangzhou in the Past Ten Years. Acta Ecol. Sin. 2013, 33, 1545–1558. [Google Scholar] [CrossRef] [Green Version]
  37. Zhi, Q.; Guang, J.T.; Lin, X. Diurnal and seasonal impacts of urbanization on the urban thermal environment: A case study of Beijing using MODIS data. ISPRS J. Photogramm. Remote Sens. 2013, 85, 93–101. [Google Scholar]
  38. Zhu, W.Q.; Lin, W.P. Remote Sensing Technology Image Processing—Practice and Operation; Higher Education Press: Beijing, China, 2016; pp. 56–59. [Google Scholar]
  39. Zhang, M.M.; Yu, C.H. ArcGIS 10.1 Super Learning Manual; Posts & Telecom Press: Beijing, China, 2016; pp. 302–308. [Google Scholar]
  40. Zhou, B.W.; Ma, W.F.; Long, Y.; Hou, S.S.; Zhang, L. Application of ArcGIS-based Strip Section Extraction Method in Geomorphological Analysis. Geogr. Geo-Inf. Sci. 2011, 27, 42–44. [Google Scholar]
  41. Huang, J.C.; Zhao, X.F.; Tang, L.N.; Qiu, Q.Y. Temporal and Spatial Features of Urban Heat Island Landscape Pattern Evolution in the Process of Urbanization: Taking Xiamen City as an Example. Acta Ecol. Sin. 2012, 32, 622–631. [Google Scholar]
  42. Yohannes, H.; Soromessa, T.; Argaw, M.; Dewan, A. Impact of landscape pattern changes on hydrological ecosystem services in the Beressa watershed of the Blue Nile Basin in Ethiopia. Sci. Total Environ. 2021, 793, 148559. [Google Scholar] [CrossRef]
  43. Chen, A.L.; Yao, X.A.; Sun, A.H.R.; Chen, L.D. Effect of urban green patterns on surface urban cool islands and its seasonal variations. Urban For. Urban Green. 2014, 13, 646–654. [Google Scholar] [CrossRef]
  44. Peng, J.; Xie, P.; Liu, Y.X.; Ma, J. Urban thermal environment dynamics and associated landscape pattern factors: A case study in the Beijing metropolitan region. Remote Sens. Environ. 2016, 173, 145–155. [Google Scholar] [CrossRef]
  45. Gong, Z.N.; Zhang, Y.R.; Gong, H.L.; Zhao, W.J. Analysis on the Evolution Characteristics and Driving Mechanism of Beijing Wetland Landscape Pattern. Acta Geogr. Sin. 2011, 66, 77–88. [Google Scholar]
  46. Xu, S.; Li, F.X.; Zhang, L.B.; Zhou, L. Analysis on the Evolution of Thermal Landscape Spatial Pattern in Changsha City. Acta Ecol. Sin. 2015, 35, 3743–3754. [Google Scholar]
  47. Deng, R.; Liu, L.; Xu, E.L. Analysis on the evolution of thermal landscape pattern in Chongqing based on Landsat time series data. Ecol. Environ. Sci. 2017, 26, 1349–1357. [Google Scholar]
  48. Oke, T.R. The heat island of the urban boundary layer: Characteristics, causes and effects. Wind Clim. Cities 1995, 277, 81–107. [Google Scholar]
  49. Fang, C.L.; Zhou, C.H.; Gu, C.L.; Chen, L.D.; Li, S.C. A proposal for the theoretical analysis of the interactive coupled effects between urbanization and the eco-environment in mega-urban agglomerations. J. Geogr. Sci. 2017, 27, 1431–1449. [Google Scholar] [CrossRef]
  50. Gao, J.; Yu, Z.W.; Wang, L.C.; Vejre, H. Suitability of regional development based on ecosystem service benefits and losses: A case study of the Yangtze River Delta urban agglomeration, China. Ecol. Indic. 2019, 107, 105579. [Google Scholar] [CrossRef]
  51. Yuan, W.H.; Li, J.C.; Meng, L.; Qin, X.N.; Qi, X.X. Measuring the area green efficiency and the influencing factors in urban agglomeration. J. Clean. Prod. 2019, 241, 118092. [Google Scholar] [CrossRef]
  52. Du, H.Y.; Wang, D.D.; Wang, Y.Y.; Zhao, X.L.; Qin, F.; Jiang, H.; Cai, Y.L. Influences of land cover types, meteorological conditions, anthropogenic heat and urban area on surface urban heat island in the Yangtze River Delta Urban Agglomeration. Sci. Total Environ. 2016, 571, 461–470. [Google Scholar] [CrossRef]
  53. Zhou, D.C.; Bonafoni, S.; Zhang, L.X.; Wang, R.H. Remote sensing of the urban heat island effect in a highly populated urban agglomeration area in East China. Sci. Total Environ. 2018, 628–629, 415–429. [Google Scholar] [CrossRef]
  54. Xiong, Y.; Peng, F.; Zou, B. Spatiotemporal influences of land use/cover changes on the heat island effect in rapid urbanization area. Front. Geosci. 2019, 13, 614–627. [Google Scholar] [CrossRef]
  55. Li, J.F.; Wang, F.F.; Fu, Y.C.; Guo, B.Y.; Zhou, Y.L.; Yu, H.F. A Novel SUHI Referenced Estimation Method in Multi-centers Urban Agglomeration with DMSP/OLS Nighttime Light Data. IEEE J. Sel. Top. Appl. Earth Obs. Remote Sens. 2020, 13, 1416–1425. [Google Scholar] [CrossRef]
  56. Zhou, W.Q.; Huang, G.L.; Gadenasso, M.L. Does spatial configuration matter? Understanding the effects of land cover pattern on land surface temperature in urban landscapes. Landsc. Urban Plan. 2011, 102, 54–63. [Google Scholar] [CrossRef]
  57. Nie, Q.; Xu, J.H. Understanding the effects of the impervious surfaces pattern on land surface temperature in an urban area. Front. Earth Sci. 2015, 9, 276–285. [Google Scholar] [CrossRef]
  58. Chen, Y.C.; Chiu, H.W.; Su, Y.F.; Wu, Y.C.; Cheng, K.S. Does urbanization increase diurnal land surface temperature variation? Evidence and implications. Landsc. Urban Plan. 2017, 157, 247–258. [Google Scholar] [CrossRef]
  59. Chapman, S.; Watson, J.E.M.; Salazar, A.; Thatcher, M. The impact of urbanization and climate change on urban temperatures: A systematic review. Landsc. Ecol. 2017, 32, 1921–1935. [Google Scholar] [CrossRef]
  60. Kuang, W.H.; Liu, Y.; Dou, Y.Y.; Chi, W.F.; Chen, G.S.; Gao, C.F.; Yang, T.R.; Liu, J.Y.; Zhang, R.H. What are hot and what are not in an urban landscape: Quantifying and explaining the land surface temperature pattern in Beijing, China. Landsc. Ecol. 2015, 30, 357–373. [Google Scholar] [CrossRef]
  61. Yu, W.J.; Zhou, W.Q. The Spatiotemporal Pattern of Urban Expansion in China: A Comparison Study of Three Urban Megaregions. Remote Sens. 2017, 9, 45. [Google Scholar] [CrossRef] [Green Version]
  62. Tian, Y.Y.; Jiang, G.H.; Zhou, D.Y.; Ding, K.S.; Su, S.; Zhou, T.; Chen, D.B. Regional industrial transfer in the Jingjinji urban agglomeration, China: An analysis based on a new “transferring area-undertaking area-dynamic process” model. J. Clean. Prod. 2019, 235, 751–766. [Google Scholar] [CrossRef]
  63. Yu, Z.W.; Yao, Y.W.; Yang, G.Y.; Wang, X.R.; Vejre, H. Strong contribution of rapid urbanization and urban agglomeration development to regional thermal environment dynamics and evolution. For. Ecol. Manag. 2019, 446, 214–225. [Google Scholar] [CrossRef]
  64. Chen, Y.F.; Wang, Y.K.; Fu, B.; Liu, Q.; Wang, S.; Mu, Y. Heat island effect during the process of urbanization in Chengdu-Chongqing urban agglomeration. Chin. J. Ecol. 2015, 34, 3494–3501. [Google Scholar]
  65. Xu, L.Y.; Xie, X.D.; Li, S. Correlation analysis of the urban heat island effect and the spatial and temporal distribution of atmospheric particulates using TM images in Beijing. Environ. Pollut. 2013, 178, 102–114. [Google Scholar] [CrossRef] [PubMed]
  66. Li, Y.Y.; Zhang, H.; Kainz, W. Monitoring patterns of urban heat islands of the fast-growing Shanghai metropolis, China: Using time-series of Landsat TM/ETM+ data. Int. J. Appl. Earth Obs. Geoinf. 2012, 19, 127–138. [Google Scholar] [CrossRef]
  67. Yang, Y.B.; Su, W.Z.; Jiang, N. Time-space character analysis of urban heat island effect in Nanjing City Using Remote Sensing. Remote Sens. Technol. Appl. 2006, 21, 488–492. [Google Scholar]
  68. Adulkongkaew, T.; Satapanajaru, T.; Charoenhirunyingyos, S.; Singhirunnusorn, W. Effect of land cover composition and building configuration on land surface temperature in an urban-sprawl city, case study in Bangkok Metropolitan Area, Thailand. Heliyon 2020, 6, e04485. [Google Scholar] [CrossRef] [PubMed]
  69. Sun, H.; Lin, H.; Xiong, Y.J. Land-surface Temperature Retrieve from Landsat TM Data In Urban Agglomeration of Changsha, Zhuzhou and Xiangtan. J. Cent. South Univ. For. Technol. 2008, 28, 85–90. [Google Scholar]
  70. Foley, J.A. Global Consequences of Land Use. Science 2005, 309, 570–574. [Google Scholar] [CrossRef] [Green Version]
  71. Yu, Z.W.; Yao, Y.W.; Yang, G.Y.; Wang, X.R.; Vejre, H. Spatiotemporal patterns and characteristics of remotely sensed region heat islands during the rapid urbanization (1995–2015) of Southern China. Sci. Total Environ. 2019, 674, 242–254. [Google Scholar] [CrossRef] [PubMed]
  72. Bull, C. Urban ecology: Science of cities (Book Review). Landsc. Archit. Aust. 2015, 145, 79–80. [Google Scholar]
  73. Walawender, J.P.; Szymanowski, M.; Hajto, M.J.; Bokwa, A. Land Surface Temperature Patterns in the Urban Agglomeration of Krakow (Poland) Derived from Landsat-7/ETM+ Data. Pure Appl. Geophys. 2014, 171, 913–940. [Google Scholar] [CrossRef] [Green Version]
  74. Lu, D.M.; Song, K.S.; Zang, S.Y.; Jia, M.M.; Du, J.; Ren, C.Y. The Effect of Urban Expansion on Urban Surface Temperature in Shenyang, China: An Analysis with Landsat Imagery. Environ. Model. Assess. 2015, 20, 197–210. [Google Scholar] [CrossRef]
  75. Aboelata, A.; Sodoudi, S. Evaluating urban vegetation scenarios to mitigate urban heat island and reduce buildings’ energy in dense built-up areas in Cairo. Build. Environ. 2019, 166, 106407. [Google Scholar] [CrossRef]
  76. Cheung, P.K.; Jim, C.Y. Effects of urban and landscape elements on air temperature in a high-density subtropical city. Build. Environ. 2019, 164, 106362. [Google Scholar] [CrossRef]
  77. Karakuş, C.B. The impact of land use/land cover (LULC) changes on land surface temperature in Sivas City center and its surroundings and assessment of urban heat island. Asia Pac. J. Atmos. Sci. 2019, 55, 669–684. [Google Scholar] [CrossRef]
  78. Acero, J.A.; Koh, E.J.; Li, X.; Ruefenacht, L.A.; Pignatta, G.; Norford, L.K. Thermal impact of the orientation and height of vertical greenery on pedestrians in a tropical area. Build. Simul. 2019, 12, 973–984. [Google Scholar] [CrossRef]
  79. Fu, Y.C.; Li, J.F.; Weng, Q.H.; Zheng, Q.M.; Li, L.; Dai, S.; Guo, B.Y. Characterizing the spatial pattern of annual urban growth by using time series Landsat imagery. Sci. Total Environ. 2019, 666, 274–284. [Google Scholar] [CrossRef] [PubMed]
  80. Yi, C.; Shin, Y.; Roh, J.W. Development of an Urban High-Resolution Air Temperature Forecast System for Local Weather Information Services Based on Statistical Downscaling. Atmosphere 2018, 9, 164. [Google Scholar] [CrossRef] [Green Version]
  81. Lo, C.P.; Quattrochi, D.A.; Luvall, J.C. Application of high-resolution thermal infrared remote sensing and GIS to assess the urban heat island effect. Int. J. Remote Sens. 1997, 18, 287–304. [Google Scholar] [CrossRef] [Green Version]
  82. Cai, G.Y.; Du, M.Y.; Xue, Y. Monitoring of urban heat island effect in Beijing combining ASTER and TM data. Int. J. Remote Sens. 2011, 32, 1213–1232. [Google Scholar] [CrossRef]
  83. Coseo, P.; Larsen, L. How factors of land use/land cover, building configuration, and adjacent heat sources and sinks explain Urban Heat Islands in Chicago. Landsc. Urban Plan. 2014, 125, 117–129. [Google Scholar] [CrossRef]
  84. Arnfield, A.J. Two decades of urban climate research: A review of turbulence, exchanges of energy and water, and the urban heat island. Int. J. Climatol. 2003, 23, 1–26. [Google Scholar] [CrossRef]
  85. Sun, W.Z.; Yang, K.; Luo, Y. The influence of vegetation cover change on the land surface temperature in the central Guizhou urban agglomeration from 2000 to 2019. IOP Conf. Ser. Earth Environ. Sci. 2021, 658, 012009. [Google Scholar] [CrossRef]
  86. Wang, Z.Y.; Liu, M.L.; Liu, X.N.; Meng, Y.Y.; Zhu, L.H.; Rong, Y. Spatio-temporal evolution of surface urban heat islands in the Chang-Zhu-Tan urban agglomeration. Phys. Chem. Earth 2020, 117, 102865. [Google Scholar] [CrossRef]
  87. Du, Y.; Xie, Z.Q.; Zeng, Y.; Shi, Y.F.; Wu, J.G. Impact of urban expansion on regional temperature change in the Yangtze River Delta. J. Geogr. Sci. 2007, 17, 387–398. [Google Scholar] [CrossRef]
  88. Li, J.; Ning, Y.M. Population spatial change and urban spatial restructuring in Shanghai since the 1990s. Urban Plan. Forum 2007, 2, 20–24. [Google Scholar]
Figure 1. The study area.
Sustainability 13 08880 g001
Figure 2. Socio-economic development in the Yangtze River Delta. Notes: The data come from the National Bureau of Statistics of China (http://www.stats.gov.cn/ (accessed on 1 October 2020)).
Sustainability 13 08880 g002
Figure 3. Spatiotemporal differentiation map of surface thermal landscape in the Yangtze River Delta.
Sustainability 13 08880 g003
Figure 4. Surface thermal rating ratio in the Yangtze River Delta.
Sustainability 13 08880 g004
Figure 5. Accumulation map of the surface thermal rating ratio of 27 cities in the integrated central area of the Yangtze River in 2007 and 2019. (The same cities are shown on the left for 2007 and on the right for 2019).
Sustainability 13 08880 g005
Figure 6. Sectional view of surface thermal grade strip ((a): Shanghai–Nanjing–Hefei–Hangzhou–Ningbo Development Belt, (b): Yangtze River Development Belt, (c): Coastal Development Belt, (d): Shanghai–Hangzhou–Jinhua Development Belt).
Sustainability 13 08880 g006
Figure 7. Schematic diagram of the main functional areas of the Yangtze River Delta.
Sustainability 13 08880 g007
Figure 8. The progression of Aggregation Index (AI) for different development zones.
Sustainability 13 08880 g008
Figure 9. The progression of the Contagion Index (CONTAG), Shannon’s Diversity Index (SHDI), and Simpson’s Diversity Index (SHEI) in different development zones.
Sustainability 13 08880 g009
Table 1. The development history of integration in the Yangtze River Delta.
TimeRelated Policy
1982Established the Shanghai Economic Zone, covering 10 cities in Shanghai, Jiangsu Province and Zhejiang Province.
2003Taizhou (Zhejiang) entered the Yangtze River Delta City Economic Coordination Association, and the Yangtze River Delta City Group formed out of 16 cities in Shanghai, Jiangsu Province and Zhejiang Province.
2010The Regional Plan for the Yangtze River Delta Region defines the scope of the Yangtze River Delta as 25 prefecture-level cities in Shanghai, Jiangsu Province and Zhejiang Province. The plan still lists 16 cities as the “core areas” of the Yangtze River Delta regional development plan.
2014The Guiding Opinions of the State Council on Relying on the Golden Waterway to Promote the Development of the Yangtze River Economic Belt stated that the Yangtze River Delta City Group should build an urban agglomeration centered on Shanghai and Nanjing, and with Hangzhou and Hefei as the sub-centers. Anhui was officially included in the Yangtze River Delta region.
2016The National Development and Reform Commission issued the Development Plan for the Yangtze River Delta Urban Agglomeration, which included 26 cities.
2019The Outline of the Yangtze River Delta Regional Integration Development Plan was given, and its planning scope covered the whole area of Shanghai, Jiangsu Province, Zhejiang Province, and Anhui Province, with 27 cities constituting the central area.
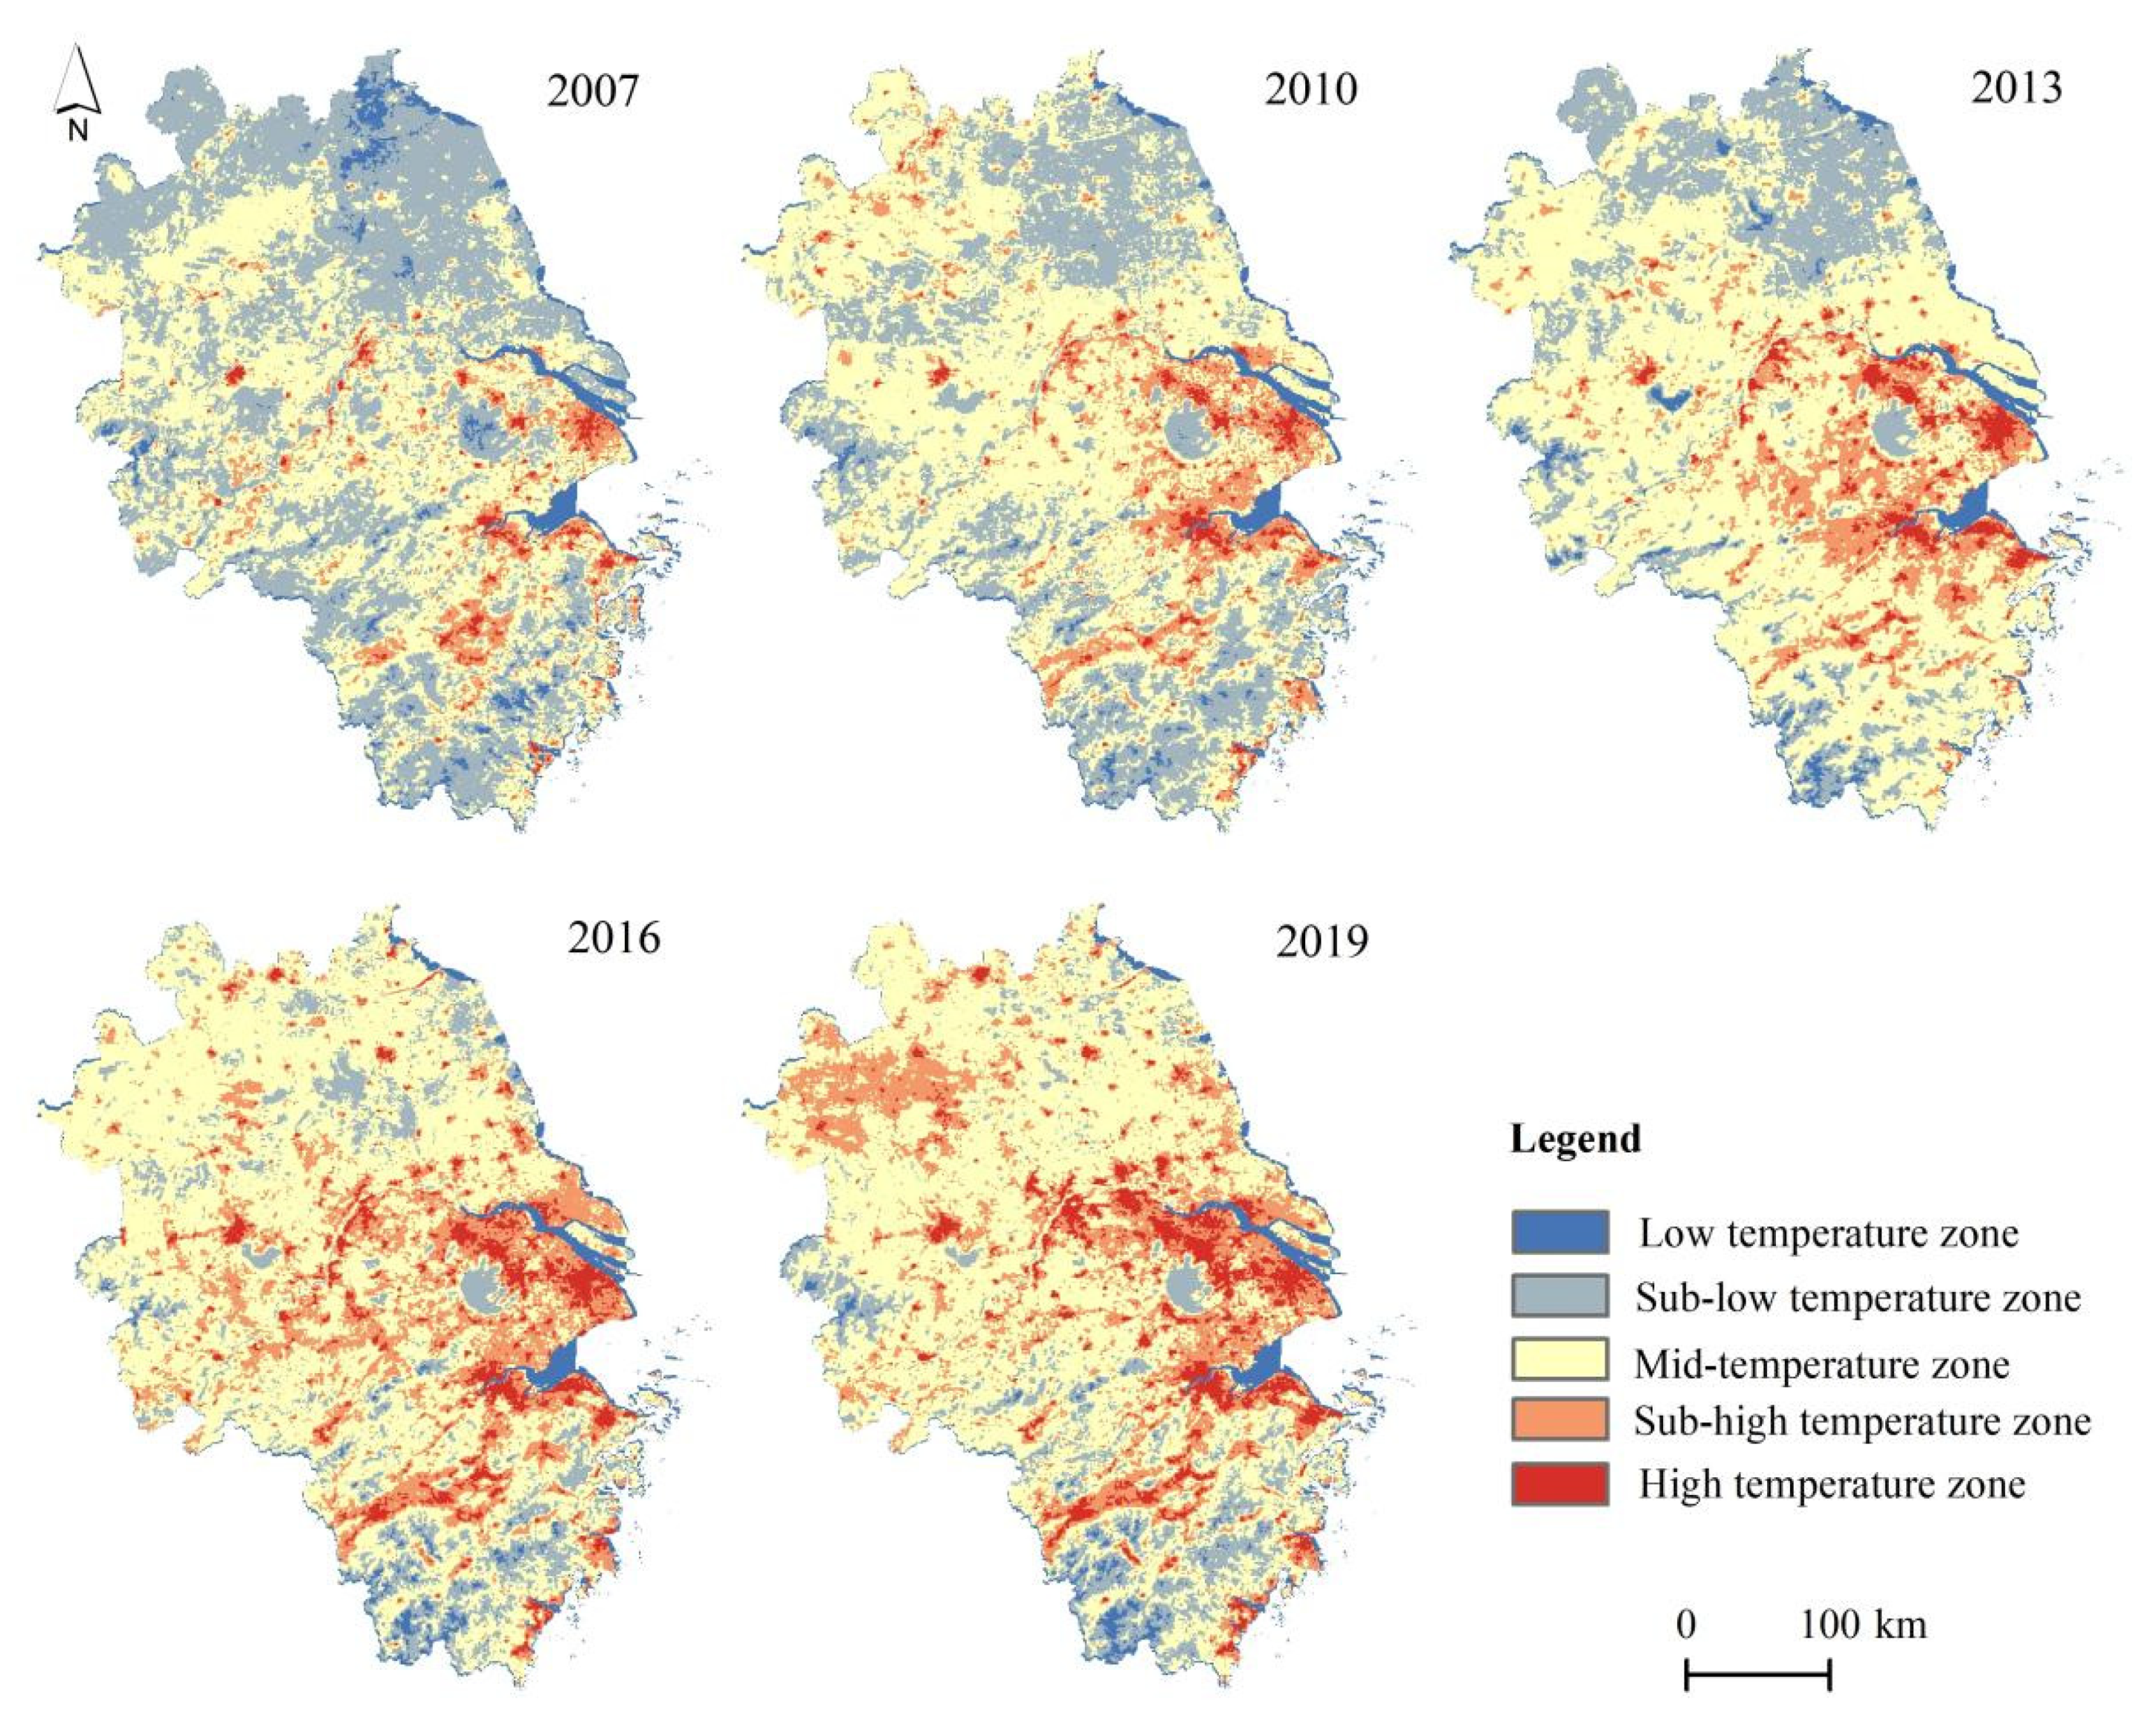
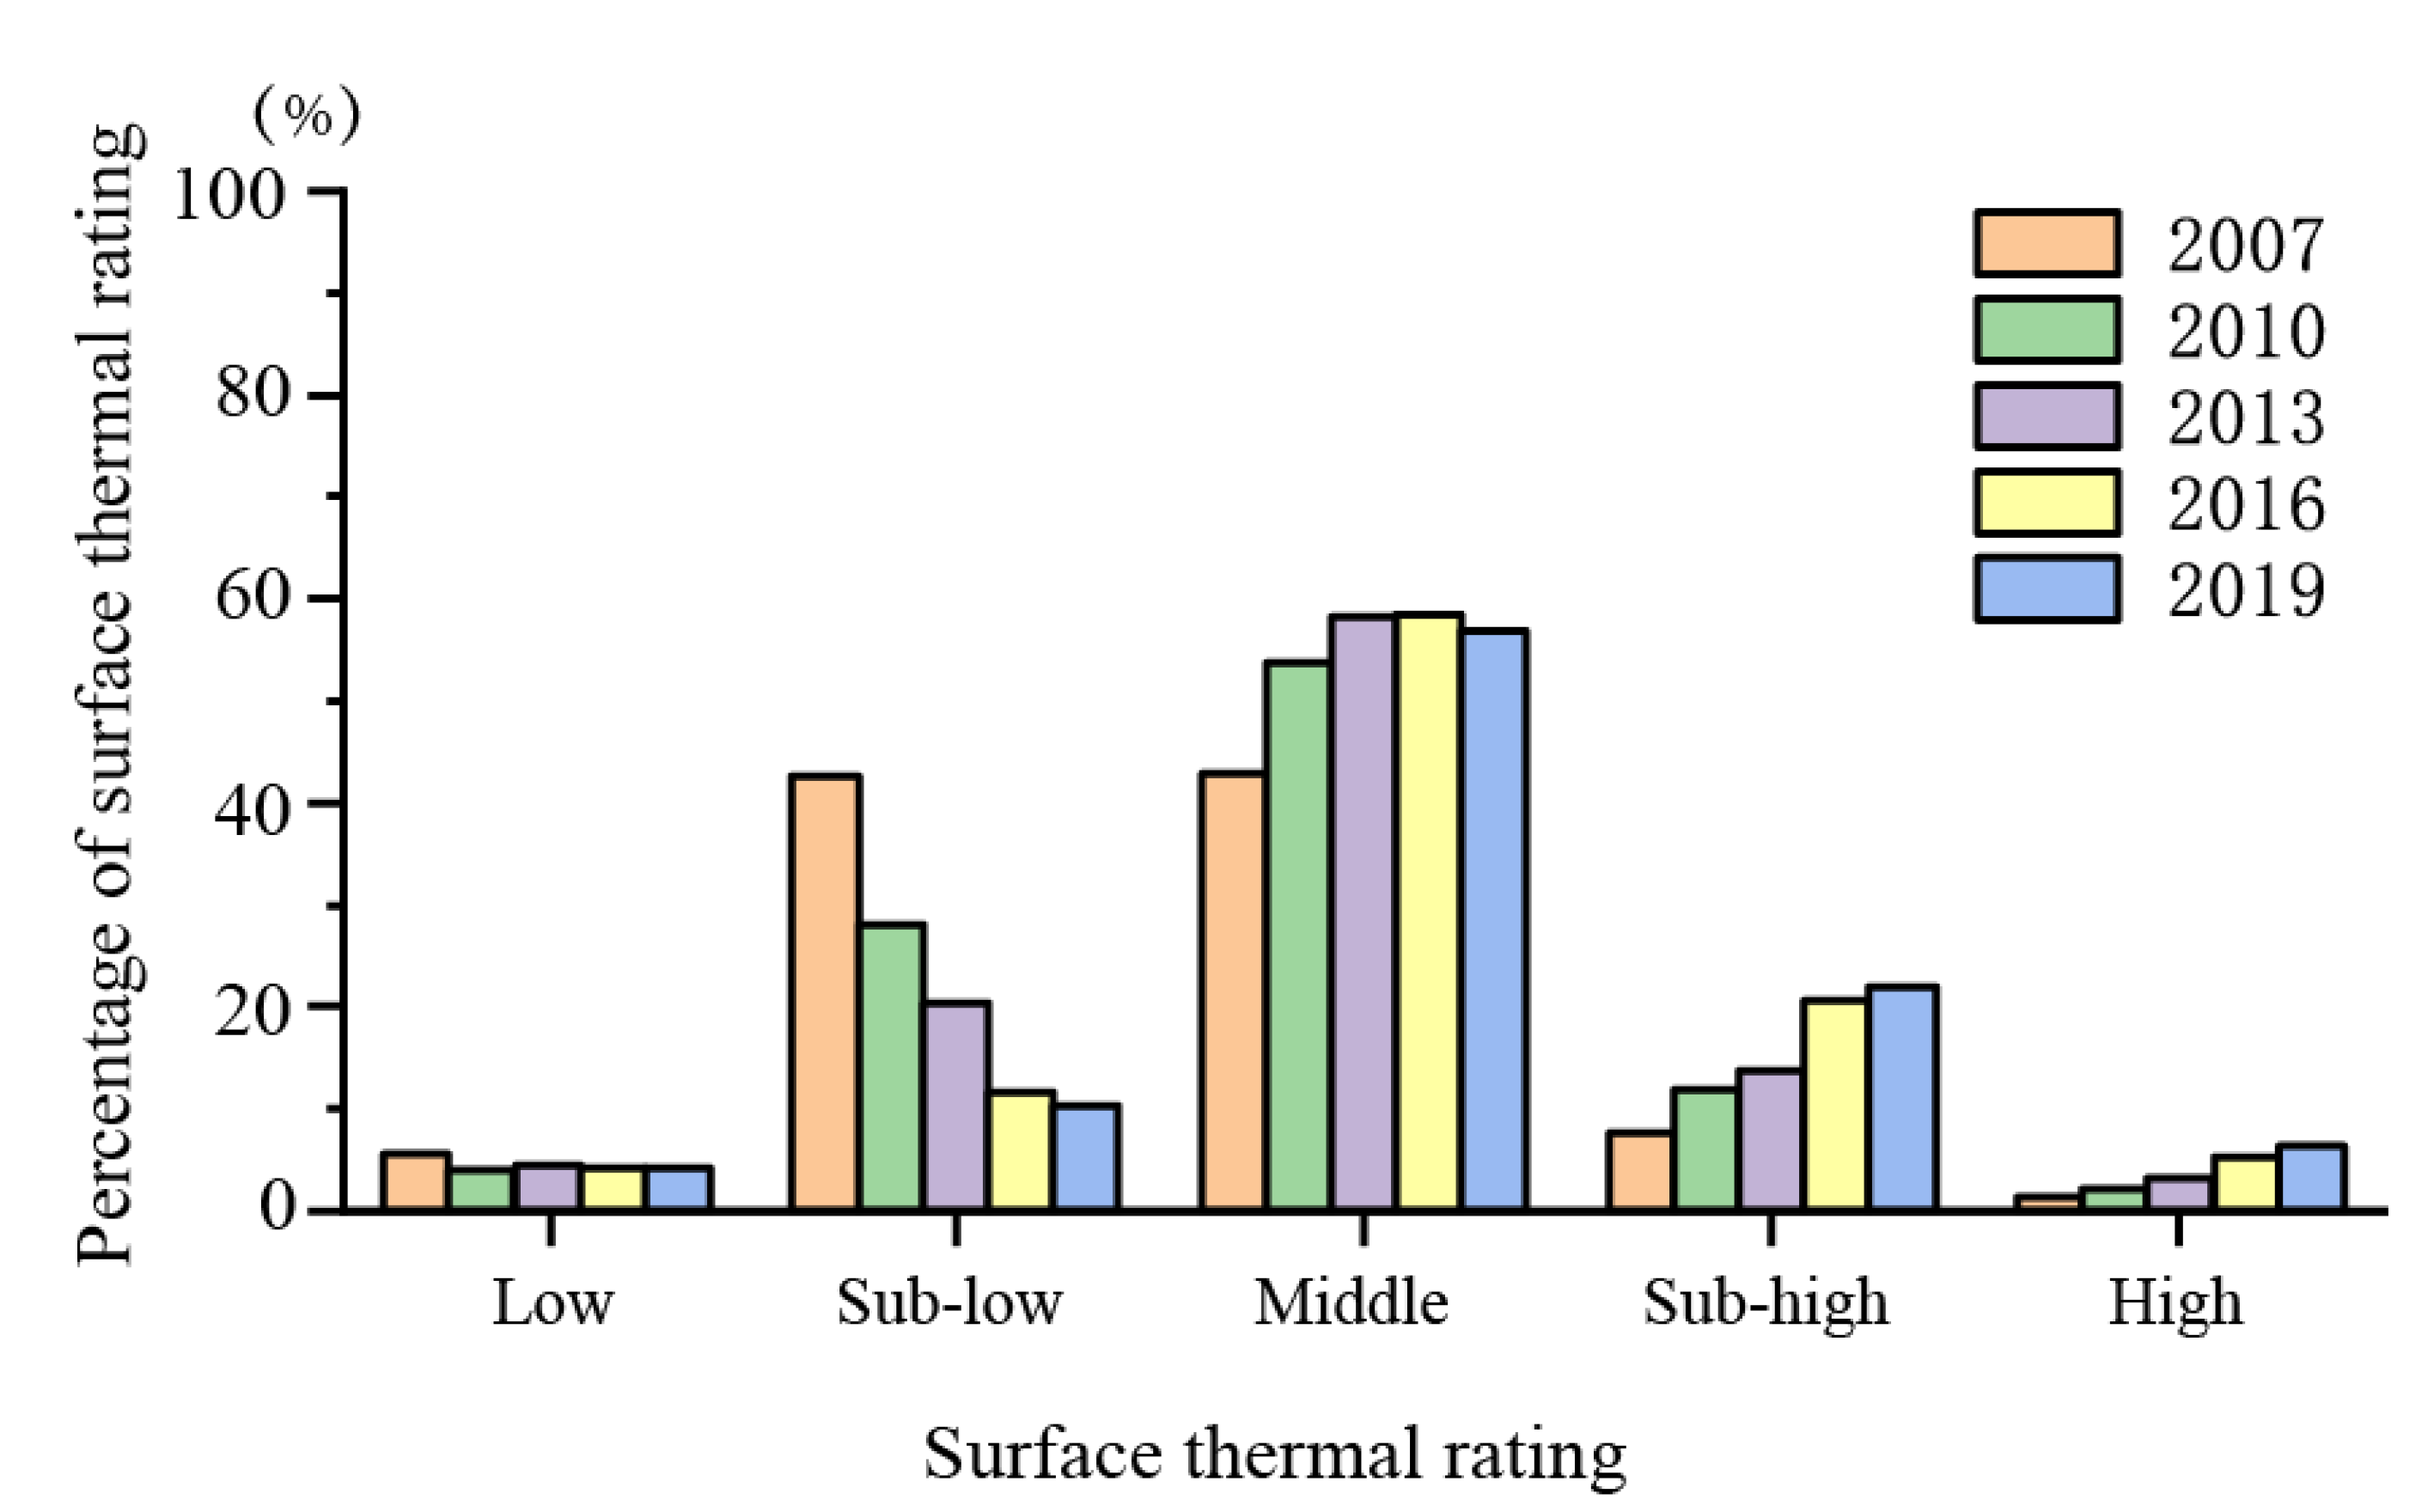
Table 2. Classification of surface thermal rating.
Thermal Landscape RatingTemperature ZoneRange
1Low-temperature zone[0.0, 0.2)
2Sub-low-temperature zone[0.2, 0.4)
3Middle-temperature zone[0.4, 0.6)
4Sub-high-temperature zone[0.6, 0.8)
5High-temperature zone[0.8, 1.0]
Table 3. Cities in the integrated central area of the Yangtze River Delta.
Scale LevelCity
super citiesShanghai
mega citiesNanjing
big citiestype I big citiesHangzhou, Hefei, Suzhou (Jiangsu)
type II big citiesWuxi, Ningbo, Wenzhou, Nantong, Changzhou, Shaoxing, Wuhu, Yancheng, Yangzhou, Taizhou (Jiangsu), Taizhou (Zhejiang)
medium-sized citiesZhenjiang, Huzhou, Jiaxing, Ma’anshan, Anqing, Jinhua, Zhoushan
type I small citiesTongling, Chuzhou, Xuancheng, Chizhou
Notes: According to the latest State Council’s notice on adjusting the criteria for city size classification, the city is classified according to the urban permanent population. super cities (≥10 million people), mega cities (≥5 million people), type I big cities (≥3 million people), type II big cities (≥1 million people), medium-sized cities (≥0.5 million people), type I small cities (≥0.2 million people).
Table 4. Landscape indices calculation and feature description.
Landscape IndicesCalculation FormulaVariable Interpretation
Aggregation Index (AI) [41] AI = [ i = 1 m ( g i i max g i i ) × P i ] × 100 g i j is the connection between all surface thermal regions in the i level thermal landscape,
ax→gii is the maximum number of connections between all pixels in the i level thermal landscape, and P i is the ratio of the i level thermal landscape pixels to the entire landscape area.
Contagion Index (CONTAG) CONTAG = ( 1 + i = 1 m j = 1 m P i j ln P i j 2 ln ( m ) ) × 100 m is the number of thermal levels in the entire landscape, P i j represents the number of nodes between the i level surface heat and the j level surface heat.
Shannon’s Diversity Index (SHDI) [43,44] SHDI = i = 1 n P i ln P i n is the number of all pixels in the landscape, and P i is the ratio of i level surface heat to the total landscape area.
Simpson’s Diversity Index (SHEI) [44] SHDI = i = 1 n P i ln P i ln n n is the number of all pixels in the landscape, and P i is the ratio of i level surface heat to the total landscape area.
Publisher’s Note: MDPI stays neutral with regard to jurisdictional claims in published maps and institutional affiliations.

