
From Comparative and Statistical Assessments of Liveability and Health Conditions of Districts in Hong Kong towards Future City Development


Abstract
1. Introduction
2. Data Collection and Methodologies
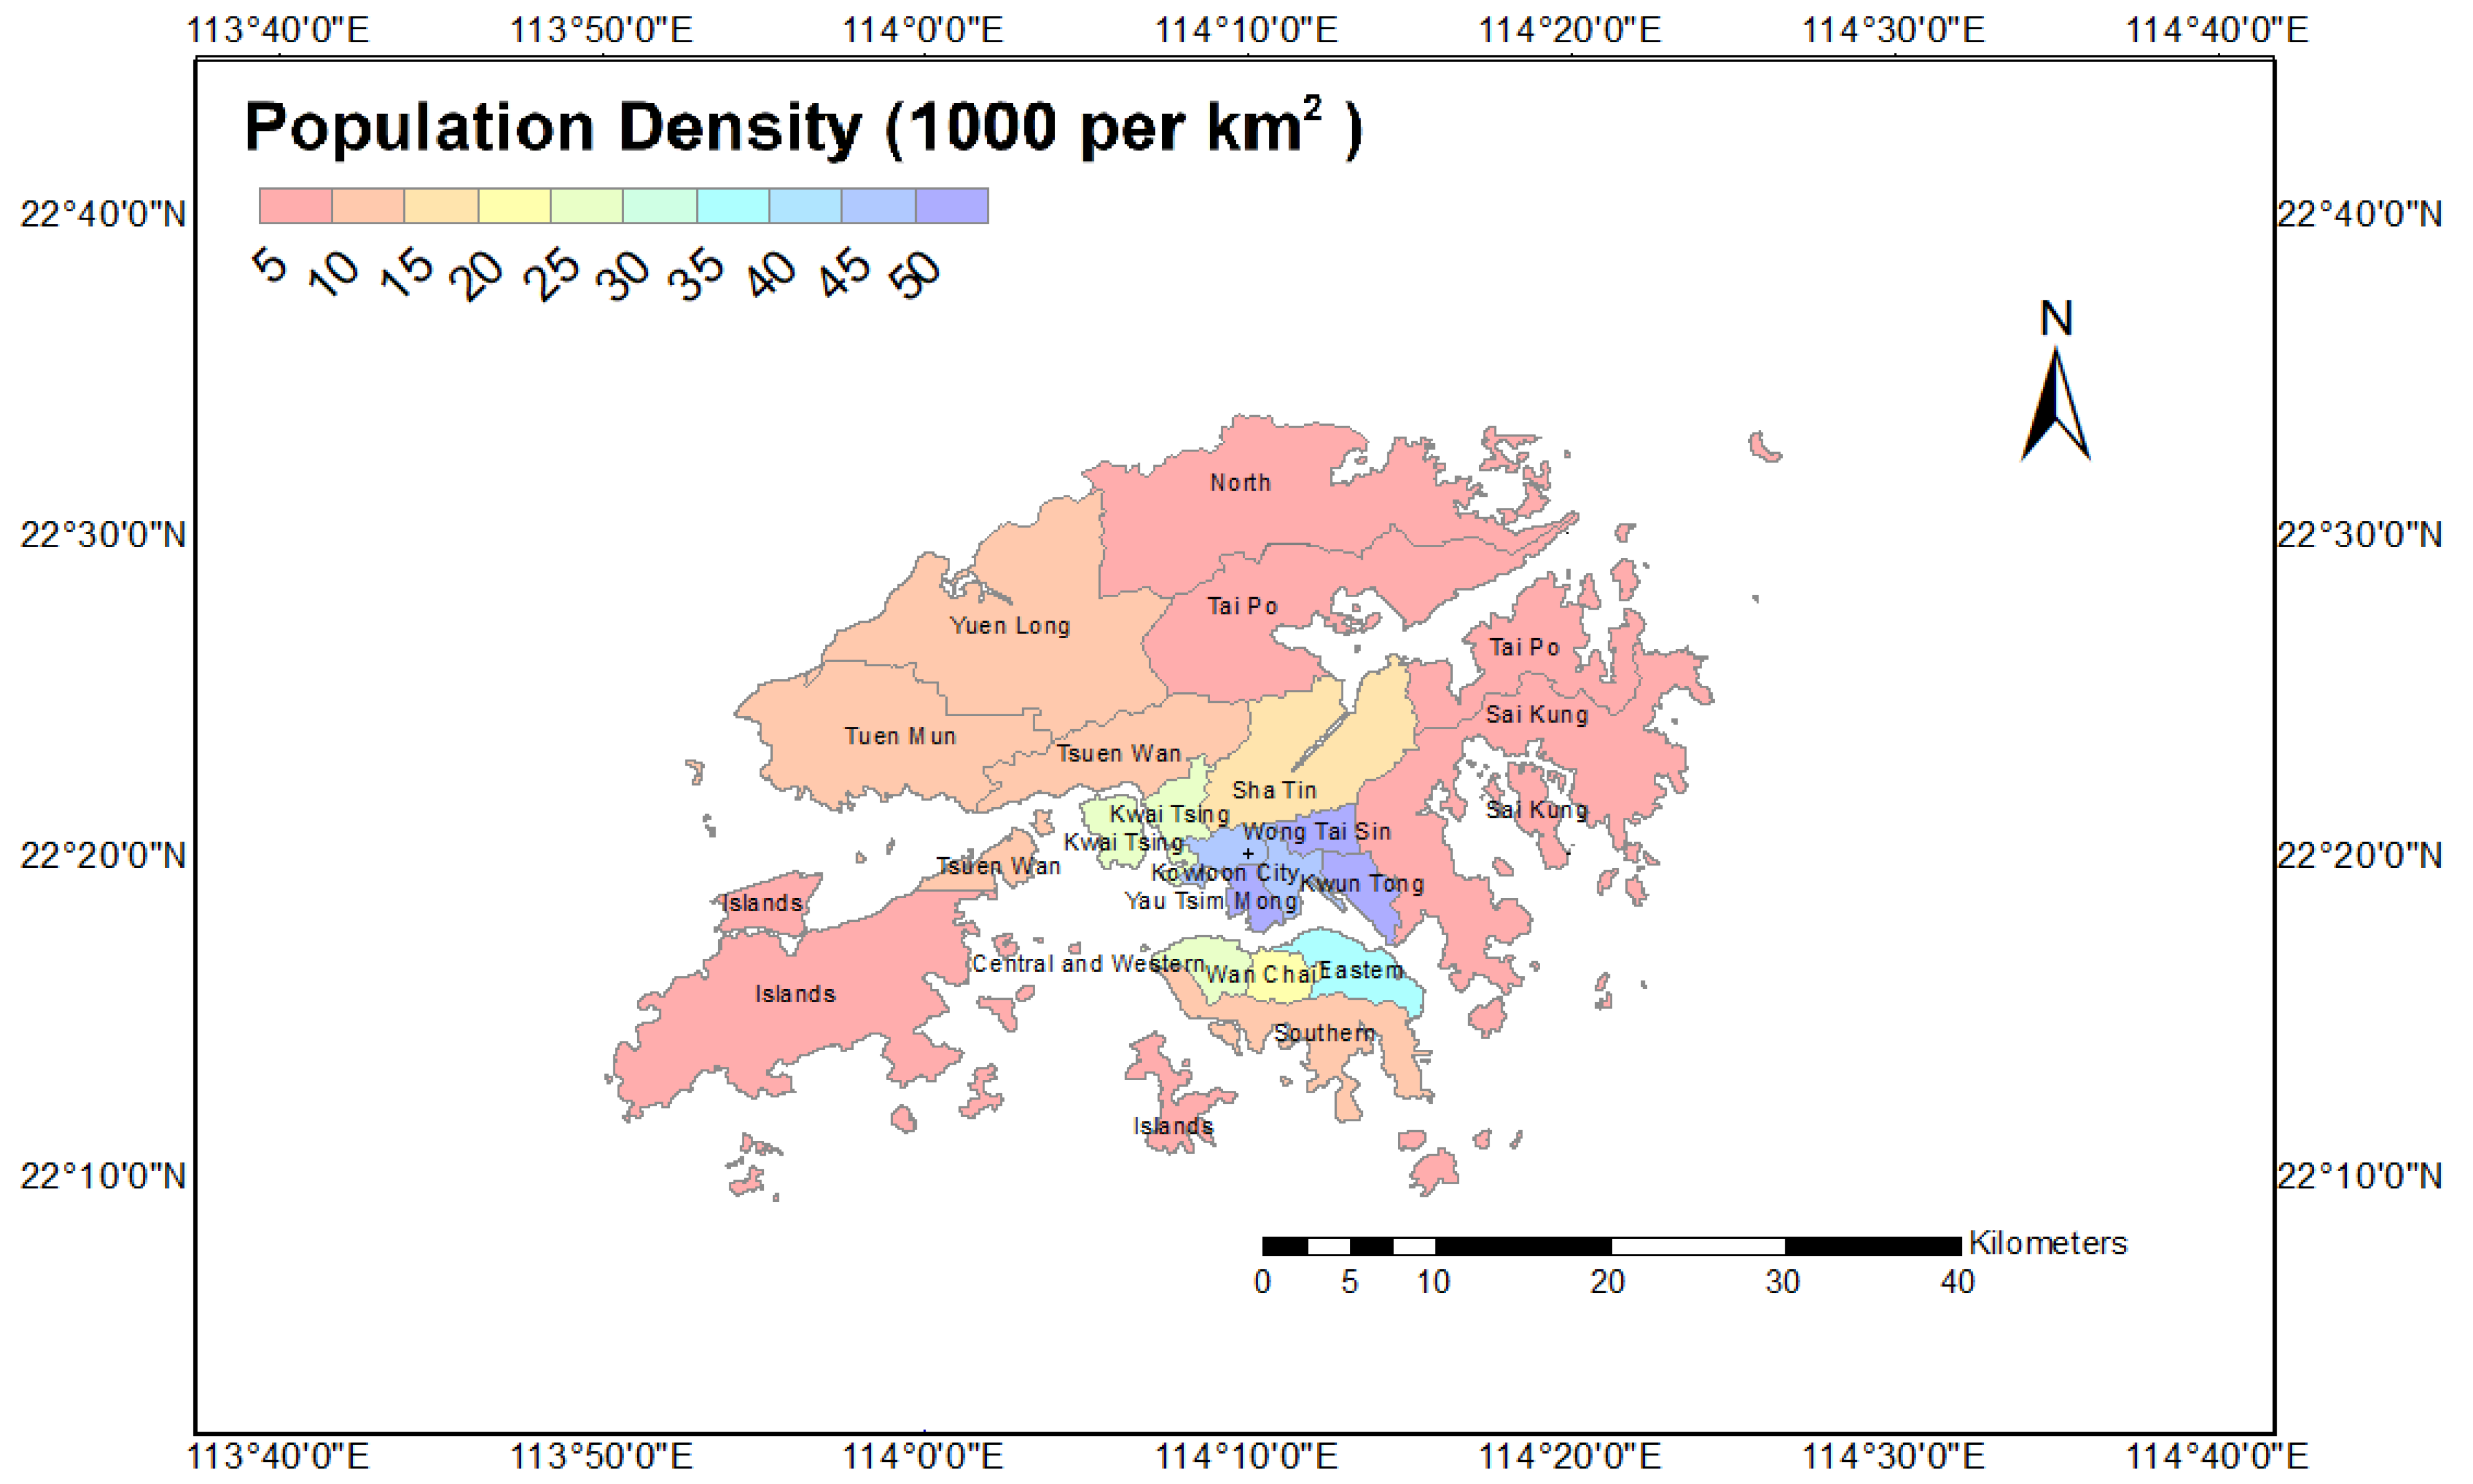
2.1. Study Area
2.2. Data Collection and Categorization
2.2.1. Overview of Data Collection for LHI-HK Development
2.2.2. References and Local Contexts of 6 Liveability Categories
2.3. Data Handling and Scoring Framework
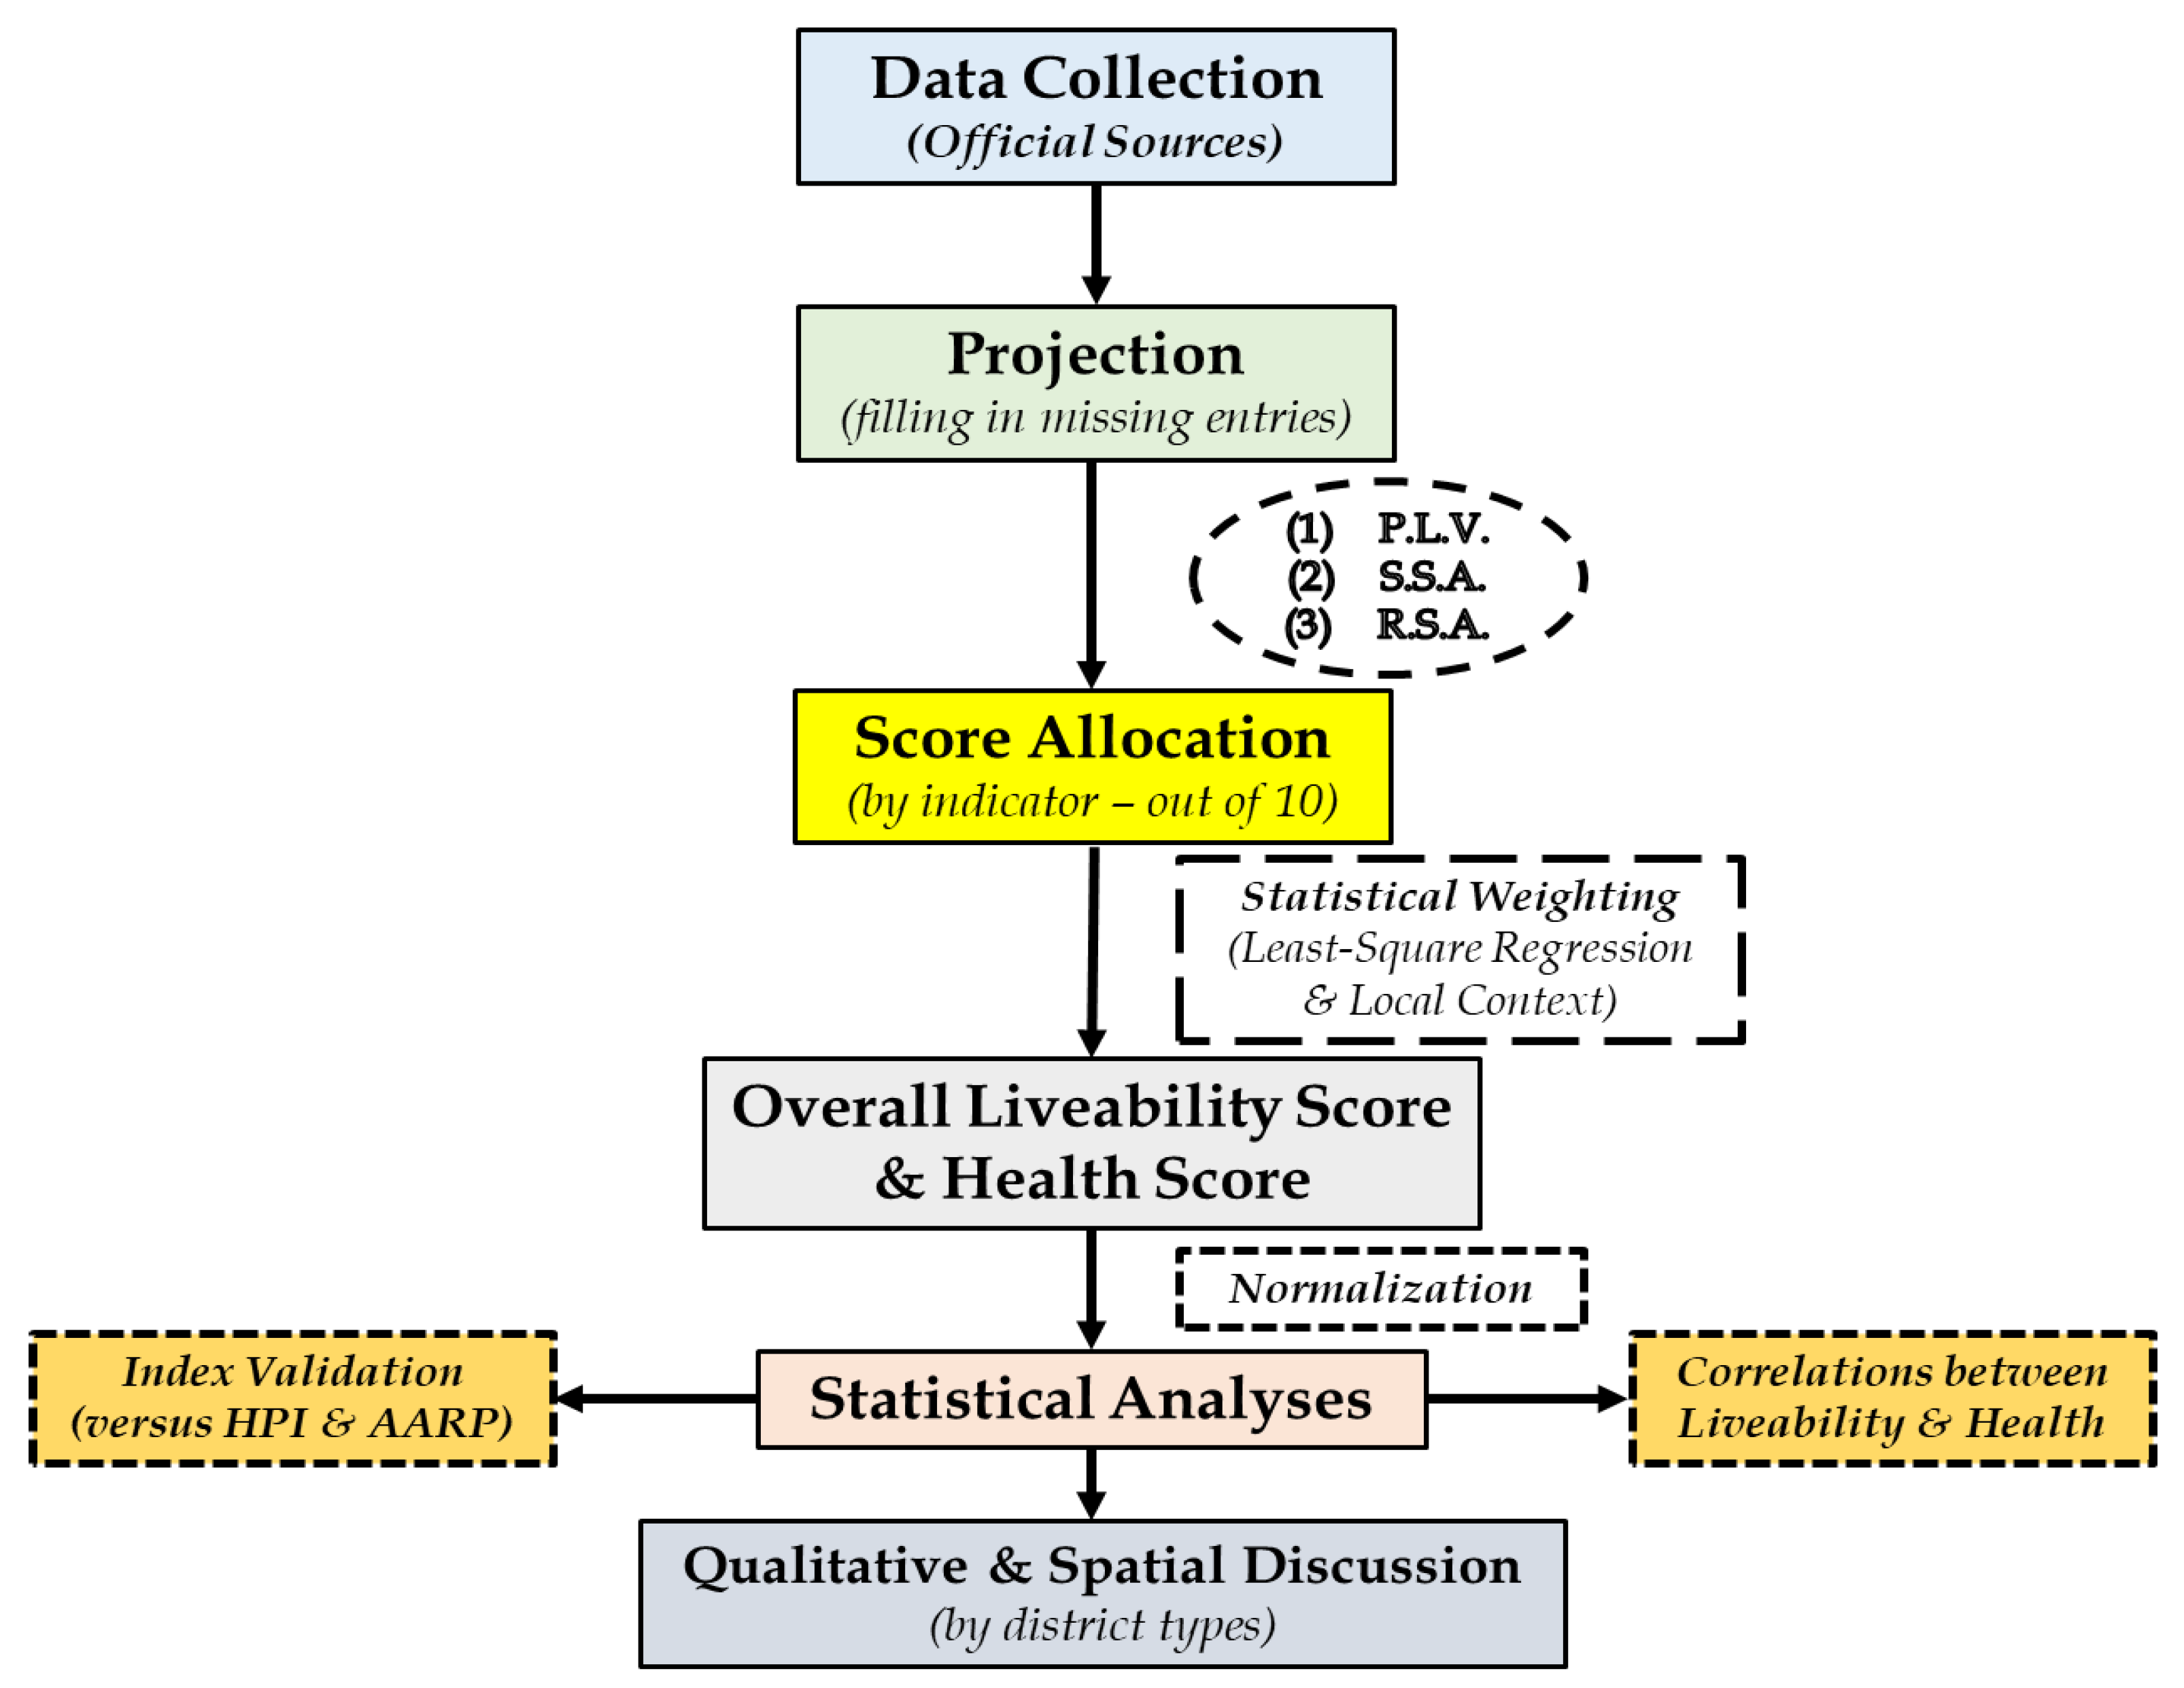
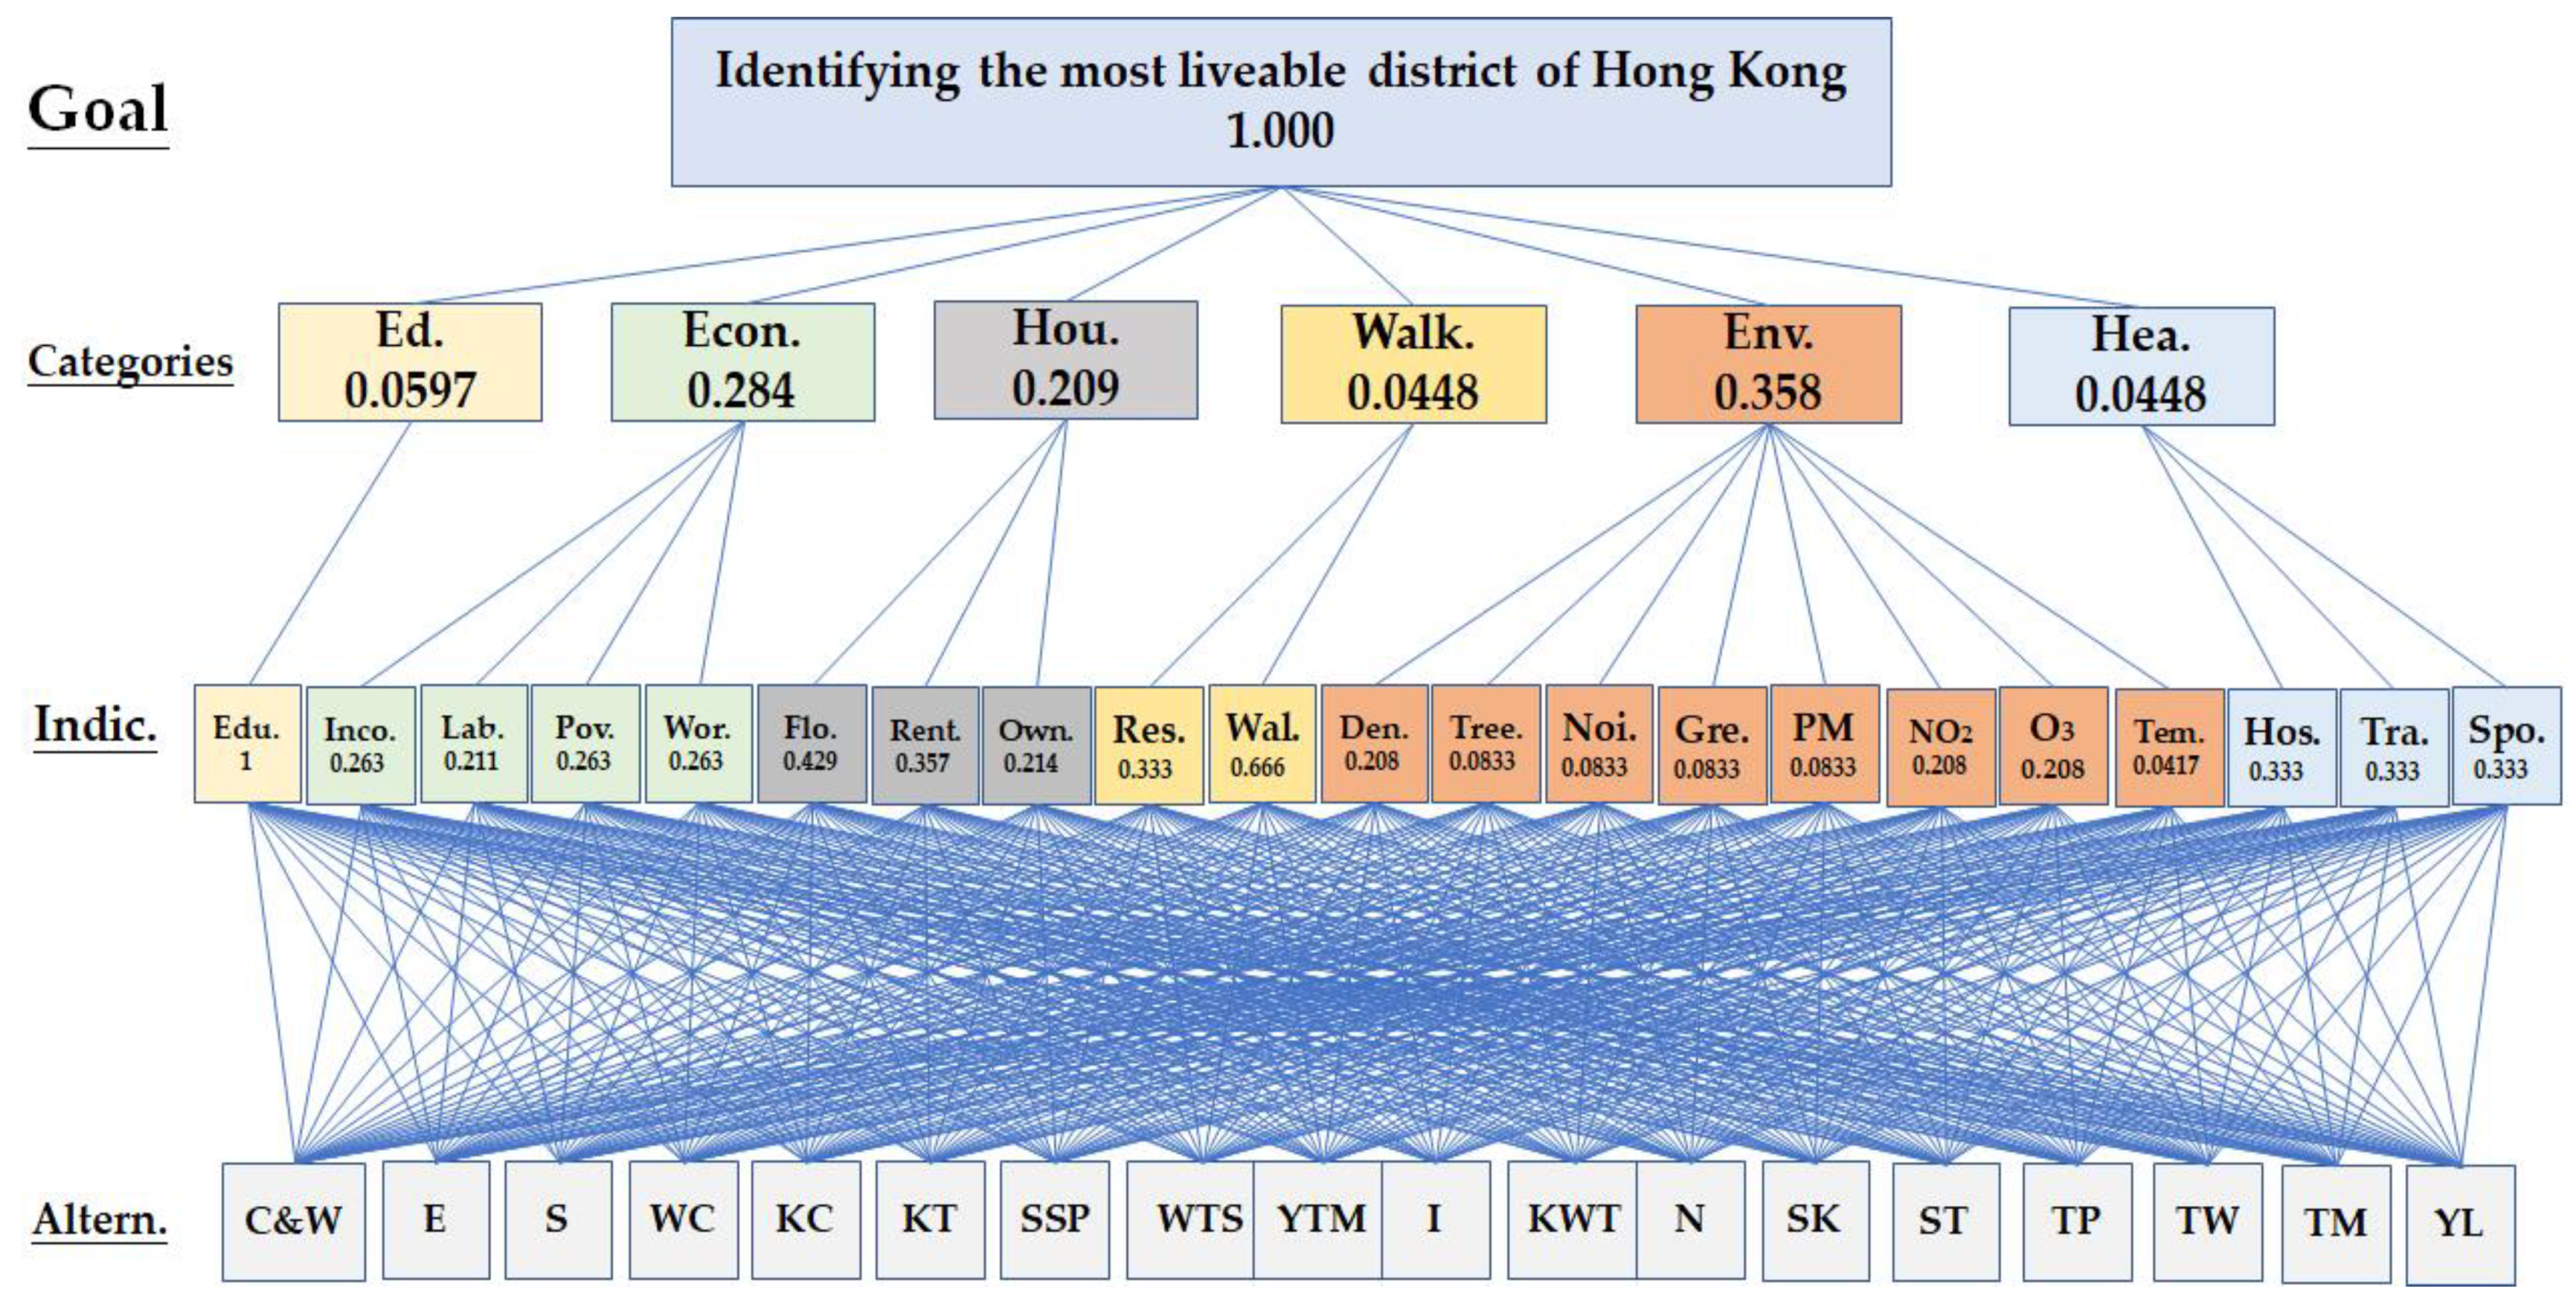
2.3.1. Overall Development of Liveability and Health Index-Hong Kong (LHI-HK)
2.3.2. Projection of Missing Entries
2.3.3. Development of Scoring Approaches
- (a)
- Proportion to the Largest Value (P.L.V.)
- (b)
- Standard Score Approach (S.S.A.)
- Arrange the raw values of all 18 districts (Vi, where i = 1, 2, …, 18) for concerned liveability or health indicators, in descending order.
- Evaluate the mean (μ) and SD (σ) of the distribution obtained in Step 1.
- Compute the standard score (Zi) of individual district by Equation (3):
- 4.
- Determine the maximum possible score (MH) and the minimum possible score (ML) assigned to the best-performing and worst-performing districts, based on the importance of that indicator in Hong Kong context. Detailed criteria and concerned indicators are shown in Table S2. The range of (ML, MH) of individual indicator ranges from (2, 10) to (5, 10).
- 5.
- Determine the score to be allocated to district i (Mi), by assuming that the variation of scores could effectively capture spatial discrepancies of liveability performance in all 18 districts, and proportionality holds. The formulation is as shown in Equation (4), where Zi, Zmax and Zmin denote the standard score of district i, the maximum standard score, and the minimum standard score attained by all districts of Hong Kong, respectively.
- (c)
- Relative Score Approach (R.S.A.)
- 1.
- The missing entry of the concerned district (represented by district i) in 2016 was estimated by Equation (6), with and representing the missing attribute of district i in 2016, available attribute of district i in 2019, value of that attribute in the best-performing district in 2016, and in 2019, respectively.
- 2.
- After obtaining of concerned attributes, the scores of each of the 18 districts in 2016 were calculated by S.S.A., as described in (b).
- (d)
- Scoring and Assigning Values for Exceptional Cases
- (e)
- Score Allocation of available Health Indicators
2.3.4. Determination of Multiplying Factors via Statistical and Spatial Means
2.3.5. Normalization
2.4. Metrics for Statistical Assessments
3. Results
3.1. Determination of Multiplying Factors and Selection of Case Study
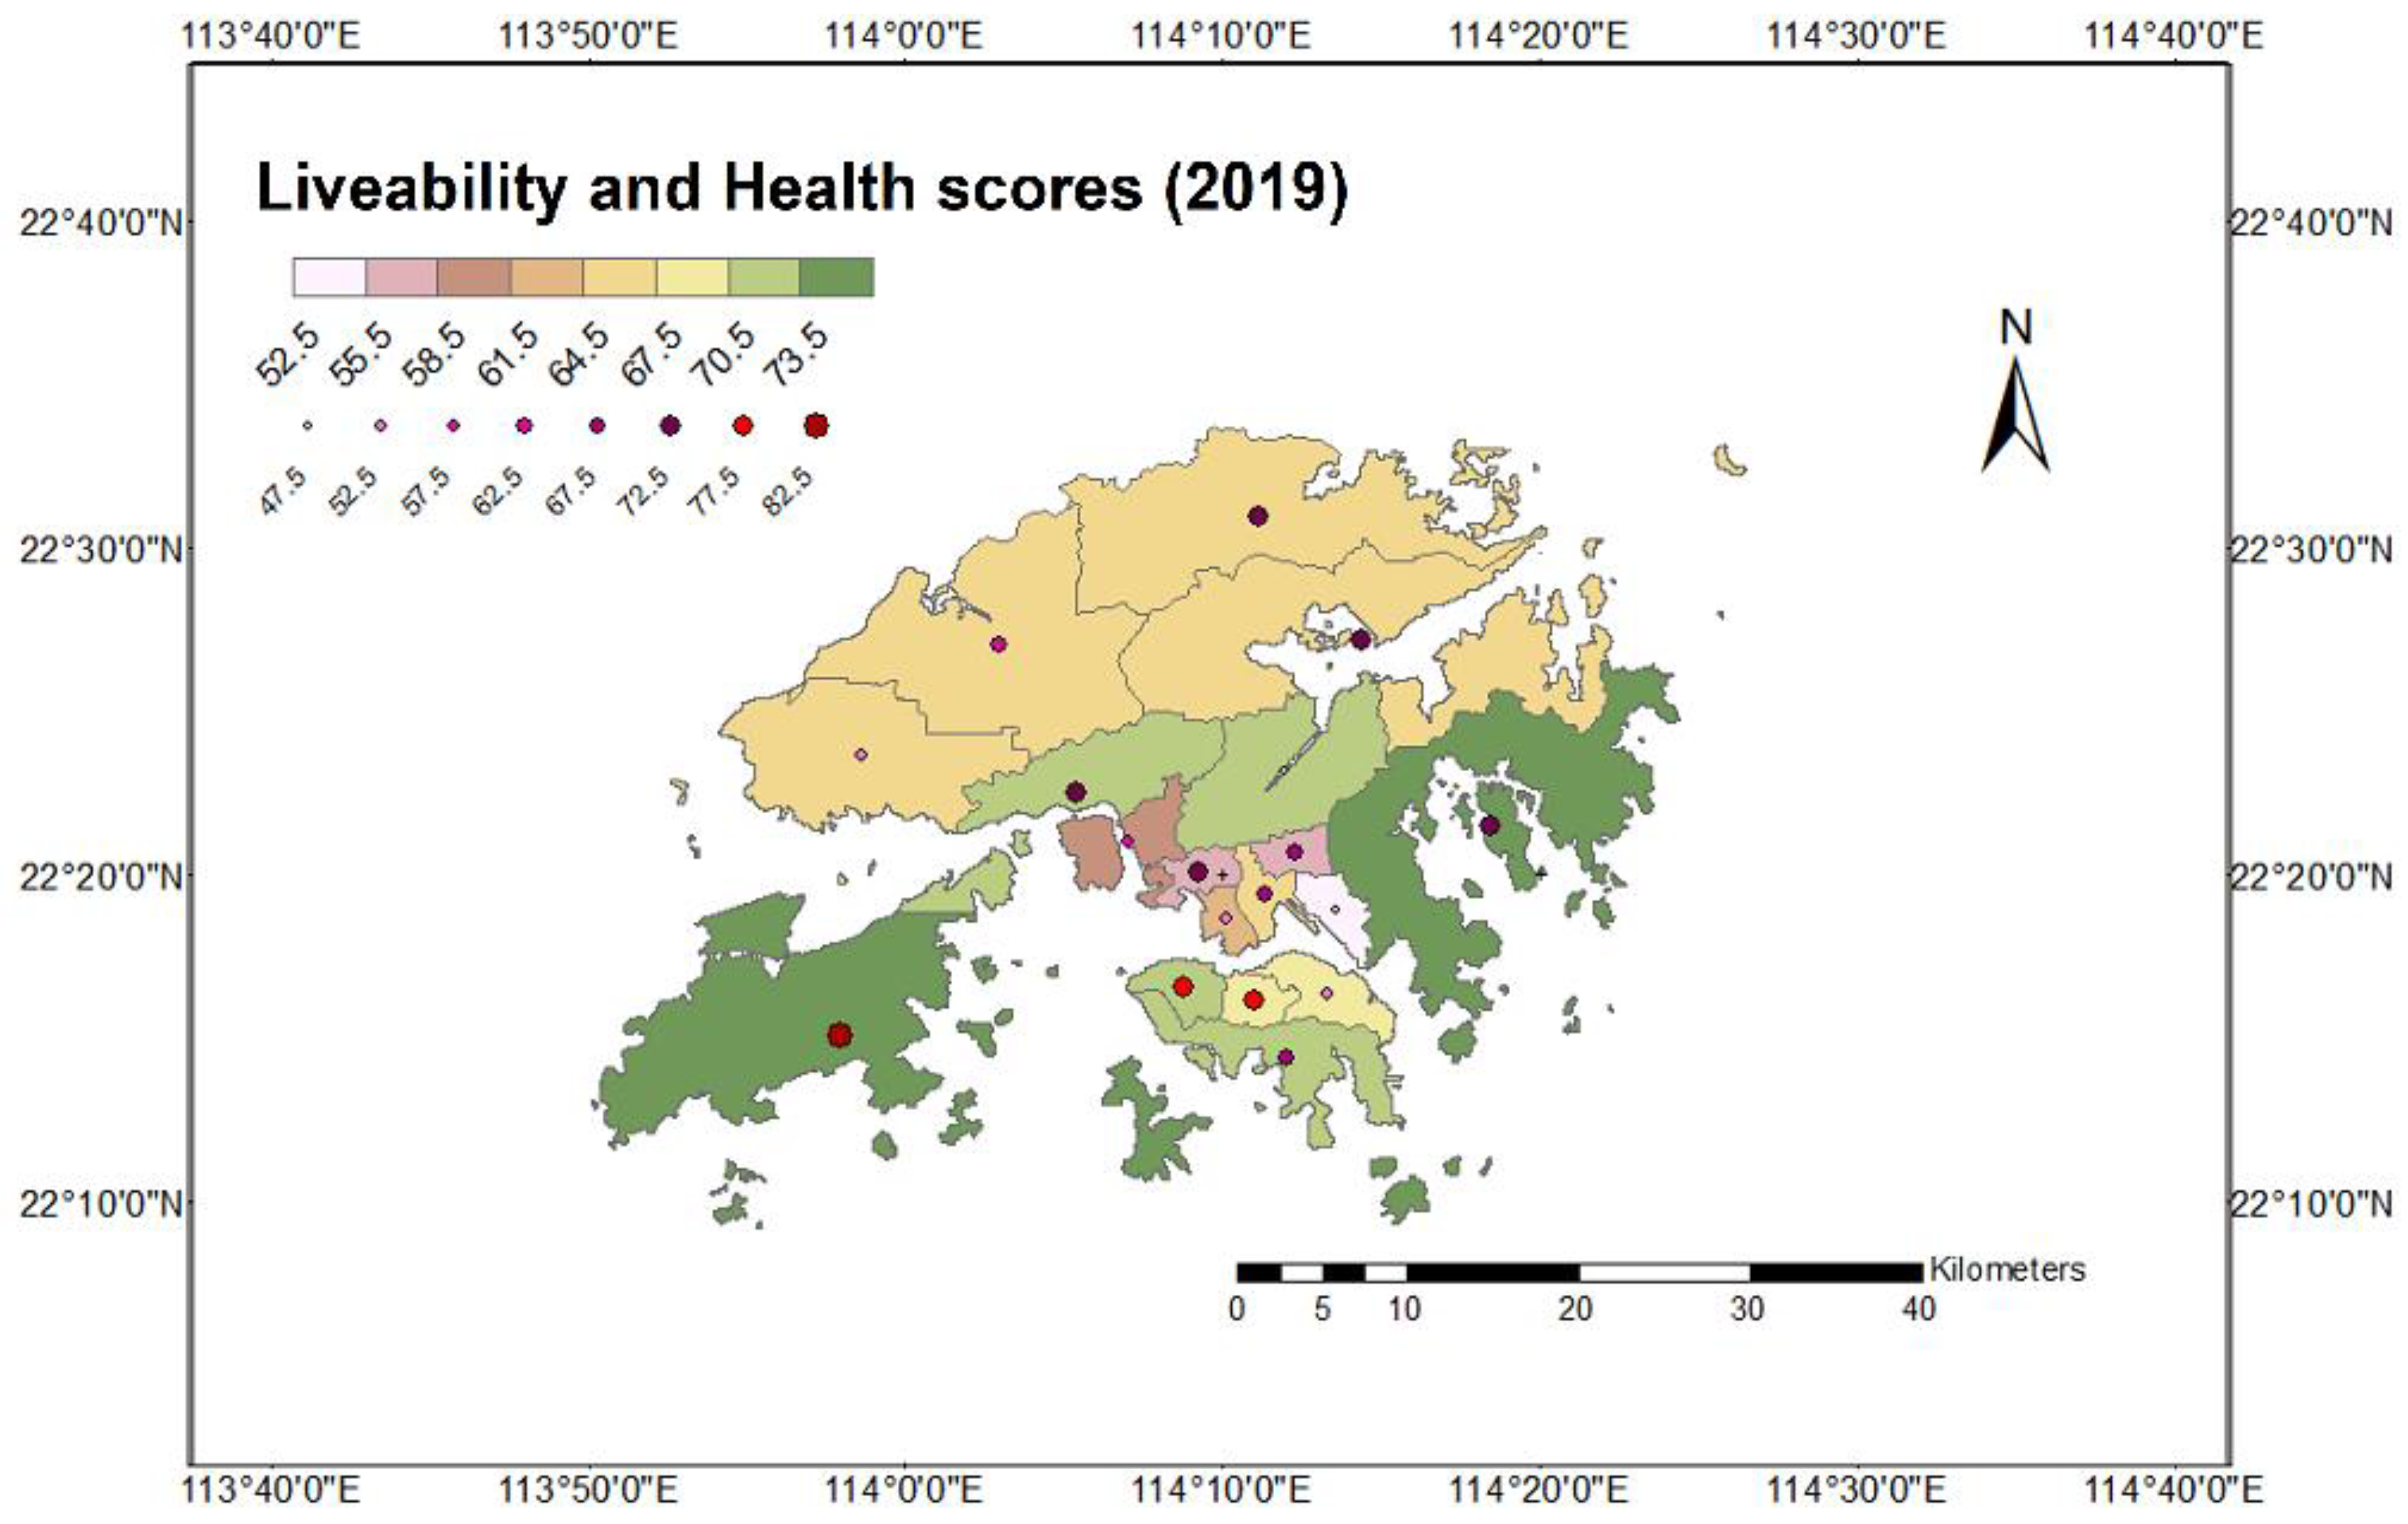
3.2. Liveability and Health Performance of All Districts
3.3. Temporal Changes in Liveability Performances
4. Discussion and Limitations
4.1. Spatial Features and Enhancement of Liveability in Different District Types
4.1.1. Residential District: Sai Kung
4.1.2. Commercial and Residential District: Kwun Tong
4.1.3. Industrial District: Kwai Tsing
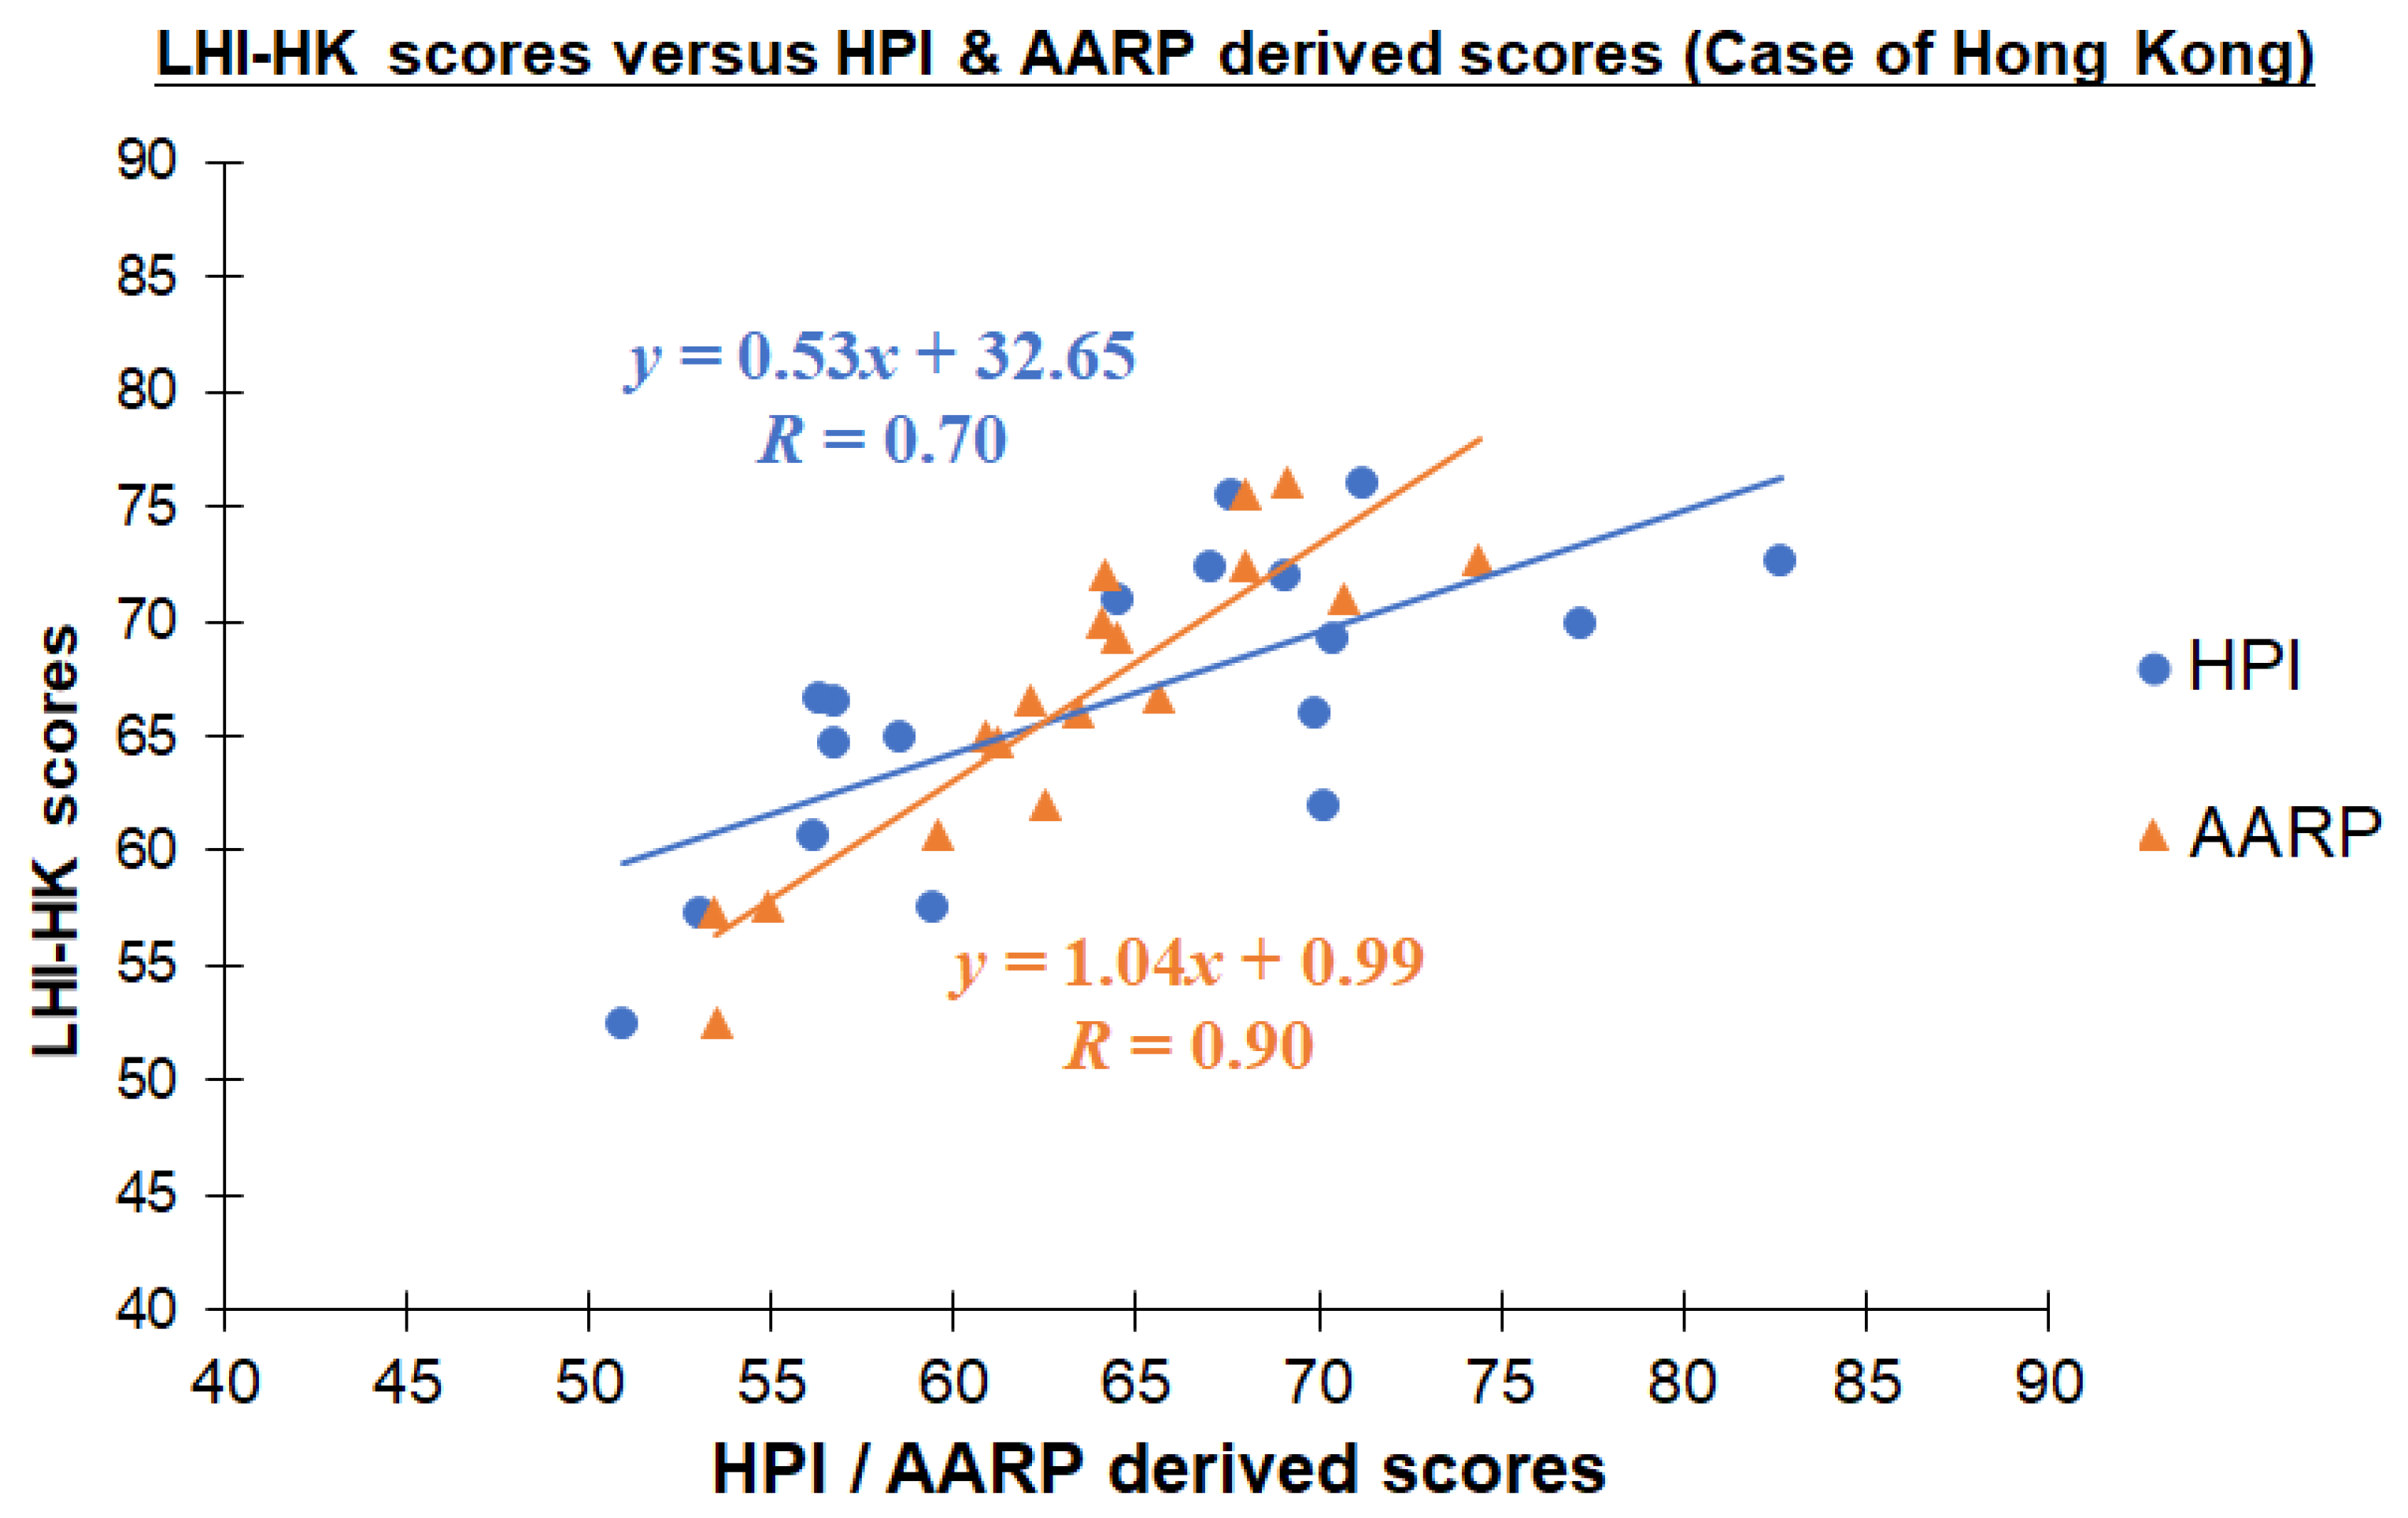
4.2. Validation of the LHI-HK Framework
4.3. Potential Uncertainties Resulting from Projection of Missing Entries
4.4. Potential Limitations and Insights of Current Study
5. Conclusions
Supplementary Materials
Author Contributions
Funding
Institutional Review Board Statement
Data Availability Statement
Acknowledgments
Conflicts of Interest
References
- Ng, J. High-density Sustainability and Liveability—The Case of Hong Kong. In Proceedings of the Sustainable Building 2013 Hong Kong Regional Conference, Urban Density & Sustainability, Hong Kong, China, 12–13 September 2013. [Google Scholar]
- Policy Innovation and Co-Ordination Office. Commission on Strategic Development: Liveable City–Hong Kong. 2016. Available online: https://www.pico.gov.hk/en/CSD_2015_2017/csd_9_2015e.pdf (accessed on 10 May 2021).
- Higgs, C.; Badland, H.; Simons, K.; Knibbs, L.D.; Giles-Corti, B. The Urban Liveability Index: Developing a policy-relevant urban liveability composite measure and evaluating associations with transport mode choice. Int. J. Health Geogr. 2019, 18, 14. [Google Scholar] [CrossRef] [PubMed]
- The United Nations. United Nations Conference on Human Settlements: Habitat II. 1996. Available online: https://www.un.org/en/conferences/habitat/istanbul1996 (accessed on 10 May 2021).
- OECD. National Urban Policy in OECD Countries; OECD Publishing: Paris, France, 2017. [Google Scholar] [CrossRef]
- UN. Health as the Pulse of the New Urban Agenda: United Nations Conference on Housing and Sustainable Urban Development. Quito: United Nations. 2016. Available online: http://apps.who.int/iris/bitstream/handle/10665/250367/9789241511445-eng.pdf (accessed on 10 May 2021).
- Giap, T.K.; Thye, W.W.; Aw, G. A new approach to measuring the liveability of cities: The Global Liveable Cities Index. WRSTSD 2014, 11, 176–196. [Google Scholar] [CrossRef]
- Appleyard, D. Livable Streets: Protected Neighborhoods? Ann. Am. Acad. Political Soc. Sci. 1980, 451, 106–117. [Google Scholar] [CrossRef]
- Herrman, T.; Lewis, R. Research Initiative 2015-2017: Framing Livability-What is Livability? Sustain. Cities Initiat. 2015, 2, 1–11. [Google Scholar]
- Perkins, N.D. Livability, Regional Equity, and Capability: Closing in on Sustainable Land Use. U. Balt. L. Rev. 2008, 37, 2. [Google Scholar]
- Harrell, R.; Lynott, J.; Guzman, S.; Lampkin, C. What is Livable? Community Preferences of Older Adults. AARP PPI. 2014. Available online: https://www.aarp.org/ppi/issues/livable-communities/info-2015/what-is-livable-AARP-ppi-liv-com.html (accessed on 10 May 2021).
- OECD. How’s Life in Your Region? Measuring Regional and Local Well-being for Policy Making; OECD Publishing: Paris, France, 2014. [Google Scholar]
- Paul, A.; Sen, J. A critical review of liveability approaches and their dimensions. Geoforum 2020, 117, 90–92. [Google Scholar] [CrossRef]
- World Health Organization. Types of Healthy Settings. Available online: https://www.who.int/healthy_settings/types/cities/en/ (accessed on 10 May 2021).
- World Health Organization. Healthy Cities: Good Health Is Good Politics: Toolkit for Local Governments to Support Healthy Urban Development; WHO Regional Office for the Western Pacific: Manila, Philippine, 2015. [Google Scholar]
- Department of Health. Building Healthy Cities–Guidelines for Implementing a Healthy Cities Project in Hong Kong. 2007. Available online: https://www.chp.gov.hk/files/pdf/building_healthy_cities_guidelines.pdf (accessed on 10 May 2021).
- Badland, H.; Pearce, J. Liveable for whom? Prospects of urban liveability to address health inequities. Soc. Sci. Med. 2019, 232, 94–105. [Google Scholar] [CrossRef] [PubMed]
- Kenkel, D.S. Health behavior, health knowledge, and schooling. J. Political Econ. 1991, 99, 287–305. [Google Scholar] [CrossRef]
- Krefis, A.C.; Augustin, M.; Schlünzen, K.H.; Oßenbrügge, J.; Augustin, J. How does the urban environment affect health and well-being? A systematic review. Urban Sci. 2018, 2, 21. [Google Scholar] [CrossRef]
- Srinivasan, S.; O’fallon, L.R.; Dearry, A. Creating healthy communities, healthy homes, healthy people: Initiating a research agenda on the built environment and public health. Am. J. Public Health 2003, 93, 1446–1450. [Google Scholar] [CrossRef] [PubMed]
- Krieger, J.; Higgins, D.L. Housing and health: Time again for public health action. Am. J. Public Health 2002, 92, 758–768. [Google Scholar] [CrossRef] [PubMed]
- Howden-Chapman, P. Housing standards: A glossary of housing and health. J. Epidemiol. Community Health 2004, 58, 162–168. [Google Scholar] [CrossRef]
- Wolch, J.R.; Byrne, J.; Newell, J.P. Urban green space, public health, and environmental justice: The challenge of making cities ‘just green enough’. Landsc. Urban Plan. 2014, 125, 234–244. [Google Scholar] [CrossRef]
- Cutler, D.M.; Lleras-Muney, A. Education and Health: Evaluating Theories and Evidence. NBER Working Paper Series. 2006. Available online: https://www.nber.org/system/files/working_papers/w12352/w12352.pdf (accessed on 12 May 2021).
- Khomenko, S.; Nieuwenhuijsen, M.; Ambros, A.; Wegener, S.; Mueller, N. Is a liveable city a healthy city? Health impacts of urban and transport planning in Vienna, Austria. Environ. Res. 2020, 183, 109238. [Google Scholar] [CrossRef] [PubMed]
- The Economic Intelligence Unit. The Global Liveability Index 2019: A free overview. 2019. Available online: https://www.cbeinternational.ca/pdf/Liveability-Free-report-2019.pdf (accessed on 12 May 2021).
- The Economist. A Report by the Economist Intelligence Unit. The Global Liveability Index 2021. Available online: https://www.eiu.com/n/campaigns/global-liveability-index-2021/#mktoForm_anchor (accessed on 12 May 2021).
- Mercer: Quality of Living Reports. Available online: https://www.imercer.com/products/quality-of-living (accessed on 12 May 2021).
- OECD. OECD Better Life Index. Available online: http://www.oecdbetterlifeindex.org/ (accessed on 12 May 2021).
- Luo, C. HK Livability Down—And That’s Not Counting Unrest. The Standard. 2019. Available online: https://www.thestandard.com.hk/section-news/section/4/211351/HK-livability-down---and-that’s-not-counting-unrest#:~:text=The%202019%20edition%20of%20The,compared%20to%2035th%20last%20year (accessed on 12 May 2021).
- OECD. What’s the Better Life Index? Available online: http://www.oecdbetterlifeindex.org/about/better-life-initiative/#question1 (accessed on 12 May 2021).
- Tan, K.G.; Woo, W.T.; Tan, B.S. A new instrument to promote knowledge-led growth: The global liveable cities index. IJBDG 2014, 3, 174–188. [Google Scholar] [CrossRef]
- Kashef, M. Urban livability across disciplinary and professional boundaries. Front. Archit. Res. 2016, 5, 239–253. [Google Scholar] [CrossRef]
- Environment Bureau. A Clean Air Plan for Hong Kong. 2013. Available online: https://www.enb.gov.hk/en/files/New_Air_Plan_en.pdf (accessed on 12 May 2021).
- Transport Department. TD Commences Studies on Walkability and Assessment Mechanism to Take forward “Walk in HK” Initiative. Available online: https://www.td.gov.hk/en/publications_and_press_releases/press_releases/transport_department/index_id_2866.html (accessed on 15 May 2021).
- Transport and Housing Bureau. Long Term Housing Strategy Annual Progress Report 2020 (for the 10-Year Period from 2021-22 to 2030-31); Transport and Housing Bureau: Hong Kong, China, 2020.
- HKSAR Government. Hong Kong 2030+: Towards a Planning Vision and Strategy Transcending 2030; Public Engagement Booklet and Topical Papers; HKSAR Government: Hong Kong, China, 2016.
- Census and Statistics Department. Hong Kong in Figures (Latest Figures): Geographical Position. Available online: https://www.censtatd.gov.hk/hkstat/hkif/index.jsp (accessed on 15 May 2021).
- GovHK. Hong Kong—The Facts. Available online: https://www.gov.hk/en/about/abouthk/facts.htm (accessed on 15 May 2021).
- Planning Department. Land Utilization in Hong Kong 2019. Available online: https://www.pland.gov.hk/pland_en/info_serv/statistic/landu.html (accessed on 15 May 2021).
- Census and Statistics Department. Selected Social and Economic Characteristics of Population in the 18 District Council Districts in 2016. Available online: https://www.bycensus2016.gov.hk/data/Table_for_District_Councils.pdf (accessed on 15 May 2021).
- Lai, C. Open Space Opinion Survey (Summary Report), 2018 Research Report. Civic Exchange. Available online: https://civic-exchange.org/report/open-space-opinion-survey-summary-report/ (accessed on 15 May 2021).
- Lowe, M.; Whitzman, C.; Badland, H.; Davern, M.; Hes, D.; Aye, L.; Butterworth, I.; Giles-Corti, W. Liveable, Healthy, Sustainable: What Are the Key Indicators for Melbourne Neighbourhoods. Place, Health and Liveability Research Program. Research Paper. 2013. Available online: https://socialequity.unimelb.edu.au/__data/assets/pdf_file/0006/1979574/Liveability-Indicators-report.pdf (accessed on 15 May 2021).
- Virginia Commonwealth University Center on Society and Health. Why Education Matters to Health: Exploring the Causes. 2021. Available online: https://societyhealth.vcu.edu/work/the-projects/why-education-matters-to-health-exploring-the-causes.html (accessed on 15 May 2021).
- Education Bureau. Overview. Available online: https://www.edb.gov.hk/en/student-parents/ncs-students/overview/index.html (accessed on 15 May 2021).
- Legislative Council. Working Hours in Hong Kong. Available online: https://www.legco.gov.hk/research-publications/english/1920issh06-working-hours-in-hong-kong-20191108-e.pdf (accessed on 15 May 2021).
- Wong, K.; Chan, A.H.; Ngan, S.C. The effect of long working hours and overtime on occupational health: A meta-analysis of evidence from 1998 to 2018. Int. J. Environ. Res. Public Health 2019, 16, 2102. [Google Scholar] [CrossRef]
- Saiidi, U. Here’s Why Hong Kong Housing Is So Expensive. CNBC. Available online: https://www.cnbc.com/2017/04/09/heres-why-hong-kong-housing-is-so-expensive.html (accessed on 15 May 2021).
- Stevenson, A.; Wu, J. Tiny Apartments and Punishing Work Hours: The Economic Roots of Hong Kong’s Protests. The New York Times. Available online: https://www.nytimes.com/interactive/2019/07/22/world/asia/hong-kong-housing-inequality.html (accessed on 15 May 2021).
- Taylor, C. Hong Kong Named World’s Most Expensive City to Buy a Home. CNBC. Available online: https://www.cnbc.com/2019/04/12/hong-kong-average-house-price-hits-1point2-million.html (accessed on 15 May 2021).
- Kovacs-Györi, A.; Cabrera-Barona, P. Assessing Urban Livability through Residential Preference—An International Survey. Data. 2019, 4, 134. [Google Scholar] [CrossRef]
- Ng, J. Compact Sustainability and Liveability in Hong Kong. In Proceedings of the World SB14, Barcelona, Spain, 28–30 October 2014. [Google Scholar]
- Mak, H.W.L.; Ng, D.C.Y. Spatial and Socio-Classification of Traffic Pollutant Emissions and Associated Mortality Rates in High-Density Hong Kong via Improved Data Analytic Approaches. Int. J. Environ. Res. Public Health 2021, 18, 6532. [Google Scholar] [CrossRef] [PubMed]
- Lo, J. Measures to Tackle Urban Heat. Research Office. Information Services Division. Legislative Council Secretariat. Available online: https://www.legco.gov.hk/research-publications/english/essentials-2021ise04-measures-to-tackle-urban-heat.htm (accessed on 15 May 2021).
- Lee, C.P. Health care system and pharmacy practice in Hong Kong. Can. J. Hosp. Pharm. 2018, 71, 140. [Google Scholar] [CrossRef] [PubMed]
- Kong, X.; Yang, Y.; Gao, J.; Guan, J.; Liu, Y.; Wang, R.; Xing, B.; Li, Y.; Ma, W. Overview of the health care system in Hong Kong and its referential significance to mainland China. J. Chin. Med. Assoc. 2015, 78, 569–573. [Google Scholar] [CrossRef] [PubMed]
- Bucos, M.; Drăgulescu, B. Predicting Student Success Using Data Generated in Traditional Educational Environments. TEM J. 2018, 7, 617–625. [Google Scholar]
- Budiharto, W. Data science approach to stock prices forecasting in Indonesia during Covid-19 using Long Short-Term Memory (LSTM). J. Big Data 2021, 8, 47. [Google Scholar] [CrossRef]
- Tekin, A. Early prediction of students’ grade point averages at graduation: A data mining approach. Eurasian J. Educ. Res. 2014, 54, 207–226. [Google Scholar] [CrossRef]
- Census and Statistics Department. 2011 Population by-Census. District Profiles. Available online: https://www.census2011.gov.hk/en/district-profiles.html (accessed on 16 May 2021).
- Census and Statistics Department. 2016 Population by-Census. District Profiles. Available online: https://www.bycensus2016.gov.hk/en/bc-dp.html (accessed on 16 May 2021).
- Duke FUQUA, School of Business. Linear Trend Model. Available online: https://faculty.fuqua.duke.edu/~rnau/Decision411_2007/411trend.htm (accessed on 18 July 2021).
- GISGeography. Inverse Distance Weighting (IDW) Interpolation. Available online: https://gisgeography.com/inverse-distance-weighting-idw-interpolation/ (accessed on 18 July 2021).
- Rodriguez, M.C. The Origin and Development of Rating Scales. Educational Psychology. University of Minnesota. Available online: http://www.edmeasurement.net/resources/rodriguez2016-origin-of-rating-scales.pdf (accessed on 18 July 2021).
- Cross, L.H. Grading student. Pract. Assess. Res. Eval. 1994, 4, 8. [Google Scholar]
- Environmental Protection Department. Air Quality Monitoring Network of Hong Kong. Available online: https://www.aqhi.gov.hk/en/monitoring-network/air-quality-monitoring-network.html (accessed on 16 May 2021).
- Census and Statistics Department. Statistics–By Subject: Population and Households. Available online: https://censtatd.gov.hk/en/page_8000.html (accessed on 16 May 2021).
- Clean Air Network. No Improvement in Hong Kong’s NO2 Reduction for Nearly Two Decades. Available online: https://www.hongkongcan.org/hk/article/no-improvement-in-hong-kongs-no2-reduction-for-nearly-two-decades/ (accessed on 18 May 2021).
- Chan, H. Hong Kong Air Quality Improves but Ozone Reaches Record Levels. Hong Kong Free Press. Available online: https://hongkongfp.com/2019/01/12/hong-kong-air-quality-improves-ozone-reaches-record-levels/ (accessed on 18 May 2021).
- Strang, G. Introduction to Linear Algebra, 5th ed.; Wellesley-Cambridge Press: Wellesley, MA, USA, 2016; Section 3.4; pp. 164–180. [Google Scholar]
- GIS Geography. How to Calculate Root Mean Square Error (RMSE) in Excel. Available online: https://gisgeography.com/root-mean-square-error-rmse-gis/ (accessed on 20 May 2021).
- GIS Geography. How to Calculate Mean Absolute Error (MAE) in Excel. Available online: https://gisgeography.com/mean-absolute-error-mae-gis/ (accessed on 20 May 2021).
- AgriMetSoft. Online Calculators–Mean Bias Error. Available online: https://agrimetsoft.com/calculators/Mean%20Bias%20Error (accessed on 20 May 2021).
- Saaty, R.W. The Analytic Hierarchy Process—What It Is and How It Is Used. Math. Model. 1987, 9, 161–176. [Google Scholar] [CrossRef]
- Salar, S.G.; Othman, A.A.; Hasan, S.E. Identification of suitable sites for groundwater recharge in Awaspi watershed using GIS and remote sensing techniques. Environ. Earth Sci. 2018, 77, 701. [Google Scholar] [CrossRef]
- Othman, A.A.; Al-Maamar, A.F.; Al-Manmi, D.A.M.A.; Liesenberg, V.; Hasan, S.E.; Obaid, A.K.; Al-Quraishi, A.M.F. GIS-Based Modeling for Selection of Dam Sites in the Kurdistan Region, Iraq. ISPRS Int. J. Geo-Inf. 2020, 9, 244. [Google Scholar] [CrossRef]
- Saaty, T.L. The Analytic Hierarchy Process in Conflict Management. Int. J. Confl. Manag. 1990, 1, 47–68. [Google Scholar] [CrossRef]
- Jayantha, W.M.; Qian, Q.K.; Chan, O.Y. Applicability of ‘Aging in Place’ in redeveloped public rental housing estates in Hong Kong. Cities 2018, 83, 140–151. [Google Scholar] [CrossRef]
- Jayantha, W.M.; Cheung, S.L. Critical evaluation of ‘ageing in place’ in redeveloped public rental housing estates in Hong Kong. Ageing Soc. 2019, 40, 1–34. [Google Scholar]
- Centre for Health Education and Health Promotion, School of Public Health and Primary Care, Faculty of Medicine, CUHK. Wong Tai Sin Healthy and Safe City Community Diagnosis Study Report. November, 2010. Available online: https://www.cuhk.edu.hk/med/hep/research/pdf/reports/WTS_Report_Eng.pdf (accessed on 20 May 2021).
- Census and Statistics Department. Population and Household Statistics Analysed by District Council District 2020. Available online: https://www.censtatd.gov.hk/en/EIndexbySubject.html?pcode=B1130301&scode=150 (accessed on 20 May 2021).
- Development Bureau. Land Area of Major Land Use Zonings by District Council (in Hectares). June 2012. Available online: https://www.devb.gov.hk/filemanager/en/content_69/P201207040369_0369_96621.pdf (accessed on 20 May 2021).
- Home Affairs Department. Profile (Sai Kung District). Available online: https://www.had.gov.hk/en/18_districts/my_map_13.htm (accessed on 20 May 2021).
- Planning Department. Tseung Kwan O. Available online: https://www.pland.gov.hk/pland_en/outreach/educational/NTpamphlets/2019/tko.html (accessed on 22 May 2021).
- HKUST, Environmental Central Facility of Institute for the Environment. ENVF Atmospheric and Environmental Database. Available online: http://envf.ust.hk/dataview/share/3.2/overview.html (accessed on 22 June 2021).
- The Legislative Council Commission. Legislative Council Panel on Transport-Improvement Works for Cycle Track Networks in New Towns and Operation of Automated Dockless Bicycle Rental Services. Available online: https://www.legco.gov.hk/yr19-20/english/panels/tp/papers/tp20200515cb4-532-5-e.pdf (accessed on 22 May 2021).
- Sai Kung District Council. Sai Kung District Council 2018 Annual Report. Available online: https://www.districtcouncils.gov.hk/sk/english/links/files/annual_report_2018_BL.pdf (accessed on 22 May 2021).
- Rojas-Rueda, D.; De Nazelle, A.; Tainio, M.; Nieuwenhuijsen, M.J. The health risks and benefits of cycling in urban environments compared with car use: Health impact assessment study. BMJ 2011, 343, d4521. [Google Scholar] [CrossRef]
- Hong Kong Tourism Board. Sai Kung. Available online: https://www.discoverhongkong.com/ca/explore/neighbourhoods/sai-kung.html (accessed on 22 May 2021).
- Sai Kung District Council. Sai Kung District Council 2016 Annual Report. Available online: https://www.districtcouncils.gov.hk/sk/english/links/files/annual_report_2016_BL.pdf (accessed on 22 May 2021).
- Sai Kung District Council. Sai Kung District Council 2017 Annual Report. Available online: https://www.districtcouncils.gov.hk/sk/english/links/files/annual_report_2017_BL.pdf (accessed on 22 May 2021).
- Sai Kung District Council. Sai Kung District Council 2016–2019 Work Report. Available online: https://www.districtcouncils.gov.hk/sk/english/links/files/SK_2016-2019_EN.pdf (accessed on 22 May 2021).
- Census and Statistics Department, HKSAR Government. Hong Kong Poverty Situation Report 2019. Available online: https://www.povertyrelief.gov.hk/eng/pdf/Hong_Kong_Poverty_Situation_Report_2019.pdf (accessed on 25 May 2021).
- Census and Statistics Department, HKSAR Government. Table E489: Land Area, Mid-Year Population and Population Density by District Council District. Available online: https://data.gov.hk/en-data/dataset/hk-censtatd-tablechart-popn/resource/07a44cda-7d19-4a7d-b009-8e601b59a71a (accessed on 25 May 2021).
- Hermes, J. How Traffic Jams Affect Air Quality. Available online: https://www.environmentalleader.com/2012/01/how-traffic-jams-affect-air-quality/ (accessed on 25 May 2021).
- Development Bureau. Pedestrian Environment Improvement Scheme for Transformation of Kwun Tong Business Area-Feasibility Study. Available online: https://www.ekeo.gov.hk/walkablekwuntong/1st_stage_key.html#contentnavbar2 (accessed on 25 May 2021).
- Urban Renewal Authority. Blogs: Article on 14 March 2021. Available online: https://ura.org.hk/tc/media/blog/blog_20210314 (accessed on 27 May 2021).
- Urban Renewal Authority. Kwun Tong Town Centre Project (K7) (Park Metropolitan-DA1, Grand Central-DAs 2&3). Available online: https://www.ura.org.hk/en/project/redevelopment/kwun-tong-town-centre-project (accessed on 27 May 2021).
- Development Bureau. “Walkable” Kowloon East. Available online: https://www.ekeo.gov.hk/en/projects/walkable_ke/index.html (accessed on 27 May 2021).
- News.gov.hk. LCQ6: Air Pollution Caused by Container Vessels. Available online: https://www.info.gov.hk/gia/general/201506/17/P201506170559.htm (accessed on 27 May 2021).
- Clean Air Network. 2017 First Half Yearly Air Quality Review Public health is STILL under Threat from Roadside Air Pollution. Available online: http://canwp.twoinit.com/article/2017%E5%B9%B4%E4%B8%8A%E5%8D%8A%E5%B9%B4%E7%A9%BA%E6%B0%A3%E8%B3%AA%E7%B4%A0%E5%9B%9E%E9%A1%A7/ (accessed on 27 May 2021).
- Kwai Tsing District Council. District Highlights. Available online: https://www.districtcouncils.gov.hk/kwt/english/info/highlight_01.html (accessed on 27 May 2021).
- Kwai Tsing District Health Centre. Service Introduction. Available online: https://kwtdhc.org.hk/en/service_intro/service_contents (accessed on 27 May 2021).
- AARP Livability Index. Available online: https://livabilityindex.aarp.org/ (accessed on 30 May 2021).
- Public Health Alliance of Southern California. The California Healthy Places Index (HPI). Available online: https://healthyplacesindex.org/about/ (accessed on 30 May 2021).
- Chhetri, K. Computation of Errors and Their Analysis on Physics Experiments. Himal. Phys. 2013, 3, 78–86. [Google Scholar] [CrossRef][Green Version]
- Md, N. Price to Income Ratio Approach in Housing Affordability. J. Bus. Econ. Manag. 2015, 3, 1190–1193. [Google Scholar]
- Chung, R.Y.N.; Chung, G.K.K.; Gordon, D.; Mak, J.K.L.; Zhang, L.F.; Chan, D.; Lai, F.T.T.; Wong, H.; Wong, S.Y.S. Housing affordability effects on physical and mental health: Household survey in a population with the world’s greatest housing affordability stress. J. Epidemiol Community Health 2020, 74, 164–172. [Google Scholar] [CrossRef]
- Vallée, J.; Cadot, E.; Roustit, C.; Parizot, I.; Chauvin, P. The role of daily mobility in mental health inequalities: The interactive influence of activity space and neighbourhood of residence on depression. Soc. Sci. Med. 2011, 73, 1133–1144. [Google Scholar] [CrossRef] [PubMed]
- Han, S.; Bian, H.; Feng, Y.; Liu, A.; Li, X.; Zeng, F.; Zhang, X. Analysis of the Relationship between O3, NO and NO2 in Tianjin, China. Aerosol. Air Qual. Res. 2011, 11, 128–139. [Google Scholar] [CrossRef]
- Mak, H.W.L.; Lam, Y.F. Comparative assessments and insights of data openness of 50 smart cities in air quality aspects. Sustain. Cities Soc. 2021, 69, 102868. [Google Scholar] [CrossRef]
- Liu, Z.; Barlow, J.F.; Chan, P.-W.; Fung, J.C.H.; Li, Y.; Ren, C.; Mak, H.W.L.; Ng, E. A Review of Progress and Applications of Pulsed Doppler Wind LiDARs. Remote Sens. 2019, 11, 2522. [Google Scholar] [CrossRef]
- Mak, H.W.L.; Laughner, J.L.; Fung, J.C.H.; Zhu, Q.; Cohen, R.C. Improved Satellite Retrieval of Tropospheric NO2 Column Density via Updating of Air Mass Factor (AMF): Case Study of Southern China. Remote Sens. 2018, 10, 1789. [Google Scholar] [CrossRef]
- Schoeb, V. Healthcare Service in Hong Kong and its Challenges. The Role of Health Professionals within a Social Model of Health. China Perspect. 2016, 2016/4, 51–58. [Google Scholar] [CrossRef]
- Baldauf, R. Roadside vegetation design characteristics that can improve local, near-road air quality. Transp. Res. D Transp. Environ. 2017, 52, 354–361. [Google Scholar] [CrossRef] [PubMed]
- Chau, C.K. Investigating the effects of greenery on temperature and thermal comfort in urban parks. In Proceedings of the Task Force on the Green Deck Committee Meeting, The Hong Kong Polytechnic University, Hong Kong, China, 19 January 2016; Volume 19. [Google Scholar]
- CUHK Jockey Club Institute of Ageing, The Chinese University of Hong Kong. Jockey Club Ageing-Friendly City Project: Baseline Assessment Report of Sha Tin; Hong Kong Jockey Club Charities Trust: Hong Kong, China, 2016. [Google Scholar]
- CUHK Jockey Club Institute of Ageing, The Chinese University of Hong Kong. Jockey Club Ageing-Friendly City Project: Baseline Assessment Report of Kwai Tsing; Hong Kong Jockey Club Charities Trust: Hong Kong, China, 2017. [Google Scholar]


| R Value | Case 1 | Case 2 | Case 3 |
|---|---|---|---|
| R ≥ 0.5 | 1 | 3 | 6 |
| 0.4 ≤ R < 0.5 | 1 | 3 | 5 |
| 0.3 ≤ R < 0.4 | 1 | 2.5 | 4 |
| 0.2 ≤ R < 0.3 | 1 | 2 | 3 |
| 0.1 ≤ R < 0.2 | 1 | 1.5 | 2 |
| R < 0.1 | 1 | 1 | 1 |
| Exceptional indicators (Spatial Consideration) | - | - | 5 for the following indicators:
|
| Ed. (40) * | Econ. (190) * | Hou. (140) * | Walk. (30) * | Env. (240) * | Hea. (30) * | Health (100) ** | |
|---|---|---|---|---|---|---|---|
| Hong Kong Island | |||||||
| Central and Western [3; 3; 3] | 38.62 (39.56) | 153.65 (149.18) | 76.97 (74.62) | 28.78 (28.78) | 179.25 (178.29) | 16.10 | 78.10 |
| Eastern [8; 8; 14] | 29.61 (27.97) | 153.00 (153.17) | 104.53 (103.37) | 17.86 (17.77) | 135.72 (147.87) | 13.93 | 56.66 |
| Southern [5; 4; 9] | 23.91 (24.49) | 137.22 (140.59) | 102.61 (102.90) | 14.73 (14.96) | 187.82 (186.83) | 14.96 | 71.31 |
| Wan Chai [7; 7; 2] | 40.00 (40.00) | 150.85 (149.56) | 91.11 (89.15) | 21.46 (21.24) | 156.86 (157.17) | 11.50 | 78.87 |
| Kowloon | |||||||
| Kowloon City [13; 11; 10] | 27.77 (28.85) | 139.69 (142.36) | 88.66 (89.19) | 16.68 (16.86) | 143.35 (145.66) | 18.58 (19.58) | 70.57 |
| Kwun Tong [18; 18; 18] | 15.08 (15.08) | 106.17 (96.35) | 78.02 (78.93) | 17.83 (17.90) | 118.52 (125.07) | 18.38 | 47.72 |
| Sham Shui Po [16; 16; 8] | 21.52 (20.74) | 111.32 (121.75) | 72.09 (72.86) | 18.14 (18.31) | 136.40 (138.29) | 13.94 | 73.46 |
| Wong Tai Sin [17; 17; 11] | 14.80 (15.51) | 114.89 (115.15) | 93.10 (93.76) | 11.87 (11.99) | 123.17 (131.91) | 15.36 | 69.14 |
| Yau Tsim Mong [14; 14; 16] | 27.31 (28.85) | 120.38 (121.11) | 72.23 (71.01) | 27.51 (27.67) | 150.08 (153.50) | 13.50 | 55.18 |
| New Territories | |||||||
| Islands [1; 2; 1] | 27.49 (25.01) | 150.38 (144.35) | 123.18 (123.95) | 14.81 (14.50) | 188.49 (184.30) | 14.21 | 87.67 |
| Kwai Tsing [15; 15; 13] | 14.71 (14.99) | 118.92 (118.06) | 80.97 (81.57) | 14.23 (14.24) | 152.34 (155.87) | 21.92 | 58.54 |
| North [11; 9; 5] | 15.26 (15.77) | 98.28 (105.40) | 100.62 (100.74) | 17.21 (17.40) | 189.43 (187.28) | 19.83 | 77.06 |
| Sai Kung [2; 1; 7] | 25.10 (26.32) | 155.41 (167.72) | 120.53 (121.73) | 10.78 (10.86) | 166.45 (165.41) | 17.70 | 73.80 |
| Sha Tin [6; 6; 17] | 23.82 (23.18) | 139.38 (133.53) | 103.81 (104.16) | 12.46 (12.49) | 176.63 (177.57) | 24.49 | 52.59 |
| Tai Po [10; 12; 6] | 19.95 (20.83) | 110.22 (112.06) | 103.00 (102.09) | 17.64 (18.34) | 178.96 (170.67) | 11.62 | 76.98 |
| Tsuen Wan [4; 5; 4] | 24.83 (24.49) | 159.37 (159.75) | 104.08 (102.94) | 16.84 (17.09) | 166.01 (167.15) | 11.35 | 77.48 |
| Tuen Mun [9; 13; 15] | 16.83 (16.03) | 125.63 (112.51) | 107.47 (107.61) | 17.57 (17.76) | 167.05 (163.55) | 16.08 | 55.77 |
| Yuen Long [12; 10; 12] | 16.18 (16.56) | 105.94 (115.52) | 111.91 (112.70) | 12.78 (12.96) | 175.21 (169.76) | 17.28 (18.28) | 63.48 |
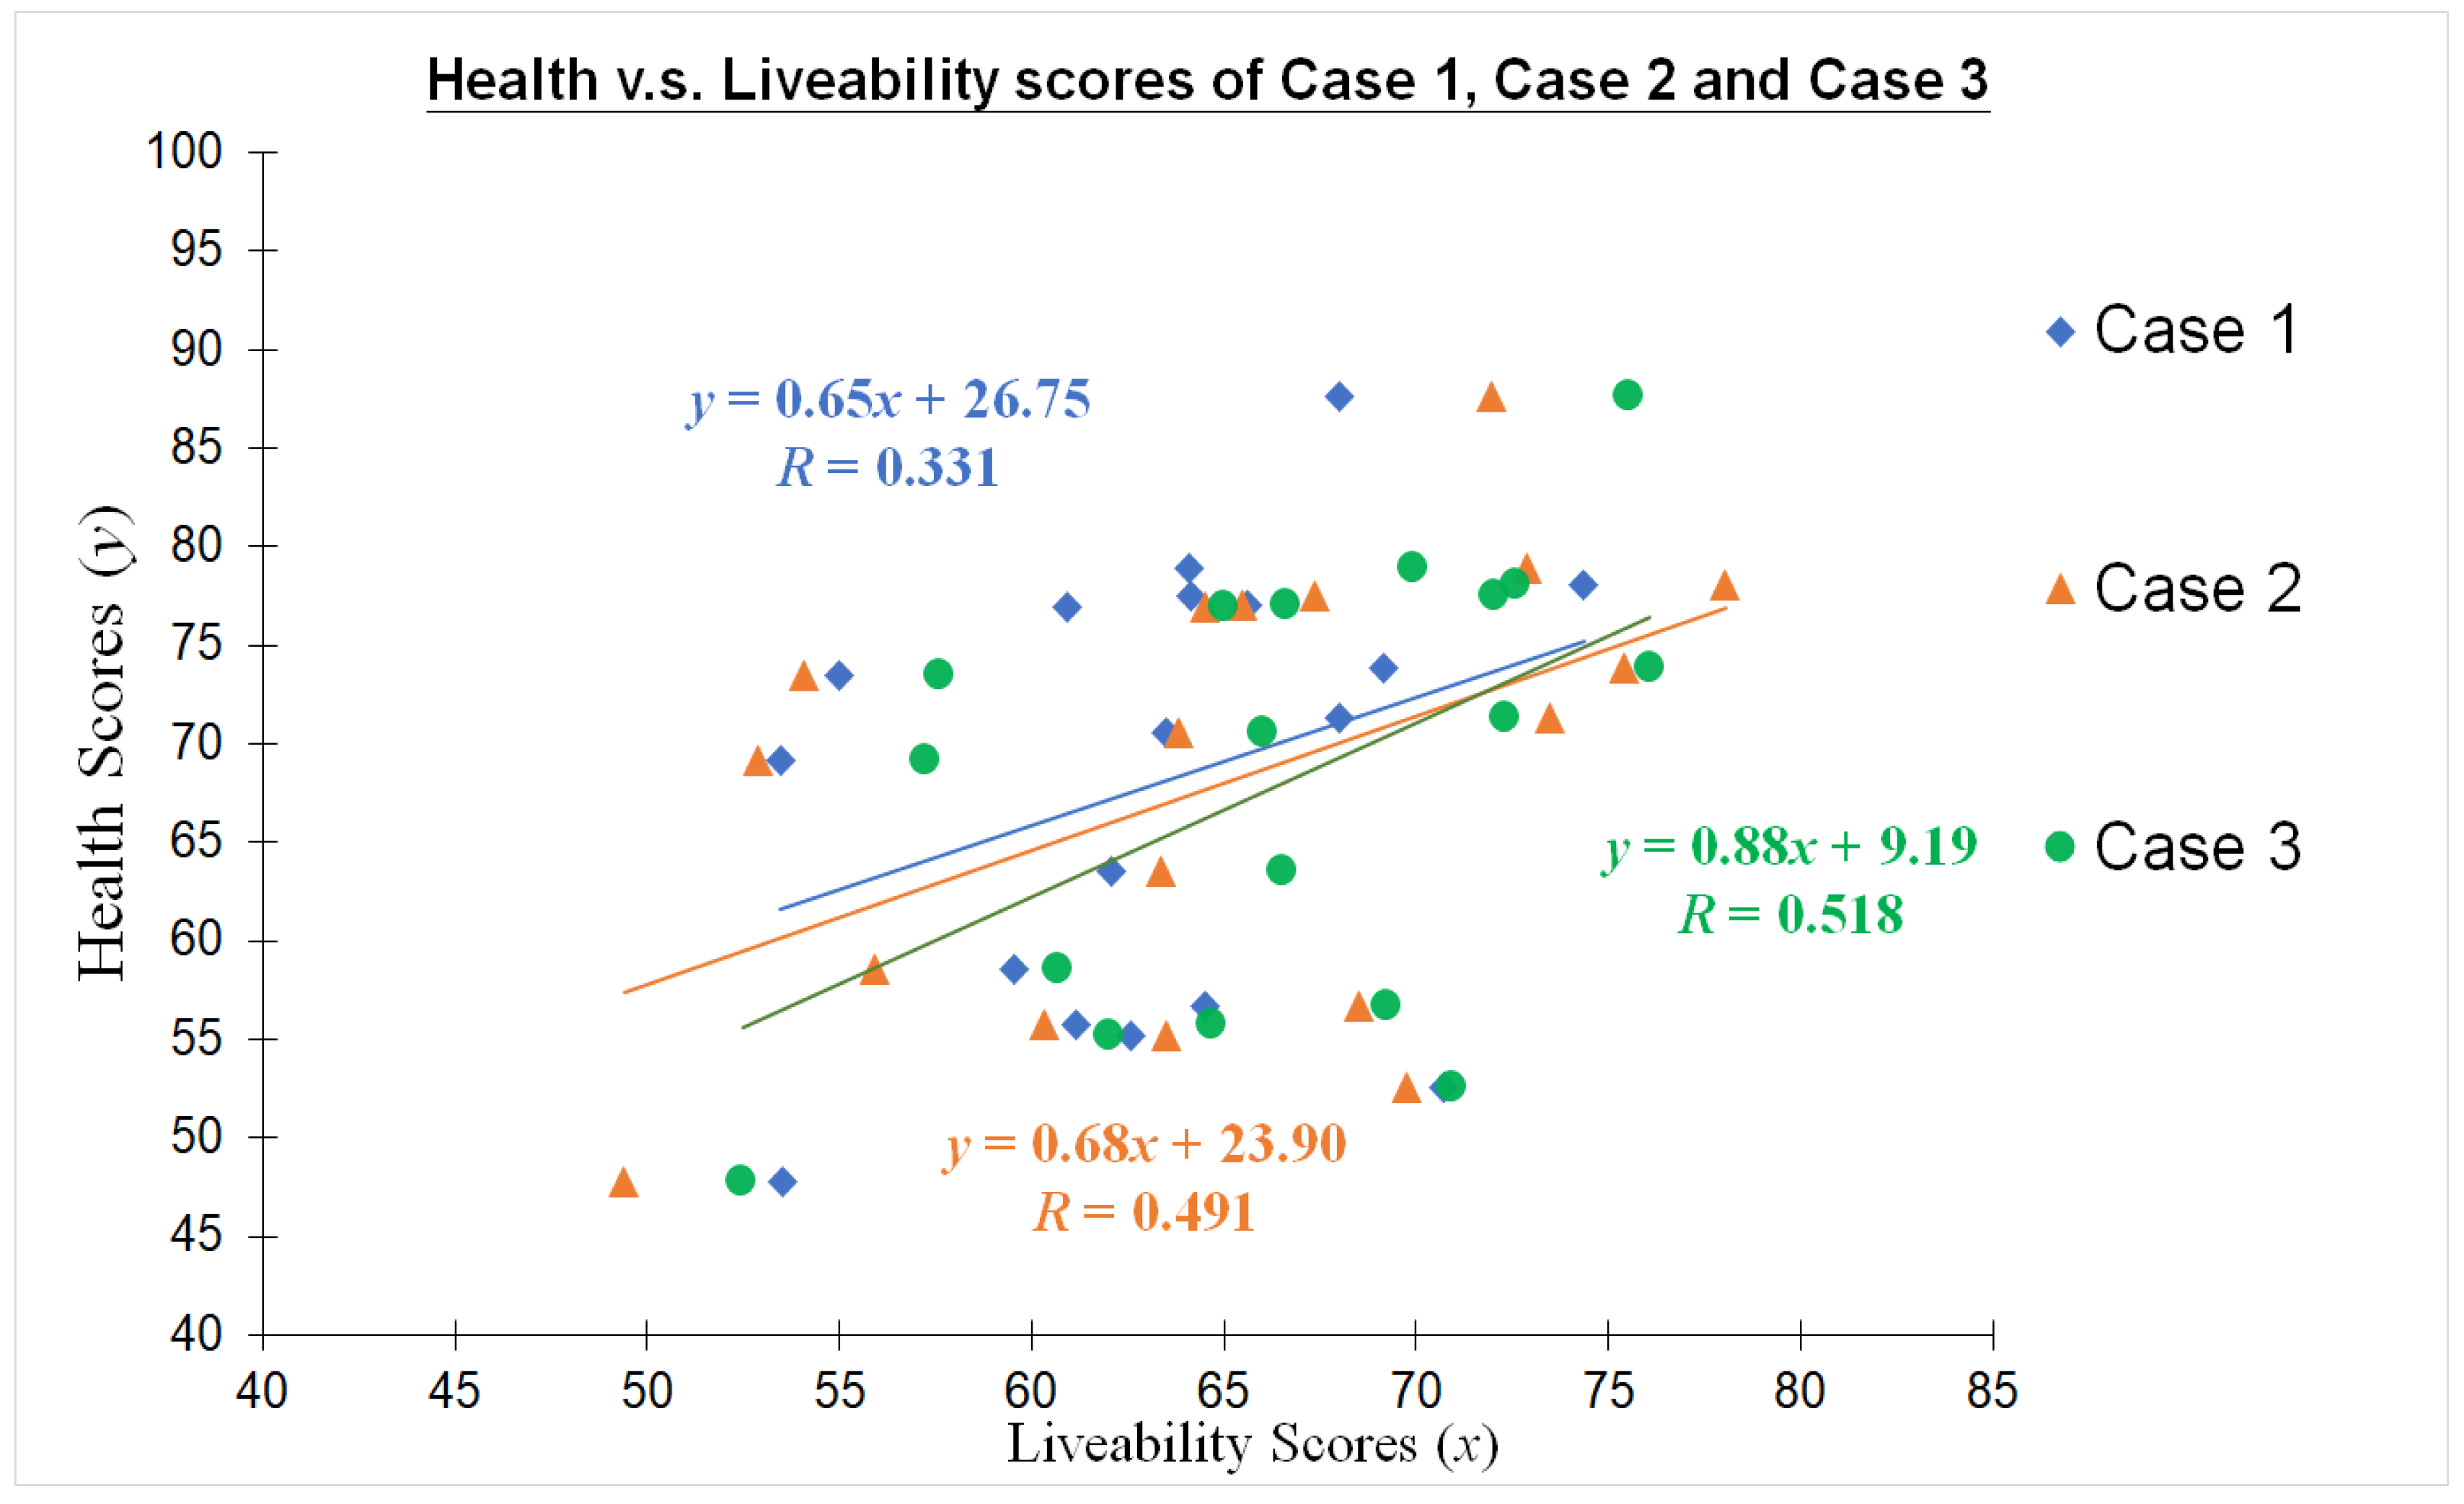
| Equation (y = mx + c) * | R Value ** | RMSE ** | MAE ** | MBE ** | p-Value ** | |
|---|---|---|---|---|---|---|
| 2016 | 0.496 | 9.48 | 8.18 | −0.001 | 0.0314 | |
| 2019 | 0.518 | 9.35 | 8.20 | −0.00009 | 0.0233 |
Publisher’s Note: MDPI stays neutral with regard to jurisdictional claims in published maps and institutional affiliations. |
© 2021 by the authors. Licensee MDPI, Basel, Switzerland. This article is an open access article distributed under the terms and conditions of the Creative Commons Attribution (CC BY) license (https://creativecommons.org/licenses/by/4.0/).
Share and Cite
Chi, Y.L.; Mak, H.W.L. From Comparative and Statistical Assessments of Liveability and Health Conditions of Districts in Hong Kong towards Future City Development. Sustainability 2021, 13, 8781. https://doi.org/10.3390/su13168781
Chi YL, Mak HWL. From Comparative and Statistical Assessments of Liveability and Health Conditions of Districts in Hong Kong towards Future City Development. Sustainability. 2021; 13(16):8781. https://doi.org/10.3390/su13168781
Chicago/Turabian StyleChi, Yan Ling, and Hugo Wai Leung Mak. 2021. "From Comparative and Statistical Assessments of Liveability and Health Conditions of Districts in Hong Kong towards Future City Development" Sustainability 13, no. 16: 8781. https://doi.org/10.3390/su13168781
APA StyleChi, Y. L., & Mak, H. W. L. (2021). From Comparative and Statistical Assessments of Liveability and Health Conditions of Districts in Hong Kong towards Future City Development. Sustainability, 13(16), 8781. https://doi.org/10.3390/su13168781