1. Introduction
The agri-food sector is of prime importance for many countries worldwide, including Greece. The sector is inherently connected to all sustainability dimensions and is explicitly and implicitly associated with many of the Sustainable Development Goals (SDGs) set in Resolution 70/1 entitled “Transforming our world: the 2030 Agenda for Sustainable Development”, which was adopted by the United Nations General Assembly in 2015 [
1]. Among others, the agri-food sector is a key employer, a demanding energy user, a significant polluter, and responsible for feeding the planet. Agri-food supply chains are the main instrument for connecting various actors in a ‘from farm to fork’ sense, i.e., producers, suppliers, manufacturers, service providers, retailers, and consumers. Therefore, gaining insights into the relationships that are formed in a supply chain context is crucial in order to facilitate the accomplishment of the SDGs.
In the 1980s, most businesses participated in the competition as separate entities. To improve their efficiency, they concentrated on matters such as total quality management, just-in-time, and benchmarking. Customers have become more sensitive to additional attributes as a result of market globalization. The demands of the market are rapidly evolving. Organizations must satisfy their customers in terms of cost, quality, efficiency, variety, and timely delivery, among other things. In such a scenario, companies have recognized that firm success is not enough to assist them in achieving these goals. Suppliers, logistics companies, retailers, and distributors are all part of a supply chain, which is made up of many different organizations that operate together in an interconnected environment, to achieve these goals. All operations relating to the processing and distribution of products from the raw material stage to end-user consumption, as well as the transfer of knowledge related to those activities, are included in the supply chain. Individual members’ output can be improved by several firms working together along the supply chain on common priorities and streamlined processes. Only by coordinating supply chain operations can this be possible [
2,
3,
4].
Globalization, combined with a higher rate of innovation and transition, has resulted in the creation of business networks. Supply chain management (SCM) has long been regarded as a key inter-organizational strategy for gaining a competitive advantage, especially in the context of supplier and consumer partnerships and networks. Interdependence among organizations is emphasized in SCM, with organizations working together to achieve efficiency in supply chain activities. Effective supply chain design and execution lowers costs, increases flexibility, improves performance, and maintains customer loyalty, making it a valuable way to retain a competitive edge. Researchers and academics detect specific factors that are essential in designing and maintaining successful supply chains [
5,
6].
The position of supply chain has shifted from cost central to other sources of competitive advantage over the last few decades. As a result, supply chain performance assessment and management are becoming increasingly important. However, due to the increasing complexity of supply chains, such an undertaking is challenging [
7]. Today, SCM entails a wide variety of activities aimed at facilitating the distribution of products and services between companies in various parts of the globe. Logistics service providers must continually adapt their service mix to satisfy the needs of upstream and downstream partners. In order to achieve competitiveness for the entire chain of partners, dynamic leadership, effective collaboration, and trust will be required [
8,
9].
Companies must leverage the competencies of their entire business network to gain a competitive advantage in today’s highly turbulent business environment. A supply chain network is a model for how a focal firm should create a network of partners to meet consumer demand. In this phase, a focal firm takes the lead and ensures that all of its partners are treated equally in terms of position, accountability, compensation, and risk sharing [
10]. Therefore, supply chain organizations must combine inter and intra corporate structures to bring value for customers and the supply chain network, which is the ultimate goal of SCM. The competitiveness of a company is inextricably linked to integrated SCM [
11].
As stated earlier, competition no longer occurs among individual organizations but has shifted among supply chains; thus, the motto for today’s dynamic companies is “supply chain vs. supply chain.” Companies recognize the value of SCM and the advantages of developing it through a strategic management framework in order to achieve a sustainable competitive advantage and profitability [
12,
13,
14]. Internal integration, supplier integration, and consumer integration are the three distinctive dimensions of supply chain integration. Supplier and consumer integration is referred to as external integration [
15].
It is apparent that the traits of different forms of supply chains are rapidly evolving, with matters such as globalization and green supply chains influencing companies’ ultimate goal, which is to profitably service consumers. Firms in the twenty-first century strive not only to improve their productivity, but also to maintain their supply chains in a sustainable manner [
16,
17]. Because of increased consumer awareness around environmental and social concerns, the philosophy of SCM has been adjusted to sustainability, implying that businesses must integrate sustainability into their SCM model. Firms are designing effective approaches to resolve environmental problems and challenges in order to improve their business image and profitability [
18].
Green SCM is an operational concept that combines environmental aspects with the conventional supply chain network, which incorporates sourcing, logistics, processing, delivery, and disposal or reuse and recycling [
19]. Firms have established social and environmental policies across their global supply chains as a result of the growing trend of global distribution networks [
20]. Via the idea of the green supply chain, sustainability has been adopted and implemented into the area of manufacturing and service management. Managers and practitioners are becoming more interested in green regulations and standards when it comes to choosing new strategies for manufacturers and organizations [
21]. Incorporating sustainability considerations into the supply chain allows businesses to adapt to increasing stakeholder pressure while still improving profit and competitive positions [
22].
There is a growing concern in analyzing global supply chains for key success factors such as cost, efficiency, distribution, sustainability, and interdependency, with the goal of developing green and efficient supply chain approaches. Material management, knowledge sharing and delivery, capital flows, and collaboration among supply chain partners can all be improved by incorporating sustainability measures into their supply chains [
23].
Following this rationale, this study aims to investigate the relationships among SCM practices (strategic suppliers’ partnerships, partners’ information quality and sharing), firm’s competitive advantage (quality, process flexibility, and time to market), and business performance (profitability and market share).
The remainder of the paper is organized as follows.
Section 2 presents the theoretical background.
Section 3 describes the conceptual framework and develops the hypothesized relationships.
Section 4 provides research methodology, sampling, and questionnaire design.
Section 5 develops fuzzy cognitive mapping (FCM), and
Section 6 analyses agent-based modeling (ABM), followed by the discussion on research findings and the conclusions of the study.
2. Relationships among Supply Chain Practices, Competitive Advantage and Business Performance in the Literature
The triptych “relationships—competitive advantage—performance” has been addressed in the literature from various viewpoints. Although there has been a lot of work completed on measuring and managing internal organizational operations, only during the last decade have systematic attempts observed and concentrated on supply chain performance measurement from various viewpoints, in different settings, and through pursuing different research agendas and practices. Various authors have provided complementary perspectives and the notions they have used cannot be univocally defined. Moreover, their approach may be dictated by their research focus and the sector they encompass. Therefore, the main objective of this section is to outline the multidimensionality of the above triptych in the case of SCM.
The growing role of inter-organizational relationships has prompted companies to reconsider how they choose their suppliers and partners. Selecting and managing suppliers and partners have been found to be proactive practices that will deliver quality development in the supply chain, as businesses depend on their core competencies and depend on suppliers and partners to gain a competitive advantage in their operations [
24]. Various issues such as flexibility over time and quantity of order, service quality, financial stability, reliability, brand recognition, R&D, trust, economic and political stability of the supplier’s country, environmental and social responsiveness, working conditions, reputation, responsiveness, and others are discussed in addition to the main criteria explored in papers such as cost, delivery, quality, and service [
25,
26]. Alignment can be described in the scope of supply chain as incentives for partners to boost overall supply chain efficiency. Alignment aims to increase consumer satisfaction by encouraging co-creation, leading to better financial, organizational, and business results. Quality, cycle times, prediction accuracy, and consumer satisfaction develop improvements [
27]. Moreover, knowledge sharing in the supply chain increases efficiency, lowers costs, and allows easy access to products; therefore, a lack of knowledge sharing may be the primary cause of poor SCM performance. As a result, identifying the drivers of knowledge sharing across organizations, and especially across supply networks, is becoming increasingly relevant. Moreover, knowledge is an important source of innovation potential [
28]. Information integration improves logistics and partnership capabilities in supply chain cooperation, which is valuable to supply chain efficiency [
29].
A company’s long-term strategic advantage is founded on resources and strengths that are difficult for a rival to duplicate or replicate. Intangible assets such as client and supplier relationships, company culture, and the opportunity to collaborate to build these relationships are instances of intangible assets that improve a firm’s competitive advantage and contribute to improved supply chain efficiency [
30]. In addition, a competitive advantage may be enhanced based on excellence of quality, delivery, process flexibility, product innovation, time to market, price, and cost [
31]. Studies on competitive advantage have increasingly changed their emphasis from individual businesses to interorganizational structures such as supply chains [
32].
Performance assessment is critical for an organization because it provides useful data for strategic, tactical, and operational decision-making [
33]. Supply chain performance evaluation has a significant effect on SCM and can improve overall system reliability while also providing businesses with competitive advantages [
34,
35]. There are both qualitative and quantitative performance indicators to evaluate in the case of supply chains. The former includes customer satisfaction and supplier performance, while the latter is about sales, profit, cost, return on investment, inventory, response time, and lead time [
36].
The importance of sustainable SCM as a catalyst for creating useful inter-organizational capital is examined based on a content review [
37]. This eventually leads to a potential sustained inter-firm competitive advantage. Based on the resource-based view and its expansion—the relational view, it is argued that as rivalry moves from an inter-firm to an inter-supply-chain level, partner-focused supply management skills develop into organizational core competencies. Strategic coordination is seen as a critical source of comparative advantage in the “collaborative model” of SCM. Collaboration is becoming more important as supply chains are tasked with maintaining fiscal, financial, and social success over the course of a product’s entire life cycle.
Using analytical evidence gathered from manufacturing business units operating in the United States, the degree of congruence (fit or alignment) between a firm’s outsourcing drivers and its strategic goals is analyzed, and then the corresponding effect on both supply chain and business performance is measured [
38]. Outsourcing alignment across all five strategic goals (time, quality, innovativeness, flexibility, and cost) is positively and substantially linked to supply chain efficiency. They also observed that a firm’s supply chain efficiency is strongly and substantially related to its business performance.
The links between SCM processes and their effects on financial and non-financial results of businesses were addressed by investigating a systemic model that connects the relationships between external customer-firm-supplier integration, internal SCM contextual considerations, and different dimensions of firm success in Taiwan information-related companies [
39]. External customer-firm-supplier relationship management was found to have a positive impact on firm internal contextual causes, which has a positive impact on firm profitability. This result shows that an effective SCM implementation increases not only organizational performance but also customer loyalty and financial performance indirectly. Furthermore, higher financial success can be attributed to increased customer value as a result of improved customer loyalty.
The study of original equipment manufacturer (OEM) suppliers’ SCM practices in the Association of Southeast Asian Nations automotive industry reached three main conclusions [
40]. First, OEM suppliers’ SCM practices can be classified into supply chain integration, information sharing, and facility position selection configurations. Then, high-performance OEM suppliers place a greater emphasis on SCM operations. Moreover, operational efficiency is strongly linked to supply chain integration and knowledge exchange.
The relationship between supply chain performance, competitive advantage, and company performance is examined on a survey of manufacturing firms from several Chinese regions [
41]. The size of a manufacturing firm’s supply chain success is determined using exploratory and confirmatory factor analysis. The findings demonstrate that supply chain efficiency entails progress on four dimensions: supplier performance, consumer responsiveness, supply chain flexibility, and supply chain cost. Moreover, these dimensions all have significant effects on competitive advantage, and that, with the exception of supplier efficiency, each affects firm performance.
A resource-based view scheme was used to model supplier selection and integration, as well as their effect on buyers in the case of US manufacturing firms [
42]. This viewpoint implies that buyers gain supplier skills in order to convert them into competitive advantages. It also represents the relational interfirm perception that competitive sources of advantage can be found in partnerships, thereby extending resource-based view theory beyond firm’s borders. While buyer skills may have an effect on a company’s bottom line in any of the areas studied, other mechanisms may also have impacts. Therefore, the results of specific buyer capacities in supplier acquisition or integration can be confusing.
The integration-performance link is explored by shedding light at the antecedents and implications of global supplier integration [
43]. Then, a theoretical framework is developed based on strategic management and the relational understanding of competitive advantage. The central premise of this theory is that companies in a supply chain may form partnerships that lead to interorganizational processes that enable them to systematically recognize and incorporate useful knowledge across organizational boundaries.
By addressing the relational view of the firm in the case of US manufacturing companies, it was proposed that, in order to gain performance benefits, producers and suppliers should establish a synergistic partnership and develop interrelated systems to obtain resources [
43]. Moreover, the analysis was focused on global supplier integration in developing a theoretical model based on the relational view since it is becoming an extremely useful source of competitive advantage, maximizing flexibility efficiency outcomes that then convert into supply chain benefit.
In analyzing the pork processing industry in China, internal alignment and buyer-supplier partnership collaboration seem to be directly linked to company success in both ways [
44]. Both upstream and downstream partnerships are unrelated to information infrastructure integration, while pork processors’ success in partnerships with downstream customers is greatly influenced by logistics integration.
The most prevalent approaches of modern sustainable SCM were classified and then it was concluded that businesses that prioritize sustainability in their corporate strategy use such SCM practices [
45]. These activities are closely linked to aspects of partnership efficiency within the supply chain as well as partnerships with external stakeholders. The performance in all three pillars of sustainability can be improved by engaging in such activities.
Toward comprehending the complex mechanisms that shape business performance in South Korean companies, it was reported that mediation effects are driven by cross-functional and supply chain communication effects, which play important and complementary roles [
46]. An environmental sustainability orientation that is strengthened by cross-functional partnerships and supply providers has a positive impact on environmental performance, but, without the participation and implementation of teamwork, an environmental sustainability orientation cannot have a meaningful impact. Simply implementing an environmental management orientation will not boost results in which there is a lack of integration of common interests across strategic units and supply chain areas of businesses.
Strategic supplier partnership, customer relationship, information sharing, information quality and internal lean practices are among the five aspects of SCM practices addressed using a survey of manufacturing companies in Greece [
47]. The results affirmed the importance of all SCM activities, especially information sharing, in establishing a sustainable competitive advantage and improving supply chain performance.
To determine the extent to which innovative knowledge information sharing activities offer a strategic advantage to Australian businesses, manufacturing companies in Australia were analyzed [
48]. Internal knowledge integration, knowledge integration with customers, and knowledge integration with suppliers were found to be closely interrelated, indicating that knowledge-based integration of companies with their partners is a viable option. Furthermore, these variables clarified roughly one-third of the variation in firm performance. Therefore, effectiveness of knowledge-based teamwork can contribute toward improving firm efficiency.
Buyer-supplier partnerships were empirically analyzed by addressing the concept of supplier integrative capacity, as well as its connections to organizational and financial performance [
49]. The results outline the complementarities between integration sensing, seizing, and transforming, affecting operational performance in terms of process flexibility, cost efficiency, and firm performance. The significance of the integration transforming dimension in connecting supplier integrative capacity to results emphasizes the need to revise and change supplier integration processes on a regular basis in order to remain competitive.
The importance of information integration between partners for improving decision efficiency and stabilizing partnership relationships is highlighted in the case of high-tech manufacturing firms in Taiwan [
29]. Firms can minimize inventory with more accurate orders and logistics proficiency due to precise integration. Second, it shows that logistics capability and relationship closeness are antecedents of SCM success. Logistics is becoming increasingly important to a company’s SCM and strategic position.
The case of environmental collaboration in supply chains was investigated in Taiwanese companies as to how it is connected with the environment-performance relationship [
50]. Specifically, environmental collaboration with suppliers and environmental collaboration with consumers were addressed. Only the former serves as a moderator in the improvement of environmental sustainability policy and green product strategy when it comes to the discrepancies between the impacts of both constructs. As a result, environmental collaboration with suppliers helps to boost competitive advantage. Contrary to popular belief, environmental collaboration with consumers has a direct positive impact on a company’s productivity.
The relationships between greening the supply chain, environmental performance, and competitive advantage was studied among Malaysian ISO 14001 certified manufacturing companies [
51]. It was found that greening the supplier is positively linked with environmental performance and competitive advantage, whereas environmental performance was positively linked with competitive advantage. In this case, environmental efficiency plays a role in mediating the relationship between supplier greening and competitive advantage.
The relationship between supply chain collaboration and business process management has been investigated [
52]. A methodology has been established to define the connection between intra- and inter-firm management activities. Internal teamwork entails phenomena that can be caught via four major constructs: strategic alignment, information technology, process orientation, improvement, and people involvement. External cooperation is emphasized in supply chain collaboration, which includes four major constructs: information sharing and communication, joint activities, sharing common goals, and incentive alignment. At both the firm and supply chain levels, effective organizational growth and collaboration with supply chain partners can result in superior results. The results from case studies form Thailand show that collaboration with supply chain partners has advantages in terms of organizational performance. Firms can fairly devote resources to pursue their collaboration in order to achieve collaborative advantages and improve organizational performance, despite limitations in these resources.
The Iranian automotive industry’s economic, environmental, and operational performance was examined with respect to the effects of green SCM activities [
53]. A conceptual model was introduced and then validated, linking green SCM activities and supply chain performance. The former entails supplier management, product recycling, organizational involvement, and the product lifecycle management. The four notions of supply chain performance are environmental performance, positive and negative economic performance, and organizational performance.
The association between environmental practices and performance was examined using a natural resource-based perspective which was then validated in the case of the UK food industry [
54]. The results indicate a positive relationship between downstream environmental logistics and environmental performance as well as between downstream environmental logistics and cost performance. In addition, customer participation has a moderating impact on the relationship between environmental policies and performance, which indicates that as consumers are involved in the implementation of downstream environmental logistics activities, environmental and cost performance improve further.
Having the supply chain operations reference (SCOR) model as a starting point, its application was extended to circular supply chains [
33]. Circular supply chain performance metrics vary from conventional supply chain performance indicators. Unlike conventional supply chains, which are evaluated based on factors such as cost, quality, and output, circular supply chains are evaluated based on resource use and environmental impact across the supply chain. Therefore, the process categories in the traditional SCOR model were reframed to include circular SCM considerations such as eco-design, sustainable procurement, material and energy reduction, product share, and reverse logistics.
The impact of green business orientation, green supply chain relationship efficiency, and green absorptive capability of a firm on supply chain green competitive advantage was examined in the case of Taiwan [
55]. The findings show that green market orientation has a positive impact on the green relationship quality. Green business orientation, conversely, has no clear impact on green competitive advantage. In addition, relationship quality has a positive impact on green absorptive capacity as well as green competitive advantage.
When observing the impact of green logistics management on company performance in the Greek agri-food sector [
56], the results show that logistics networking and transportation orientation, which reflects the integration of information technology, optimization, and green standardization in the transportation and logistics network, dominates because it is related to three of the four business performance constructs used in this study, namely financial, innovation, and social performance. Regarding the impact of green logistics management on green performance, logistics networking and transportation are critical to all green performance dimensions, i.e., resource use and safety as well as environmental process management outcomes, while other internal logistics operations are less influential. In terms of the impact of green logistics management on supply chain performance, information sharing, which promotes logistics network openness and cooperation, is linked to all facets of green SCM except traceability, including supply chain innovation, distribution, cost, flexibility, and optimization.
3. Conceptual Framework & Research Hypotheses
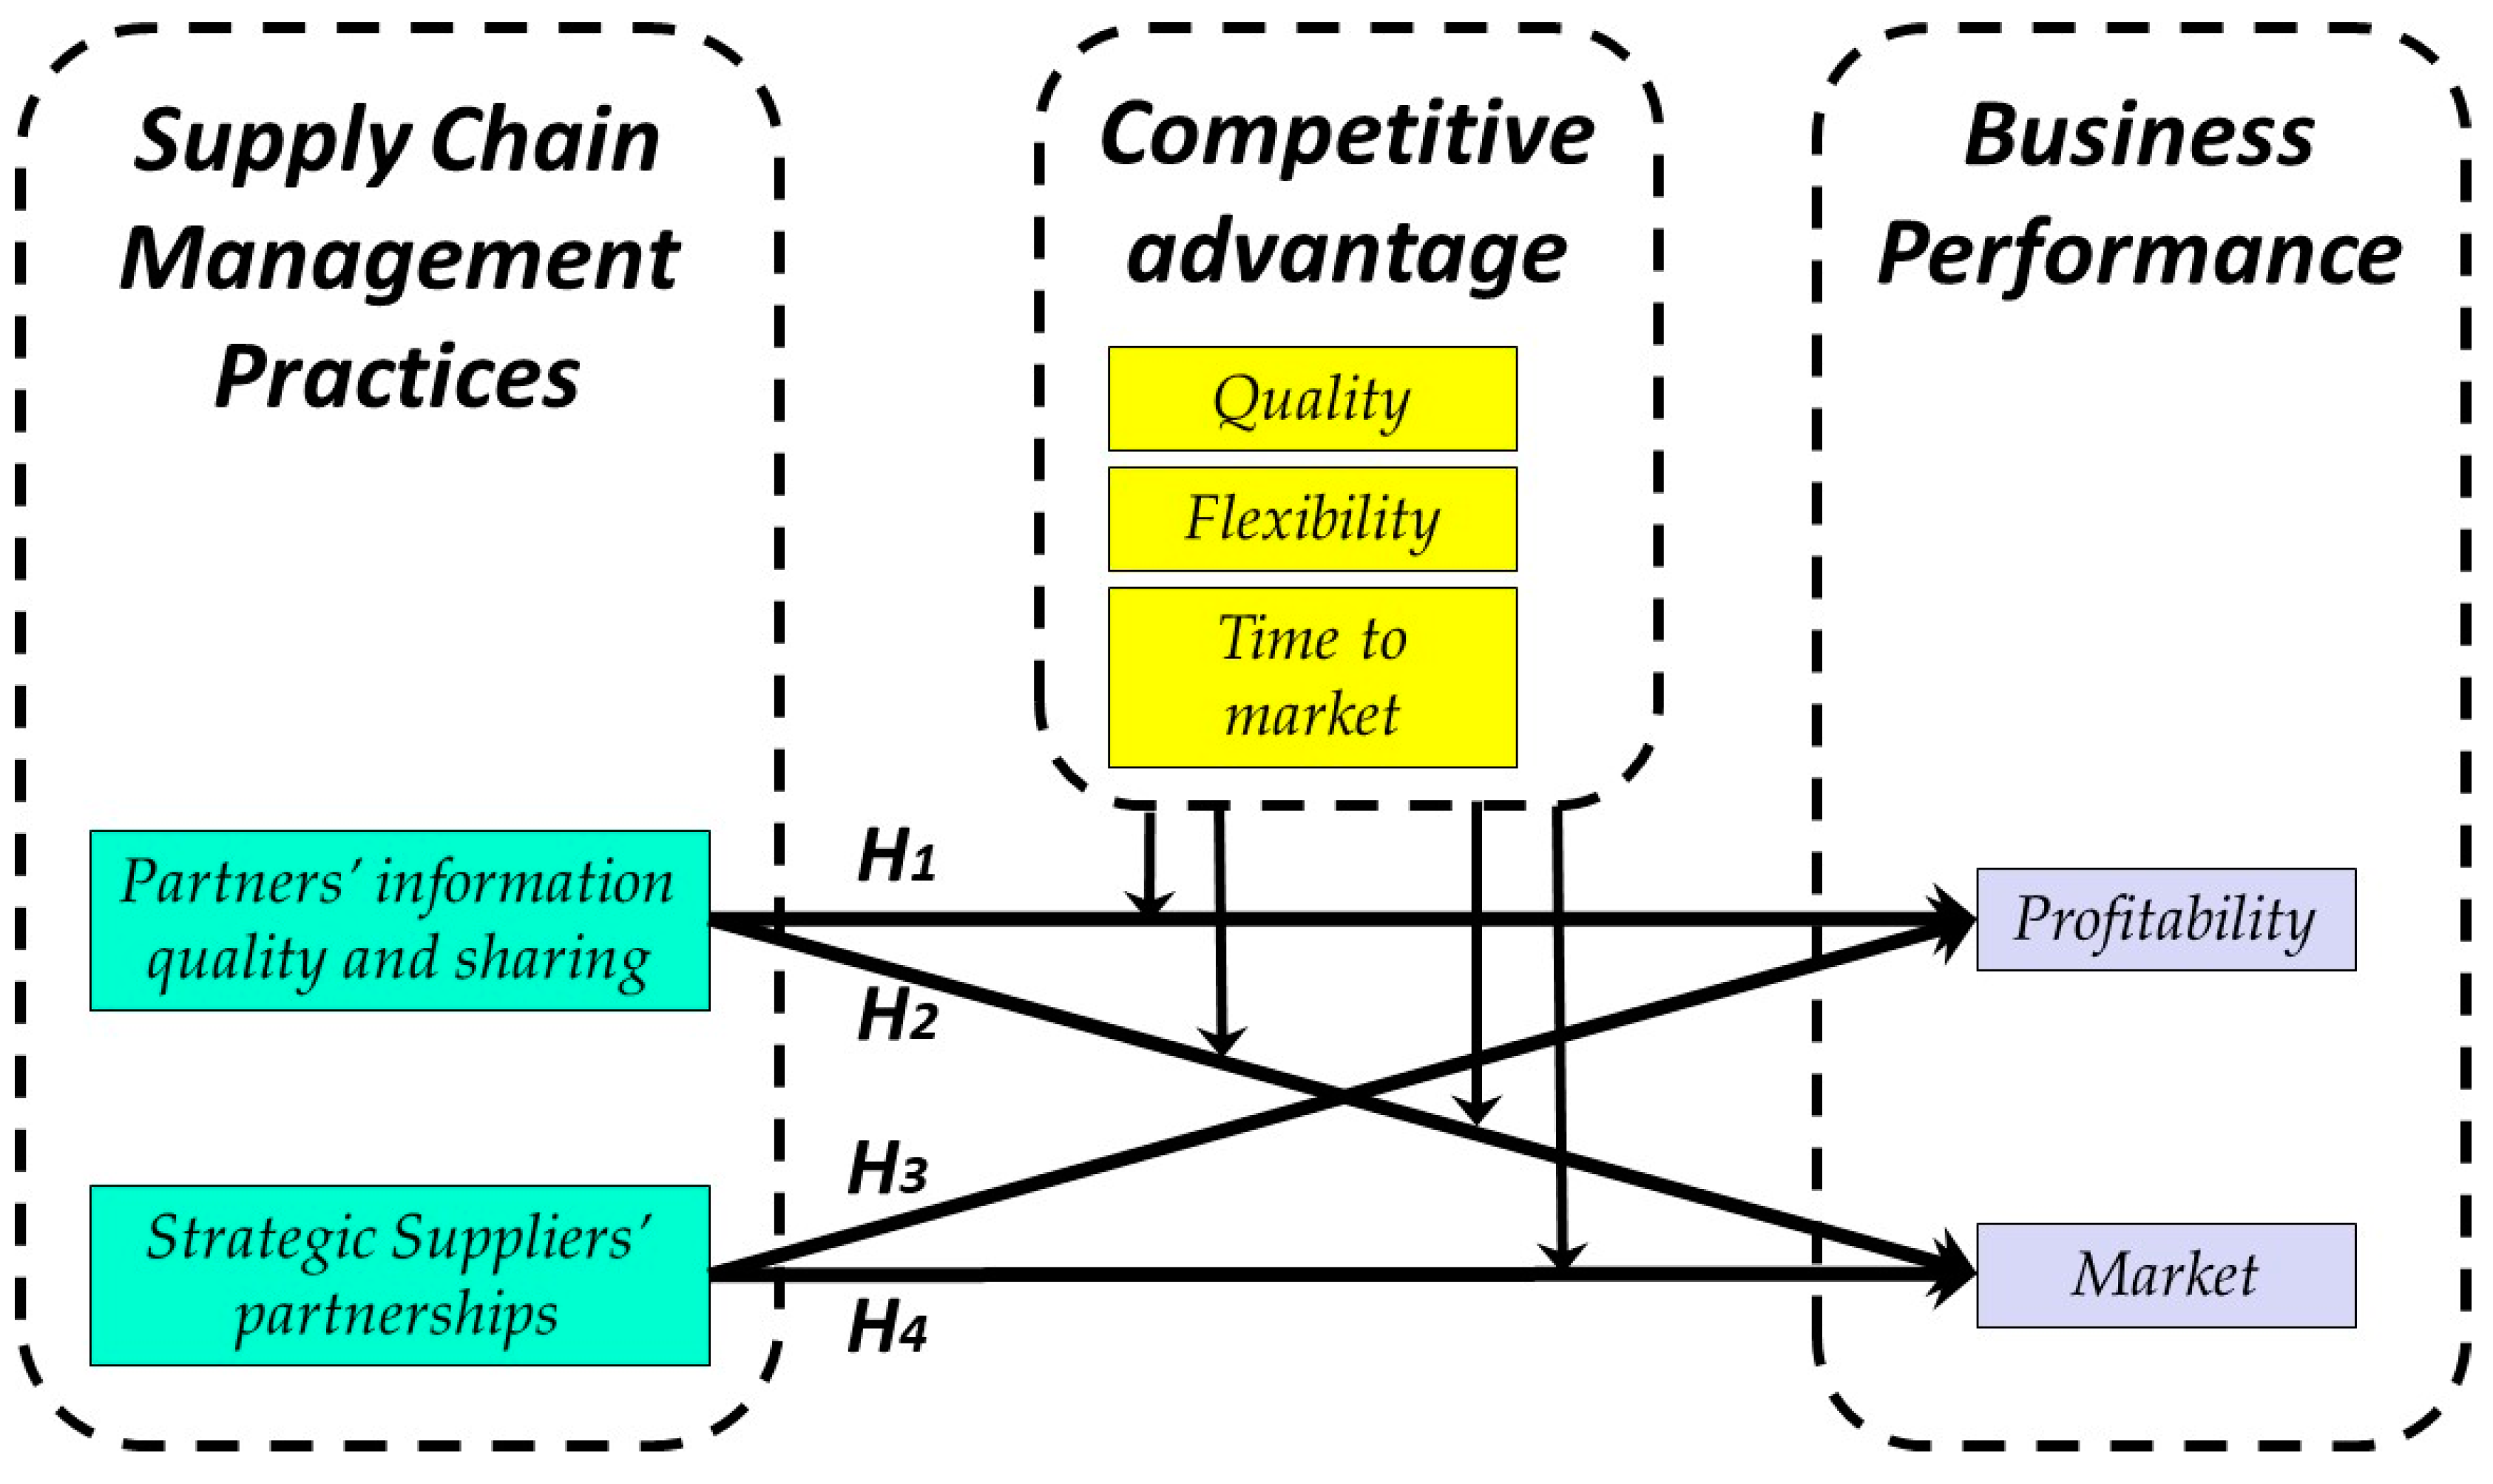
This study’s conceptual framework focuses on the connections among SCM practices (strategic suppliers’ partnerships, partners’ information quality, and sharing), competitive advantage (quality, process flexibility, and time to market), and business performance (profitability and market share), based on an empirical study of 300 enterprises in the agri-food sector in Greece.
All the above notions are addressed in various ways in many of the studies discussed in
Section 2. However, the hypotheses formulation presented in this section is grounded on the authors’ expert opinion, following literature review insights. As such, it may be regarded as a conceptual model applicable in SCM, which will be validated through an empirical study in the remainder of the paper.
Developing strong and healthy relationships built on sharing information with agents of outer environment has been one of the most critical factors for businesses’ survival. Examining and focusing on important quality relationship improvement can be seen as a crucial step. For market survival, businesses seek to optimize profitability and market share. In this purpose, business’ competitive aspects like quality, flexibility, and time spent in market can provide a realistic criterion for assessing relationships’ effects on businesses’ profitability and market share. Results of the gathered data can give valuable feedback to business strategists about important metrics measurement for relationships assessment and to organization itself, regarding possible benefits from investing in building strong relationships with specific groups of business’ partners. Therefore, we settle four research hypotheses, based on our theoretical analysis over effect of strong business relationships with certain agents of their outer environment.
The first hypothesis is based on whether businesses’ information quality and sharing with supply chain partners can positively affect their profitability. In order for this possibility to be assessed, businesses need to reach a specified percentage of performance in terms of quality, flexibility, and time spent in market. Having high levels of quality and flexibility as well as being first to introduce new products in the market can support businesses and establish a strong basis for competitive advantages in that market.
Hypothesis 1 (H1). Partners’ information quality and sharing is related positively to Businesses’ Profitability, with high standards of competitive advantage (Quality, Flexibility, and Time to Market).
Next, our second research hypothesis is based on information quality and sharing with business partners. We aim to estimate the effect of this relationship to businesses’ market share. Keeping as necessary condition high levels of quality, flexibility, and time to market, we examine if strong supply chain partners relationships can lead to higher business share in market.
Hypothesis 2 (H2). Partners’ information quality and sharing is related positively to Businesses’ Market Share, with high standards of competitive advantage (Quality, Flexibility, and Time to Market).
For the last hypotheses, we retain the previous qualities as we target to find possible effects of businesses’ relationships with suppliers to their profitability and market share. In other words, it is important for organizations, especially those who perform at a competitive level; thus, they have reached a desirable and efficient grade of quality, flexibility, and time spent introducing new products to the market to acknowledge the impact of strong relationships with suppliers on their profitability (Hypothesis 3) and market share (Hypothesis 4).
Hypothesis 3 (H3). Strategic Suppliers’ partnerships are related positively to Businesses’ Profitability with high standards in Quality, Flexibility, and Time to Market.
Hypothesis 4 (H4). Strategic Suppliers’ partnerships are related positively to Businesses’ Market Share with high standards in Quality, Flexibility, and Time to Market.
In
Figure 1, all the hypotheses developed reflecting the relationships among variables under investigations are depicted.
6. Agent-Based Model Development
Moving on from the FCM, in order to have an overall view of the business situation, micro-level analysis needed to be deployed. ABM can represent selected factors’ dynamic variations and effects, leading to more efficient models in terms of simulation and prediction [
77]. Those agents follow a specified norm, shaped by the chosen applied attributes and interact through well-known operators (if, and, etc.). We focused on estimating the effect of specific types of relationships, from business’ outer environment to their organizational performance, in a 180-day simulation experiment. Agent-based models consist of groups of agents portraying the arranged system that interact with the help of chosen operators. ABM has played a crucial role to ease decision making processes through micro-level process [
78], capitalizing on multiple domains’ knowledge and providing holistic and heuristic approaches. ABMs provide the benefit of proposing the best solutions and decisions for fraction of real-world problems due to their micro-level modeling property [
79].
Apart from the above, ABM analysis renders business executives more benefits regarding decision making process. Some of these benefits include better exploitation of relationships with specific parts of business’ environment, opening a way for multiple gains. Moreover, while keeping costs at low level, business’ strategists can obtain insights over relationships simulation modeling, as well as obtaining a more streamlined and credible predictive model through ABM. Thus, precise planning of their relationships combined with high levels of quality, time spent in market, and process flexibility can provide enhanced profits and share in market.
In this respect, we confined our performance topics to one, the organizational, due to its research proximity and relation to supply chain and retail sectors’ features. Based on the plethora of organizational variables, we focused on two, businesses’ profitability and market share. Those two factors are the most appealing for our research methodology, by means of importance to survival and growth of supply chain businesses. Consequently, in order to provide a comparative assessment for intertemporal prediction modeling, the analysis of firms’ profitability and share in operating markets was critical, if not crucial.
Results collected from the statistical and correlation analysis were necessary input for agent-based simulation and prediction modeling. Those inputs refer to correlations and coefficients from the correlation and regression analysis preceded, concerning the variables relationships, SSP, BPMA, BPPR, PIQS, organizational performance, CATM, CAQ, and CAPF. They helped recognize and understand important, to the model, variables’ relationships. In accordance with Davis et al. [
79], we deployed a model, with usage of quantitative data, measured with a one-time snapshot process, to comply with chosen date range. In the matter of agents’ movement, we applied the individual statistics to every agent and utilized the uniform probability distribution. The reason behind using the uniform probability function is that we ensured equal likelihoods of all possible outcomes, whose number may be finite or not, and their value was measurable [
80]. In
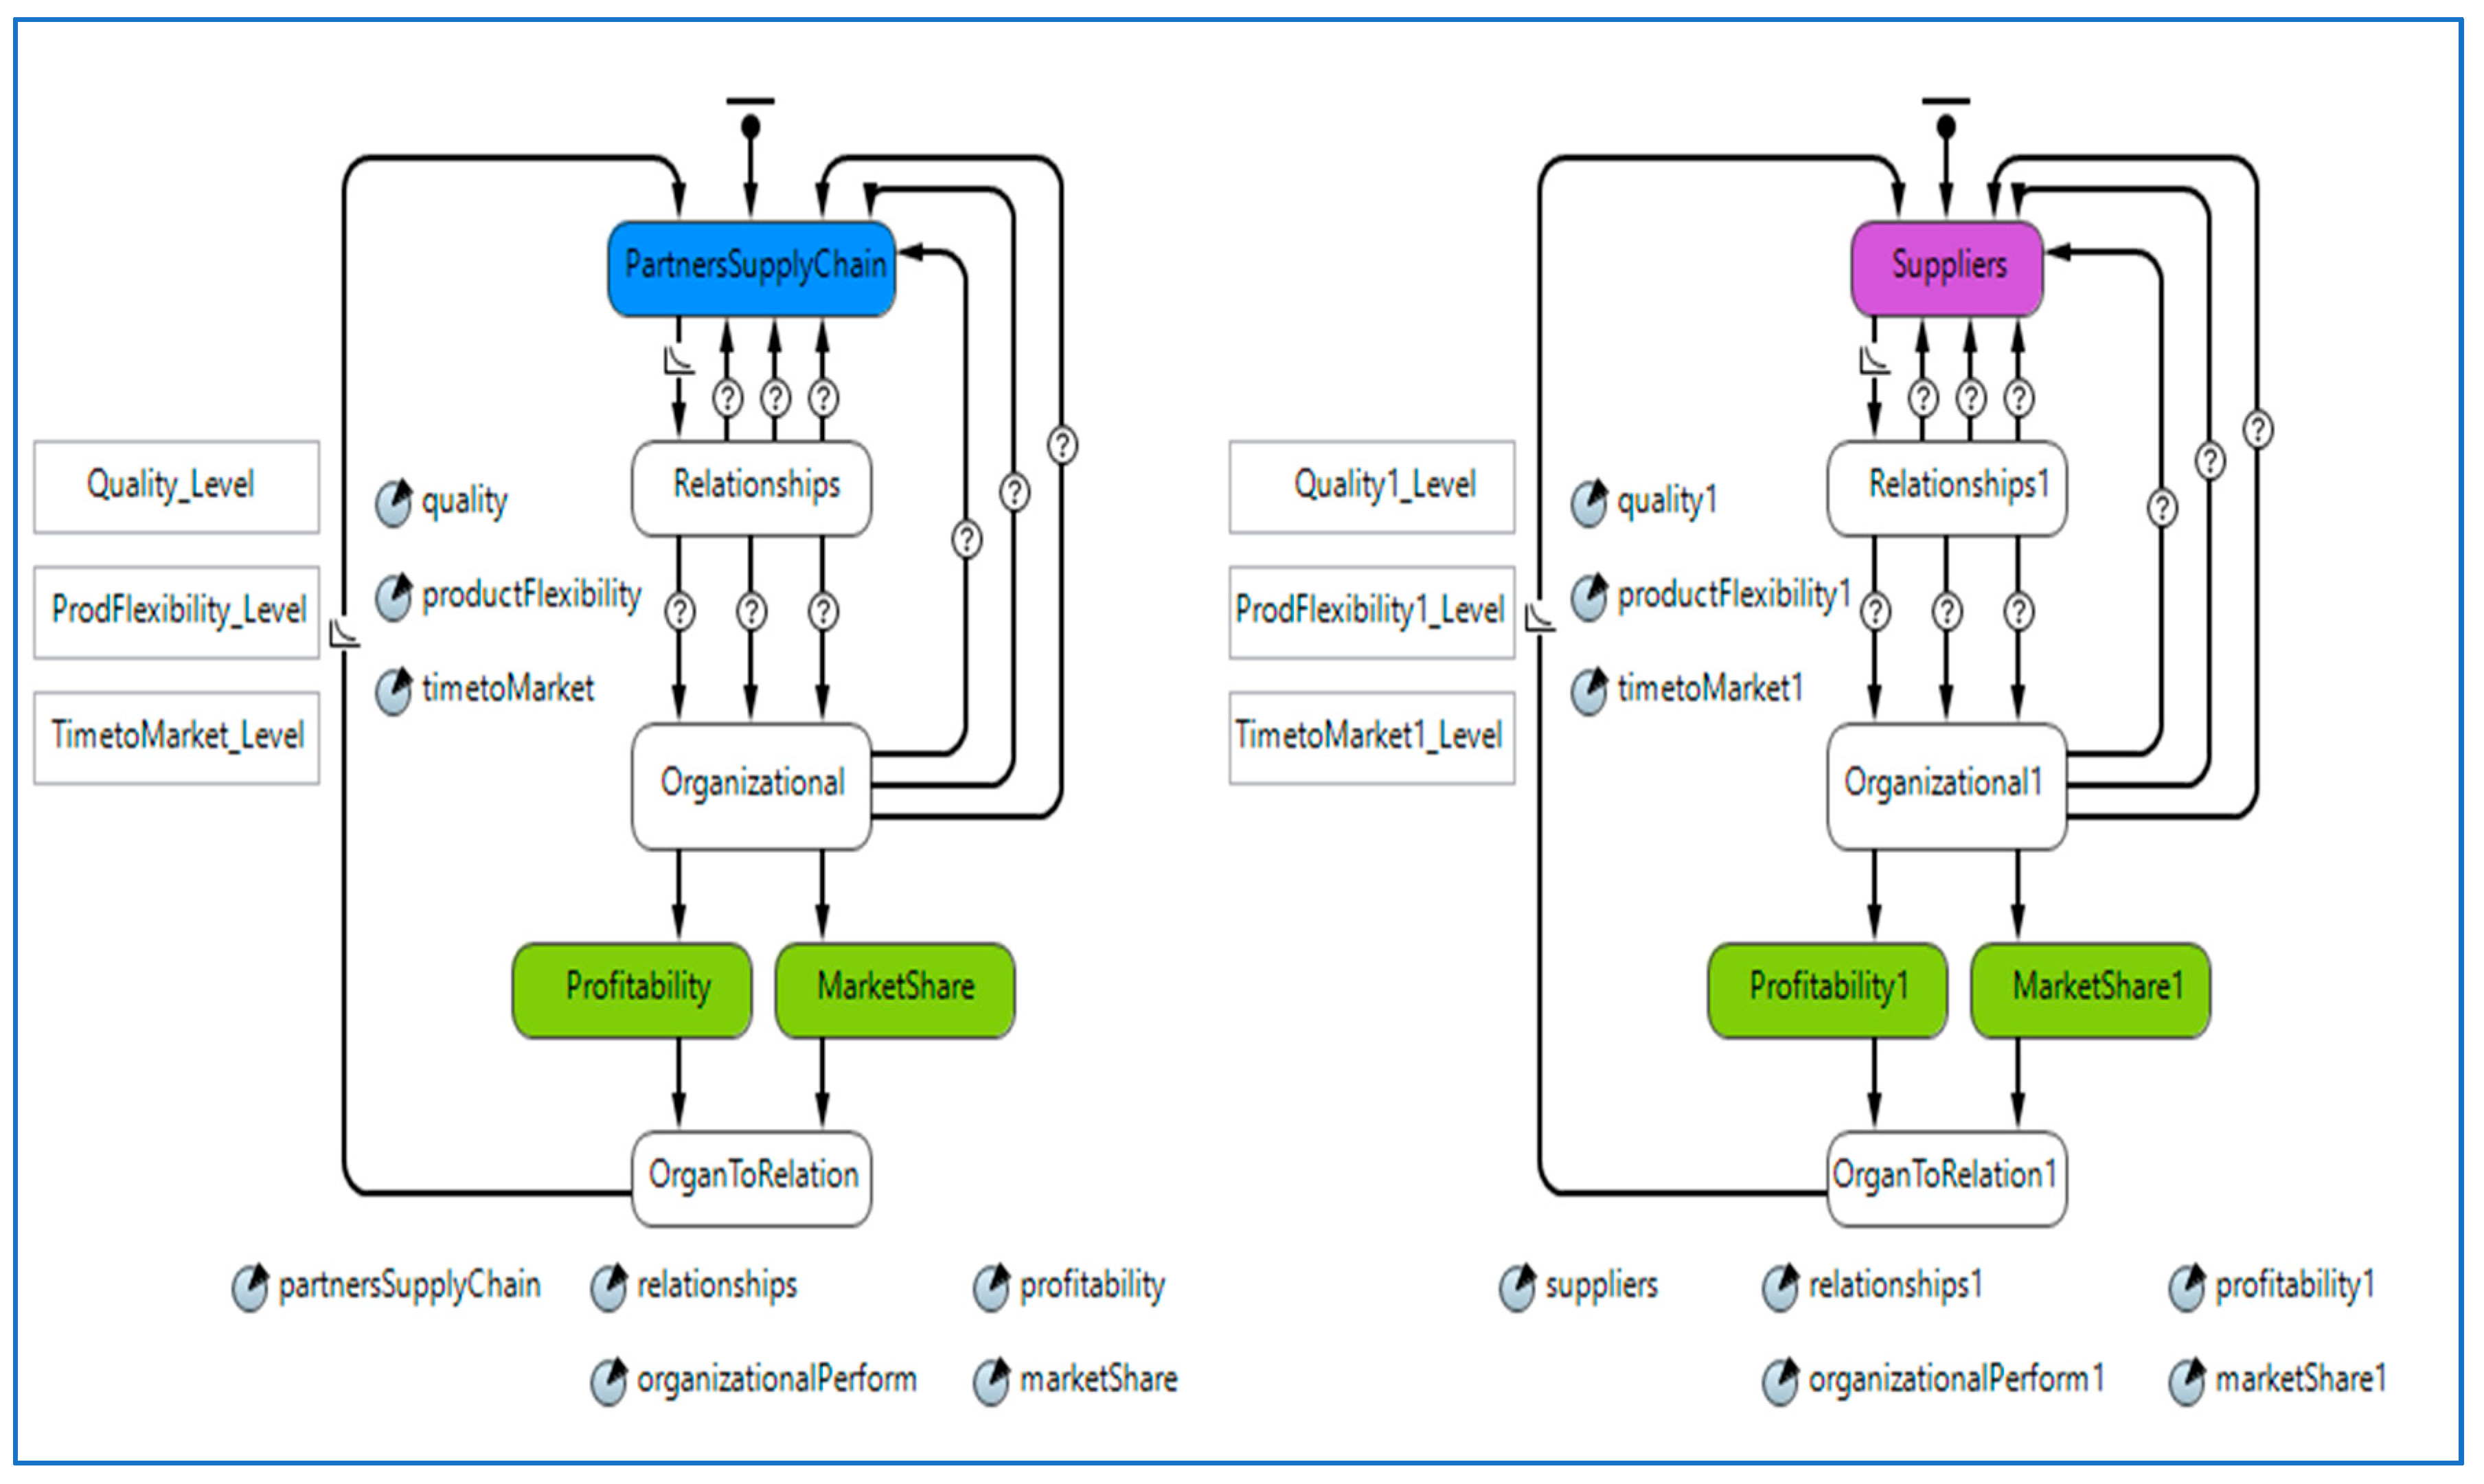
Figure 3, we have a clear view of paper’s agent-based model, thus aiming to provide practical insights over the possible effects of a firm’s good relationships with specific groups (e.g., suppliers) to their profitability and market position.
Our model appears to begin from partners supply chain and suppliers statecharts. by reaching the second statechart of relationships, the model arrives at a critical point. Next to the statecharts, land three checkboxes, where desirable levels of quality, product flexibility, and time to market can be adjusted. In order for the model to proceed to the next statechart of organizational performance, quality, product flexibility, and time to market, it has to exceed a specified percentage of performance (e.g., in our simulation we set a target of 70% of strong performance in quality, product flexibility, and time to market, with their variation provoked by a uniform probability distribution). Successful levels of quality, product flexibility and time to market that outflanked the barrier of exceptional performance reached profitability and market share statecharts, shaping their final values. Those are the metrics that are mostly involved in our research, thus generating the intended outcomes, the agent time-stack chart (
Figure 4) and time-graph chart (
Figure 5).
In
Figure 6, we see the dispersion of 1000 agents in a period of 180 observation days. It involved business’ relationships simulation as well as their relationships with supply chain partners and suppliers in which was our main focus. In a simulation with 1000 possible levels of relationships (for SC Partners and suppliers), we see the amount of feasible efficient relationships (blue and purple color). Furthermore, we can distinguish from those operant relationships the potential rise in profitability (red color) and market share (green color). Thus, we observe the diaspora of potential efficient relationships between organizations and SC partners and suppliers that led to boosted profitability and market share.
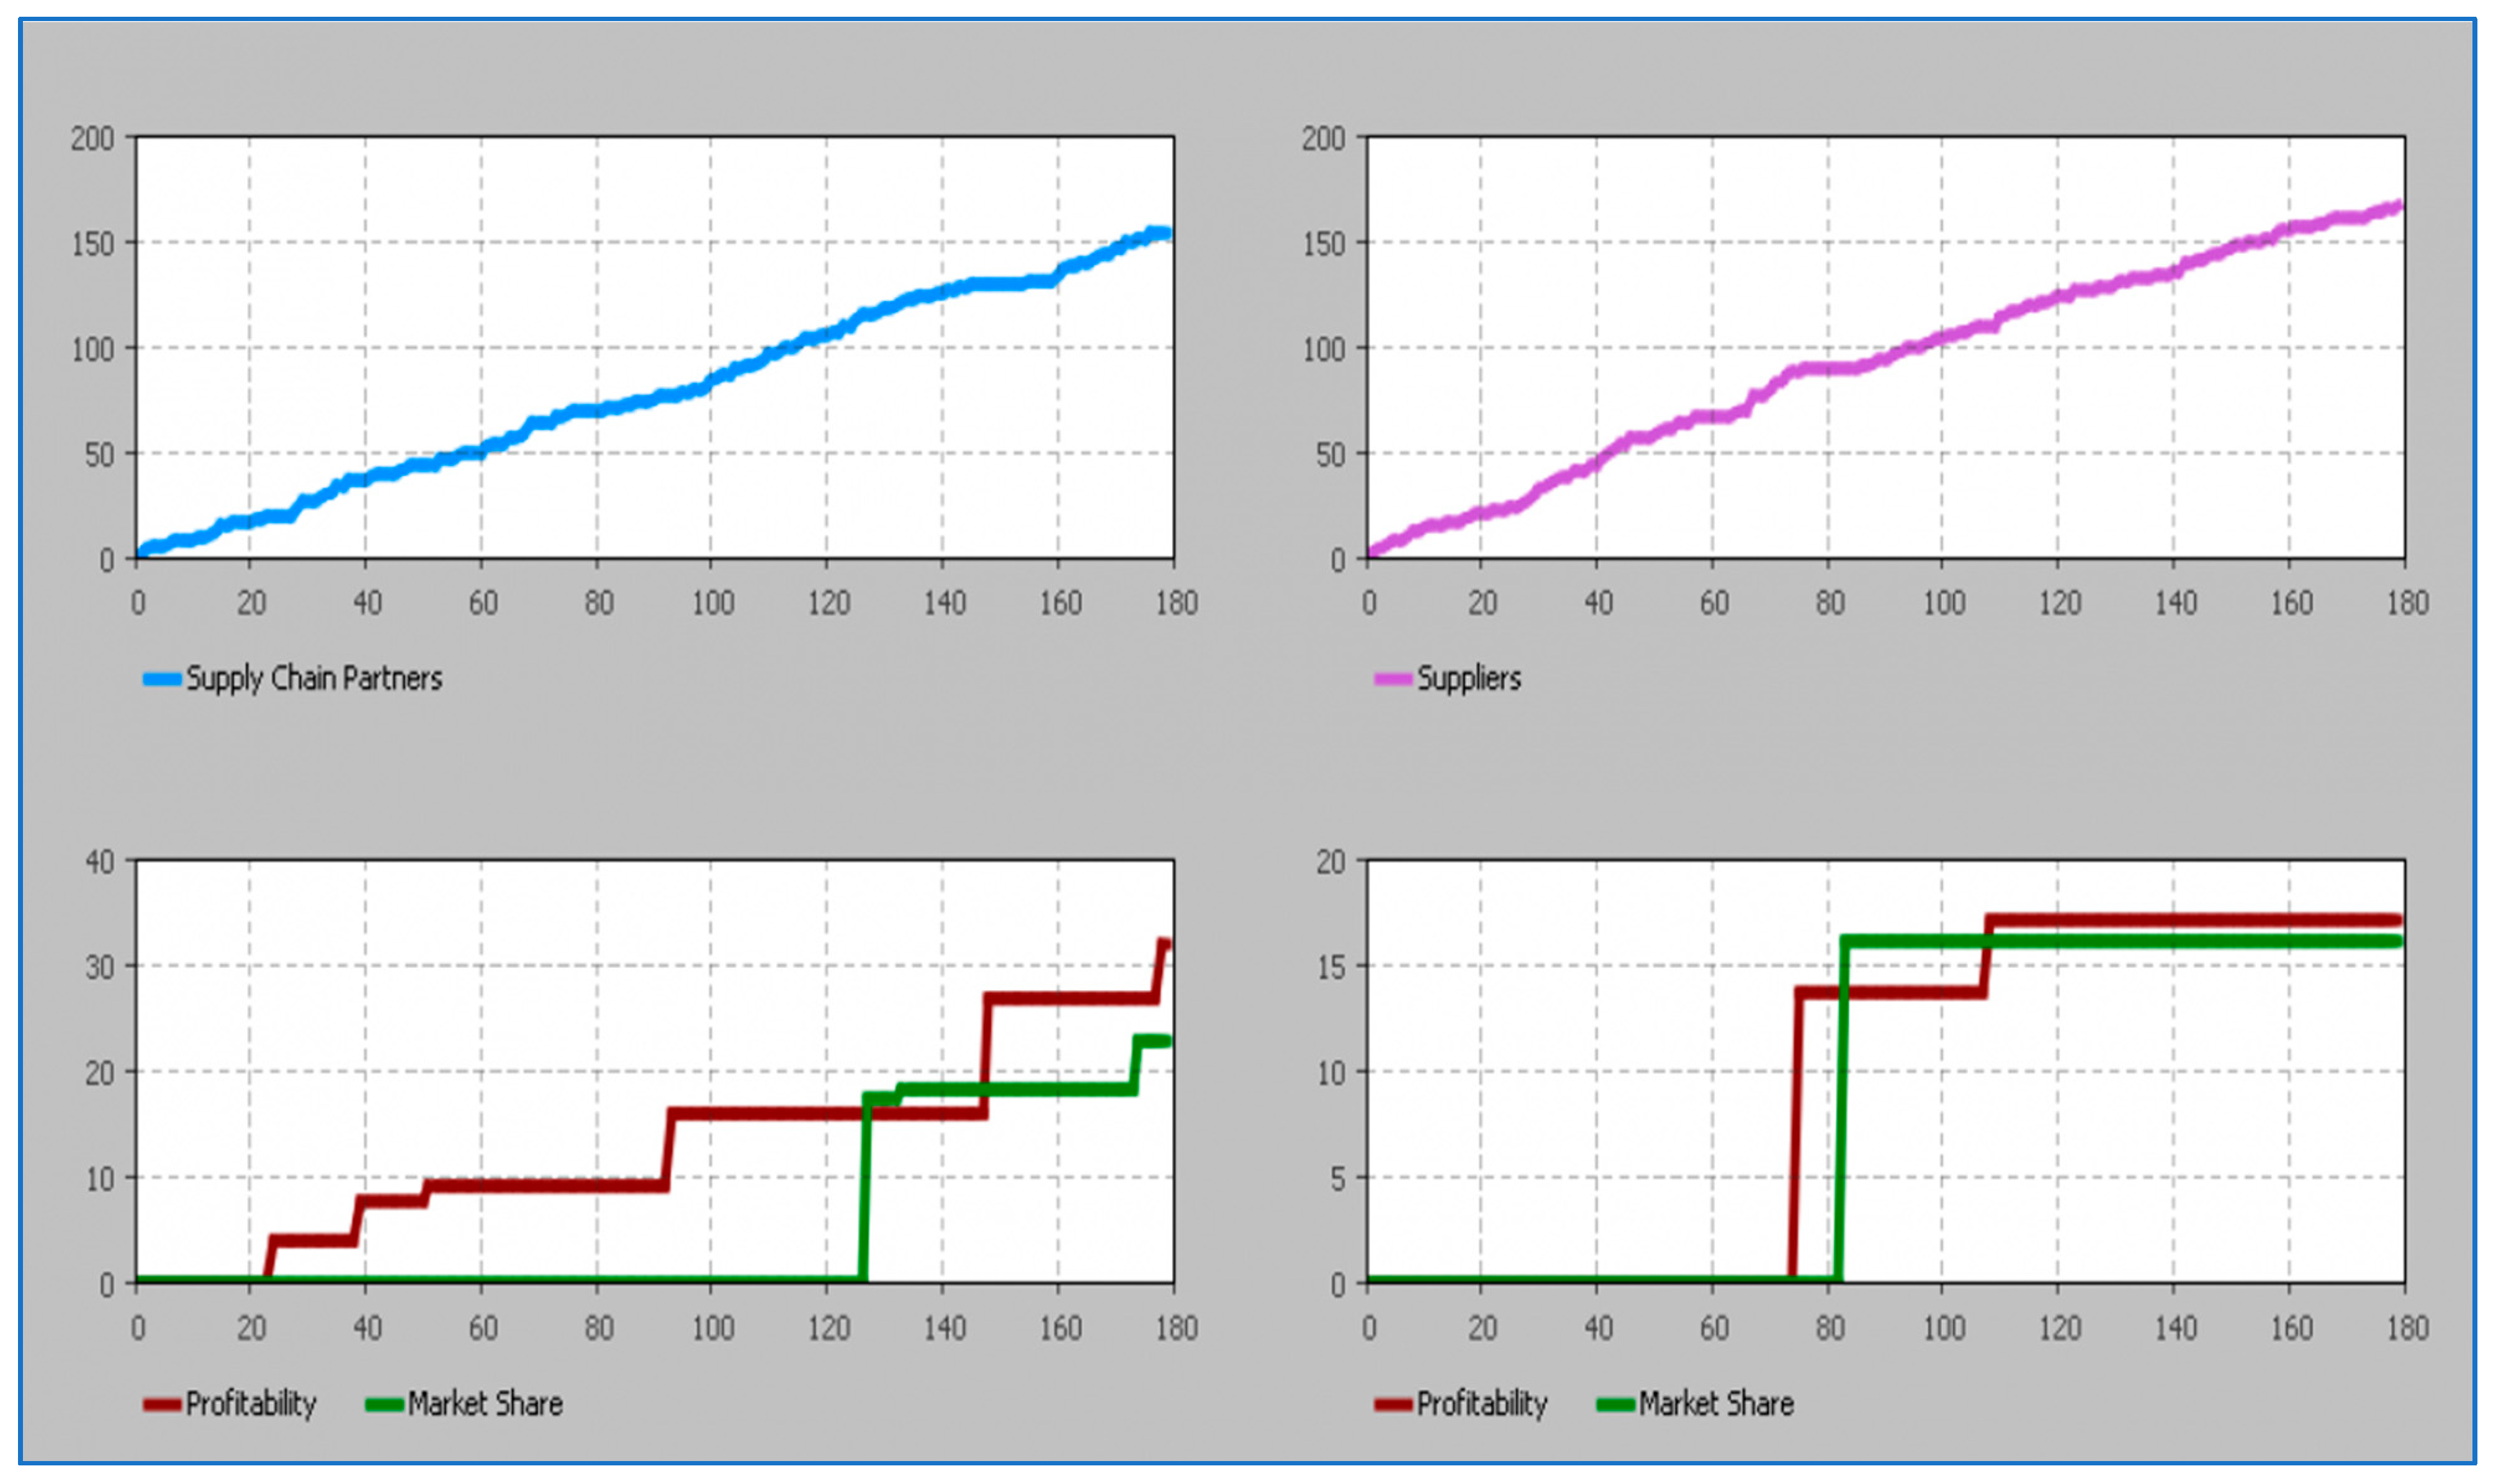
The horizontal axis in
Figure 4 shows the 180 days of the simulation, while on the vertical axis we obtained the performance of business’ profitability and market share. Efficient relationships with supply chain partners and suppliers enhanced business’ profitability and market share. By efficient relationships, we focused on fruitful and yielding partnerships with strategic suppliers and information quality and sharing of supply chain partners. Throughout the paper’s relative literature, the importance of firms’ relationships with their SC partners and suppliers was characterized as crucial. The results of this paper led to the same outcome that highlights the benefit in business profitability and market share through empowered relationships with SC partners and suppliers.
In
Figure 6, we discern that the amount profit and market share of businesses are affected by strong relationships with SC partners and suppliers. In accordance with the literature, firms’ profitability and share in the market are positively impacted by good relationships with suppliers and SC partners. From the graphs above, a significant rise in the profitability and market share occurred when businesses developed their partnership with suppliers and supply chain partners. Thus, those groups had the ability to promote the status of a firm through advantageous relationship handling. In the 180 observation days, both profitability and market share experience substantially rose in their levels, causing potential refinement in business finances.
Businesses should aim on developing strong and close relationships with their supply chain partners and suppliers, since doing so could lead to big organizational gains. The purpose of this paper’s analysis has been the development of a simulation and predictive model for estimation of business profitability and market share, based on their relationships with SC partners and suppliers. Those effects are obvious in
Figure 5, where implementation of potential strong (positive) relationships with SC partners (left graph) and suppliers (right graph) had an increasing (positive) result in business profitability and market share (above vertical axis of value). Thereon, comparing the results from the relationships’ simulation, we see that supply chain partners’ led to faster and higher levels of profitability and market share, rendering businesses’ strong relationships with supply chain partners indispensable for a successful route.
7. Discussion & Conclusions
One of a business’ main goals is the achievement of sustainable competitive advantages over its rivals. Domains of business environments, internal and external, can possibly be optimized to that purpose. The aim of our research was to investigate the impact of specific SCM practices formulating partners’ relationship quality, in order to enhance business market positions. For competitive advantage to be achieved, businesses need to achieve high quality, flexibility, and rapid introduction of new products in specific markets. Thus, before examining firms’ relationships and their impact on business’ profitability and market share, high levels of quality, flexibility, and new product development time should be set. This can lead to better acknowledgement of organizations’ competitive performance.
According to this paper’s research hypotheses, from the agent-based analysis preceded, we clearly see that both partners’ information sharing quality and strategic suppliers’ partnership are highly connected with firm profitability and market share. This can only take place when an organization operates with high standards of competitive advantage, in terms of quality, flexibility and time to market. In
Figure 4 and
Figure 5, the above reflection is visible. Moreover, in
Figure 5, by comparing both categories of partnership, the effect of partners’ information and quality sharing can lead to slightly higher performance in profitability and market share, in a shorter amount of time. Thus, all four research hypotheses are verified since partners’ information and quality sharing and strategic suppliers’ partnership have positive impacts on firms’ profitability and market share. The above occasion occurs when high standards of competitive advantage are met.
Moving in this respect, we found that strong relationships with key supply chain partners and suppliers can produce significant benefits for an organization. By significant benefits, we mean higher profitability and share in business’ market. Main findings of our paper, originated from the ABM, agree with McMurrian & Matulich [
81], who highlighted business’ financial consequences due to unpleasant relationships with their partners, such as profitability abatement. Even more, our proposed agent-based model’s results are consistent with Kanagal [
82] and Miquel-Romero et al. [
83], concerning profitability and market share benefits for businesses with good partners’ relationships. Apropos of supply chain businesses’ relationships with suppliers, our agent-based model complies with Mitrega et al. [
84] findings. Mitrega et al. [
84] emphasized the importance of strong relationship building between supply chain firms and suppliers, which is crucial for their prosperity and should therefore be measured regularly.
However, this study has potential limitations which may restrain generalizations of our findings. For example, our research encompassed specific supply chain practices and sources of competitive advantage in a sample of agri-food firms in Greece. Conversely, other contingent factors contributing to business performance may enrich the conceptual framework of future studies in different national contexts.


