
Attitudes and Preferences towards Soil-Based Ecosystem Services: How Do They Vary across Space?


 , and
, and 
Abstract
:1. Introduction
2. Materials and Methods
2.1. Study Area
2.2. Data Collection
2.2.1. Elicitation of Attitudes towards Soil Conversation and Environmental Issues
2.2.2. Choice Experiment
2.3. Data Analysis
2.3.1. Analysis of Attitudinal Scores
2.3.2. Choice Model
2.3.3. Spatial Analysis
3. Results
3.1. Test Descriptive Statistics
3.2. Spatial Distribution of Attitudes towards Soil Conservation and Welfare Measures
4. Discussion
5. Conclusions
Author Contributions
Funding
Institutional Review Board Statement
Informed Consent Statement
Data Availability Statement
Conflicts of Interest
Appendix A

| Statement | Strongly Disagree | Disagree | Neutral | Agree | Strongly Agree | |
|---|---|---|---|---|---|---|
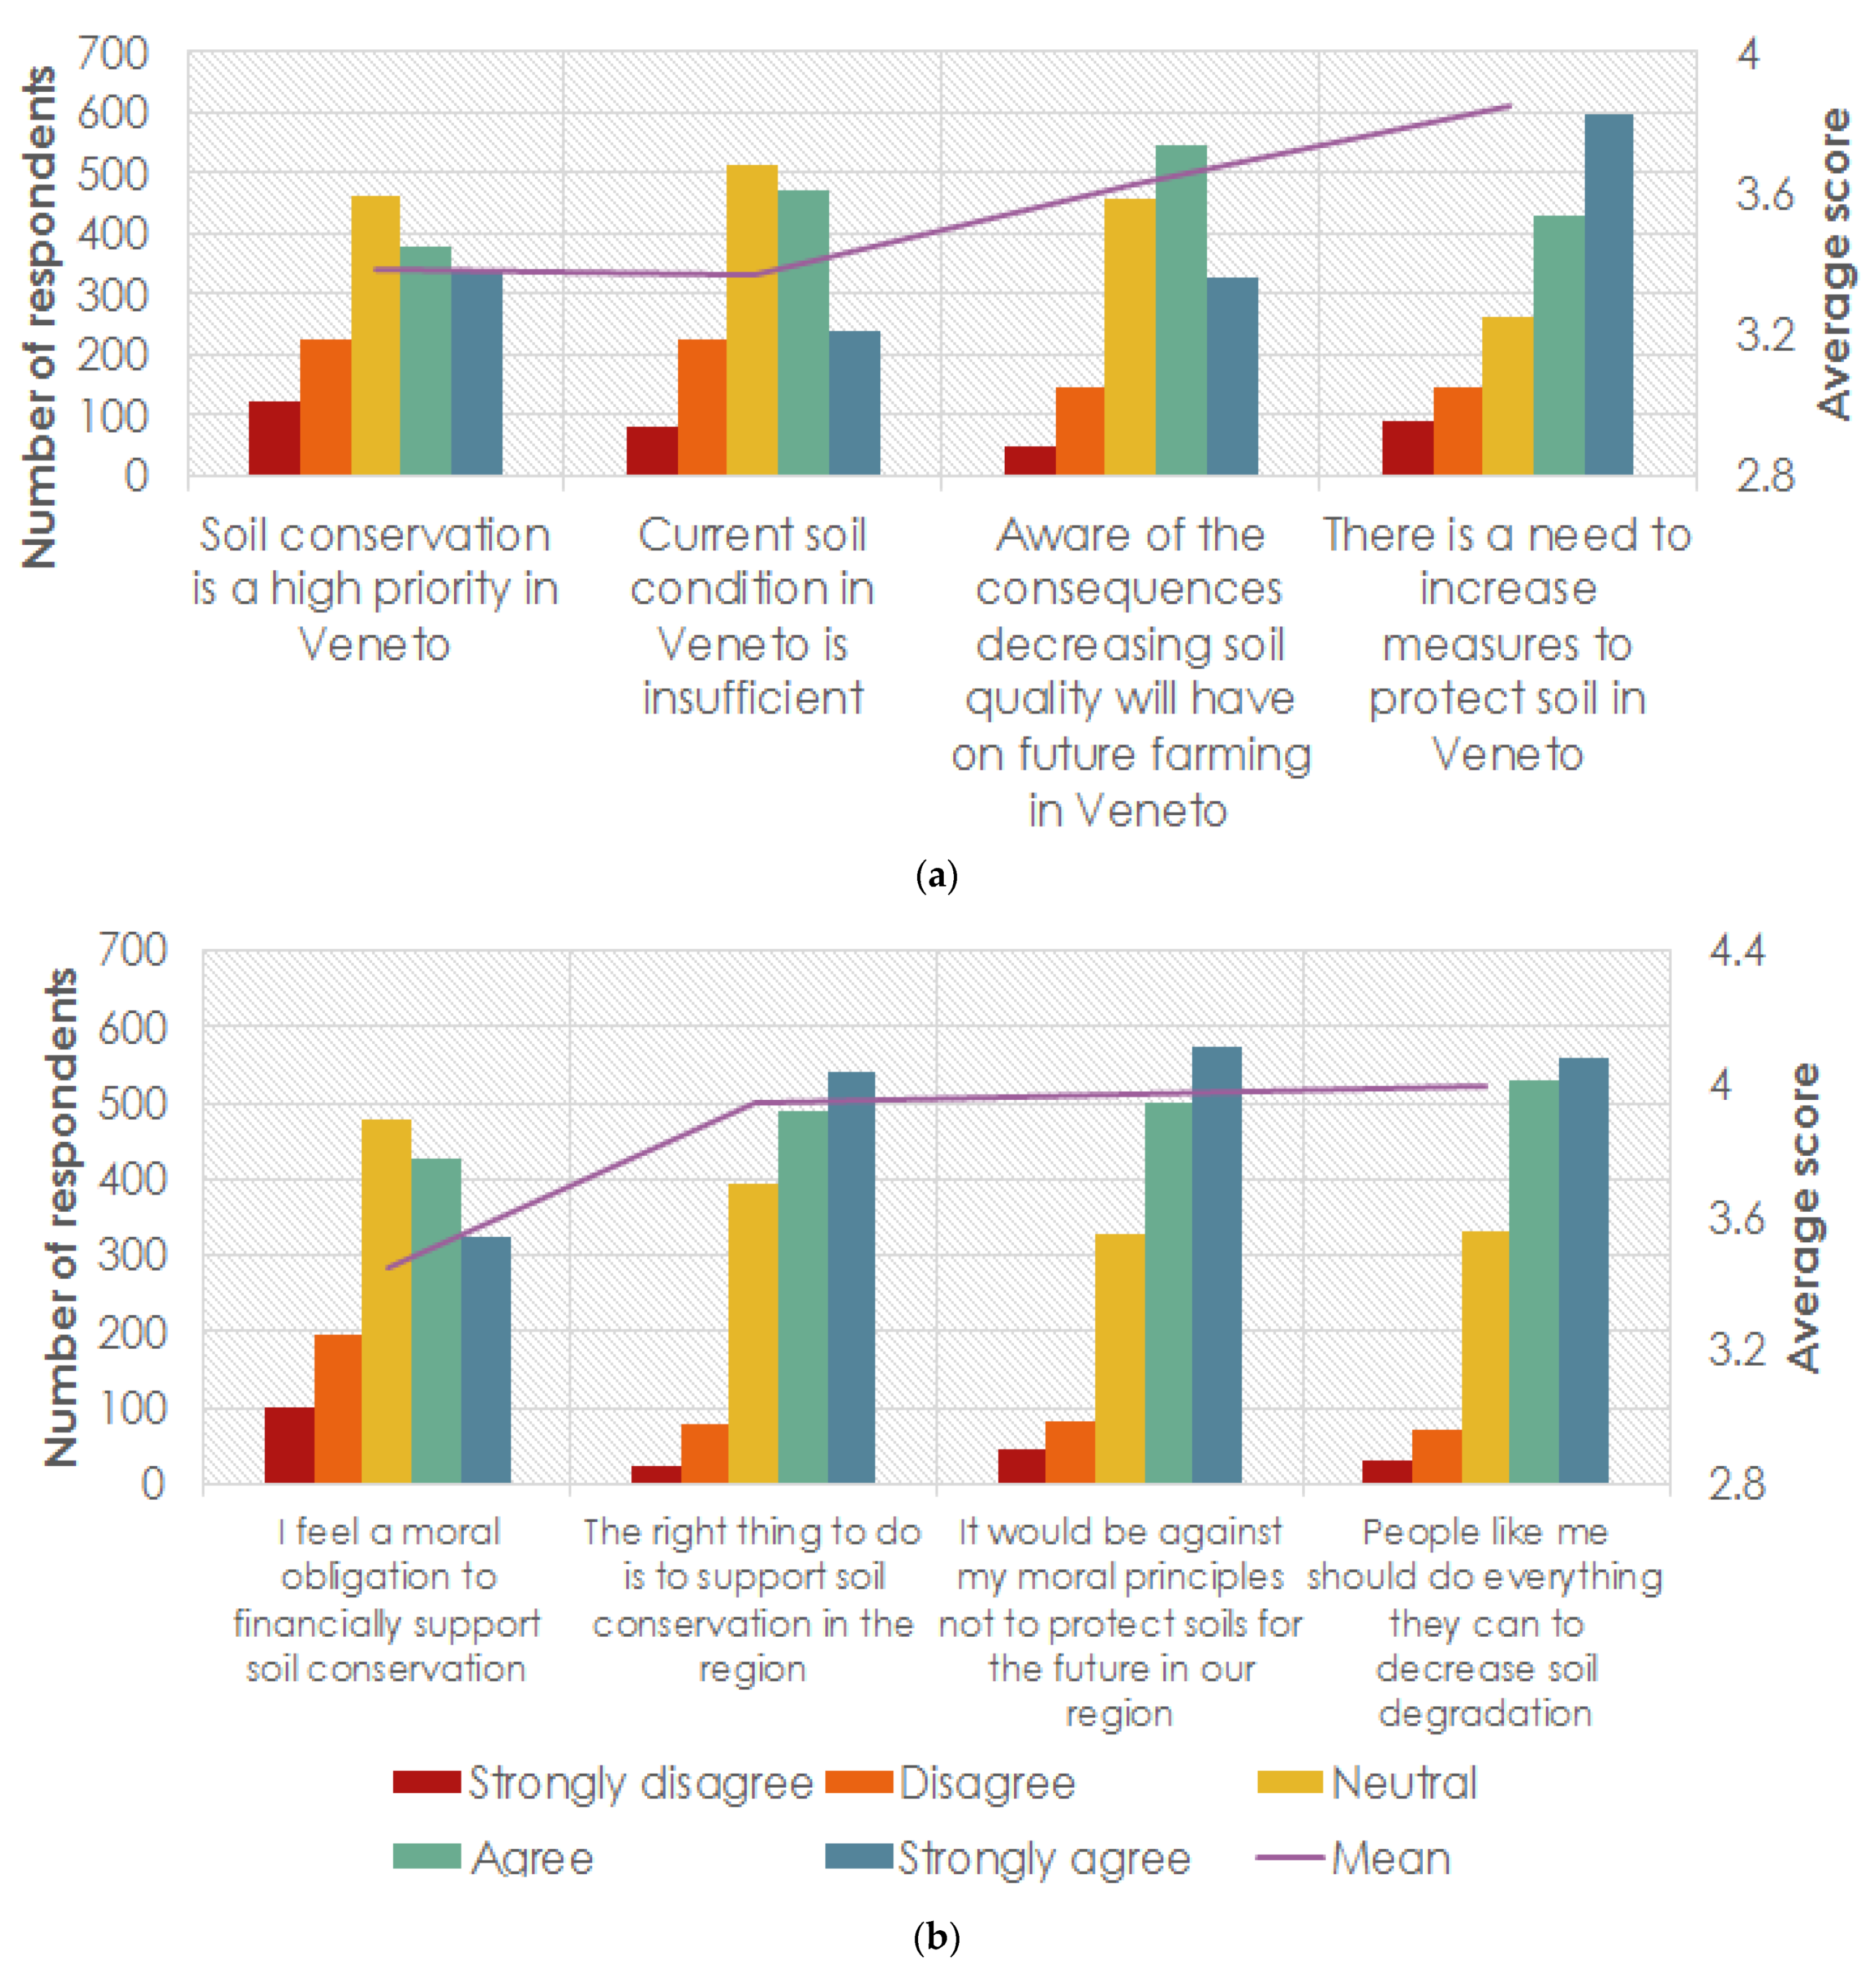
| 1 | Compared to other environmental issues of the Veneto region, soil conservation is a high priority (reverse coded) | 8.1% | 14.7% | 30.2% | 24.8% | 22.2% |
| 2 | The current soil condition in the Veneto region is insufficient (reverse coded) | 5.2% | 14.8% | 33.6% | 30.8% | 15.6% |
| 3 | I am aware of the consequences decreasing soil quality will have on future farming in the Veneto region | 3.2% | 9.5% | 30.1% | 35.7% | 21.4% |
| 4 | There is a need to increase measures to protect soil in the Veneto region (reverse coded) | 6.0% | 9.5% | 17.2% | 28.2% | 39.1% |
| 5 | I feel a moral obligation to financially support conservation of our soils no matter what other people do | 6.5% | 12.9% | 31.3% | 28.0% | 21.2% |
| 6 | According to my values, the right thing to do is to support soil conservation in the Veneto region | 1.6% | 5.2% | 25.9% | 32.0% | 35.3% |
| 7 | It would be against my moral principles not to protect soils for the future in the Veneto region | 2.9% | 5.4% | 21.5% | 32.7% | 37.5% |
| 8 | People like me should do everything they can to decrease degradation of our soils | 2.0% | 4.8% | 21.8% | 34.8% | 36.6% |
| NEP Statement | Strongly Disagree | Disagree | Neutral | Agree | Strongly Agree | |
|---|---|---|---|---|---|---|
| 1 | We are approaching the limit of the number of people the earth can support | 3.4% | 9.0% | 30.8% | 29.1% | 27.7% |
| 2 | Humans have the right to modify the natural environment to suit their needs (reverse coded) | 6.4% | 10.1% | 22.0% | 26.3% | 35.3% |
| 3 | When humans interfere with nature it often produces disastrous consequences | 1.4% | 4.5% | 15.6% | 30.9% | 47.7% |
| 4 | Human ingenuity will ensure that we do not make the Earth unlivable (reverse coded) | 16.3% | 16.3% | 30.1% | 17.7% | 19.5% |
| 5 | Humans are seriously abusing the environment | 1.4% | 2.2% | 10.2% | 23.1% | 63.0% |
| 6 | The Earth has plenty of natural resources if we just learn how to develop them (reverse coded) | 41.5% | 31.2% | 19.6% | 5.5% | 2.2% |
| 7 | Plants and animals have as much right as humans to exist | 1.6% | 5.4% | 17.9% | 23.3% | 51.8% |
| 8 | The balance of nature is strong enough to cope with the impacts of modern industrial nations (reverse coded) | 8.4% | 14.6% | 23.6% | 28.6% | 24.8% |
| 9 | Despite our special abilities, humans are still subject to the laws of nature | 1.9% | 4.2% | 19.2% | 30.4% | 44.3% |
| 10 | The so-called “ecological crisis” facing humankind has been greatly exaggerated (reverse coded) | 8.5% | 11.9% | 18.5% | 26.0% | 35.1% |
| 11 | The Earth is like a spaceship with very limited room and resources | 4.6% | 5.6% | 17.8% | 30.6% | 41.4% |
| 12 | Humans were meant to rule over the rest of nature (reverse coded) | 8.8% | 14.9% | 25.0% | 23.3% | 27.9% |
| 13 | The balance of nature is very delicate and easily upset | 1.2% | 3.1% | 15.3% | 34.3% | 45.9% |
| 14 | Humans will eventually learn enough about now nature works to be able to control it (reverse coded) | 8.3% | 16.5% | 37.0% | 22.2% | 16.0% |
| 15 | If things continue on their present course we will soon experience a major ecological catastrophe | 1.2% | 5.3% | 17.1% | 30.4% | 45.9% |
Appendix B

| Attributes | Moran’s I | z-Value |
|---|---|---|
| Carbon sequestration | 0.011 | 0.61 |
| Earthworms density | −0.022 | −0.79 |
| Rainfall water infiltration | −0.013 | −0.45 |
| Salinity in groundwater | 0.015 | 0.77 |
| Environmental concern | 0.004 | 0.29 |
| Soil awareness | −0.009 | −0.26 |
| Soil moral obligation | 0.018 | 0.91 |
References
- Pascual, U.; Balvanera, P.; Díaz, S.; Pataki, G.; Roth, E.; Stenseke, M.; Watson, R.T.; Başak Dessane, E.; Islar, M.; Kelemen, E.; et al. Valuing nature’s contributions to people: The IPBES approach. Curr. Opin. Environ. Sustain. 2017, 26–27, 7–16. [Google Scholar] [CrossRef] [Green Version]
- Díaz, S.; Pascual, U.; Stenseke, M.; Martín-López, B.; Watson, R.T.; Molnár, Z.; Hill, R.; Chan, K.M.A.; Baste, I.A.; Brauman, K.A. Assessing nature’s contributions to people. Science 2018, 359, 270–272. [Google Scholar] [CrossRef] [Green Version]
- Koch, A.; Mcbratney, A.; Adams, M.; Field, D.; Hill, R.; Crawford, J.; Minasny, B.; Lal, R.; Abbott, L.; O’Donnell, A.; et al. Soil Security: Solving the Global Soil Crisis. Glob. Policy 2013, 4, 434–441. [Google Scholar] [CrossRef] [Green Version]
- McBratney, A.; Field, D.J.; Koch, A. The dimensions of soil security. Geoderma 2014, 213, 203–213. [Google Scholar] [CrossRef] [Green Version]
- Bartkowski, B.; Bartke, S.; Helming, K.; Paul, C.; Techen, A.K.; Hansjürgens, B. Potential of the economic valuation of soil-based ecosystem services to inform sustainable soil management and policy. PeerJ 2020, 2020, 1–31. [Google Scholar] [CrossRef] [PubMed] [Green Version]
- Almansa, C.; Calatrava, J.; Martínez-Paz, J.M. Extending the framework of the economic evaluation of erosion control actions in Mediterranean basins. Land Use Policy 2012, 29, 294–308. [Google Scholar] [CrossRef]
- Telles, T.S.; Dechen, S.C.F.; Souza, L.G.A.D.; Guimarães, M.D.F. Valuation and assessment of soil erosion costs. Sci. Agric. 2013, 70, 209–216. [Google Scholar] [CrossRef]
- Kidd, D.; Webb, M.; Malone, B.; Minasny, B.; McBratney, A. Digital soil assessment of agricultural suitability, versatility and capital in Tasmania, Australia. Geoderma Reg. 2015, 6, 7–21. [Google Scholar] [CrossRef]
- Dominati, E.; Mackay, A.; Green, S.; Patterson, M. A soil change-based methodology for the quantification and valuation of ecosystem services from agro-ecosystems: A case study of pastoral agriculture in New Zealand. Ecol. Econ. 2014, 100, 119–129. [Google Scholar] [CrossRef]
- Gutzler, C.; Helming, K.; Balla, D.; Dannowski, R.; Deumlich, D.; Glemnitz, M.; Knierim, A.; Mirschel, W.; Nendel, C.; Paul, C.; et al. Agricultural land use changes - A scenario-based sustainability impact assessment for Brandenburg, Germany. Ecol. Indic. 2015, 48, 505–517. [Google Scholar] [CrossRef] [Green Version]
- Colombo, S.; Hanley, N.; Calatrava-Requena, J. Designing policy for reducing the off-farm effects of soil erosion using choice experiments. J. Agric. Econ. 2005, 56, 81–95. [Google Scholar] [CrossRef]
- Glenk, K.; Colombo, S. Designing policies to mitigate the agricultural contribution to climate change: An assessment of soil based carbon sequestration and its ancillary effects. Clim. Chang. 2011, 105, 43–66. [Google Scholar] [CrossRef]
- Kragt, M.E.; Gibson, F.L.; Maseyk, F.; Wilson, K.A. Public willingness to pay for carbon farming and its co-benefits. Ecol. Econ. 2016, 126, 125–131. [Google Scholar] [CrossRef] [Green Version]
- De Valck, J.; Rolfe, J. Spatial heterogeneity in stated preference valuation: Status, challenges and road ahead. Int. Rev. Environ. Resour. Econ. 2018, 11, 355–422. [Google Scholar] [CrossRef]
- Glenk, K.; Johnston, R.J.; Meyerhoff, J.; Sagebiel, J. Spatial Dimensions of Stated Preference Valuation in Environmental and Resource Economics: Methods, Trends and Challenges. Environ. Resour. Econ. 2020, 75, 215–242. [Google Scholar] [CrossRef]
- Franceschinis, C.; Scarpa, R.; Thiene, M.; Rose, J.; Moretto, M.; Cavalli, R. Exploring the spatial heterogeneity of individual preferences for ambient heating systems. Energies 2016, 9, 407. [Google Scholar] [CrossRef] [Green Version]
- Abildtrup, J.; Garcia, S.; Olsen, S.B.; Stenger, A. Spatial preference heterogeneity in forest recreation. Ecol. Econ. 2013, 92, 67–77. [Google Scholar] [CrossRef] [Green Version]
- Faccioli, M.; Czajkowski, M.; Glenk, K.; Martin-Ortega, J. Environmental attitudes and place identity as determinants of preferences for ecosystem services. Ecol. Econ. 2020, 174, 106600. [Google Scholar] [CrossRef]
- Campbell, D.; Scarpa, R.; Hutchinson, W.G. Assessing the spatial dependence of welfare estimates obtained from discrete choice experiments. Lett. Spat. Resour. Sci. 2008, 1, 117–126. [Google Scholar] [CrossRef]
- WebGIS Cartografico Banca dati Della Carta Della Copertura del Suolo Aggiornamento 2018. Available online: https://idt2.regione.veneto.it/portfolio/webgis-del-geoporatle-della-regione-del-veneto/ (accessed on 26 May 2021).
- Istituto Nazionale di Estadistica (ISTAT) Permanent Census of Population and Housing: The Italian Population Year 2019. Available online: https://www.istat.it/en/archivio/253831 (accessed on 12 March 2021).
- Schwartz, S.H. Normative influences on altruism. Adv. Exp. Soc. Psychol. 1977, 10, 221–279. [Google Scholar] [CrossRef]
- Steg, L.; de Groot, J. Explaining prosocial intentions: Testing causal relationships in the norm activation model. Br. J. Soc. Psychol. 2010, 49, 725–743. [Google Scholar] [CrossRef] [PubMed]
- Liebe, U.; Preisendörfer, P.; Meyerhoff, J. To pay or not to pay: Competing theories to explain individuals’ willingness to pay for public environmental goods. Environ. Behav. 2011, 43, 106–130. [Google Scholar] [CrossRef] [Green Version]
- Han, H.; Hwang, J.; Kim, J.; Jung, H. Guests’ pro-environmental decision-making process: Broadening the norm activation framework in a lodging context. Int. J. Hosp. Manag. 2015, 47, 96–107. [Google Scholar] [CrossRef]
- Dunlap, R.E.; Van Liere, K.D.; Mertig, A.G.; Jones, R.E. Measuring endorsement of the new ecological paradigm: A revised NEP scale. J. Soc. Issues 2000, 56, 425–442. [Google Scholar] [CrossRef]
- McFadden, D.; Train, K. Mixed MNL models for discrete response. J. Appl. Econom. 2000, 15, 447–470. [Google Scholar] [CrossRef]
- McFadden, D. Conditional logit analysis of qualitative choice behavior. In Frontiers in Econometrics; Zarembka, P., Ed.; Academic Press: New York, NY, USA, 1973; pp. 105–142. [Google Scholar]
- Hess, S.; Palma, D. Apollo: A flexible, powerful and customisable freeware package for choice model estimation and application. J. Choice Model. 2019, 32, 100170. [Google Scholar] [CrossRef]
- Moran, P.A.P. The interpretation of statistical maps. J. R. Stat. Soc. Ser. B 1948, 10, 243–251. [Google Scholar] [CrossRef]

| Variable | Percentage |
|---|---|
| Gender | |
| Man | 50.4 |
| Woman | 49.6 |
| Age (years) | |
| <20 | 3.5 |
| 20–39 | 29.5 |
| 40–59 | 44.8 |
| >60 | 22.1 |
| Education | |
| Primary school | 12.1 |
| Secondary school | 53.1 |
| High school | 29.6 |
| Degree | 4.3 |
| Postgraduate | 0.2 |
| Annual net income (EUR) | |
| <15,000 | 12.6 |
| 15,001–25,000 | 27.7 |
| 25,001–35,000 | 20.6 |
| 35,001–45,000 | 12.4 |
| 45,000–55,000 | 5.3 |
| >55,000 | 4.7 |
| No answer | 16.8 |
| Province of residence | |
| Belluno | 3.6 |
| Padua | 21.4 |
| Rovigo | 4.8 |
| Treviso | 16.2 |
| Venice | 18.7 |
| Verona | 18.0 |
| Vicenza | 17.4 |
| Attribute | Unit | Level |
|---|---|---|
| Carbon sequestration | t/ha/year | 0.20 (baseline) |
| 0.80 | ||
| 1.40 | ||
| 2.00 | ||
| Earthworm density | individuals/m2 | 15 (baseline) |
| 25 | ||
| 4 | ||
| 60 | ||
| Rainfall water infiltration | rainfall | 23% (baseline) |
| 28% | ||
| 34% | ||
| 40% | ||
| Nitrogen in groundwater | mg/L | 11.9 (baseline) |
| 8.3 | ||
| 4.8 | ||
| 1.8 | ||
| Household tax | EUR | 5 |
| 10 | ||
| 25 | ||
| 50 | ||
| 100 | ||
| 180 |
| Attributes | Mean (Euro/Year) | Standard Deviation (Euro/Year) | Coefficient of Variation (Percent) |
|---|---|---|---|
| Carbon sequestration | 13.36 | 13.14 | 0.98 |
| Earthworms density | 1.59 | 1.55 | 0.97 |
| Rainfall water infiltration | 3.11 | 5.80 | 1.87 |
| Avoid nitrates in groundwater | 10.40 | 9.94 | 0.96 |
Publisher’s Note: MDPI stays neutral with regard to jurisdictional claims in published maps and institutional affiliations. |
© 2021 by the authors. Licensee MDPI, Basel, Switzerland. This article is an open access article distributed under the terms and conditions of the Creative Commons Attribution (CC BY) license (https://creativecommons.org/licenses/by/4.0/).
Share and Cite
Eusse-Villa, L.F.; Franceschinis, C.; Thiene, M.; Meyerhoff, J.; McBratney, A.; Field, D. Attitudes and Preferences towards Soil-Based Ecosystem Services: How Do They Vary across Space? Sustainability 2021, 13, 8722. https://doi.org/10.3390/su13168722
Eusse-Villa LF, Franceschinis C, Thiene M, Meyerhoff J, McBratney A, Field D. Attitudes and Preferences towards Soil-Based Ecosystem Services: How Do They Vary across Space? Sustainability. 2021; 13(16):8722. https://doi.org/10.3390/su13168722
Chicago/Turabian StyleEusse-Villa, Luisa Fernanda, Cristiano Franceschinis, Mara Thiene, Jürgen Meyerhoff, Alex McBratney, and Damien Field. 2021. "Attitudes and Preferences towards Soil-Based Ecosystem Services: How Do They Vary across Space?" Sustainability 13, no. 16: 8722. https://doi.org/10.3390/su13168722
APA StyleEusse-Villa, L. F., Franceschinis, C., Thiene, M., Meyerhoff, J., McBratney, A., & Field, D. (2021). Attitudes and Preferences towards Soil-Based Ecosystem Services: How Do They Vary across Space? Sustainability, 13(16), 8722. https://doi.org/10.3390/su13168722