Article

China’s Special Poor Areas and Their Geographical Conditions

1
Institute of Geographic Sciences and Natural Resources Research, Chinese Academy of Sciences, Beijing 100101, China
2
College of Resources and Environment, University of Chinese Academy of Sciences, Beijing 100049, China
*
Author to whom correspondence should be addressed.
Sustainability 2021, 13(15), 8636; https://doi.org/10.3390/su13158636
Submission received: 7 June 2021 / Revised: 19 July 2021 / Accepted: 27 July 2021 / Published: 3 August 2021

Abstract

:
Special functional areas and poor areas tend to spatially overlap, and poverty is a common feature of both. Special poor areas, taken as a kind of “policy space,” have attracted the interest of researchers and policymakers around the world. This study proposes a basic concept of special poor areas and uses this concept to develop a method to identify them. Poor counties in China are taken as the basic research unit and overlaps in spatial attributes including old revolutionary bases, borders, ecological degradation, and ethnic minorities, are used to identify special poor areas. The authors then analyze their basic quantitative structure and pattern of distribution to determine the geographical bases’ formation and development. The results show that 304 counties in China, covering a vast territory of 12 contiguous areas that contain a small population, are lagging behind the rest of the country. These areas are characterized by rich energy and resource endowments, important ecological functions, special historical status, and concentrated poverty. They are considered “special poor” for geographical reasons such as a relatively harsh natural geographical environment, remote location, deteriorating ecological environment, and an inadequate infrastructure network and public service system. Some areas suffer from underdevelopment and even lack the infrastructure for basic living. In order to prevent further deterioration of the economic, social, and ecological environments in these areas, targeted policies need to be implemented.

1. Introduction

The development of a region is the result of a long-term interaction between a natural geographical environment and a social-economic system. For various reasons, many countries have designated special functional areas; in the process of territory exploitation, these areas are intended for specific functions, and often take on historical responsibilities during national or regional development. These special functional areas have become an important part of the system of dividing up territorial functions across a given country. Some poor areas with inefficient systems in place lag behind the rest of country and, in turn, disrupt the coordinated and sustainable development of the nation and its regions. Special functional areas and areas lagging behind often have similar characteristics, problems, and patterns of development while maintaining their own peculiar mechanisms and problems. The overlapping parts of these two kinds of areas, which can be termed “special poor areas,” have become the pain points of territorial exploitation and regional development. They are at once the cause and the result of uncoordinated regional development. A region that lags behind others in development over the long-term suffers from accelerated losses of population and resources, carrying serious economic and social implications. The recent rise of populism in the Western world, alongside social conflicts in certain areas, indicate that it is important to strengthen research and policy guidance in these areas [1,2,3].
Special poor areas, taken as a kind of “policy space,” have attracted the interest of researchers and policymakers around the world [1,4]. Since the 1950s, the EU has successively established the European Social Fund, the European Regional Development Fund, cohesion funds, the European Maritime and Fisheries Fund, and the European Agricultural Fund for Rural Development, as powerful policy tools to support specific regions. In 2015, the EU launched the “Lagging Regions Initiative” to identify underdeveloped areas and formulate targeted policies for them [5,6]. Since 1997, the United Kingdom has also carried out a series of policies for underdeveloped or declining areas, the most famous of which is the “The Northern Way.” This plan covers the northern part of England which used to be the industrial center of the country but has since undergone significant urban decay. Since the 1970s, Canada has also displayed concern around the development of lagging regions. The Department of Regional Economic Expansion has identified two kinds of special areas in Canada. The first kind of area is identified as a designated region, and refers to regions that were once developed but are now in a state of economic recession. Designated regions have sufficient infrastructure but insufficient means to new employment. The other kind of area identified by Canada is termed a special area; these regions are poor in basic endowments or located in remote border areas. They lack basic infrastructure and public service systems and require structural economic adjustment [7]. The premise of targeted policy support for the special poor areas is their accurate identification. The experience of various countries shows that the most prominent problem in this context is poor economic development, which can be simply judged by the per capita GDP, GDP growth, and other economic indicators. In addition, location, ethnic composition, and historical status should be taken into consideration [8].
Chinese scholars have also conducted a considerable amount of research in this field. Work on analyzing specific types of areas has yielded a mature research system that integrates theoretical construction, empirical analysis, technical methods, and policymaking. Poverty has long been a concern in China, and scholars have attended to the standards of recognition and dynamic adjustment of the country’s poor areas [9,10], characteristics of their geographical distribution [11,12], mechanisms of their formation [13,14], and strategies for poverty alleviation and rural revitalization [15,16]. Most scholars claim that absolute poverty in China will be eliminated over time while relative poverty will continue to exist for a while. This will have a profound impact on regional development. It is important to regularly adjust the standards for the identification of poor areas and, in turn, establish a long-term support mechanisms. Many studies have focused on single functional areas, such as those featuring ethnic minorities [17,18,19], border areas [20,21,22], sites of old revolutionary bases [23,24], and areas performing ecological functions [25,26]. However, few studies have analyzed areas where different attributes overlap. Researchers have identified a large spatial overlap between poverty-stricken areas, areas along the border, those featuring ethnic minorities, and those housing old revolutionary bases [23,27,28]. Some researchers have identified significant ecological degradation in areas composed of ethnic minorities and cited this as the main cause of poverty [29,30]. This superposition of spatial attributes has caused researchers to pay attention to complex areas with multiple functions.
Promoting coordinated regional development has been an important component of China’s economic and social development. The key to improving the effectiveness of regional policies is to scientifically divide regions into types and issue targeted policies. For a long time, China’s regional policies have exhibited fragmented features, usually focusing only on a single functional area. The spatial scopes of poor areas and various functional areas in fact overlap, leading to a more complex environment for regional development. Traditional regional policies are thus inefficient or even completely ineffective when applied to these areas and can lead to disharmony and even conflicts between contradictory policies. In the backdrop of the post-poverty alleviation era, special poor areas with complex functional attributes should be the focus of research and policy [31]. The first step in regional policymaking is to identify special poor areas and their characteristics [32]. Therefore, this study uses poverty-stricken areas, areas housing old revolutionary bases, areas composed of ethnic minorities, border regions, and areas featuring ecological degradation, to establish a method to identify special poor areas in China, depict the characteristics and spatial patterns of their distribution, and analyze the geographical similarities of their locations in order to provide a reference point for the formulation of appropriate targeted policiesse

2. Concepts and Methods of Recognition

2.1. Basic Concepts

Special functional areas are areas with unique functions and a specific status in the context of national development, usually due to their resource endowments, natural geographical conditions, or location, and mainly include border areas, areas composed of ethnic minorities, those housing old revolutionary bases, areas featuring ecological degradation, resource-exhausted cities, areas housing industrial bases and post-disaster reconstruction areas lagging behind in development. Resource exhaustion and lagging industrial bases generally occur in a single city rather than a larger region, whereas areas subjected to post-disaster reconstruction rarely appear, and exist only for a short time. Therefore, special functional areas in this paper refer to the first four of the categories listed above. “Lagging areas” refer to poverty-stricken areas, and the Chinese government has developed methods to identify them at the county level. According to the above definition, special poor areas are areas where there is an overlap between special functional areas and lagging areas, and thus denote impoverished areas with specific functions or historical responsibilities.

2.2. Method of Recognition

Various methods have been proposed to identify special poor areas. The ones considered here include areas with poor living conditions, inferior quality of living for the residents, weak infrastructure and public services, poor long-term economic development, and a fragile ecological environment. The core idea of identifying such areas is to superimpose the distribution of special functional areas onto that of poor areas. The steps of identification are as below.
The first step involves the selection of a minimum spatial unit. The premise of regional policy implementation is to clarify the minimum administrative unit of a policy space, which helps to improve the accuracy of the formulated policy [32]. Current zonings of special functional areas and lagging areas rely different administrative units, which leads to a spatial mismatch when directly superposing one layer upon another. According to the empirical situation and the needs of the research, we chose county as the basic unit; this included the county, county-level cities, districts, and ethnic minority autonomous counties.
The second step involves selecting a base map. The most significant characteristic of both kinds of areas is poverty. In light of this, we use the distribution of nationally poor counties to form the base map. According to the latest official list released by the Chinese government at the end of 2019, 607 nationally poor counties were used as the base map for recognition.
The third step involves ascertaining the scope of the special functional areas. Special poor areas are overlaps between poor areas and the special functional areas, and consist of border areas, areas composed of ethnic minorities, areas housing old revolutionary bases, and areas featuring ecological degradation. Border areas refer to the 140 counties along the land border. Areas with ethnic minorities are widely distributed in China, and we chose 232 counties in Tibet, Xinjiang, Qinghai, Yunnan, Sichuan, and Gansu provinces where national aid programs are underway. Areas housing old revolutionary bases are regions where the Chinese Land Reform took place, and their range was found in plans formulated by China’s National Development and Reform Commission from 2012 to 2016. A total of 209 counties were located in areas with old revolutionary bases. The scope of areas featuring ecological degradation was determined by the National Plan for Main Functional Zones, including the Hunshandake desertification area, soil and water conservation areas of the Loess Plateau, Yunnan–Guangxi–Guizhou rocky desertification area, Tarim River desertification area, and desert areas of the Aerjin and Horqin Grasslands, all of which amounted to 119 counties.
The fourth step was the superimposition of the maps of the counties selected through the last two steps. We cross-matched the lists of nationally poor counties with the four kinds of special functional areas mentioned above. The special poor areas selected through the above steps needed to be poor counties with at least one special function.
The fifth step involved the classification of the special poor areas. According to the number of spatial attributes overlapping in each county, they can be divided into four levels: single-function, double-function, three-function, and four-function areas. The more functional attributes a county had, the more complex its geographical environment was, and the more noteworthy it was to our study.
The sixth step involved identifying the spatial pattern of the special poor areas. Decentralized support and centralized revitalization are promoted in these areas in parallel, and the centralized revitalization of contiguous areas is strategically significant. According to regional contiguity, natural geographical conditions, and other attributes, the special poor counties were divided into different contiguous areas. Then, according to the common characteristics of counties in the same contiguous area, we summarized the territorial functions undertaken by it and the relevant challenges.

3. Distribution of China’s Special Poor Areas

Using the above steps, we identified the special poor areas in China, and their distribution is shown in Figure 1.
(1)
A total of 304 counties were identified as special poor areas, accounting for 50.08% of China’s counties. In other words, half of the poor counties in China have special functions or a special historical status. Moreover, the selected counties make up 10.7% of China’s county-level administrative districts, which shows that the special poor areas are widely distributed;
(2)
In terms of spatial pattern, special poor areas were scattered in 20 provinces and municipalities throughout the country, constituting two-thirds of China’s provincial administrative regions. Eleven provinces or municipalities did house any special poor areas: Beijing, Tianjin, Shandong, Liaoning, Jiangsu, Shanghai, Zhejiang, Fujian, Guangdong, Hainan, and Hunan, where all except for the latter are eastern coastal provinces. The special poor areas were located in 81 prefecture-level cities, accounting for 24.3% of the total number of cities at this level. In general, China’s special poor areas form a spatial scope involving two-thirds of its provincial administrative regions, a quarter of prefecture-level cities, and one in ten counties.
The distribution of special poor areas has clear regional differences. Western China has 231 special poor areas, occupying 76% of the total and forming a dominant concentration. The central region comes second, housing 46 counties and accounting for 15.13% of the total. 21 special poor areas are located in the northeast, while the remainder are in eastern China. Regarding provincial differences, 69 counties in Tibet meet the study’s specifications, thus constituting more than one-fifth of the total. As shown in Table 1, Shaanxi, Yunnan, Xinjiang, Guangxi, and Guizhou have 20–30 special poor counties, while Sichuan, Gansu, Shanxi, Inner Mongolia, Jiangxi, and Henan contain 10–20% of the total. Qinghai, Hubei, Ningxia, Hebei, Anhui, and Jilin all had fewer than 10 counties with special poor areas, and Chongqing only had one such county. In terms of the ratio of special poor areas to all counties in each province, Tibet ranked first with 94.5%, followed by Ningxia (53.85%) and Shaanxi (31.33%). The ratios of Guangxi, Guizhou, Yunnan, Gansu, Xinjiang, and Qinghai fluctuated from 20% to 30%, while Shanxi, Inner Mongolia, Sichuan, Jiangxi, Hubei, and Jilin ranged from 10% to 20%. The special poor counties of the other provinces made up less than 10% of the total;
(3)
Special poor areas cover 2.575 million square kilometers of land, accounting for 26.8% of China’s total land mass. They are mainly distributed in the west, with an area of 2.23 million square kilometers, comprising 87.9% of the overall area. From the perspective of provincial administrative districts, Tibet is the largest, with an area of 1.22 million square kilometers of special poor areas, followed by Xinjiang (0.38 million square kilometers). The special poor areas in Qinghai and Inner Mongolia are, respectively, spread over 0.24 and 0.17 million square kilometers, constituting 9.27% and 6.46% of the overall area. Sichuan and Yunnan also exceed 0.1 million square kilometers of special poor areas. A total of 91.67% of the land in Tibet, 46.02% of Ningxia, 33.14% of Qinghai, and 29.32% of Guizhou is occupied by special poor areas;
(4)
Although the land occupied by special poor areas is widespread, the population of these areas is relatively small: a total population of 89.92 million people, accounting for only 6.5% of China’s population. This is because the population density in special poor areas is low, with only 35 people per square kilometer, while the average population density of China is 144 people per square kilometer (four times higher). The special poor areas in Sichuan and Henan have the largest populations, making up 10.51% and 10.53% of the total populations of these regions, respectively. More than 8 million people live in the special poor areas of Guizhou, as well as over 7 million in Guangxi. Yunnan, Shaanxi, Xinjiang, Anhui, and Jiangxi each have five to six million people living in their special poor regions, and Hubei, Inner Mongolia, Gansu, Shanxi, Ningxia, and Tibet each have somewhere between two and five million people in their special poor areas. Special poor areas in Hebei only have 1.99 million inhabitants, whereas the population in each of the remaining regions is less than one million. In terms of the ratio of the population in special poor areas to the overall population of a province, Tibet ranks first at 91.72%, followed by Ningxia at 31.4%, Xinjiang at 27.69%, and Guizhou at 20.95%. The ratios in Shaanxi, Sichuan, Inner Mongolia, Yunnan, Jiangxi, Guangxi, and Gansu are between 10% and 20%.

4. Characteristics of China’s Special Poor Areas

4.1. General Characteristic

The special poor areas are important for regional and national economic development, cultural prosperity, social stability, and ecological protection. They have functional attributes as well as regional features and comparative advantages. Such areas feature multi-ethnic integration and rich resources owing to ample water resources, ecological barriers, and national borders. In general, they have an indispensable role in territorial development. The general characteristics of special areas are as follows:
(1)
They are rich in mineral, energy and biological resources, and also present opportunities for tourism. Many special poor areas are hilly areas with complex geological and metallogenic environments, and are rich in mineral resources, especially nonferrous metals. Some relevant counties have become strategic reserves for resource extraction. These areas are rich in energy resources, including oil, gas, coal, hydropower, and new energy, and some areas in the western region have become part of projects to provide electricity and gasto China’s eastern region, whereas others are sources for the generation of coal-based power. A total of 71.9% of China’s grassland and 17.9% of its forestland are concentrated in these areas. Some counties are in mountainous or alpine areas, or contain zones featuring farming, pastoral activity, and forests with complex conditions related to the water, soil, and heat that create unique resources for biodiversity and the development of tourism;
(2)
The ecological status of special poor areas is also indispensable. These areas are the origins of many rivers, and 41% of the national ecological counties of China are located in these areas;
(3)
Special poor areas play an important role in preserving cultural heritage and protecting cultural diversity. Characterized in part by the presence of ethnic minorities, they involve complex ethnic relations and varied religious beliefs. Moreover, more than 30 ethnic minorities in China live adjacent to the same ethnic group as theirs along the borders with neighboring countries, which is important for national unity and social stability;
(4)
Many special poor areas are also important platforms for opening-up to foreign countries. Special poor counties constitute 28 border ports of China, including two first-class railway ports, 21 first-class highway ports, and five second-class highway ports. A number of cooperative platforms have been built in these areas, such as opening-up pilot zones, economic border cooperation zones, cross-border economic cooperation zones, and frontier trade markets. This places these areas at the forefront of China’s opening-up;
(5)
Poverty is the most prominent characteristic of these regions. The per capita GDP of special poor areas is only 14.2% of the national average, and their gross product accounts for only 0.92% of the nation’s total. These areas are heavily dependent on central transfer payments from the central government and thus suffer from significant population outflow.

4.2. Level of Particularity

Theoretically, the given combination of the attributes of poverty and the four kinds of special functions can form 14 types of special poor areas, but only 10 of them were observed in the regions studied here. The grade of particularity can be divided into four levels according to the number of attributes superimposed. The greater the number of functional attributes that overlap, the more special the given area. On the whole, the distribution of the number of counties in each grade conformed to a pyramid structure.
Level IV: This level refers to areas with four functional attributes at the same time: areas featuring ecological degradation, areas with ethnic minorities, border areas, and areas housing old revolutionary bases. These counties have the most complex geographical conditions and face the most daunting challenges of the areas considered. As shown in the Table 2, however, none of the counties considered are in the IV Level.
Level III: Areas in this level denote poor areas with three functional attributes. Six special poor counties were included in this level, accounting for 1.97% of the total and covering an area of 152,700 square kilometers with a relatively small population of 1.18 million people. All six counties participated in the functions of ethnic unity, border defense, and ecological restoration. Counties of level III were mainly distributed in the northwest border areas, especially in the western border areas of Xinjiang.
Level II: This level refers to the spatial overlap between poor areas and two special functional attributes. Sixty-seven counties formed this level, accounting for 22.04% of the total. They occupied an area of 650,200 square kilometers, 25.25% of the overall area of special poor areas in China. The spatial distribution of areas in level II is relatively concentrated and contiguous, and they were mainly located along the border areas of Tibet, western Xinjiang, Shaanxi–Gansu–Ningxia area, and the border areas of Yunnan–Guangxi–Guizhou. Theoretically, six kinds of combinations can be formed by overlapping the four special functional areas pairwise, but no county belongs to areas with old revolutionary bases and those featuring ethnic minorities. Nearly half of the counties at this level had the functional attributes of both the areas with old revolutionary bases and those featuring ecological degradation and were mainly distributed in the Shaanxi–Gansu–Ningxia and Yunnan–Guangxi–Guizhou areas. Twenty special poor counties were located in Tibet, and the other three combinations accounted for only fourteen special counties.
Level I: Areas classified in this level have only one functional attribute, but this does not mean that their status is insignificant. Special poor counties containing areas with old revolutionary bases or ethnic minorities are the most common, making up 29.28% and 27.30% of the total, respectively, and are scattered all over the country. A total of 36 counties contained areas with the function of ecological restoration and were mainly distributed in the interlaced farming–pastoral–forestry zone in north China, Shanxi area, northern Yunnan, middle Guizhou, and Guangxi. The rest of the counties at this level were concentrated in the border areas of northeast China and Yunnan province.

4.3. Contiguous Special Poor Areas

The implementation of regional policy should focus not only on accuracy and pertinence but should also pay attention to spatial contiguity and regional coordination. According to the regional contiguity, natural geographical conditions, and other attributes, the special poor counties can be divided into 12 contiguous areas as shown in the Table 3.
(1)
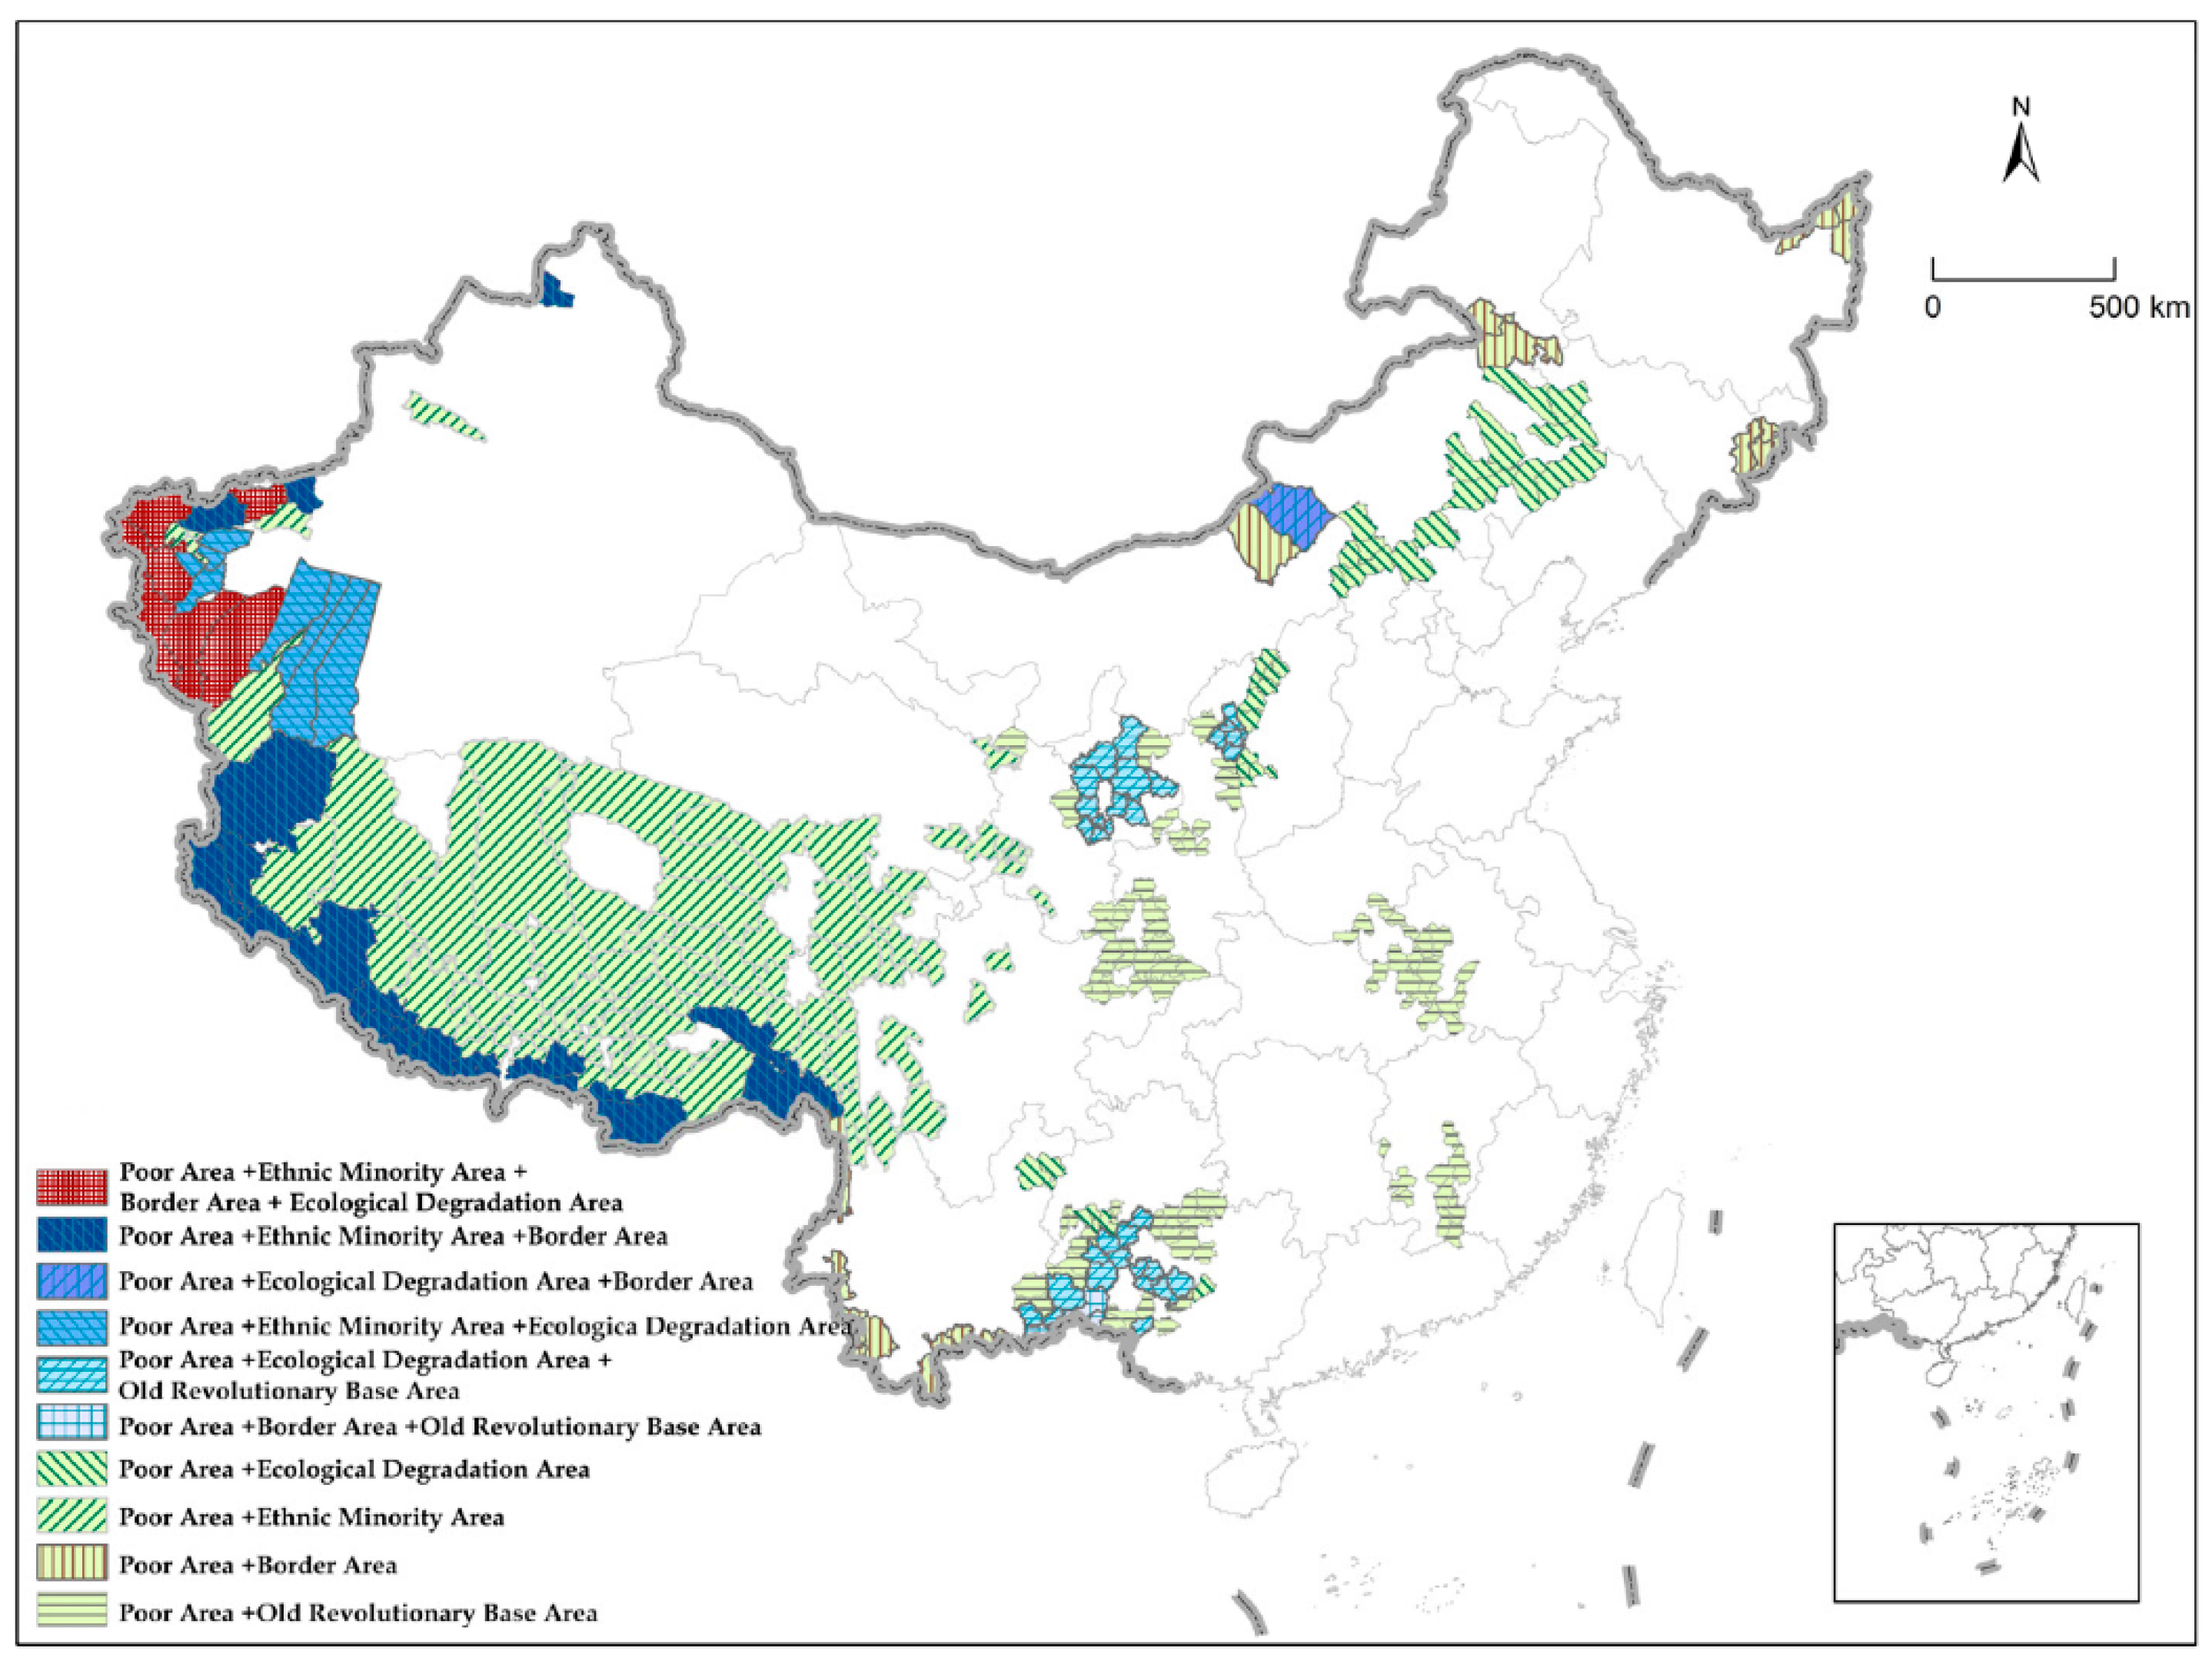
Contiguous special poor areas are mainly distributed in western China, with a few in the middle of the country but none in the east. These areas include Lulinag Moutain, Shaanxi-Gansu-Ningxia, southern Gansu in northwest China, Yunnan-Guizhou-Guangxi area, Sichuan-haanxi area, Yunnan-Guangxi border area in southwest China, Tibet-Xinjiang-Qinghai in western China, Sanjiang Plain, Changbai Mountain in northeast China, the interlaced farming-pastoral-forestry zone in north China, and Dabie Mountain and southern Jiangxi in Central China;
(2)
The contiguous areas are highly concentrated, covering 295 counties and accounting for 97.04% of all special poor regions. The land area of 12 contiguous areas is 2.53 million square kilometers, making up 98.07% of the total. There are 86.64 million people living in contiguous areas of special poor counties, constituting 96.35% of the overall population of these counties. This shows that the special poor areas have a good spatial basis for the centralized implementation of regional policies and coordinated revitalization;
(3)
The scope of each contiguous special poor area is significantly different. The Tibet-Xinjiang-Qinghai area includes more than a third of all counties, with the largest area and population of the 12 contiguous areas accounting for 71.66% and 11.39% of the total, respectively. The Yunnan-Guizhou-Guangxi area is ranked second, with 41 special poor counties making up 13.49% of all counties, and an area and population amounting to 11.6% and 17.78% of the total, respectively. Each contiguous area in the Luliang Mountain area, Dabie Mountain area, interlaced farming–pastoral–forestry zone, Shaanxi-Gansu-Ningxia area, and Sichuan-Shaanxi area include more than 20 special poor counties. Among them, the interlaced farming-pastoral-forestry zone in north China occupies 20.58% of the total land area. Dabie Mountain has a larger population, with 21.92% of the total. The spatial scopes of the Yunnan-Guangxi border area and southern Jiangxi are relatively small in comparison, with 15 and 10 special poor counties, respectively. Southern Gansu, Sanjiang Plain, and Changbai Mountain are at the bottom of the list, with no more than five special poor counties each;
(4)
The prominent function of each contiguous special poor area varies among controlling ecological degradation, ethnic unity, preserving old revolutionary bases, and acting as border areas. Some areas only have a single-function, such as the Sanjiang Plain and Changbai Mountain area, whose function is to act as border defense. Some have mixed-functions; for instance, the interlaced farming-pastoral-forestry zones in north China and southern Gansu are important for ecological restoration and ethnic unity, the southern Jiangxi, Dabie Mountain area and Sichuan-Shaanxi area house old revolutionary bases and in turn protect historical heritage and the region’s ecology, the Yunnan-Guangxi area has the dual attributes of a border area and housing old revolutionary bases, focused on protecting historical heritage and providing border defense, southern Gansu attends to ecological restoration and ethnic unity, and the Shaanxi-Gansu-Ningxia area, Luliang Mountain area, and Yunnan-Guizhou-Guangxi area focus on ecological restoration and historical heritage owing to their dual role as areas with old revolutionary bases and responsibilities of mitigating ecological degradation. The other areas have a more complex role; for example, the simultaneous developmental themes of the Tibet-Xinjiang-Qinghai area are ethnic unity, ecological protection, and border defense.

5. Geographical Conditionsof China’s Special Poor Areas

5.1. Physical Geographical Environment

Special poor areas have a complex physical geographical environment involving different landforms. Some areas have little precipitation, water shortages, and poor soil. Others are located in remote mountains, rocky desertification areas, or remote alpine plateaus. The natural conditions are harsh, and the water, soil, light, and heat are inadequate to satisfy the needs of agricultural production. The characteristics of the physical geography of special poor areas are as follows:
(1)
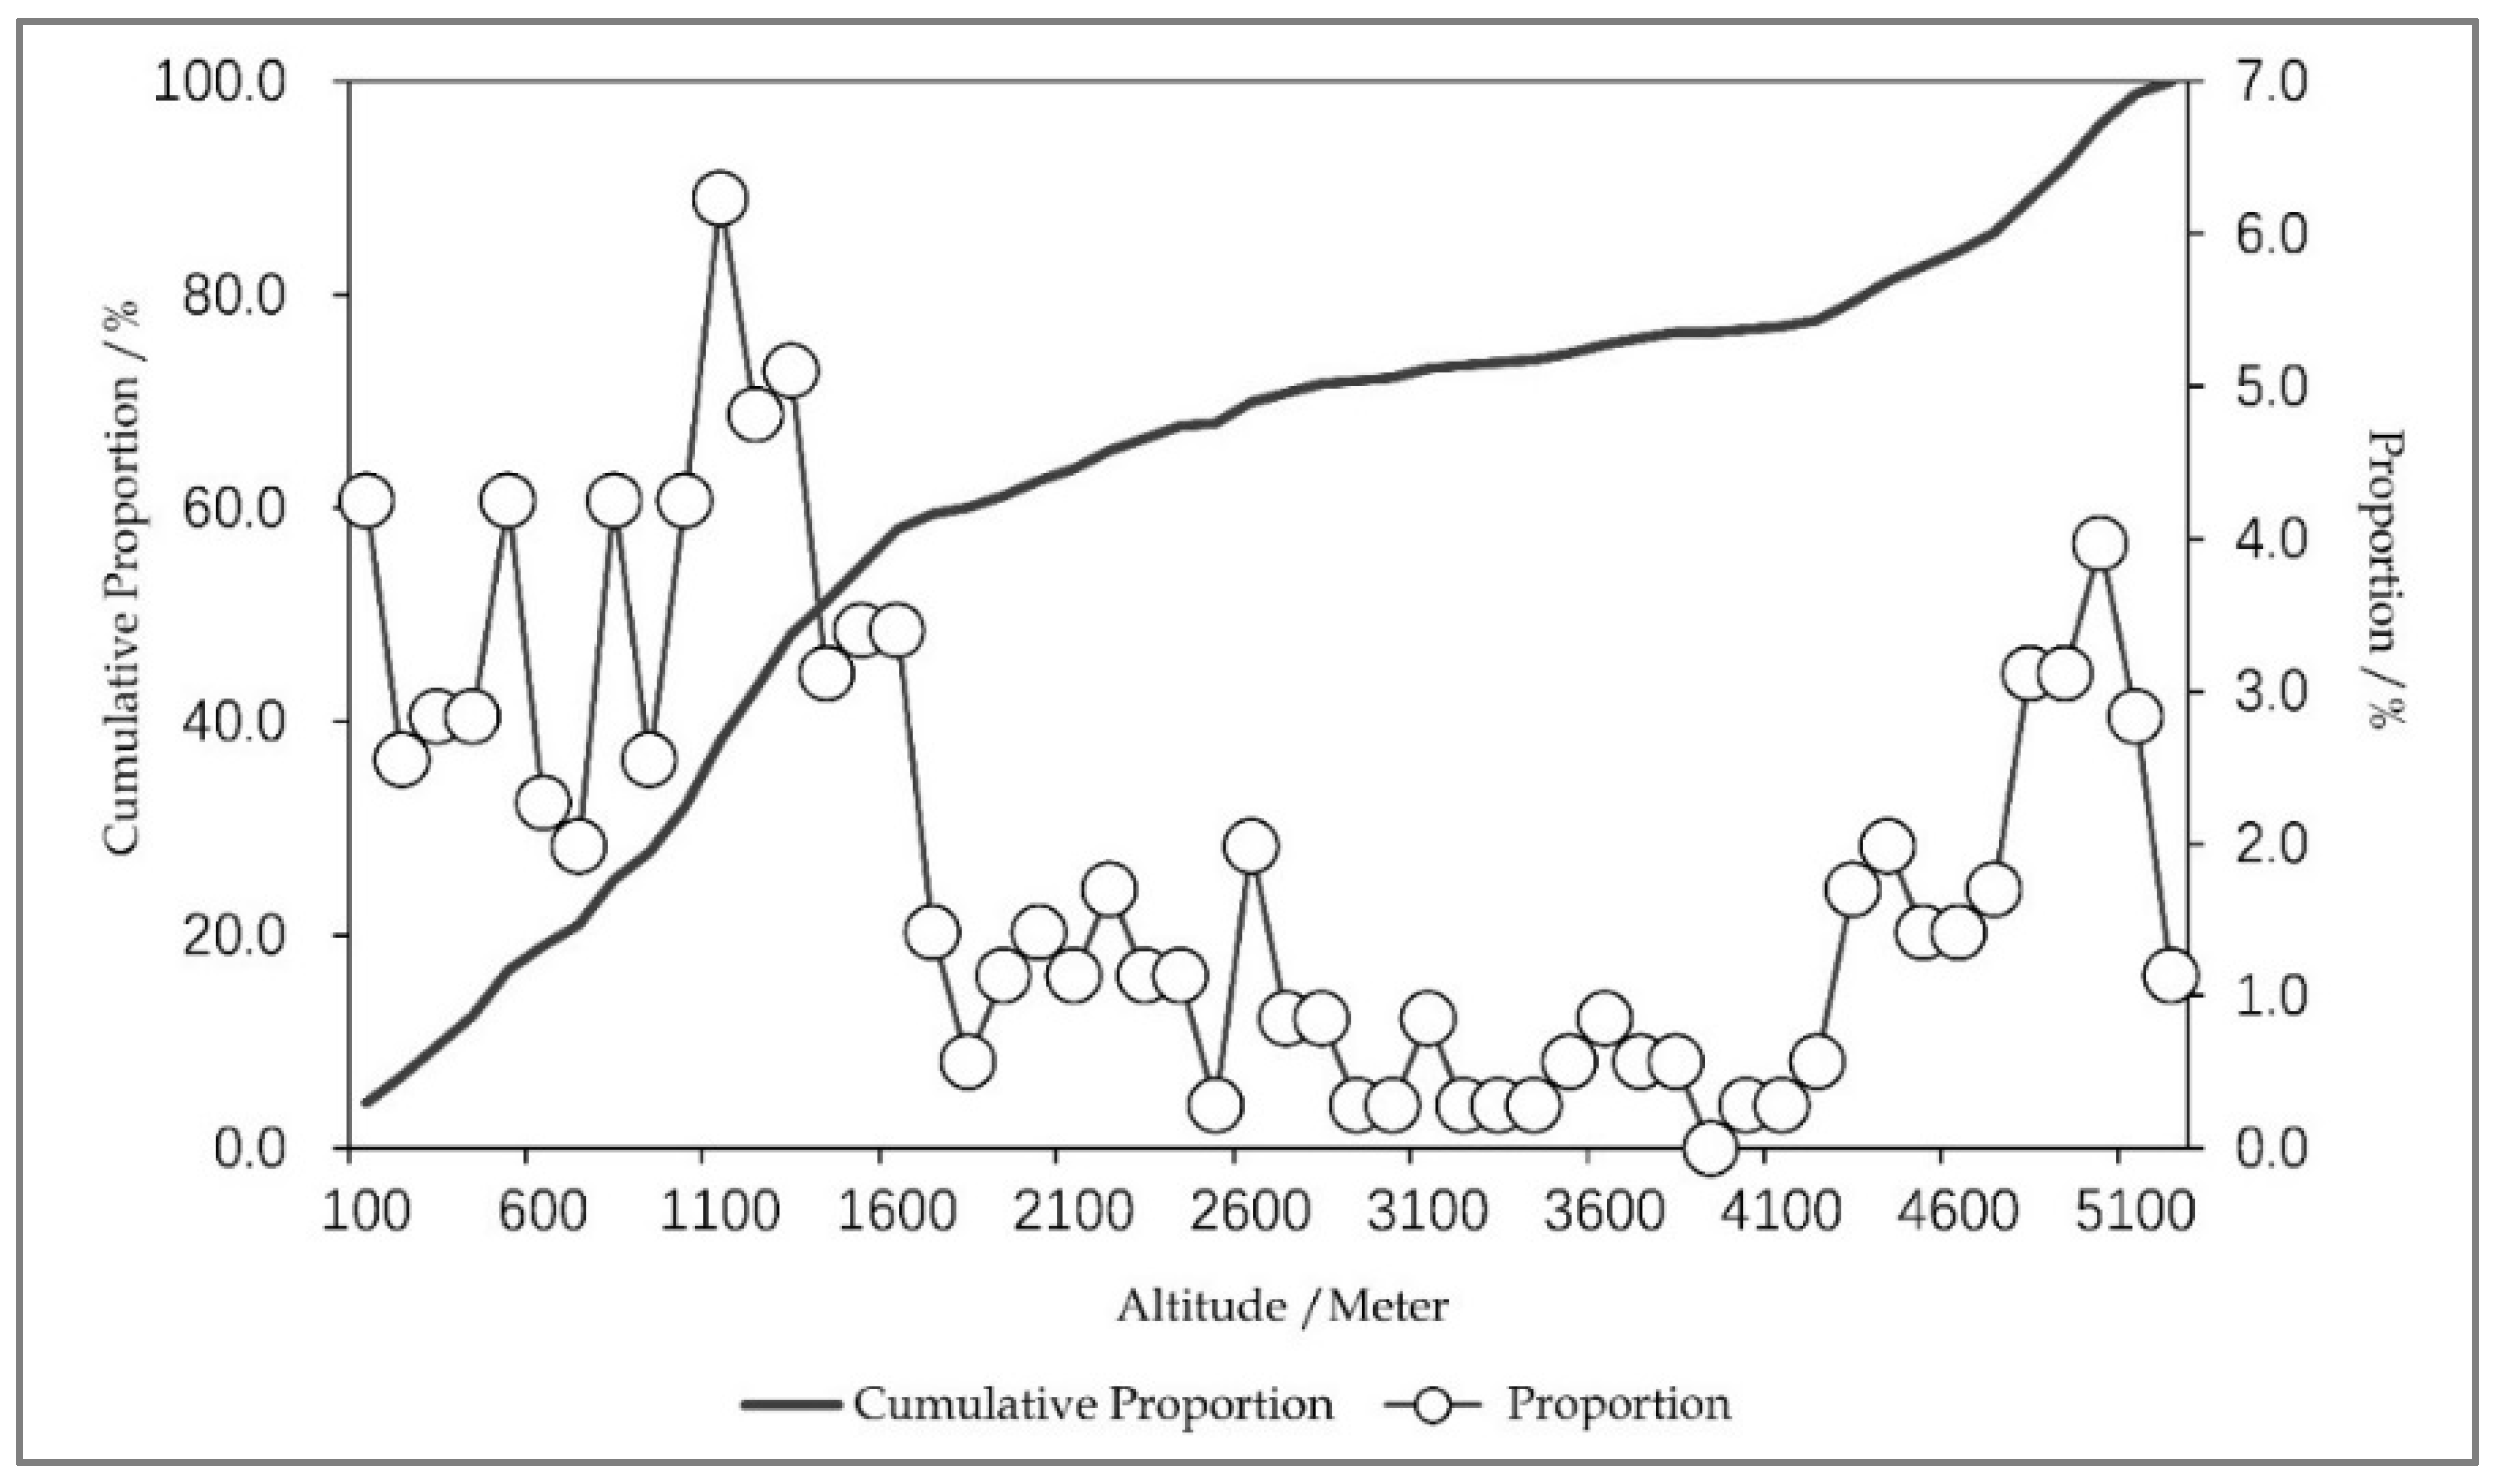
Most special poor counties are located at high altitudes over 1000 m with arctic–alpine climate. Illustrated by Figure 2, a third of them are at an altitude over 2000 m, with a quarter over 3000 m, a fifth over 4000 m and 1/12 over 5000 m. A total of 98,800 square kilometers of land in special poor areas is permanently covered by ice and snow;
(2)
These areas have various landforms, and include plateaus, grasslands, valleys, hills, mountains, basin sand plains, corresponding to different types of soil. Typical geomorphic units include the Qinghai–Tibet Plateau, Yunnan Guizhou Plateau, Loess Plateau, Qinba Mountain, Dabie Mountain, Luliang Mountain, and Liupan Mountain. A total of 35.3% of special poor counties are distributed in hilly areas, of which 40 are in Qinba Mountains, 26 in Dabie Mountains, 23 in Luliang mountains, 22 in Liupan Mountains, 10 in Wuyishan Luoxiao Mountains, and six in Daxinganling Mountains. The same percentage of counties are located in the alpine plateaus, and 3.9% and 5.8% of them are situated in desert and grassland areas, respectively, especially in the Horqin Grassland, Xilin Gol Grassland, and Tagan Lamakan Desert;
(3)
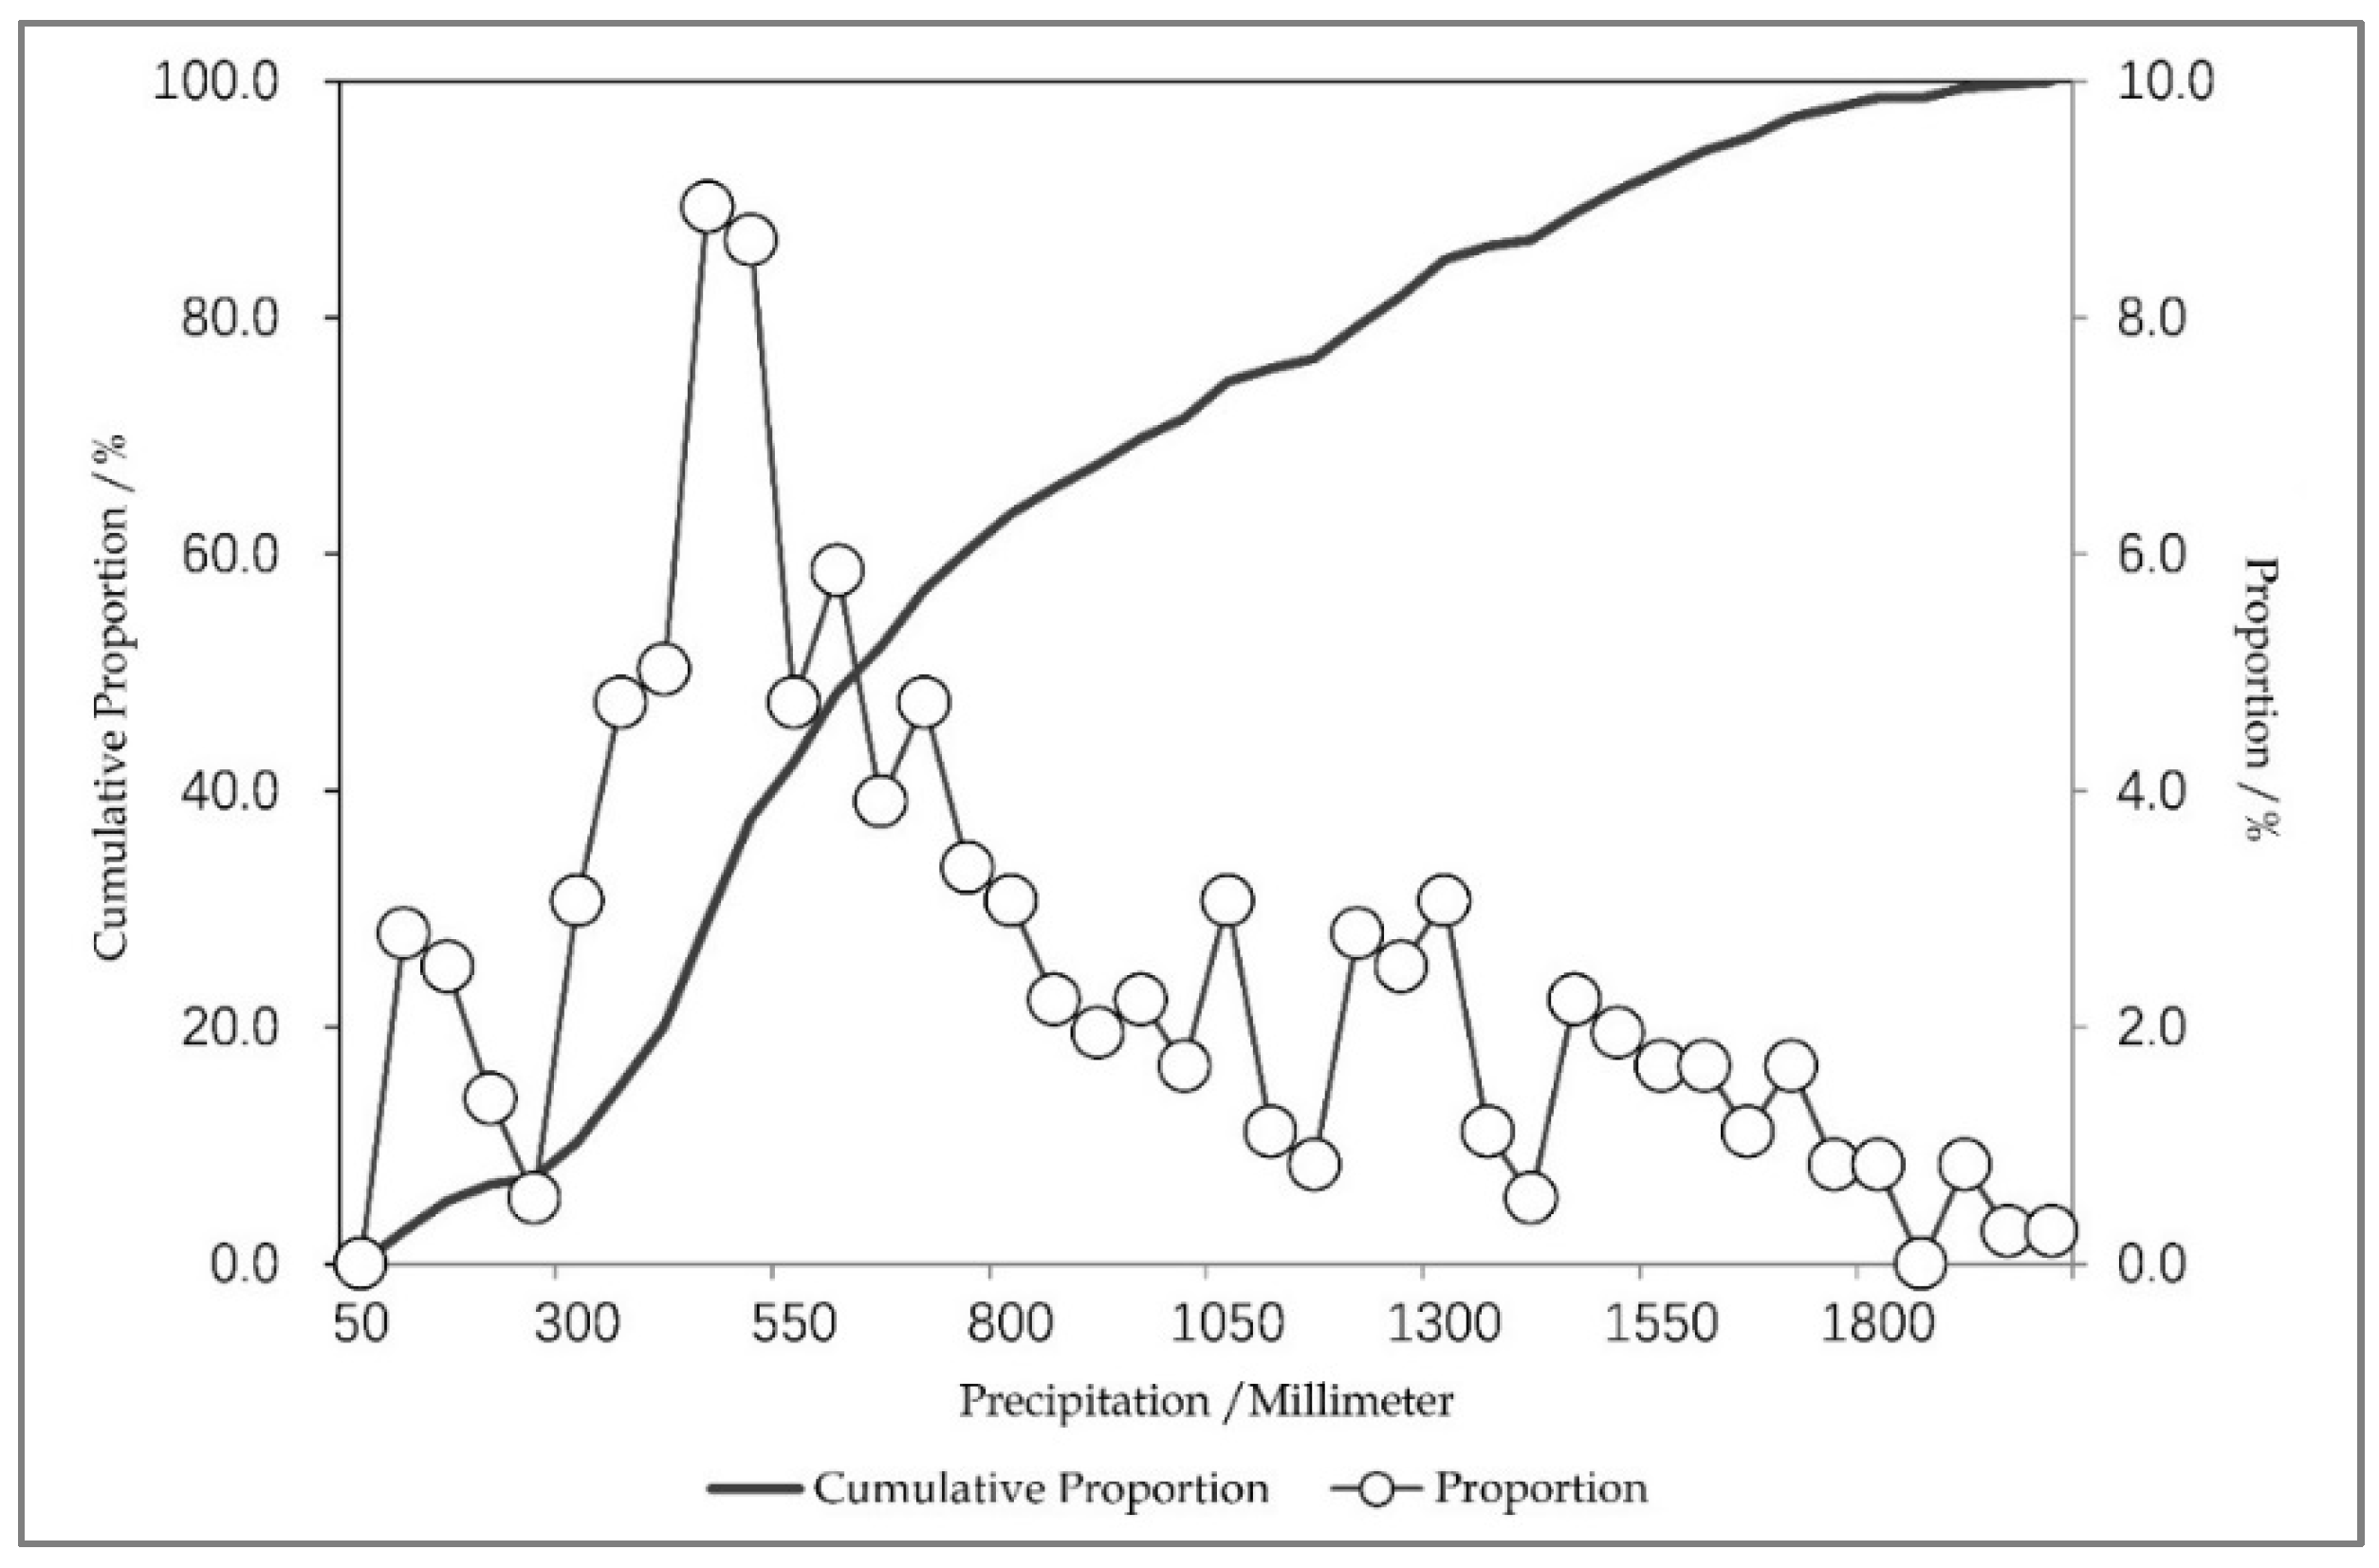
Some counties are in the arid climate zone and suffer from water shortage and a lack of water conservancy projects. The shortage of water is an important bottleneck in their development. Seventy-two special poor areas are distributed within a 400-mm contour of precipitation, covering 1.8 million square kilometers of land and accounting for 56.6% of the overall area. The counties with annual precipitation of less than 800 mm account for more than 60% of the total, as shown in Figure 3. These arid counties are mainly distributed in Horqin Sandy Land, the interlaced farming–pastoral–forestry zone in north China, Loess Plateau, Tibet, and Xinjiang. Twenty-four counties are subjected to precipitation of less than 200 mm in northwest Tibet and southern Xinjiang, covering an area of 865,000 square kilometers and making up 27.2% of the total.

5.2. Location

Most special poor counties are located in remote areas, which has a negative impact on their opportunities and their potential for development.
(1)
The special poor areas are mainly distributed in central and western China, far from coastal areas. Except for 20 counties in Hebei and Guangxi, the average distance between special poor counties and the coastline is 1173 km. Among these counties, 159 are more than 1000 km away from the coastline, accounting for 45% of all special poor counties, whereas 60 are over 2000 km away and 25 are over 3000 km away. The special poor counties are thus located far from the centers of economic development and international trade markets and have poor contact with domestic coastal areas and foreign countries;
(2)
Most special poor counties are far from central cities and urban agglomerations of provinces, with an average distance of 521 km, which is far beyond the direct range of radiation of the provincial capitals (300 km). Fifty-five counties are located in remote hilly and mountainous areas with an inconvenient transportation infrastructure and are more than 800 km from their respective provincial capitals. If 100 km, 200 km, and 300 km are set as the respective radiation distances for one-hour, two-hour, and three-hour economic circles of the provincial capitals, 162 special poor counties are distributed outside the three-hour economic circle, accounting for 45.8% of the total; 69 are distributed within the three-hour economic circle, accounting for 19.5%; 87 cities are within the two-hour economic circle; 34 counties are within the one-hour economic circle. Thus, most special poor counties are not within the scope of radiation of central cities and thus lack developmental guidance;
(3)
A total of 203 special poor counties, 67.2% of the total, are distributed in the border areas of provinces, with some at the junction of two or even three provinces. The provincial boundary is an administrative constraint on resource allocation and flow in China. Due to their special location, these areas are simultaneously ignored by their own provinces and neighboring provinces, resulting in the insufficient formulation of policies and allocation of resources.

5.3. Ecological Problems

Many special poor areas have a good foundation in terms of their natural environments, but this advantage has long been dissipating and ecological problems have begun to arise in some counties, further contributing to poverty. The main ecological problems can be divided into the following categories:
(1)
Soil erosion
This problem has become a common phenomenon in southern China. In an area that receives a large volume of rainfall, soil erosion, including dissolution and water erosion, is significant due to both the precipitation conditions and human interference, such as excessive deforestation and resource exploitation. This leads to vegetation degeneration and reduced capacity for water conservation. In the last 20 years, the average annual net increase in the area where soil has eroded exceeds 3%, and the average soil erosion modulus is 3000 t/km2 a year. In the rocky desertification areas of Yunnan, Guangxi, and Guizhou, nearly one centimeter of topsoil is lost every year, and an estimated 4 billion tons of sediment flows into rivers;
(2)
Land degradation
Some special poor counties have a large area of degraded land, especially in northwest and northern China. In the interlaced farming–pastoral–forestry zone of northern China, the shortage of water resources, the occupation of cultivated land, and the overgrazing on grasslands lead to significant vegetation degradation and strong sandstorms. The area of desertification land in special poor areas exceeds 0.2 million square kilometers, accounting for 11.8% of the total area of national desertification land. A total of 53.6% of grasslands in these counties suffer from above-middle desertification, and this area is expanding at 2 million hectares per year. The oases in the northwest, which mainly rely on melting snow to sustain poplar forests and the desert shrub ecosystem, are experiencing severe ecological degradation owing to a decline in melting snow;
(3)
Tension between humans and the land
The deterioration of the human–land relationship is the core contradiction in most special poor counties. The foundation of the natural geographical environment is poor, with significant pressures from production and living, and this has led to overgrazing, over-reclamation, and deforestation. This unsustainable developmental model leads to land degradation, grassland desertification, and soil erosion. The problem of reclamation in sandy lands is particularly prominent. From 2010 to 2015, the cultivated area in China’s sandy lands increased by 1.14 million hectares, with a growth rate of 3.6%. In 2014, the average rate of livestock overload in pastoral counties reached 20.6%. Agricultural production consumes a large amount of water, which leads to the shortage of ecological water and further desertification of land;
(4)
Natural disasters
Special poor areas have complex natural geographical environments and climatic conditions that lead to various natural disasters, such as sandstorms, mudslides, landslides, floods, droughts, and insect plagues. Losses due to natural disasters are estimated to increase annually by 9%, more quickly than the economic growth of most ecologically vulnerable counties. In the eastern part of Inner Mongolia, nearly 7 million hectares of grasslands have lost their grass storage function because of consecutive droughts. Natural disasters will continue to seriously affect production and life in these areas, thus increasing the tension between humans and land.

5.4. Infrastructure and Public Services

Many special poor counties in China remain lacking in infrastructure and public services, including transportation systems, hydraulic facilities, energy supply, communication, education, health, and culture. The internal and external transportation networks in these areas have not yet been fully formed, and there is a lack of external transportation trunk lines. Poor highways that are difficult to access are the only mode of transportation at present. By the end of 2018, only 114 special poor counties were connected to a high-speed railway, accounting for only 31.6% of the total. Ninety-two counties had direct access to the railway, making up 25.5% of the total. In other words, 192 counties and 214 counties remain inaccessible by highway and railway, respectively. There are only 14 airports in special poor areas, where 65.1% of the counties do not have an airport services within 80 km. There is a shortage of hydraulic facilities in a majority of special poor counties, and the supply capacity cannot meet the demands of water for irrigation and household use. Many counties lack power generation facilities and electric transmission grids, which hinders access to the Internet and modern communication facilities. Education, medical care, culture, and other public service facilities are also backward. The number of hospital beds per 10,000 people accounts for only 64.7% of the national average. The insufficient capacity of basic public services has led to a series of difficulties in travel, potable water, education, and medical treatment. Enhancing infrastructure and improving public services are the key tasks for revitalizing special poor areas in the future.

6. Conclusions and Discussion

In the system of territorial development, special functional areas and poor areas often spatially overlap, where poverty is the feature common to both, and this leads to constraints on land development and regional coordination. This study proposed a definition of special poor areas and developed a set of methods to identify them in China, based on a variety of spatial functional attributes. We analyzed their patterns of spatial distribution, natural and geographical characteristics, and the main challenges to the development of these areas.
Special poor areas refer to areas characterized by poverty integrated with one or more spatial functional attributes, including areas with ethnic minorities, those with old revolutionary bases, border areas, and areas featuring ecological degradation. A total of 304 counties and county-level administrative districts in China were identified as special poor counties, accounting for 50.08% of poor counties in the country. They cover a vast territory but are sparsely populated, leading to a distribution pattern of 2/3 of provincial administrative districts, 1/4 of prefecture-level administrative districts, and 1/10 of county-level administrative districts. Such areas are mainly distributed in western China, especially in Tibet. With functions of economic development, cultural preservation, and ecological protection, these areas are important for harmonious regional development.
According to regional contiguity, natural geographical conditions, and other attributes, 12 contiguous special poor areas were formed, including 295 special poor counties and accounting for 97.04% of the total. The area of each contiguous special poor area varies: Tibet–Xinjiang–Qinghai ranks first, followed by the Yunnan–Guizhou–Guangxi area. Some areas have more than one functional attribute; for example, the Yunnan–Guangxi border area has the dual attributes of being a border area and the site of an old revolutionary base, and Tibet–Xinjiang–Qinghai has the most complex role of all contiguous areas. Different attributes determine different developmental themes for each contiguous area, including ethnic unity, ecological protection, ecological restoration, historic heritage protection, and border defense.
Special poor areas have similar geographical conditions, featuring a harsh natural environment, a remote location, a deteriorating ecological environment, and an insufficient infrastructure network and public service system. Parts of these regions lack even the basic amenities of living, which is a bottleneck in their development. Most special poor counties are geographically remote and are far from coastal areas, central provincial cities, and the scope of provincial resource allocation. The ecological situation in some areas is worsening. Soil erosion and water loss are common problems in south China, while degradation is serious in northwest and north China. In addition to these natural disadvantages, a large number of poor counties have poor public infrastructure and services, which affects their opportunities for development.
In the process of transformation and development, the recognition of special poor areas is conducive to paying full attention to regional characteristics, improve the pertinence of policy-making, and avoid the damage of universal policies to area’s special functions. On the one hand, the identification of special functions in a poor area is helpful to implement specific policies. Taking poor areas spatially overlapped by old revolutionary bases as an example, these special poor areas have comparative advantages of historical and cultural resources, which can be transformed into tourism resources. However, there are a larger number of the widowed elderly or the disabled elderly compared to other poor areas, therefore, poverty alleviation work needs to focus on the elderly and strengthen the construction of infrastructure such as pension and medical care. On the other hand, the lack of awareness of special functions and blind policy implementation will carry serious consequences. The common idea to transform and develop a poor area is to develop tourism. However, some poor areas do not realize that they also possess the function attribute of ecological degradation. The large-scale construction of tourism facilities and the lack of control on the number of tourists overwhelms the natural ecosystem and aggravates the vulnerability of the ecological environment. The identification of special poor areas can, to a certain extent, prevent the occurrence of this situation. Although this study detailed the definition, classification, and characteristics of China’s special poor areas, it has some limitations. Firstly, the identification of special poor areas was based on the list of poor counties in China in 2019, but this list is constantly changing. In particular, following China’s comprehensive poverty alleviation program at the end of 2020, absolute poverty has been eliminated from the country, and the criteria used to classify relatively poor areas are unclear. This poses a challenge for the identification of special poor areas in the future. Secondly, we considered only the number of overlapping functional attributes when grading the specialty of special poor areas but did not consider internal differentiations in each type of functional area. In a follow-up study, economic and social statistical data can be used for a more detailed classification of special poor areas, which is conducive to prioritizing them in future policymaking. Finally, international experience has shown that the transformation and revitalization of special poor areas is a slow and difficult process. The effectiveness of many regional policies and policy tools is questionable. This paper only defined and classified special poor areas. The dynamic mechanisms of their formation and development, as well as targeted policies and solutions, still need to be studied.

Author Contributions

Conceptualization, X.X., C.W. and W.Z.; methodology, C.W.; software, X.X.; validation, X.X.; formal analysis, C.W.; investigation, X.X. and C.W.; writing—original draft preparation, X.X. and C.W.; writing—review and editing, S.M. and W.Z.; visualization, S.M. and X.X.; supervision, W.Z.; funding acquisition, C.W. All authors have read and agreed to the published version of the manuscript.

Funding

This research was funded by National Natural Science Foundation of China, grant number 42071151 and Strategic Priority Research Program of the Chinese Academy of Sciences, grant number XDA20010101.

Institutional Review Board Statement

Not applicable.

Informed Consent Statement

Not applicable.

Data Availability Statement

Not applicable.

Conflicts of Interest

The authors declare no conflict of interest.

References

  1. Rodríguez-Pose, A. The revenge of the places that don’t matter (and what to do about it). Camb. J. Reg. Econ. Soc. 2018, 11, 189–209. [Google Scholar] [CrossRef]
  2. Spicer, J. Regional unevenness, national electoral systems, and the” surprising” antiglobalist successes of Anglo-American populism. Camb. J. Reg. Econ. Soc. 2018, 11, 115–141. [Google Scholar] [CrossRef]
  3. Dijkstra, L.; Poelman, H.; Rodríguez-Pose, A. The geography of EU discontent. Reg. Stud. 2020, 54, 737–753. [Google Scholar] [CrossRef]
  4. Storper, M. Separate Worlds? Explaining the current wave of regional economic polarization. J. Econ. Geogr. 2018, 18, 247–270. [Google Scholar] [CrossRef]
  5. EU. Competitiveness in Low-Income and Low-Growth Regions—The Lagging Regions Report; European Commission: Brussels, Switzerland, 2017. [Google Scholar]
  6. Brown, A.; Fornoni, R.; Gardiner, B.; Greunz, L.; Jestl, S.; Rabemiafara, N.; Ward, T. Economic Challenges of Lagging Regions; European Commission: Brussels, Switzerland, 2017. [Google Scholar]
  7. Hodge, G.; Robinson, I.M. Planning Canadian Regions, 2nd ed.; UBC Press: Vancouver, BC, Canada, 2017. [Google Scholar]
  8. Ma, S.; Zhang, W.; Li, X. International Experience in Development Policy of Spatial Region. Urban Plan. Int. 2020, 1–11. Available online: https://kns.cnki.net/kcms/detail/11.5583.TU.20200721.0752.002.html (accessed on 6 June 2021).
  9. Chen, Z.; Shen, Y.; Zhou, Y. On the Absolute and Relative Changes in the Poverty in China’s Villages and on the Setting of the Relative Poverty Line. Manag. World 2013, 1, 67–75. [Google Scholar]
  10. Sun, J.; Xia, T. China’s Poverty Alleviation Strategy and the Delineation of the Relative Poverty Line after 2020: An Analysis Based on Theory, Policy and Empirical Data. Chin. Rural. Econ. 2019, 10, 98–113. [Google Scholar]
  11. Jiang, D.; Zhang, Y.; Yang, L.; Hou, S. A summary report on the classification and development of poor areas in China. Geogr. Res. 1988, 3, 1–16. [Google Scholar]
  12. Zhang, J.; Wu, Y.; Ge, Y.; Wang, C.H.; Hsiangte, K. Eco-security assessments of poor areas based on gray correlation model: A case study in Enshi. Geogr. Res. 2014, 33, 1457–1466. [Google Scholar]
  13. Li, G.; Chang, L.; Liu, X.; Su, S.; Cai, Z.; Huang, X.; Li, B. Monitoring the spatiotemporal dynamics of poor counties in China: Implications for global sustainable development goals. J. Clean. Prod. 2019, 227, 392–404. [Google Scholar] [CrossRef]
  14. He, S.; Liao, F.H.; Li, G. A spatiotemporal analysis of county economy and the multi-mechanism process of regional inequality in rural China. Appl. Geogr. 2019, 111, 102073. [Google Scholar] [CrossRef]
  15. Liu, Y.; Zhou, Y.; Liu, J. Regional Differentiation Characteristics of Rural Poverty and Targeted Poverty Alleviation Strategy in China. Bull. Chin. Acad. Sci. 2016, 31, 269–278. [Google Scholar]
  16. Wang, Y.; Wen, Q.; Liu, Y. Achieving effective connection between rural revitalization and targeted poverty alleviation in poverty-stricken regions. Sci. Geogr. Sin. 2020, 40, 1840–1847. [Google Scholar]
  17. Zheng, C. Study on the quality of economic development in Chinese ethnic minority areas. J. Ethnol. 2011, 2, 1–11, 83. [Google Scholar]
  18. Zhu, X. Economic problems in China’s Ethnic Minority Areas. Econ. Geogr. 1989, 2, 92–96. [Google Scholar]
  19. Wu, Z.; Peng, Y.; Chen, F.; Wei, J. Accurate Measurement of Peasant Family Property Poverty in Ethnic Minority Areas and Countermeasures for Poverty Alleviation. Econ. Geogr. 2020, 40, 171–175, 239. [Google Scholar]
  20. Cheng, Y.; Liu, H.; Gong, P.; Song, T. Spatial Disparity and Its Major Influencing Factors of Export-Oriented Economy in Chinese Border Areas. Econ. Geogr. 2016, 36, 19–26. [Google Scholar]
  21. Peng, F.; Yang, X.; Liu, T.; Cheng, Y.; Han, Z. Spatial Differentiation of the Development Advantage of Geo-Economic System in China’s Border Area. Econ. Geogr. 2019, 39, 19–26. [Google Scholar]
  22. Song, T.; Liu, W.; Li, L. International research on the border regions with a geopolitical perspective and revelation. Prog. Geogr. 2016, 35, 276–285. [Google Scholar]
  23. Li, Z.; Zhang, Y. Industrial poverty alleviation model, problems and solutions in old revolutionary base areas. Jiangxi Soc. Sci. 2016, 36, 61–67. [Google Scholar]
  24. Zhang, M.; Zeng, L. Effect Review and Governance Enlightenment of the State Preference Policy to the Old Revolutionary Areas. Chin. Public Adm. 2020, 6, 92–96. [Google Scholar]
  25. Huang, L.; Cao, W.; Wu, D.; Gong, G.-L.; Zhao, G. Assessment on the changing conditions of ecosystems in key ecological function zones in China. Chin. J. Appl. Ecol. 2015, 26, 2758–2766. [Google Scholar]
  26. Zeng, J.; Yang, Q.; Liu, Y.; Zhao, C.F.; Li, B.H. Research on evolution and influential mechanism for rural humn settlement in national key ecological function areas: A case of Lichuan. Hum. Geogr. 2016, 31, 81–88. [Google Scholar]
  27. Li, X.; Liu, M.; Ge, J. Geographical Factor Analysis for the Household Income in Frontier Region of Southwest China. Acta Geogr. Sin. 2010, 65, 235–243. [Google Scholar]
  28. Li, H.; Mei, A. Research on the particularity and special types of poverty in China’s ethnic minority Areas. J. South-Cent. Univ. Natl. (Hum. Soc. Sci.) 2016, 36, 129–133. [Google Scholar]
  29. Qi, X.; Lin, R.; Cheng, Y.; Ye, S.L. The Review of the Relationship Between Poverty and Environment. Sci. Geogr. Sin. 2013, 33, 1498–1505. [Google Scholar]
  30. Cao, S.; Wang, Y.H.; Duan, F.Z.; Zhao, W.J.; Wang, Z.H.; Fang, N. Coupling between ecological vulnerability and economic poverty in contiguous destitute areas, China: Empirical analysis of 714 poverty-stricken counties. Chin. J. Appl. Ecol. 2016, 27, 2614–2622. [Google Scholar]
  31. Fan, J. High-quality Development of National Territory Space Governance and Regional Economic Layout During 14th Five-Year Plan in China. Bull. Chin. Acad. Sci. 2020, 35, 796–805. [Google Scholar]
  32. Wu, X.; Wei, H. Analysis of the Theoretical Basis, Effect and System of State Regional Aid Policy in China. China Soft Sci. 2009, 7, 94–103. [Google Scholar]
Figure 1. Distribution of special poor areas in China in 2019.
Sustainability 13 08636 g001
Figure 2. Altitude distribution of special poor areas in China.
Sustainability 13 08636 g002
Figure 3. Precipitation distribution of special poor areas in China.
Sustainability 13 08636 g003
Table 1. Proportion of special poor counties in each province.
Province CountyLandPopulation
CountProportion to the Total (304)/%Proportion of all Counties in the Province/%Area/104 km2Proportion of the Total Area/%Proportion of the Area of the Province/%Population/104 PeopleProportion of the Total/%Proportion of the Population of the Province/%
Tibet6922.794.52112.7643.7991.672773.0891.72
Shaanxi268.5531.336.012.3328.66797.5517.37
Yunnan247.8920.6910.213.9726.196937.7115.19
Xinjiang227.2424.4438.3314.8923.096106.7827.69
Guangxi206.5826.675.722.2223.857638.4914.21
Guizhou206.5826.675.282.0529.328889.8820.95
Sichuan196.2513.9712.544.8725.694710.5310.45
Inner Mongolia144.6117.516.636.4614.13734.1515.13
Gansu144.6120.295.792.2513.464094.5514.99
Shanxi134.2813.542.120.8213.242162.46.17
Jiangxi103.2912.352.58115.165686.3211.95
Henan103.299.171.740.6810.2694510.518.65
Qinghai82.6320.5123.869.2733.14410.467.35
Hubei72.310.941.380.537.244915.467.97
Ningxia72.353.853.041.1846.022052.2831.44
Hebei61.974.443.11.216.311992.212.71
Anhui61.979.681.530.5910.915355.957.77
Jilin41.32102.320.912.22890.993.26
Heilongjiang41.326.252.240.874.87390.431.02
Chongqing10.335.260.330.134.01250.280.75
Table 2. Groups and hierarchical structure of special poor regions in China.
LevelCombinationsCountyLandPopulation
NumberProportion /%Area/104 km2Proportion to the Total/%Population/104 PeopleProportion to the Total/%
border + ethnic minority +ecological degradation61.9715.275.931181.31
Sum61.9715.275.931181.31
border + ethnic minority206.5837.2914.48921.02
ethnic minority + ecological degradation82.6313.315.173133.48
old revolutionary base + border51.641.460.571561.73
old revolutionary base + ecological degradation3310.8610.714.16113112.58
border + ecological degradation10.332.250.8770.08
Sum6722.0465.0225.25169918.89
old revolutionary base8929.2822.978.92500155.62
ethnic minority8327.30123.5847.995926.58
border237.5713.305.174214.68
ecological degradation3611.8417.376.75116112.91
Sum23175.99177.2268.82717579.79
Table 3. Basic characteristics of contiguous special poor areas in China.
Contiguous AreaCountyLandPopulationFunction
NumberProportion to the Total/%Area/104 km2Proportion to the Total/%Population/104 PeopleProportion to the Total/%
Tibet-Xinjiang-Qinghai Area10935.86184.5271.66102411.39Ethnic unity, ecological protection, and border defense
Yunnan-Guizhou-Guangxi Area4113.4911.64.50159917.78Ecological restoration and historical heritage protection
Lulinag Moutain Area237.574.221.644474.97Ecological restoration and historical heritage protection
Shaanxi-Gansu-Ningxia Area216.917.442.897438.26Ecological restoration and historical heritage protection
Interlaced Farming-Pastoral-Forestry Zone in North China216.9120.587.996086.76Ecological restoration and ethnic unity
Dabie Mountain Area216.914.291.67186920.79Historic heritage protection and ecological protection
Sichuan-Shaanxi Area206.585.692.21112312.49Historic heritage protection and ecological protection
Yunnan-Guangxi Border Area154.935.332.074364.85Historic heritage protection and border defense
Southern Jiangxi103.292.000.784464.96Historic heritage protection and ecological protection
Southern Gansu51.642.220.86530.59Ecological restoration and ethnic unity
Sanjiang Plain41.322.240.87390.43Border defense
Changbai Mountain Area30.991.470.57530.59Border defense
Publisher’s Note: MDPI stays neutral with regard to jurisdictional claims in published maps and institutional affiliations.

