1. Introduction
Conflict is the main reason for the current surge in the number of people facing acute food insecurity and in need of urgent food, nutrition, and livelihood assistance [
1]. This situation requires sound policies based on accurate evidence.
The literature provides a well-documented analysis of the links between food insecurity and fragile, conflict-affected, and insecure areas [
2,
3]. Although these casual effects are zone-specific, they show the common feature of producing food system disruption [
4]. This situation, directly and indirectly, compromises people and households’ food access and availability, severely impacting their food and nutrition security [
3,
5].
However, as Justino [
6] and Maxwell et al. [
7,
8] have argued, despite such a well-documented nexus between conflicts and hunger, there is a gap of information on the choices and behaviour of people and households when they face a shortage of food in these situations.
Following Christiaensen and Boisvert [
9], Béné et al. [
10], and Levine et al. [
11], food security is a managed process. Households are not passive agents but respond to the risks or shocks they face to reduce their vulnerability to these adverse events. These responses are known as coping strategies, and in the field of food security, the literature distinguishes between food consumption and livelihood-based coping mechanisms. The former are short-term household responses related to food-acquiring activities or their change in eating behaviour to withstand food shortages. On the contrary, the livelihood-based coping strategies are long-term measures adopted by households involving income, expenditures, and assets [
12].
Our paper contributes to the abovementioned literature on food insecurity in countries in protracted crises. More precisely, it adds to the scarce literature on the knowledge of the short- and long-term coping strategies adopted by households in fragile and conflict-affected zones, distinguishing among households with different levels of food security. This knowledge can improve the effectiveness of policy interventions aimed at enhancing food security in conflict and insecure areas. It provides insights into the severity of the situation that people and households face and how they might address the future challenges set by the context. Therefore, this information can contribute to the early warning, assessment, targeting and monitoring, and evaluation phases of the policy-making process [
8].
We addressed these aspects, focusing on the Western Bahr el Ghazal State in South Sudan. The South Sudanese conflict is one of the longest unsolved wars globally. Armed conflicts, communal violence, ethnic tensions, and insecurity continue to afflict the population of Western Bahr el Ghazal, like many other people in the country. This situation has destroyed rural livelihoods, assets, agricultural production, and food systems, aggravating the poverty and vulnerability of almost the totality of people [
13]. More recently, the investigated area is suffering from the cumulative effect of intercommunal violence, a series of climate shocks (drought-like conditions and flooding), and the dramatic impact on the food price increase produced by the lockdown measures introduced to prevent the COVID-19 pandemic [
14]. These factors are the major determinants of an acute food insecurity situation. A situation that affects almost two-thirds of the population in Western Bahr el Ghazal State [
13,
15,
16], in a country, South Sudan, that is classified as one of the eight worst food crises at the global level [
1].
Our study used primary data collected by submitting a survey to 838 households statistically representative of the population in the remote rural areas, including the administrative units of Bagari, Bazia, Bisellia, and in the Wau Protection of Civilian camp (PoC) from July to August 2020. This period coincides with the peak of the lean season lasting from May to August [
15]. In 2020, the hunger season was very severe due to the cumulative negative effect of the abovementioned shocks [
17].
According to our evidence, a large part of the population in the investigated area is on the run. Displacement and migration are the consequences of conflict and insecurity, combined with severe food insecurity and poverty levels. In the Western Bahr el Ghazal State, internally displaced persons (IDPs) are concentrated in civilian camps or IDP camps and absorbed by host communities already under stress [
18]. Another destination of this population is the PoC site located in Wau around the United Nations Mission (UNMISS) base. In this camp, the UNMISS has three primary responsibilities. It provides defence from outside threats, ensures security within the site, and gives logistical support to the humanitarian actors that coordinate the humanitarian response [
19].
Due to the specific and more favourable conditions of access to services and assistance in this camp, we analysed the food consumption and livelihood-based coping strategies in the Wau PoC and those in the rural areas separately. There is another reason for this decision. Following the peace agreement and formation of a new Government, the UNIMISS is withdrawing its peacekeeping forces from the PoC site, transforming it into an IDP camp and progressively transferring its sovereign control to the South Sudanese Government [
20]. During this process, the people will not be expelled or asked to leave the camp, and the humanitarian assistance will continue. However, later, the Government will be responsible for their relocation or assistance. At this very delicate stage, information on household coping mechanisms has become paramount for guiding the exit strategy from the UNMISS without compromising household food security and livelihood.
The other three rural administrative units jointly analysed by our paper, Bagari, Bazia, and Biselia, are among the most war affected and insecure areas in the country. This situation has been enduring for almost 50 years. Moreover, Bagari is characterised by the highest level of insecurity in the State. Looting of homes and livelihoods, killings, sexual and gender-based violence, and harassment of civilians are tangible evidence of this complex situation [
13].
As the objective of the paper is the description of food consumption and livelihood-based coping mechanisms adopted by households in the investigated areas and the understanding of their characteristics, we used a descriptive research design. After presenting the state of food insecurity based on the Food Security Index, the paper proceeds to evaluate the level of fragility of the household food security related to the possibility of adopting short- and long-term coping strategies.
The paper is organised as follows:
Section 2 illustrates the methodology and the data collection procedure used;
Section 3 presents and discusses the results;
Section 4 concludes.
2. Methods and Data
Our descriptive research design used the Food Security Index (FSI), its components, and the reduced Food Consumption Copy Strategy Index (FCSI). We adopted the FSI to characterise the household food security status and one of its components, the Livelihood-based Coping Strategy Index (LCSI), to describe the household’s future coping capacity and long-term coping mechanisms. The FCSI integrates this information with the description of the short-term household responses to the reduced or declining access to food.
In assessing household food security, Maxwel et al. [
8] have recommended the use of different measures for triangulation, especially in humanitarian emergency contexts. To this purpose, the World Food Programme (WFP) has recently constructed a complex measure of household food security, the FSI [
21]. Our analysis adopted this index to characterise the household food security status in the investigated areas. For its computation, we followed the Consolidated Approach for Reporting Indicators of Food Security (CARI) designed by the WFP to analyse and report the level of household food security within a population [
21].
The FSI is a measure that summarises a set of food security indicators computed at the household level and referred to two domains of food insecurity, namely the current status and coping capacity domain. Following the WFP [
21] guidelines, we used the Food Consumption Score (FCS) as representative of the current household food security status and the Food Expenditure Share (FES) and the LCSI as characterising the household coping capacity. Therefore, in our analysis, the FSI describes household food security conditions expressed by the food consumption gap and adaptations that could influence its livelihoods. Livelihood includes the household’s capabilities, material, and social assets, and activities used as a means of living and associated with its survival and future wellbeing [
22,
23,
24].
We combined the indicators composing the FSI to obtain the standard four-scale categories of household food security, namely:
- -
Food secure, those households that can satisfy essential food and non-food needs without exhaustion of assets;
- -
Marginally food secure, those households that can maintain a minimally adequate food consumption level, but that need to deplete assets to sustain some essential non-food expenditures;
- -
Moderately food insecure, those households with some shortfalls in food consumption, or that need to introduce an accelerated depletion of essential livelihood assets to be marginally able to meet their minimum food needs;
- -
Severely food insecure, those households with significant shortfalls in food consumption, or with severe loss of livelihood assets that will increase food consumption gaps or worse [
21].
We used the indicators composing the FSI to compare the state of households’ vulnerability to food insecurity in the two areas analysed and the major features of their livelihood-based coping behaviour.
Concerning the computation of these indicators, we followed the WFP [
25] methodology to quantify the FCS. It is the sum of the frequency of consumption of nine food groups consumed by a household during the 7-day recall period weighed by standard food group scores representing the relative nutritional importance in terms of energy, protein, and micronutrients provided (
Table 1). Therefore, the FCS summarises the dietary diversity, food frequency, and nutritional importance of household food consumption in one index. Based on the level of the score, we categorised households into three groups of food security following the documented guidelines of the WFP (2015), namely poor (FCS between 0–21), borderline (FCS between 21.5–35), and acceptable (FCS > 35).
The second component of the FSI is the Food Expenditure Share (FES) that we obtained by dividing the total expenditures on purchased and non-purchased food by the total household expenditure. We attributed the price for non-purchased food, either self-produced or received as a gift or aid, using the price of the corresponding food item purchased by the household. When the price was not available, we referred to the average price of the item in the reference administrative unit. We followed the same criteria in the very few cases in which price was not available for the purchased food items. An FES lower than 50% indicates food security, between 50 and 65% marginal food security, between 65 and75% moderate food insecurity, and above 75% severe food insecurity. In other words, the greater the food expenditure share in a household’s overall budget, the more economically vulnerable the household.
The final indicator we used to compute the FSI was the Livelihood Coping Strategy Index (LCSI). After consultation with relevant international organisations operating in South Sudan and the local population, we selected fourteen typical behaviours adopted by people when they lack of food or money to access to food in a 30-day recall period. They were:
- -
Sent household members to eat elsewhere;
- -
Sold more animals than usual;
- -
Sold household assets;
- -
Borrowed money/purchase food on credit;
- -
Engaged in fishing, hunting, or gathering wild food more than normal;
- -
Withdrew one or more children from school;
- -
Asked other community members for support of food;
- -
Sold productive assets or means of transport;
- -
Reduced essential non-food expenses;
- -
Sent more household members than normal to cattle and/or fishing camps;
- -
Slaughtered more animals than normal;
- -
Entire household migrated;
- -
Sold remaining female animal of any kind;
- -
Community debt
We classified such behaviours into the following three categories:
Stress, including household members sent to eat elsewhere; more animals sold than usual for the time of the year; household assets sold, including furniture; borrowed money/purchased food on credit; engaged in fishing, hunting, or gathering wild foods more than normal for the time of the year.
Crisis, comprising one or more children from school withdrawn; asked other community members for support of food; sold productive assets or means of transport; reduced essential non-food expenses; sent more household members than normal to cattle and/or fishing camps; slaughtered more animals than normal for the time.
Emergency, encompassing entire household migrated; sold female animals of any kind; used community leaders or local court to collect debts or bride wealth/dowry, or gained the support of food or other resources from another community member.
Therefore, the stress strategies indicated a decrease in the household capacity to manage future shocks, while crisis and emergency mechanisms reduce the future household productivity with an increasing intensity passing from the former to the latter [
21].
For each of the fourteen coping strategies, we asked the respondent to justify its possible non-adoption. In the questionnaire, we also asked the reason for the non-adopted coping strategy. As per the protocol, we also considered as adopted in our computation those strategies that the households could have introduced but were not continued as they were already employed in the last 12 months. Finally, we allocated households to one of the three abovementioned groups based on the most severe strategy adopted [
26]. For example, if a household adopted one strategy classified as “stress” and one as “crisis”, we included that household in the category “crisis”.
To compute the FSI, we organised the FCS, FES, and LCSI in the categories indicated by the WFP [
21] protocol (
Table 2). For each household and indicator, we attributed a score of 1 if in the category Food Secure, 2 if in that of Marginally Food Secure, 3 if in the category Moderately Food Insecure, and 4 if in the category Severely Food Insecure.
We applied the following algorithm to compute the FSI for household
i:
where
s indicates that we are considering the score attributed to the index.
In Equation (1), FES and LCS are divided by 2 to obtain a mean value of the household coping capacity. Therefore, the FSI is computed as the mean value of the household economic vulnerability and its average coping capacity.
Afterwards, we classified our households as food secure if FSI was less than 1.5, marginally food secure if the indicator was between 1.5 and 2.5, moderately food insecure if between 2.5 and 3.5, and severely food secure if above 3.5.
Our analysis also used the reduced FCSI to capture relevant short-term coping strategies adopted when there was insufficient food in the household [
27]. These strategies can be classified into three categories: dietary change, increased short-term food availability, and rationing food. The recall period was 7 days.
We followed Maxwell and Caldwell’s [
28] procedure for the computation of the FCSI. In other words, we summed up the frequency of each coping behaviour multiplied by a severity weight (
Table 3). The weights ranged from 1 to 3, with 1 indicating the less severe coping strategy adopted by the household and 3 indicating the most severe mechanism. We considered a household with an FCSI < 28 as adopting no or low coping strategy, with an FCSI between 28 and 42 as medium coping and FCSI > 42 as high coping.
Our analysis refers to primary data collected in the rural administrative units of Baggari, Bazia, Bessellia, and Wau PoC in the Western Bahr el Ghazal State of South Sudan in the period from July–August 2020. We used a cross-sectional survey to gather data. To design it, we followed the steps suggested by Cochran [
29]. Due to conflict and insecurity, access to the rural areas, especially to Baggari, the dataset we collected contributed to improving knowledge to uncover new topics in the investigated area.
Our sample includes 838 households statistically representative of the population of the investigated area: 61% of the households were in the Wau PoC, and 39% were in the rural area. We selected them based on Cochran’s [
29] formula using a confidence level of 95% and the desired margin of error of 4%. In our overall sample, 53.47% of the household heads were males. However, in the Wau PoC, 56.08% of them were females, reflecting this predominant component in the population in the camp. The average age of the household heads was 39 years in the Wau PoC against 43 in the rural zones. The married heads of the family were 61% in the Wau PoC and 76% in the rural areas. The literacy rate of the household heads was higher in the protection of civilian camp compared to the rural zones; it was 49% and 30%, respectively. The mean size of the household was 5 members in the Wau PoC and 6 in the rural areas.
We employed 30 local enumerators to collect data through a questionnaire designed and validated to verify its reliability and validity. We validated the questionnaire using the local stakeholders and a group of enumerators. The questionnaire was translated into the two most important spoken languages, namely English and Arabic. It was articulated into ten sections: general information, household characteristics, occupation and income, household food production, food security, food and non-food basket, assistance received, housing and infrastructure, WASH, and food insecurity and poverty perception. For our study, we used the section on the household characteristics, assistance received, and food security. In this latter part, we collected the information for the above-described indicators.
In addition, we trained the enumerators to equip them with appropriate knowledge and skills to conduct the interviews and motivate respondents to give complete and accurate answers. During the interviewing process, the interviewer read a standard set of questions, excluding any possible discretion. We used the enumerators for piloting our questionnaire.
We processed the dataset using STATA release 15.
3. Results and Discussion
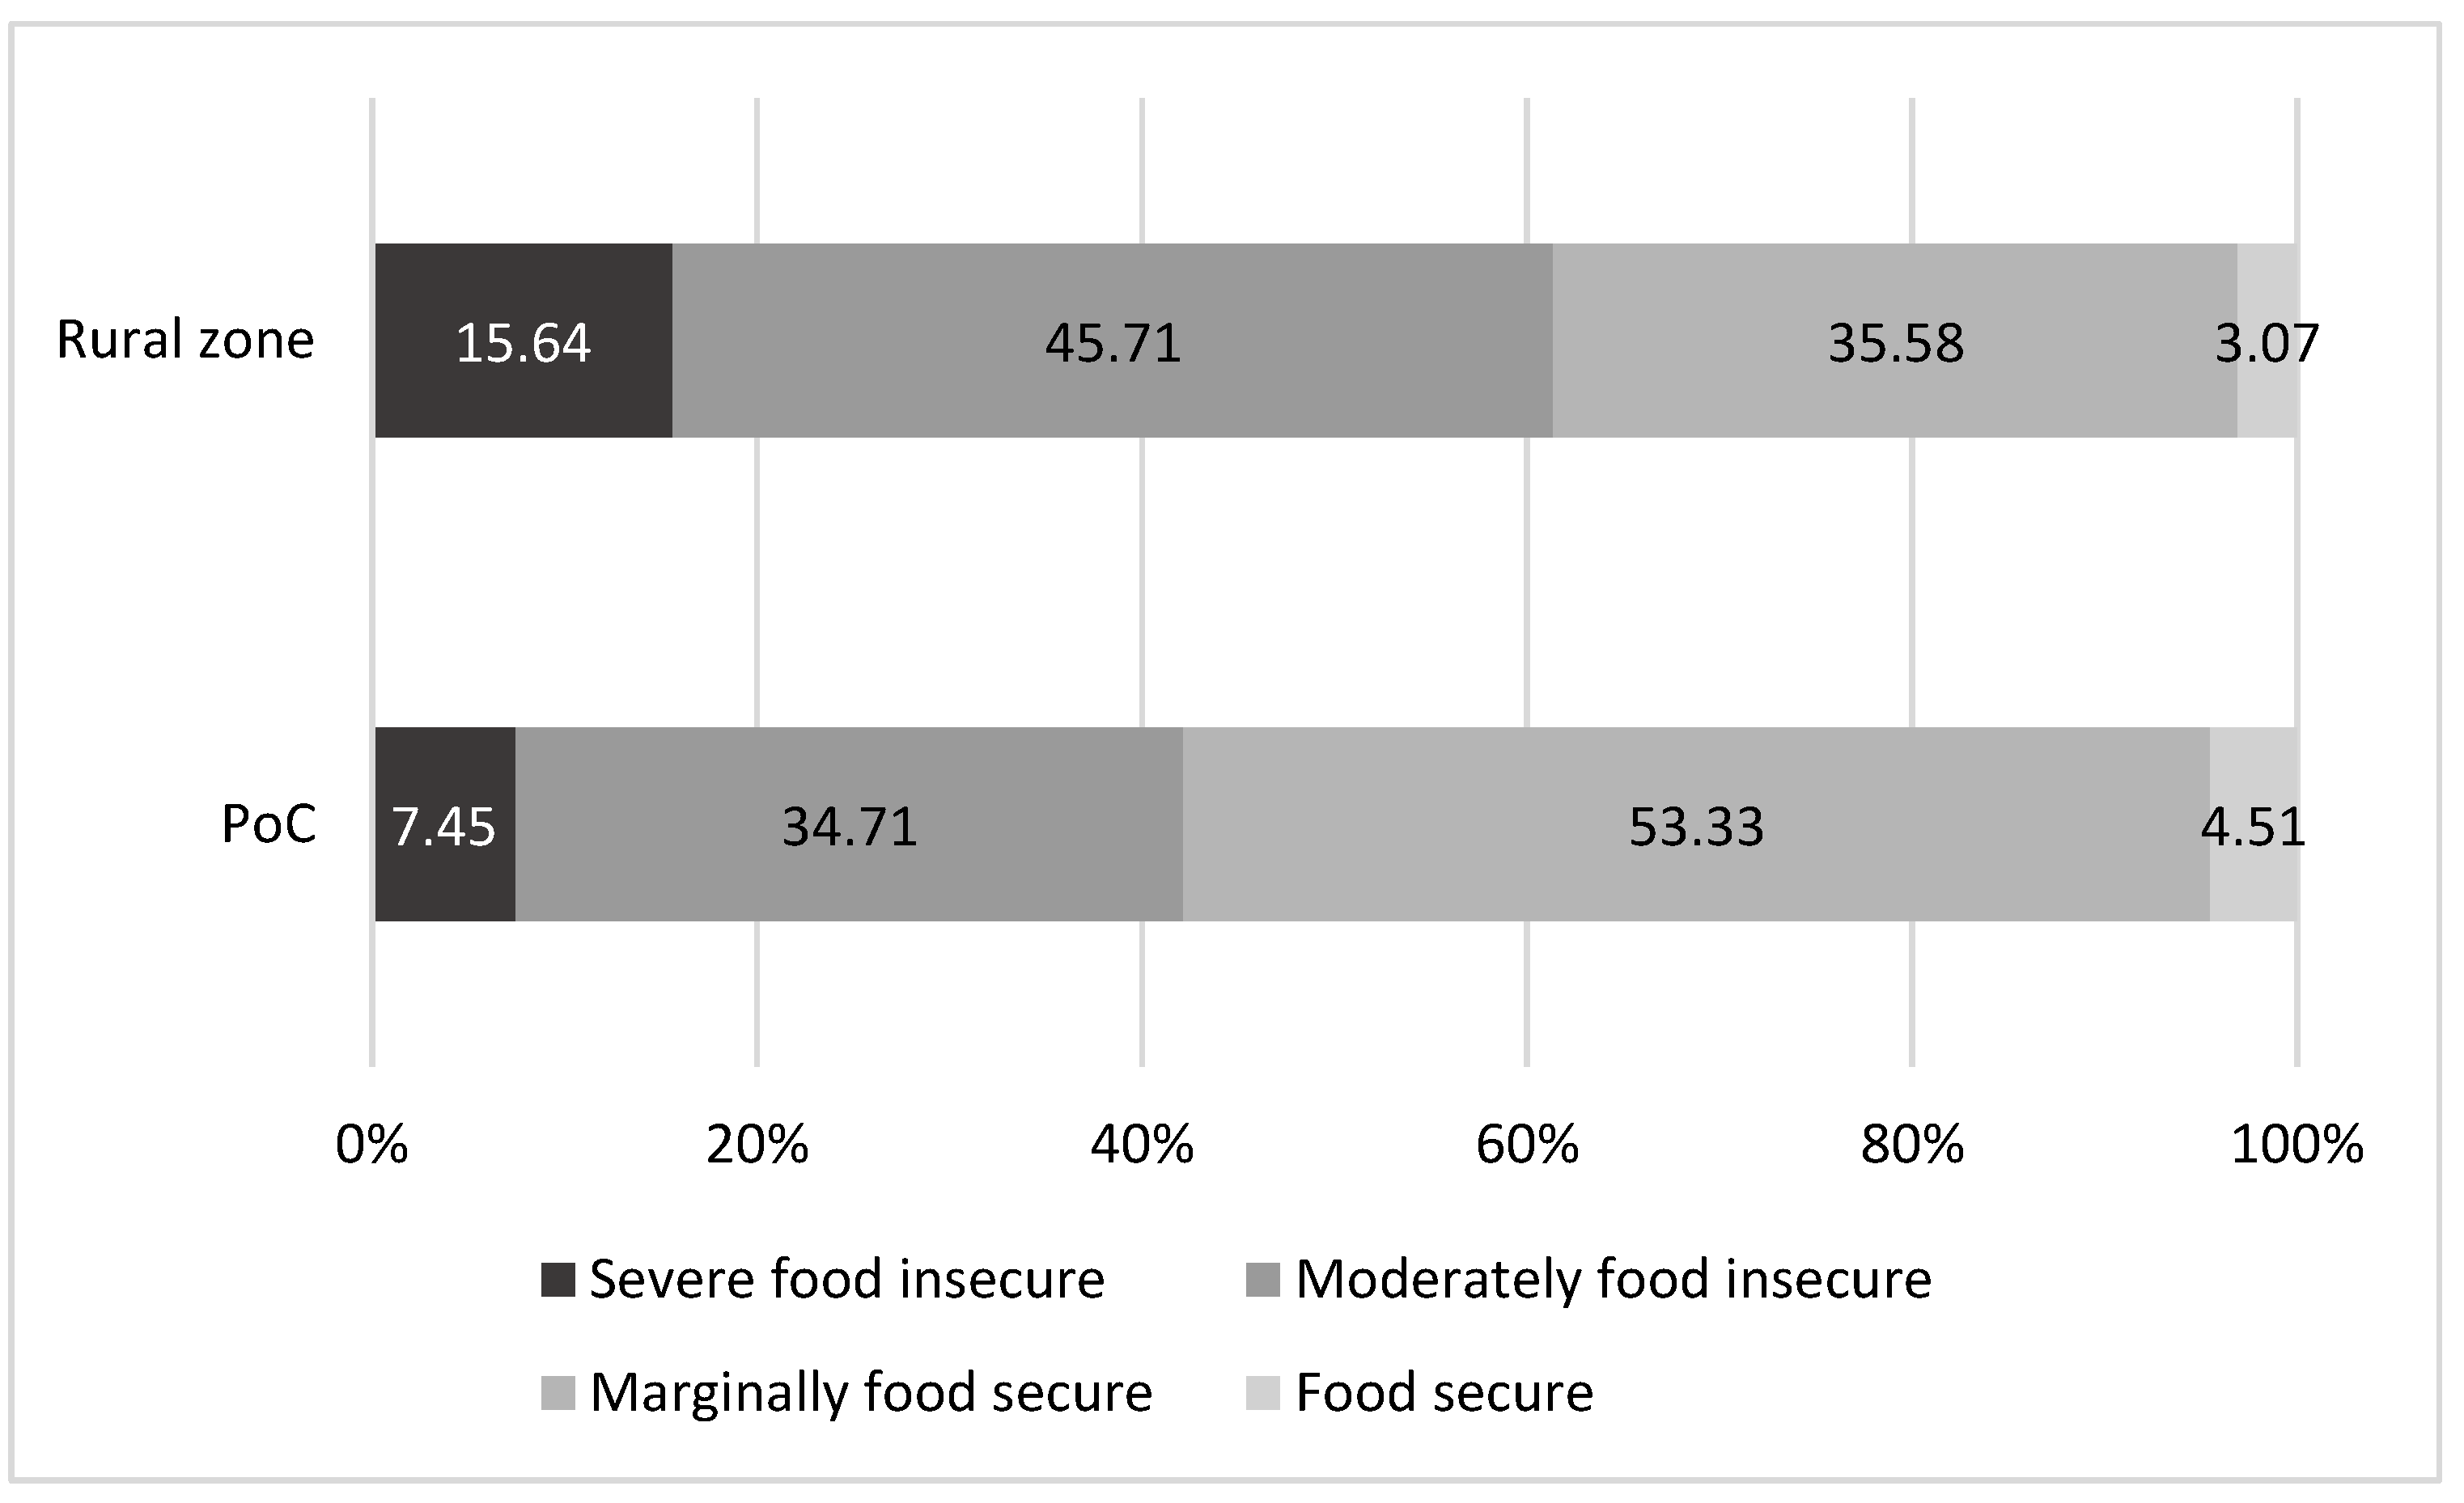
Figure 1 shows that households in the Wau PoC and rural areas face high levels of food insecurity. However, this problem is more accentuated in Bagari, Bazia, and Bisellia, where 61.35% of households are food insecure against 42.16% in the Wau PoC. Moreover, the share of households that are severely food insecure was relatively lower in the PoC (7.45%) than in the rural areas (15.64%).
Table 4 compares the current state of household food insecurity, measured by the FCS, with the household’s future capacity to cope with future food shortages, approximated by the LCSI. We organised the latter into three levels corresponding to the severity of the strategy adopted. We considered households using stress strategies with a mild capacity to cope with forthcoming food deficiencies (Food secure category in
Table 4), those adopting crisis coping mechanisms with a low coping ability (Moderately food insecure category in
Table 4), and those employing emergency coping strategies with a very low coping capacity (Severe food insecure category in
Table 4).
According to the literature, when food insecurity worsens, households employ less reversible coping mechanisms [
30,
31,
32]. However, our paper does not confirm this tendency. In fact, in both the investigated areas, the majority of the households in our sample presented a low or very low capacity to cope with shocks and stresses affecting their food security in the future, irrespective of their current state of food security. Moreover, the situation involves a larger share of households in rural Bagari, Bazia, and Bisellia than those living in the Wau PoC. This result highlights the deep stress and fragility of the households in the study area, which is even more severe in the rural zones. This situation explains the specificity of our results with respect to the literature.
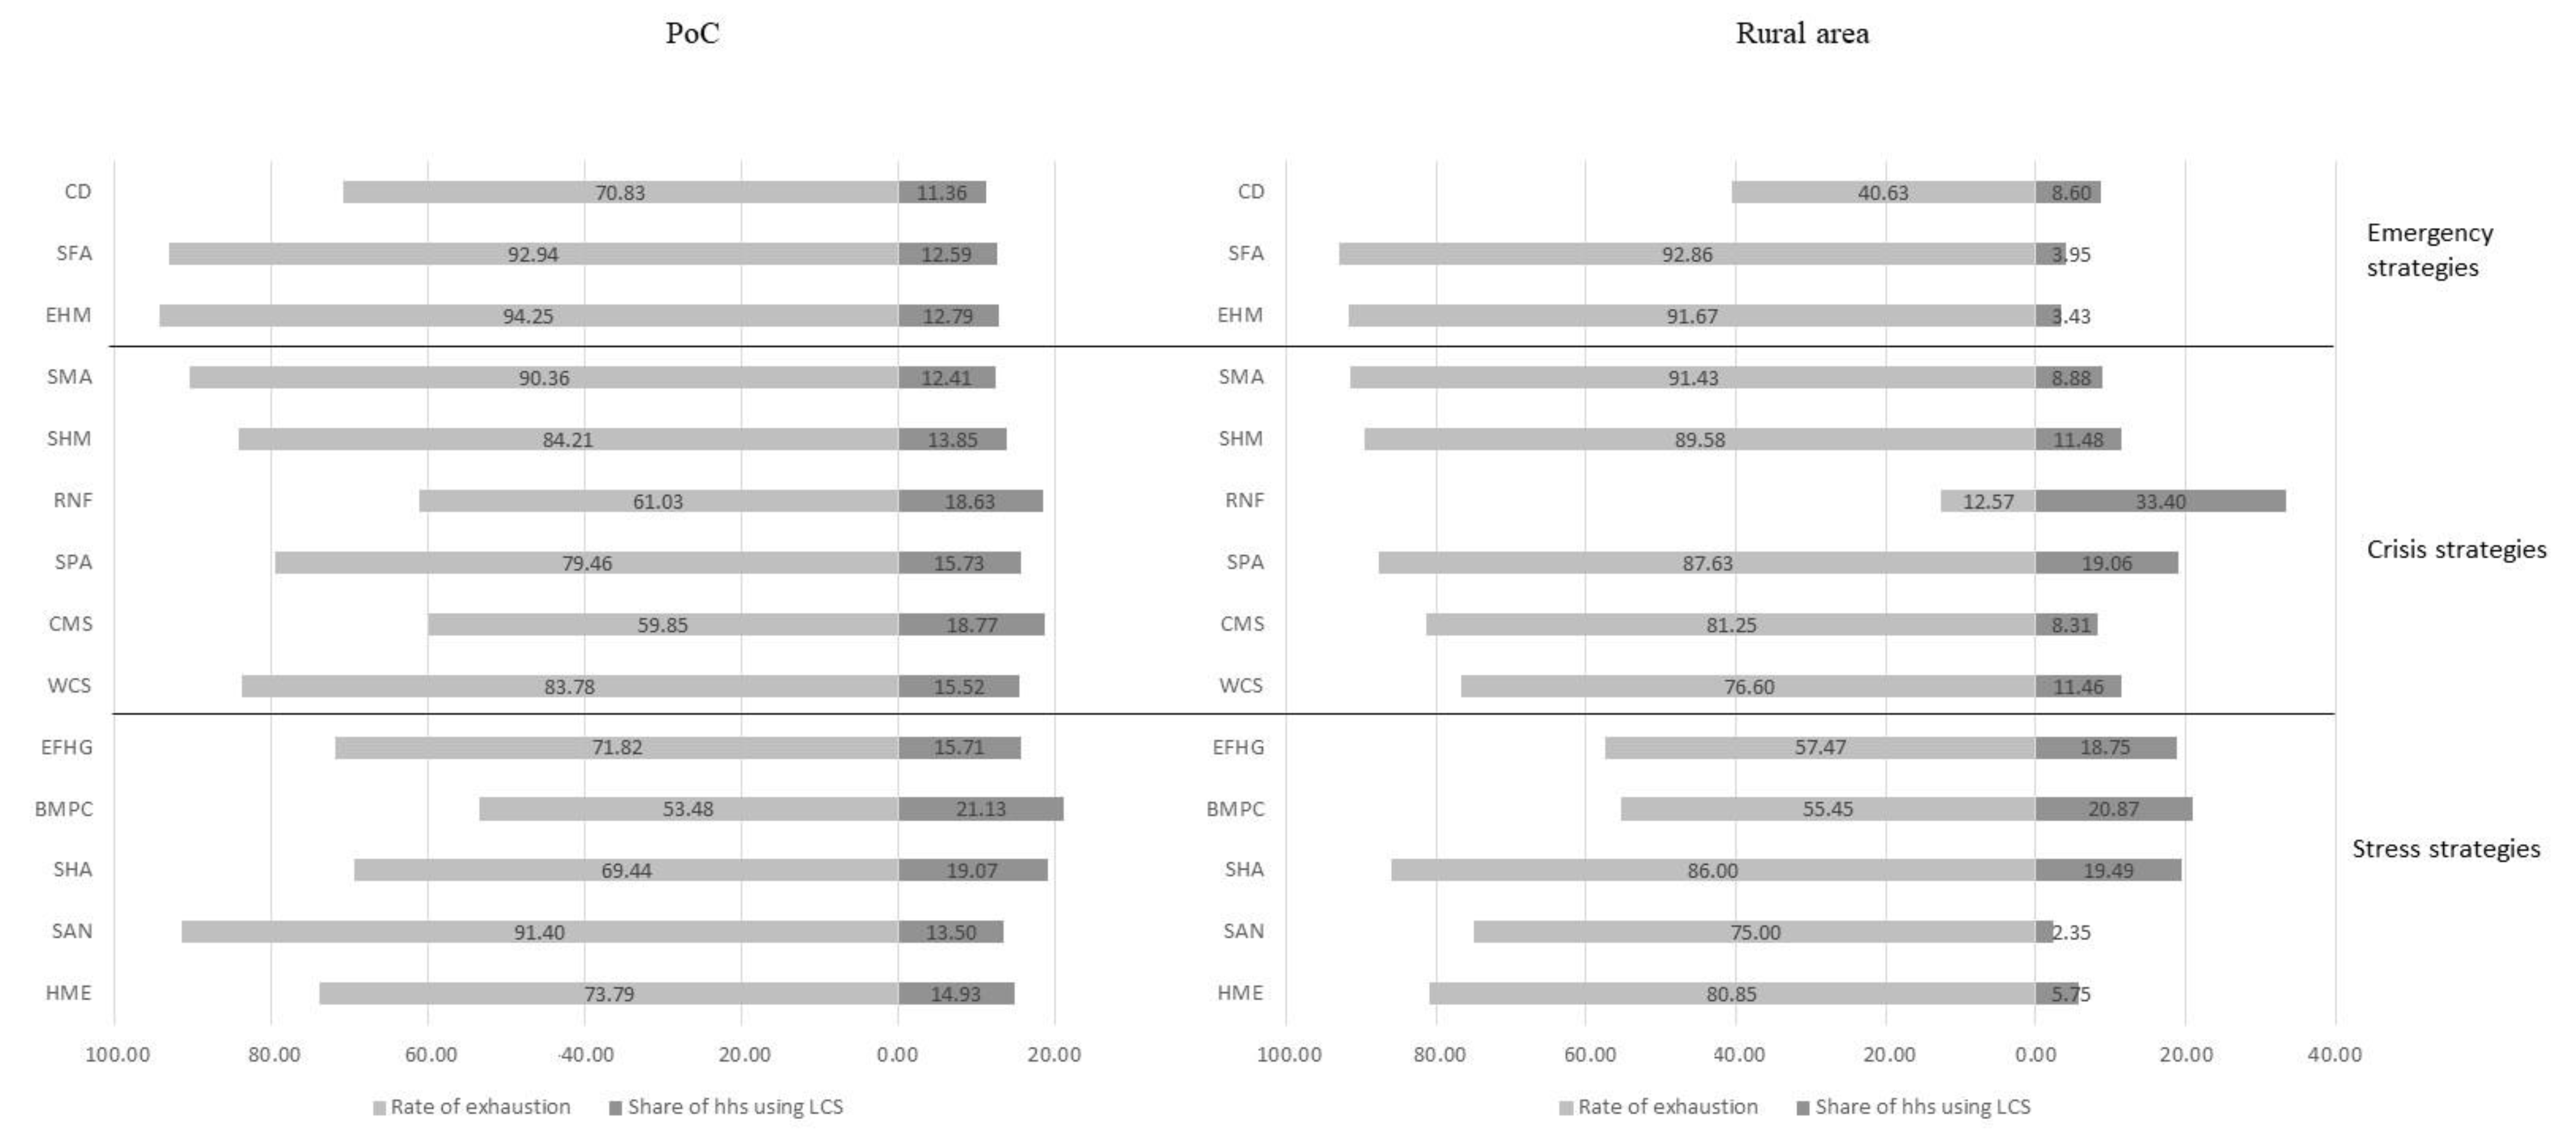
This situation masks an even more dramatic reality if we consider the share of households that cannot continue to use the coping mechanisms because they were already exhausted in the last 12 months (
Figure 2). This share is very high for all strategies and areas, implying that almost all of the households in our sample not only have engaged irreversible coping strategies but they are also at the breakdown of their coping ability. In other words, their absorptive capacity to future shocks is very limited or even exhausted. Moreover, the erosion of the community support mechanisms is a clear signal of a wider social catastrophe in the investigated area due to the severe multiple shocks of long-term duration.
Among the seven most important livelihood-based coping strategies, six are common to households in both areas, including three stress strategies (S) and three crisis strategies (C). They consist of engaging in fishing, hunting, or gathering wild food more than normal (S); selling household assets (S); borrowing money/purchase food on credit (S); withdrawing one or more children from school (C); selling productive assets or means of transport (C); reducing essential non-food expenses (C).
Some of these strategies have long-term negative consequences, not only for household wellbeing, but also for the development of the reference communities. For example, removing children from schools aggravates the country’s already poor social context, characterised by widespread illiteracy and a low level of education [
18]. According to our data, the illiteracy rate is relatively higher in rural areas and is characterised by a strong rural and gender imbalance. We found that 70.03% of the household heads are illiterate in rural Bagari, Bazia, and Bisellia against 53.14% in the Wau PoC. On average, literate women are 30% less than their male counterparts.
Moreover, considering all household members in our sample, almost all the literates have primary school as the highest level of education. Therefore, withdrawing children from school compromises the most important pathway of obtaining literacy in the country, with long-term adverse effects on its development and growth. In addition, further limiting of female access to school compromises women’s effective competition in the labour market, exacerbating poverty at the household and community level.
Another example in the same direction is related to the selling of productive assets. This mechanism negatively affects an already weak household food system, especially in rural areas. A food system that, despite its fragility, has a crucial role. Agriculture is the main activity for the majority of the people, and self-production is the largest food source for households. However, subsistence farming dominates the agricultural sector in South Sudan and the investigated rural areas. It is practised on a land size lower than one feddan on average (one feddan = 0.42 hectares) [
13]. Moreover, it suffers from a lack of improved seeds and fertilisers, storage facilities, irrigation development, and provision of extension services. In this context, selling productive activities increases social and economic inequality with a detrimental effect on wellbeing, social stability, economic growth, and prosperity [
30,
33].
Reducing essential non-food expenses is another coping mechanism that deserves specific attention. The households in the investigated areas spent the majority of their income on food. Therefore, the share of non-food expenditure is very low. It is, on average, 20.11% in Wau PoC and 24.59% in rural areas. Moreover, the diversification of non-food spending is minimal. This spending is concentrated around four major items: soap; milling and grinding; firewood, charcoal, and fuel for cooking; and medical expenses and health care. They are directly or indirectly connected to food utilisation. Therefore, their reduced consumption and especially exhaustion compromises the already weak household’s food security situation, due to limited access to, and availability of, food.
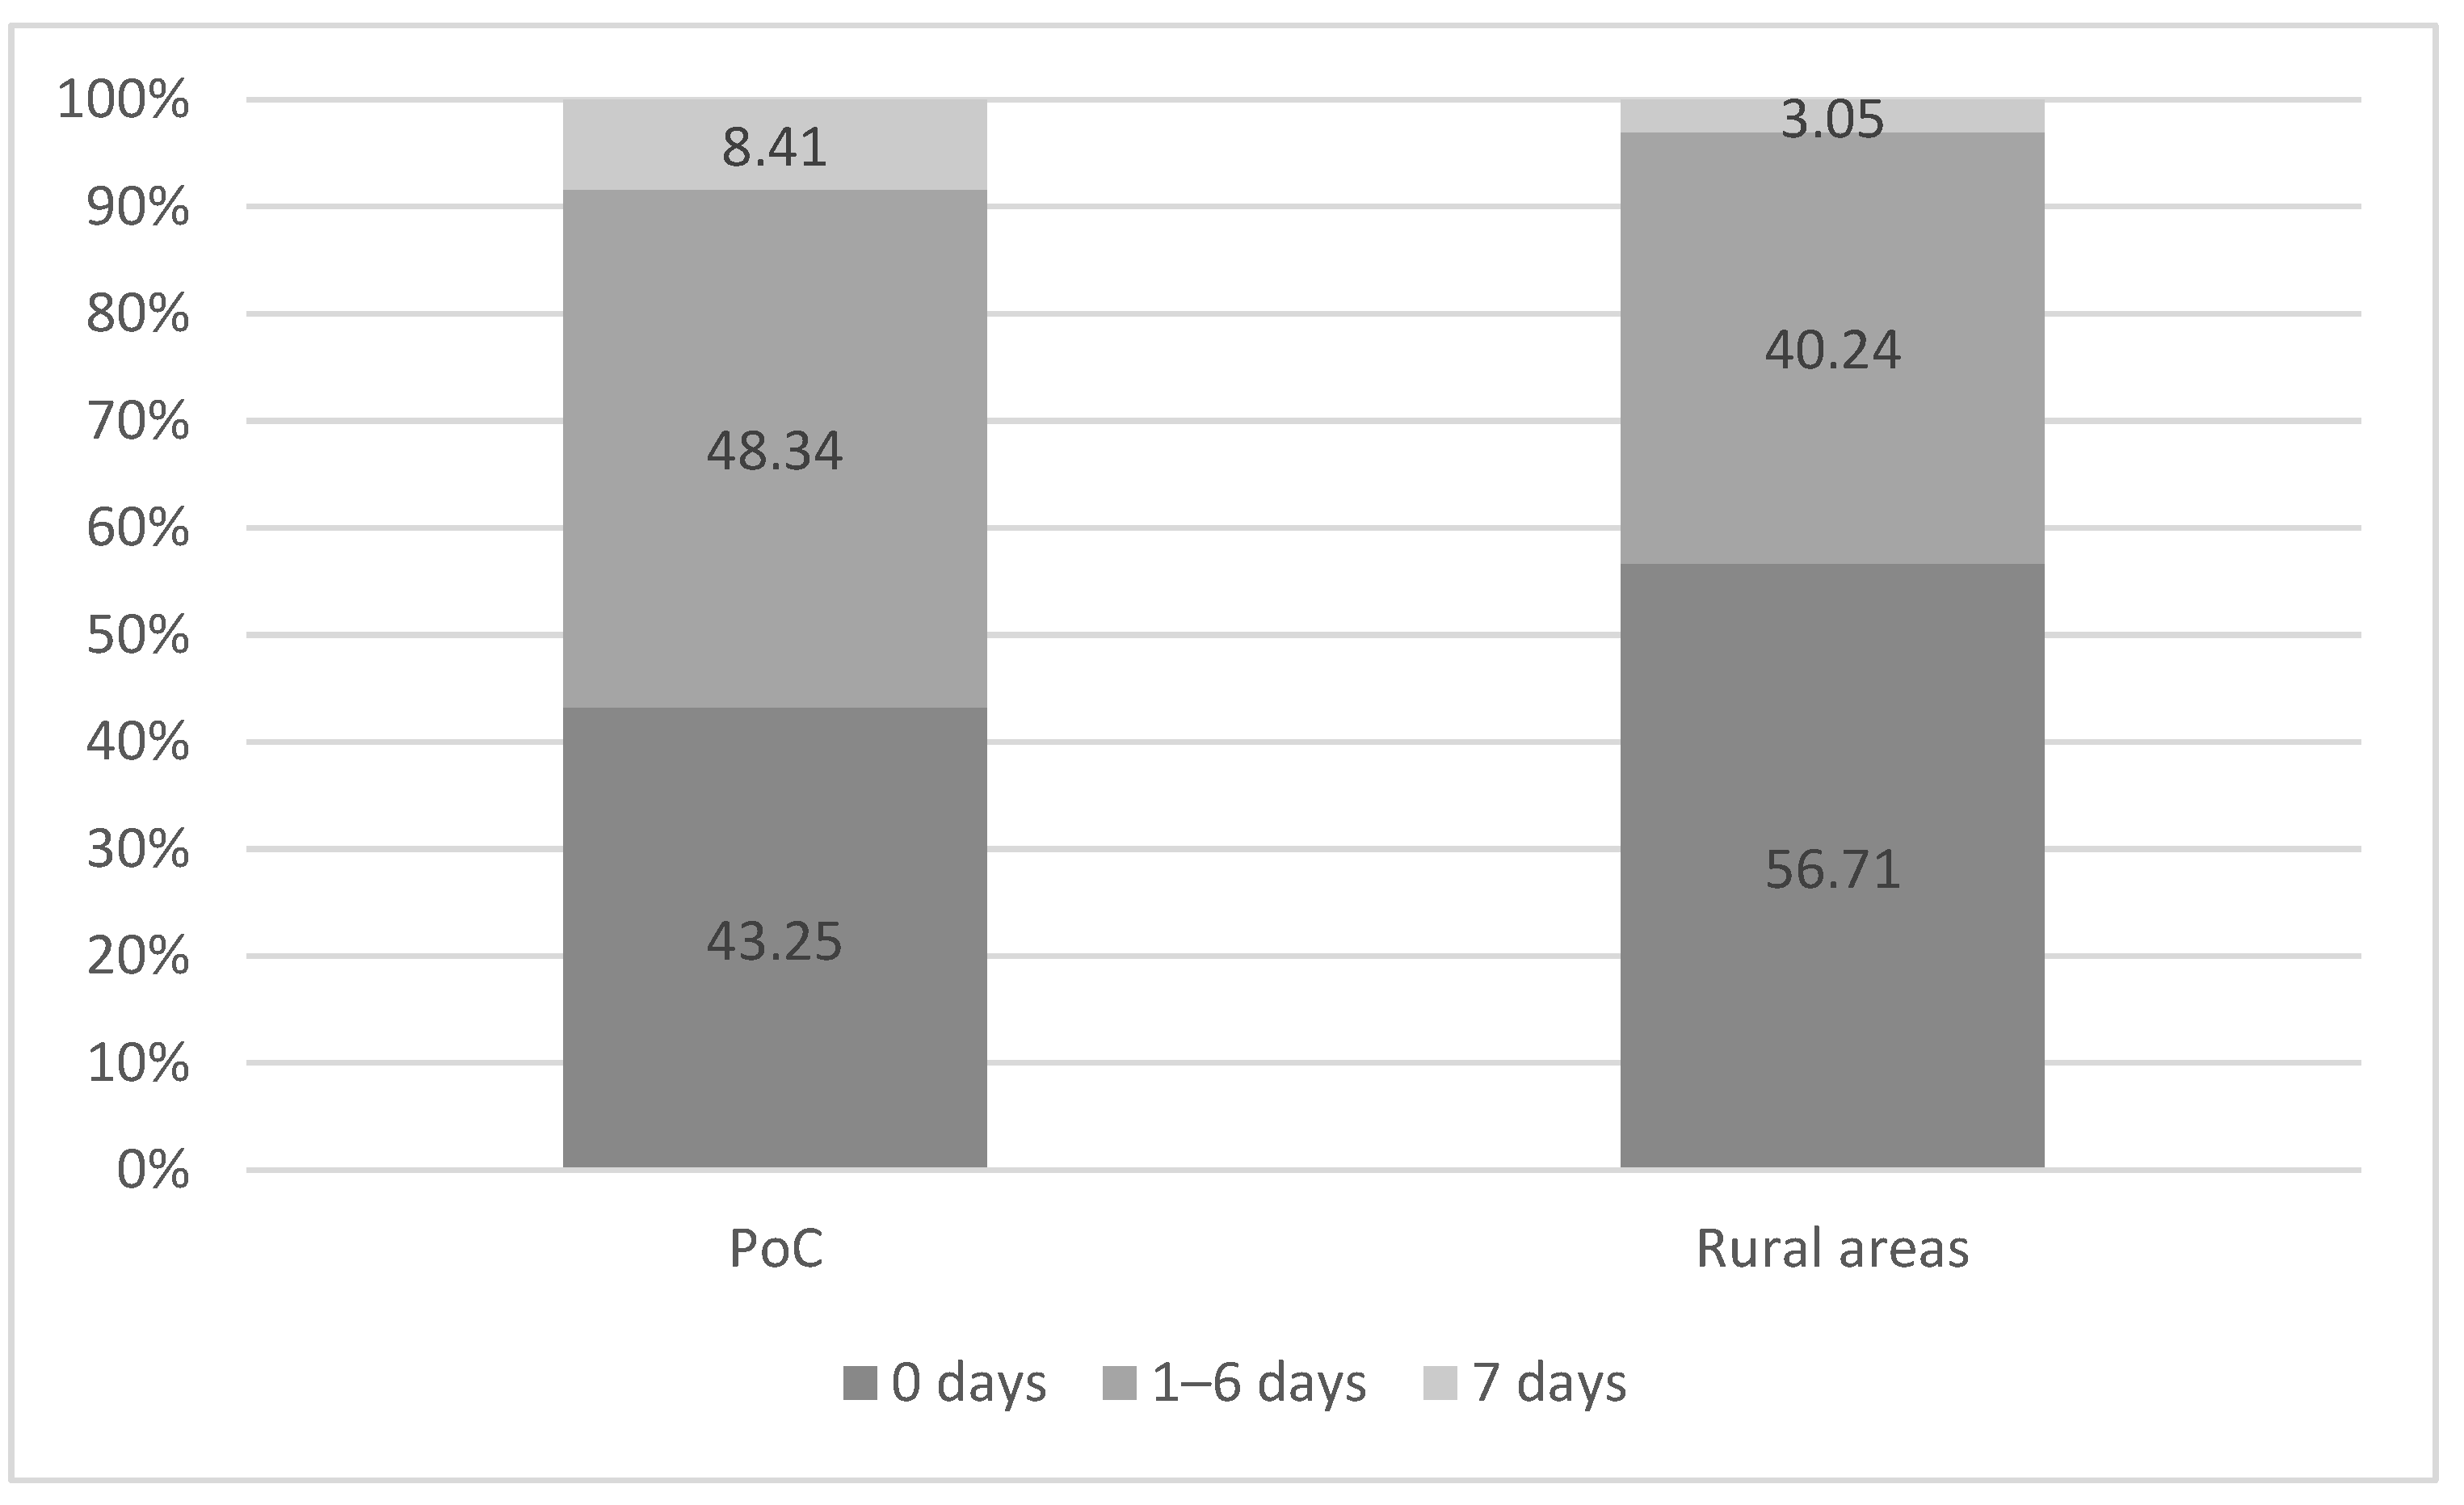
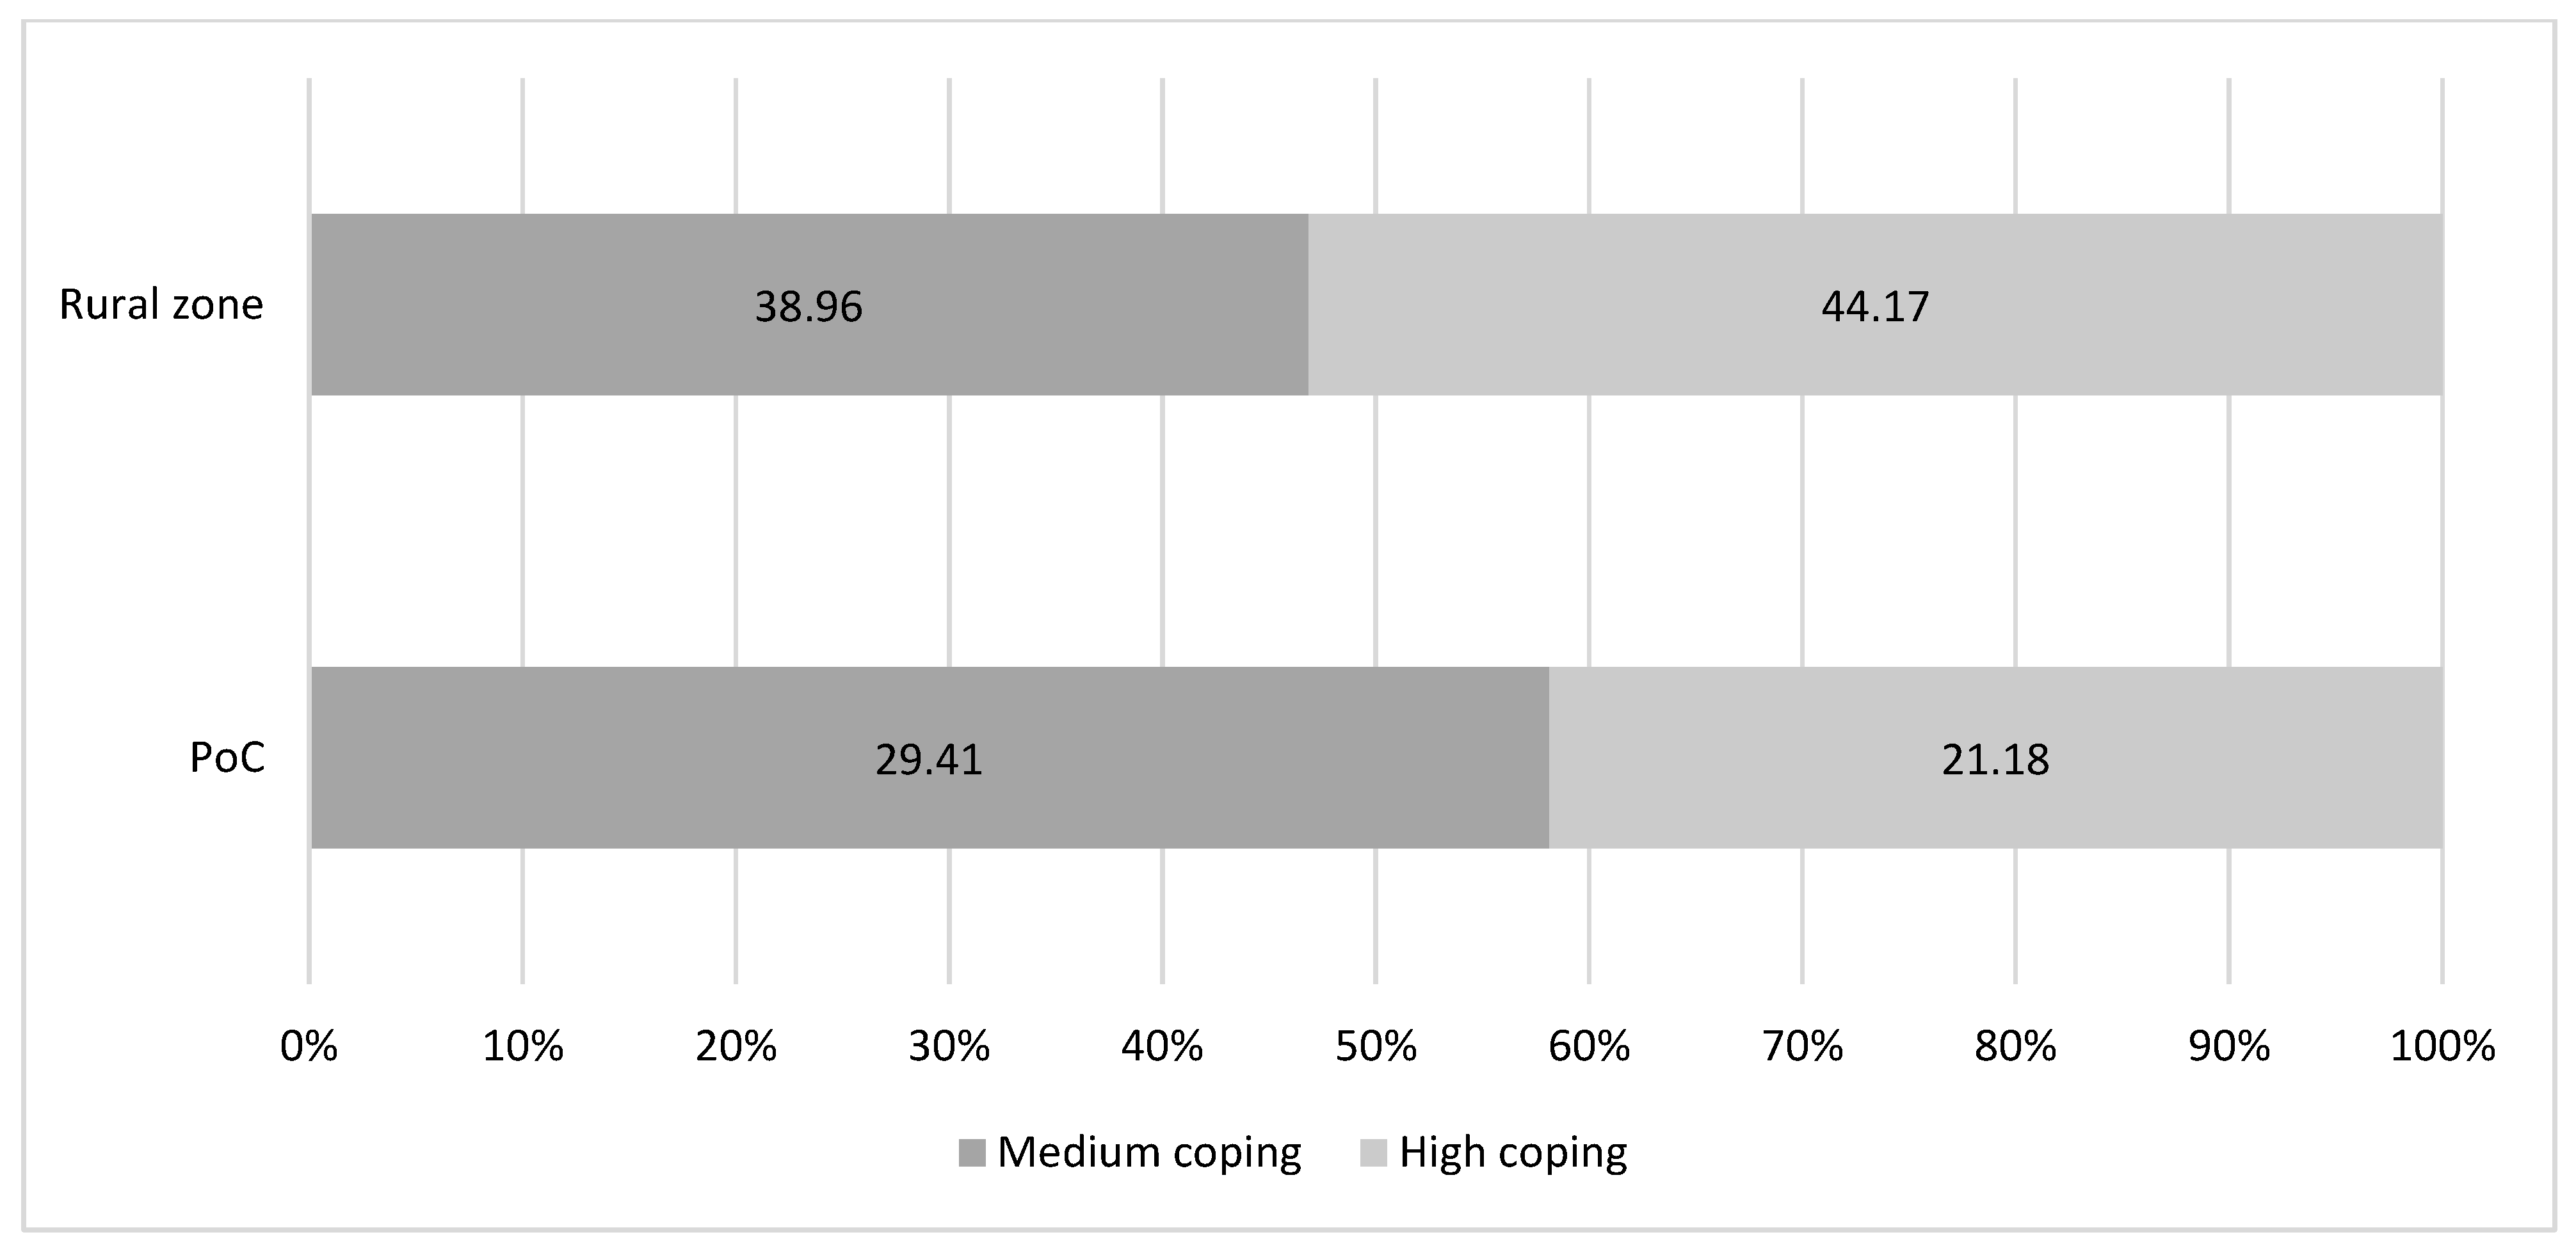
The FCSI confirms the relatively worse situation in the rural Bagari, Bazia, and Bisellia with respect to the Wau PoC. In these rural areas almost half of the households adopt the most severe level of food consumption coping strategies compared to the Wau PoC, where they are only 21.18% (
Figure 3). Moreover, considering the single strategies composing the FCSI,
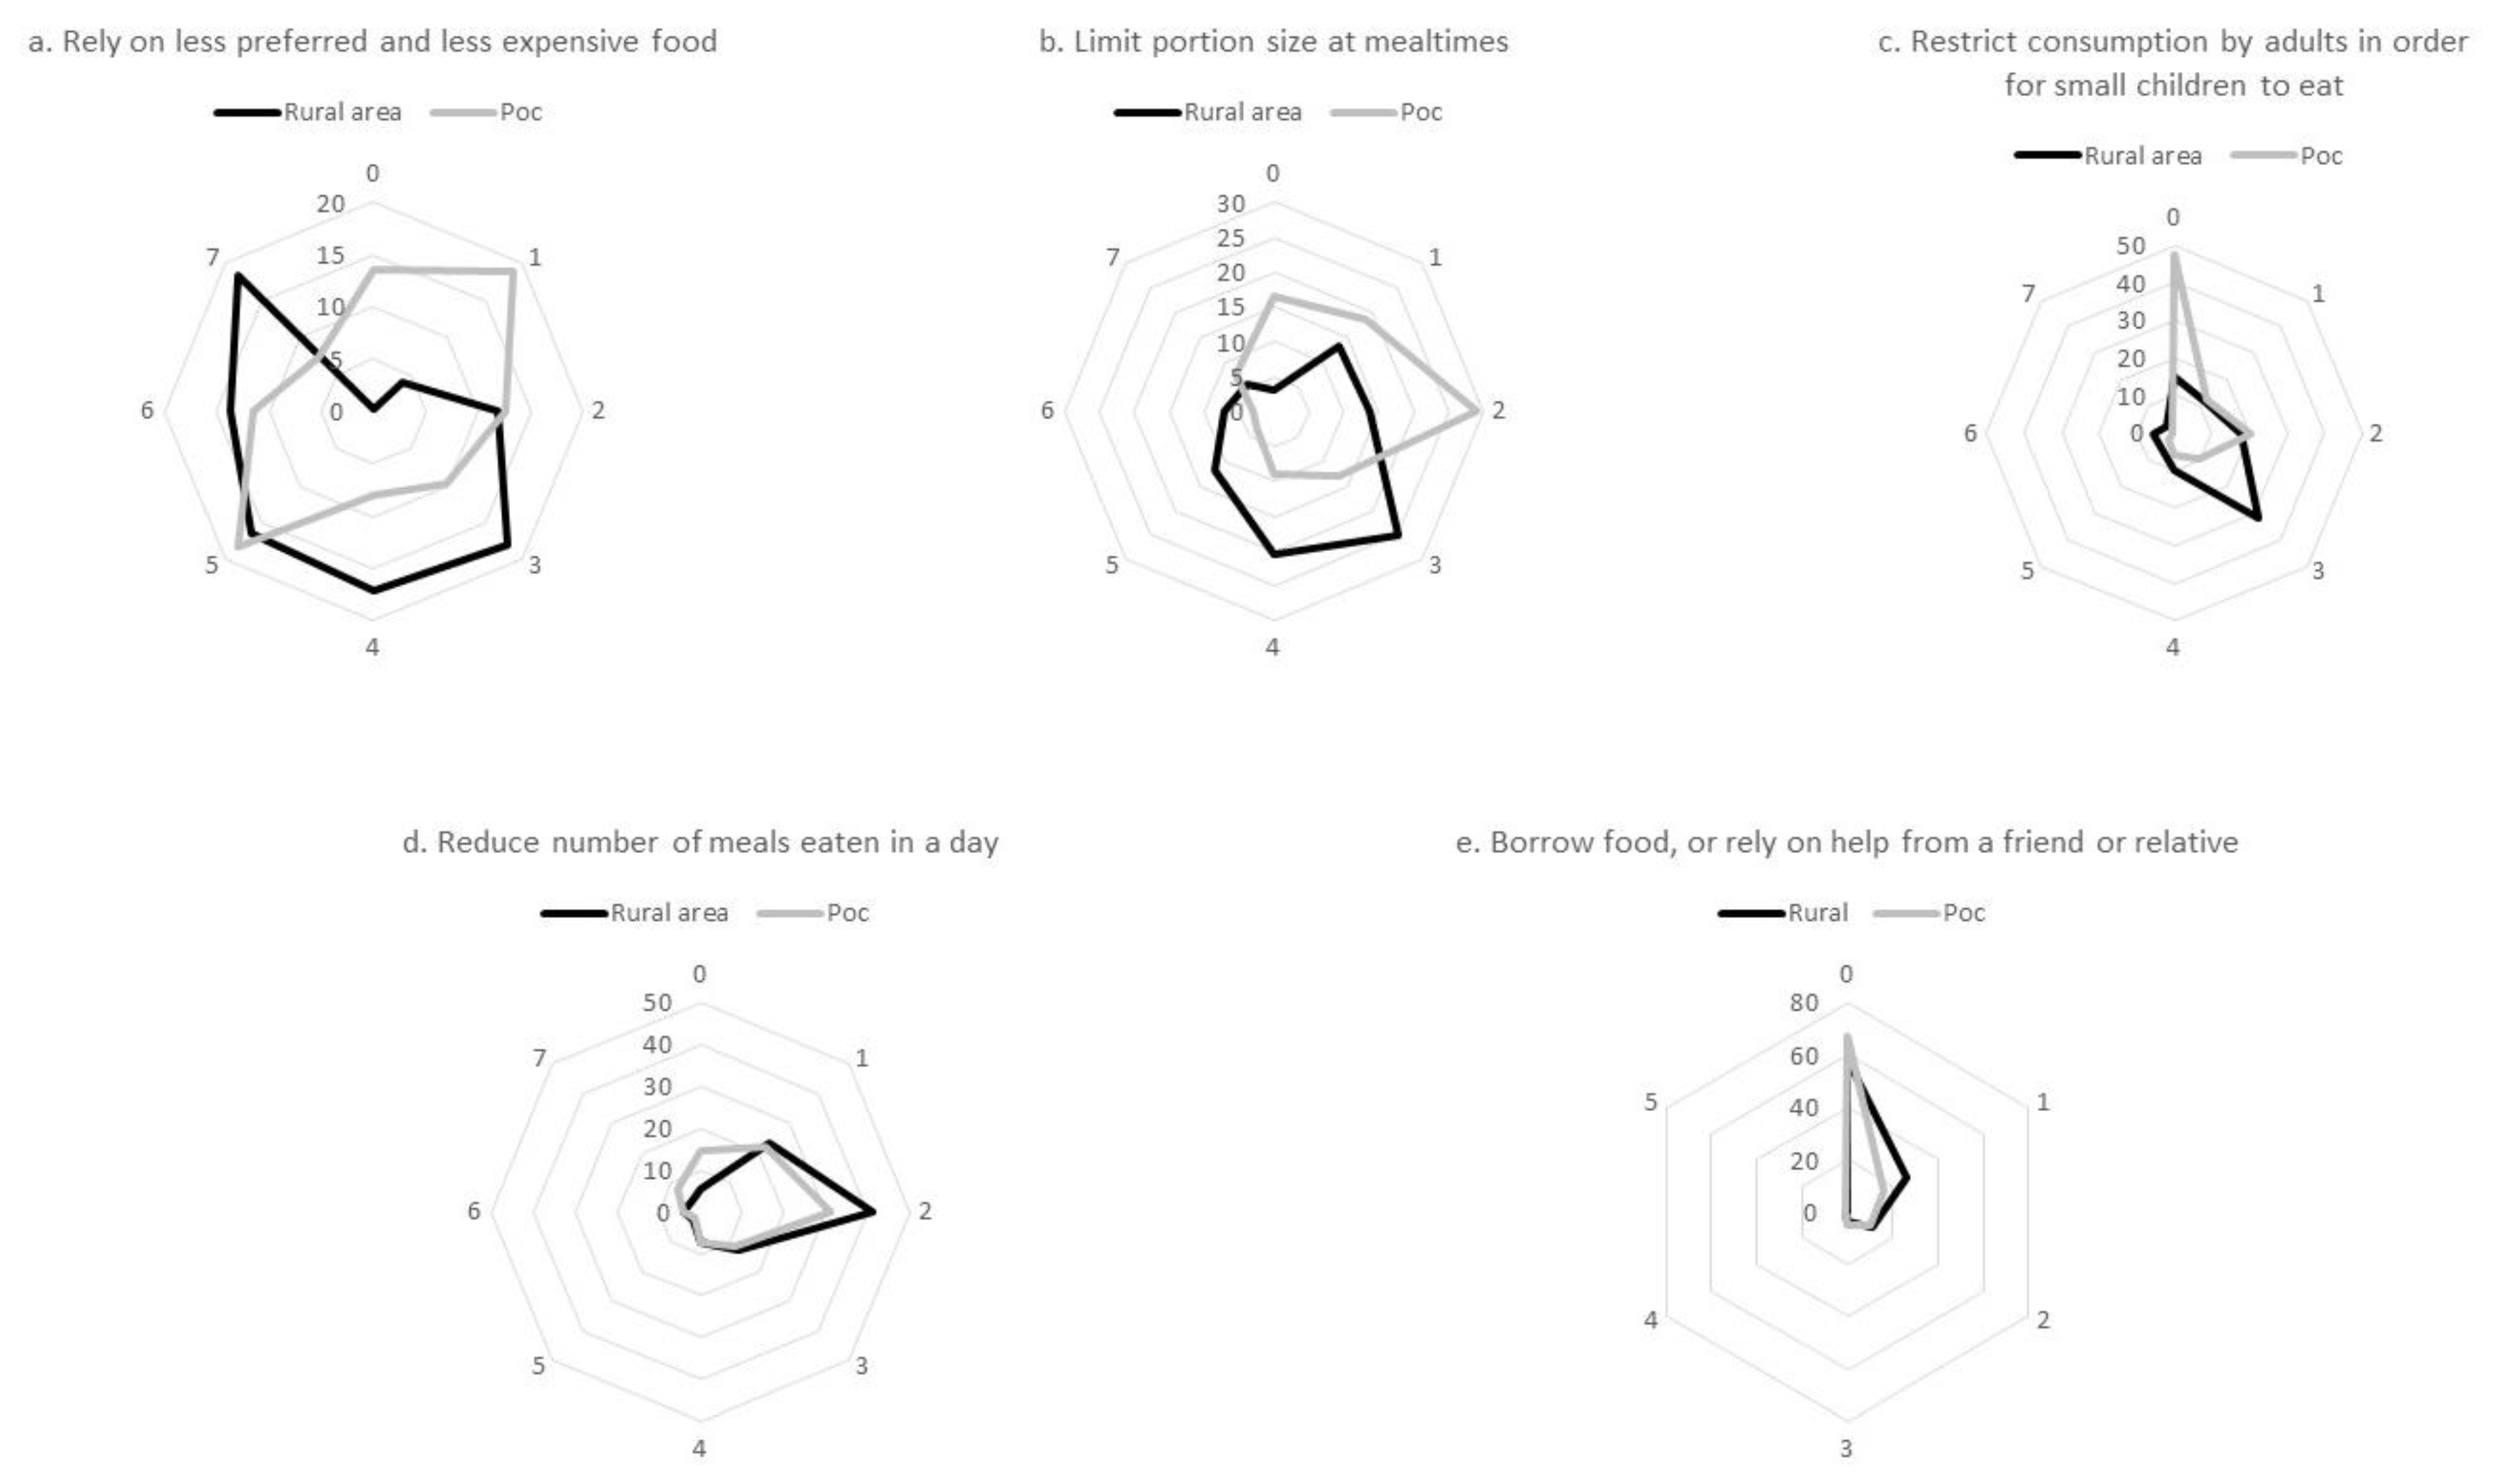
Figure 4 shows that the households in the Wau PoC use these behaviours for relatively fewer days than the households in the rural areas.
Confirming the literature, the category “rely on less preferred and less expensive food” is the most adopted strategy by the households in our sample [
34]. However, this category includes a critical short-term coping strategy, the consumption of green leafy vegetables collected in the open field as a wild crop. In South Sudan, this behaviour is the primary coping mechanism adopted by people affected by conflict. Moreover, it is the only source of food for poor and vulnerable households during the hunger season. Sassi [
35] highlighted that it is consumed for filling the stomach and reducing the sense of hunger. Therefore, this mechanism aggravates a diet that is already far from being nutritious for most households in our sample. For example,
Figure 5 presents the share of households by frequency of consumption of vitamin A reach foods, excluding green leafy vegetables. As suggested by the guidelines of the WFP [
36], we considered the following as vitamin A-rich food items: dairy, organ meat, eggs, orange vegetables, green vegetables, and orange fruits. Our results revealed that around half of the households in our sample do not consume this important micronutrient. The lack of vitamin A in the household diet is one of the causes of death and disease in the country, especially among children [
37].
Comparing the FCSI with the FSI, another significant difference emerges between the investigated areas. The use of medium or high coping is less for households in the Wau PoC than those in rural areas, independent of the food security status (
Table 5).
This situation is due to the importance of food aid in household food security. As illustrated by
Table 6, the share of households receiving food assistance in the PoC is more significant than that in the rural areas, independent of the food security status. We found the opposite situation in Bagari, Bazia, and Bisellia, where 63 to 75% of households are not reached by this form of assistance.
We expected this result. In the analysed rural areas, conflict and insecurity limited the access to humanitarian assistance agencies, accentuating the deterioration of the food security situation of the residents. This consequence is primarily due to the large share of households in a situation of moderate and severe food insecurity. These households cannot survive without humanitarian assistance. It should also be noted that the dominant forms of assistance are for food, health services, and medical provision, while development-oriented emergency aid is negligible. Especially in rural areas, the detrimental consequences of the ongoing conflict and insecurity on household livelihood security, agricultural production, access to markets and macroeconomic conditions make vulnerable people strongly dependent on humanitarian assistance to meet their basic needs. Moreover, according to our evidence, in the Bagari, Bazia, and Bisellia areas, food assistance lasts on average only 18 days and, due to the severity of the context, sharing food assistance among households is frequent. We found that more than two-thirds of the households obtaining assistance share it with one or two other households.
4. Conclusions
Our results highlighted an alarming hunger situation in the rural areas of Bagari, Bazia, Bisellia, and the Wau PoC that reflects a self-reinforcing vicious cycle of food insecurity and conflict, which is long-lasting in South Sudan. We also noted the need for households to rely deeply on short- and long-term coping mechanisms to reduce the risks and shocks they face. However, the severe multiple shocks affecting households and their long-term duration have eroded almost all their possibilities to respond to the complex situation.
We found a society with distressed livelihood, especially in the investigated remote rural areas, confirming the literature that suggests the significant increase in risk and uncertainty in rural war-affected contexts [
38,
39]. The relevant dependence of rural households on short-run coping strategies represents another character of the countries in protracted crisis that found confirmation in the investigated area [
40]. Nevertheless, on the contrary, we observed a slightly better situation in the Wau PoC, although households have almost exhausted their coping capacities. Our paper suggested that one explanation of this better situation is the improved access to assistance, especially food assistance. This aspect should be better investigated in light of the exit strategy from the Wau PoC adopted by the UNMISS. Moreover, the design of tools for integrating knowledge of at-risk communities into this process can guide this transitional phase, decreasing households’ vulnerability.
We noted that humanitarian assistance has a crucial role in saving lives. However, conflict and insecurity in remote rural areas make its access difficult. Therefore, this situation calls for an urgent effort of the international community to address the access issue. At the same time, and most importantly, substantial investment in diplomacy should be deserved to reach a stable peace accepted by the entire country. This peace is a precondition to design and promotes the future development of South Sudan.
Food insecurity is only one of the deprivations affecting households in the investigated areas. Lack of coping strategies can further deteriorate their already poor food security status in this complex situation. For the majority of households, these behaviours are the only possible option for survival. However, we noted that these strategies could have severe adverse effects on their wellbeing and on that of their communities in the longterm, further fuelling the vicious cycle of hunger and conflict.
Securing food is an immense and highly complex challenge in Western Bahr el Ghazal. Sassi [
12] has argued that it requires an urgent adoption of interventions based on the humanitarian-development-peace nexus. In this respect, our paper highlighted the importance of supporting livelihood strategies and opportunities of people, prioritising the reinforcement of all the forms of capital owned by households (human, natural, physical, and financial) and the promotion of sound and inclusive institutions.
However, our study only describes the household coping capacity in Western Bahr el Ghazal from July to August 2020. In other words, it does not include information on the possible seasonal changes typical of these contexts. Therefore, further investigations should be developed to understand possible changes over months. These analyses could highlight possible seasonal effects characteristic of the context investigated, especially in rural areas where household livelihood strongly depends on a refined and subsistence agricultural sector. Moreover, a longitudinal study could inform about the cause-and-effect relationship important for the policymaking process.


