1. Introduction
The transport sector is responsible for 24% of the total CO
2 emission globally, while road transportation has the largest share and accountable for 75% of the emission from transport. The major contributors are passenger and cargo vehicles, with a share of 45.1% and 29.4% [
1]. Fossil oil is the primary energy source by providing nearly 92% of the energy demand for transportation. However, rising CO
2 emissions and unstable oil prices have paved the way for alternative technologies such as electric vehicles (EV). Using alternative green energy, the electrification of transport could provide a sustainable solution to address the greenhouse-gas-emission reduction objectives. The EVs provide zero-emission and a high energy conversion efficiency in contrast to traditional combustion engines. However, the rapid high integration of the EVs could pose a severe bottleneck for the existing electric distribution systems as the EV charging infrastructure is still inadequate. At the same time, the overnight home charging of EVs can challenge the network capacity. The EV battery chargers are power electronic-based converters and draw nonlinear currents, thus inject current harmonics into the power supply system. Even with the improved circuits and power factor corrections, the harmonic content after the mass adoption of EVs would be much higher because of the high EV charging current compared to the other domestic or commercial load.
The uptake of EVs has been increased significantly during the last few years, and more than seven million electric vehicles are now in use worldwide [
2]. The ambitious policies set by several countries to support the electrification of the transport sector expected to increase EV deployment in coming years. These policies include incentives to decrease the high upfront cost and the development of widespread charging infrastructure. As a result, the growth in EV stock was nearly 40% in 2019; however, the total global EV stock is still only less than 1% of all the passenger cars in use. The share of EV in total yearly car sales is about 2.6%. Due to the favourable government policies in different countries, the EV uptake is expected to increase to 50 million active units by 2025 and 140 million by the end of 2030.
Private home chargers are nearly 90% of the total low duty electric vehicle chargers installed worldwide [
3]. The primary reason for their popularity is the cost-effectiveness and ease of use associated with home chargers. Furthermore, incentives and electricity prices also support home charging. The majority of the EV customers in large EV markets, such as Norway, United Kingdom (UK), United States (US), Japan and China, prefer home charging. It requires no additional infrastructure, and EVs can be charged from the existing electrical sockets. The public charging infrastructure is still not adequate, while only 4% of fast EV chargers are installed worldwide by the end of 2019. The ratio of the number of public chargers to the total number of EVs also shows a slight decline in recent years [
4,
5].
It is critical to evaluate the ramifications of uncontrolled EV charging on the distribution network. High penetration of EV could affect the capacity and performance of the local power supply network. The constraints on the network can be addressed by adding additional capacity or improve the utilisation of installed capacity. The high EV load may challenge the network’s reliability by overloading distribution lines and substation during peak hours [
6,
7]. Even with abundant electricity generation within the region, the impact of EV charging may bottleneck the transmission and distribution system as it may not have enough capacity to handle this additional charging load. The variability of traditional residential load provides flexibility to the grid. The residential building’s load factor is around 20%, while the aggregated load factor of several houses at the distribution transformer may be approximately 30%. However, EV charging could follow relatively consistent patterns as customers would like to charge their vehicle after home arrival. Range anxiety can also contribute here, and the drivers will prefer to charge their EVs overnight for the next day trip even when the battery has sufficient charge [
8,
9,
10].
Large-scale EV charging can impact the distribution networks in terms of high harmonic distortions, voltage regulation, and transformer overloading. EV batteries require DC for charging; therefore, power electronic converters are employed for AC to DC conversion and charging control. These converters present nonlinear load to the distribution grid as they draw non-sinusoidal currents with high-frequency harmonics. The harmonic emission of an EV charger depends on the circuit topology of the converter. Although the modern battery chargers provide low total current harmonic distortion (THDi) with harmonic content under the limits defined by the relevant standards, the high penetration of EV may result in large aggregated harmonic currents. It may result in high voltage distortion that can affect the performance and harmonic emission of the other loads connected to the network. The voltage and current distortions negatively impact the power grid by introducing additional losses in the transmission and distribution cables [
11]. The performance of network components such as transformers will reduce [
12]. Electrical appliances and network protection equipment such as relays could malfunction under the influence of harmonics [
13]. Therefore, to understand the impact of additional EV charging load on the network, the assessment of harmonic emission is vital for network designers and operators.
This paper provides an assessment of EV harmonic emission in the distribution network based on a stochastic EV usage model. The EV usage model generates the state of charge (SOC) and load profiles for the given number of EVs. Monte Carlo approach is used to estimate the harmonic emission of the EV load and harmonic emission. The impact of EV charging load on the distribution transformer is also estimated for uncontrolled and controlled charging scenarios.
Section 2 provides an overview of the existing literature related to EV harmonic emission estimations. The methodology used in this paper is explained in
Section 3. EV usage model is described in
Section 4 and EV current harmonic emission estimations are provided in
Section 5. The conclusions are presented in
Section 6.
2. Impact of EV on Harmonic Emission
The impact of EV on the capacity and performance of power system has been widely discussed in the literature. It was found that EV charging load will likely match the peak demand hours in the residential grids [
14]. Many countries have sufficient generation capacity to handle additional battery charging load for high EV penetration [
15]. However, the capacity of transmission and distribution is insufficient, especially during peak demand hours. Load flow analysis is performed to determine the effect of PHEV charging on the power system losses in [
16]. It has been found that for a 30% penetration of PHEV, the network capacity become insufficient to support the additional charging load. The distribution lines also need replacement to support the additional charging load while the voltage deviations are increased up to 10%. In [
17], the framework is presented for an intelligent distribution system capable of handling EV charging that can determine the charging schedule and grid operating conditions for the next day. However, the number of EVs required to charge at any particular time is a stochastic process and must be treated accordingly to formulate the EV load. A comparison of uncontrolled, off-peak and smart charging of EV is presented in [
18]. A 20% EV penetration increases the peak load by almost 35% for unmanaged charging scenario, while smart charging provides a better grid utilisation. The authors emphasise that a sufficient generation capacity is not a valid parameter to assess the capability of the regional grid to handling EV load.
In [
19], a charging strategy is proposed to optimise the grid capacity utilisation in the residential grid. The authors have assumed Poisson distribution to estimate the number of vehicles that arrive in the evening for charging at residential parking lots. The normal distribution is used to estimate the state of charge (SOC) of the incoming vehicles. A charging strategy is proposed by evaluating the number of incoming vehicles and their SOC level and assigning an appropriate charging schedule to avoid evening peaks. However, the estimation of incoming vehicles and SOC is somewhat complex and depends on several factors influenced by the travel patterns. Queuing theory is used to model the charging demand of PHEV in [
20]. A random number of PHEV are selected to charge on commercial fast-charging stations or in the residential grid during each iteration. The probability distribution functions are selected based on the data for the charging demand, and power flow analysis is used to analyse the impact of PHEV charging on the distribution grid. The study implies the effect of charging current on the distribution grid; however, high-frequency harmonics are not considered. The impact of EV charging on the residential distribution network is studied in [
21]. The authors have modelled the EV load by selecting a constant SOC and fixed charging time to simulate the worst-case scenarios. The impact of current harmonics injected during EV battery charging on the distribution system is estimated in [
22]. Although the current harmonics ranges are not estimated at different times during the day, the study provides a relatively simple tool to evaluate the impact of harmonics on transformer ageing.
The aforementioned studies provide valuable insight into EV penetration on LV and MV grids; although, several simplifications were found while modelling the EV load and SOC. The EV demand in the residential grid depends on several factors, including state of charge (SOC) of EV, owner’s decision to charge his vehicle and the time required for charging. These events are stochastic in nature and are influenced by the driver’s travel patterns or electricity tariff structure. National surveys are used to gather information regarding drivers travel pattern and preferences could provide the foundation of the stochastic modelling of EV load [
23].
In [
24,
25,
26], EV charging strategies are proposed to improve voltage unbalance, network overloading and cost reductions. The controlled and smart charging can improve the network operation significantly without having an additional impact. However, the practical implementation of these strategies is not expected anytime sooner, and uncoordinated charging may be the only mechanism for the time being.
3. Methodology
The travel patterns are the primary influencing factors to estimate the EV load and charging time in a distribution grid. Vehicle usage depends on several factors related to consumer socioeconomic status, where the driving patterns are interrelated to the vehicle ownership and number of occupants in each household. Many studies have assumed the random number of vehicles charging at different parking lots in the residential networks. In fact, the number of EVs present in a residential grid and connected to the grid for battery charging will be different at distinct times during the day. Several variables will contribute to the amount of EV load connected to the grid, such as EV arrival time at home, the number of the trip made during a day, distance travelled during each trip and SOC after the trips.
The selection criteria to estimate the arrival time for the incoming vehicles for charging is crucial to evaluate a realistic impact of charging currents in the distribution grid. Few studies have used queuing theory approach to determine the incoming vehicle for charging at the parking lots in the residential grid, while the Poisson distributions are used to estimate the arrival time [
20,
27]. Since the nature of various trip by EVs could be different, multiple distributions should be defined to estimate the arrival time of the EVs. Furthermore, the charging decision of EVs depends on the SOC that must be decided based on the distance travelled and energy consumption by the EV during different trips. The daily driving distance of vehicles depends on the driver’s routine activities that create the demand for the trips. Therefore, the destination and travel distance are highly stochastic, and the researchers most often use the average trip distance to create EV usage models [
28,
29,
30]. Travel surveys could provide valuable information in this regard.
The harmonic emission of EVs depends on the charging characteristics that typically include the battery charger circuit topology, network voltage waveforms, and charging time of the battery. The measurement of a selective set of EVs on different voltage waveform may provide a valuable data set because of the identical technology used in the battery chargers in the same time span.
4. EV Usage Model
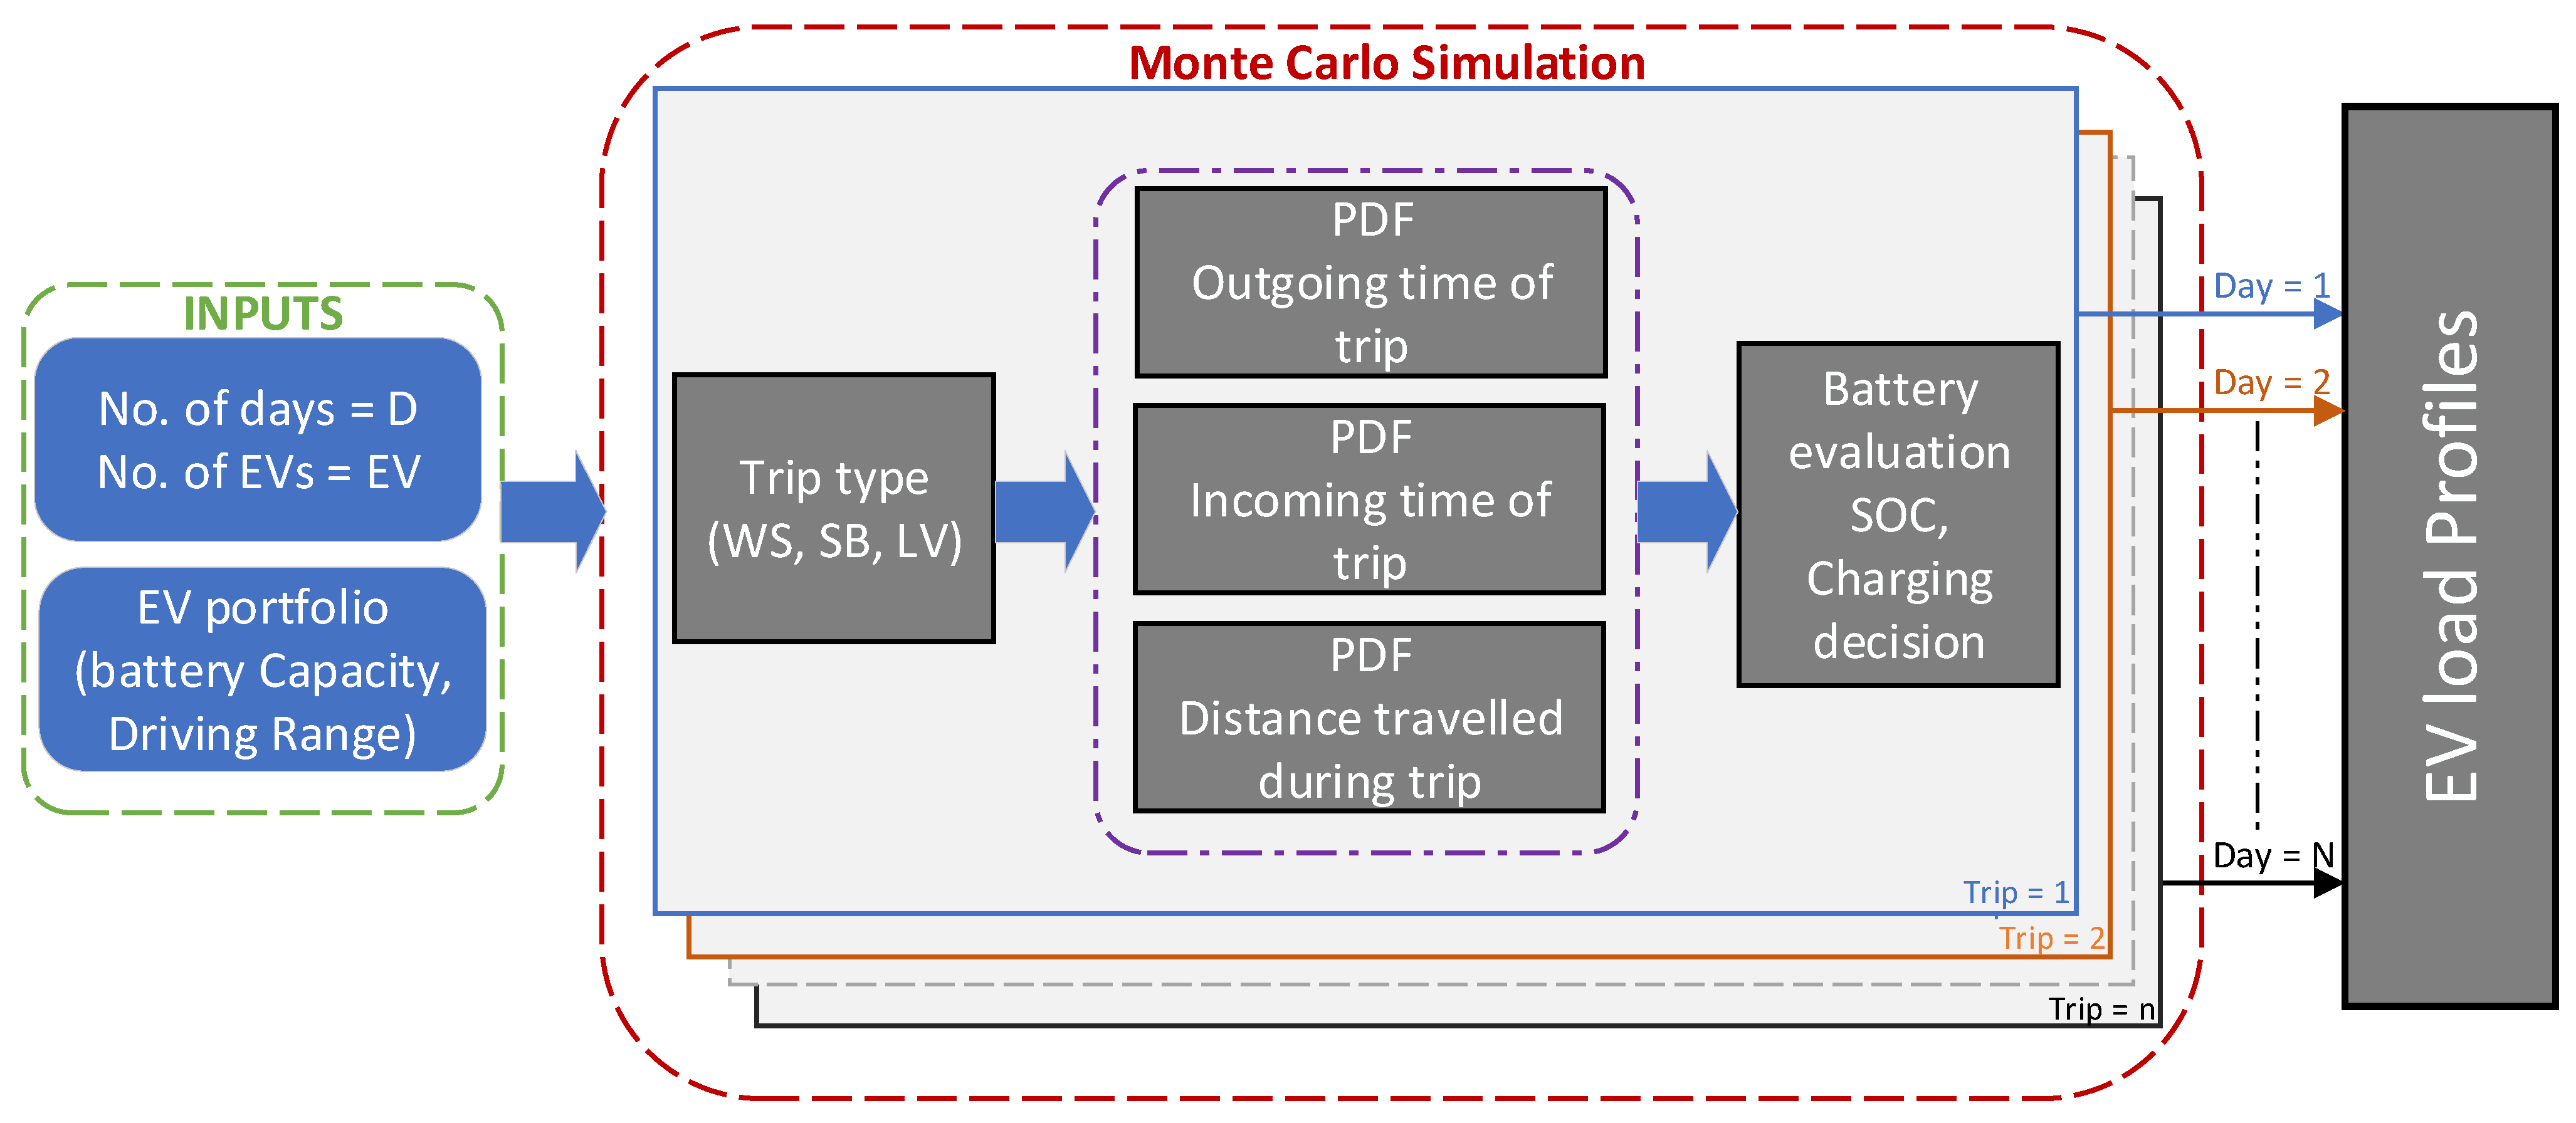
An EV usage model is developed to estimate the harmonic emission from EV penetration in the distribution grid. The model is based on the data extracted from the national traffic survey (NTS) conducted in Finland. The survey provides data about people mobility using different modes of transportation. It gathers yearly travel data from 30,000 people and provides various travel related statistics. The information related to travel utilising private cars, such as daily distance travelled by individuals, total daily trips, everyday activities that generate the need for trips, and trip starting times, are used in the model. The trip of chain approach is employed to evaluate different parameters of each trip using appropriate probability distributions. A Monte-Carlo simulation is used to simulate the EV trips based on the most common activities responsible to generate trip demand for a given number of days. The charging of EV is decided on the SOC level at the end of each trip. The algorithm of the EV usage model is shown in
Figure 1. The details of the EV usage model are presented in [
31].
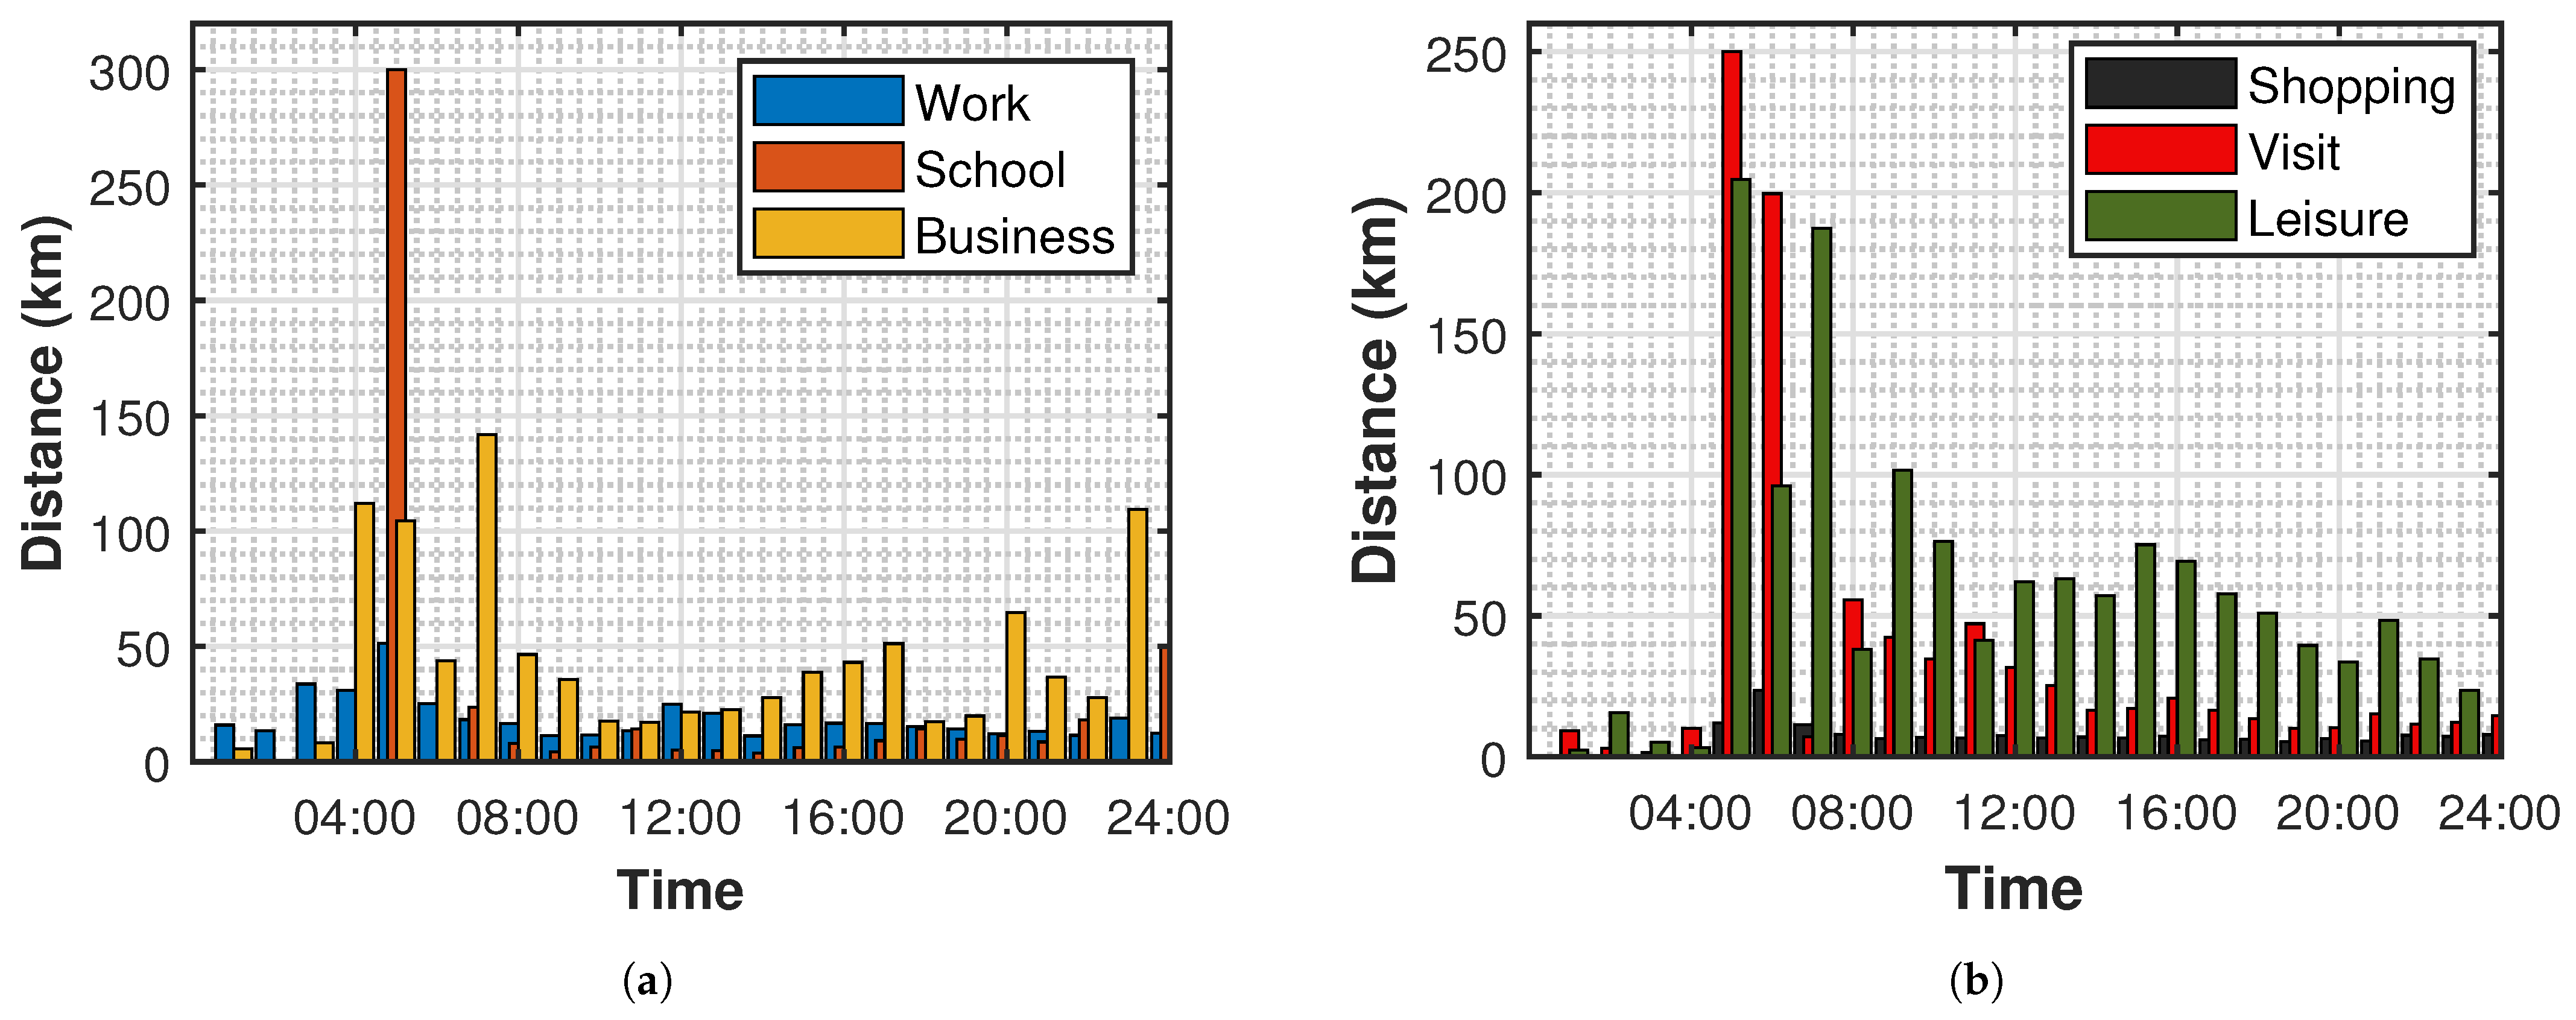
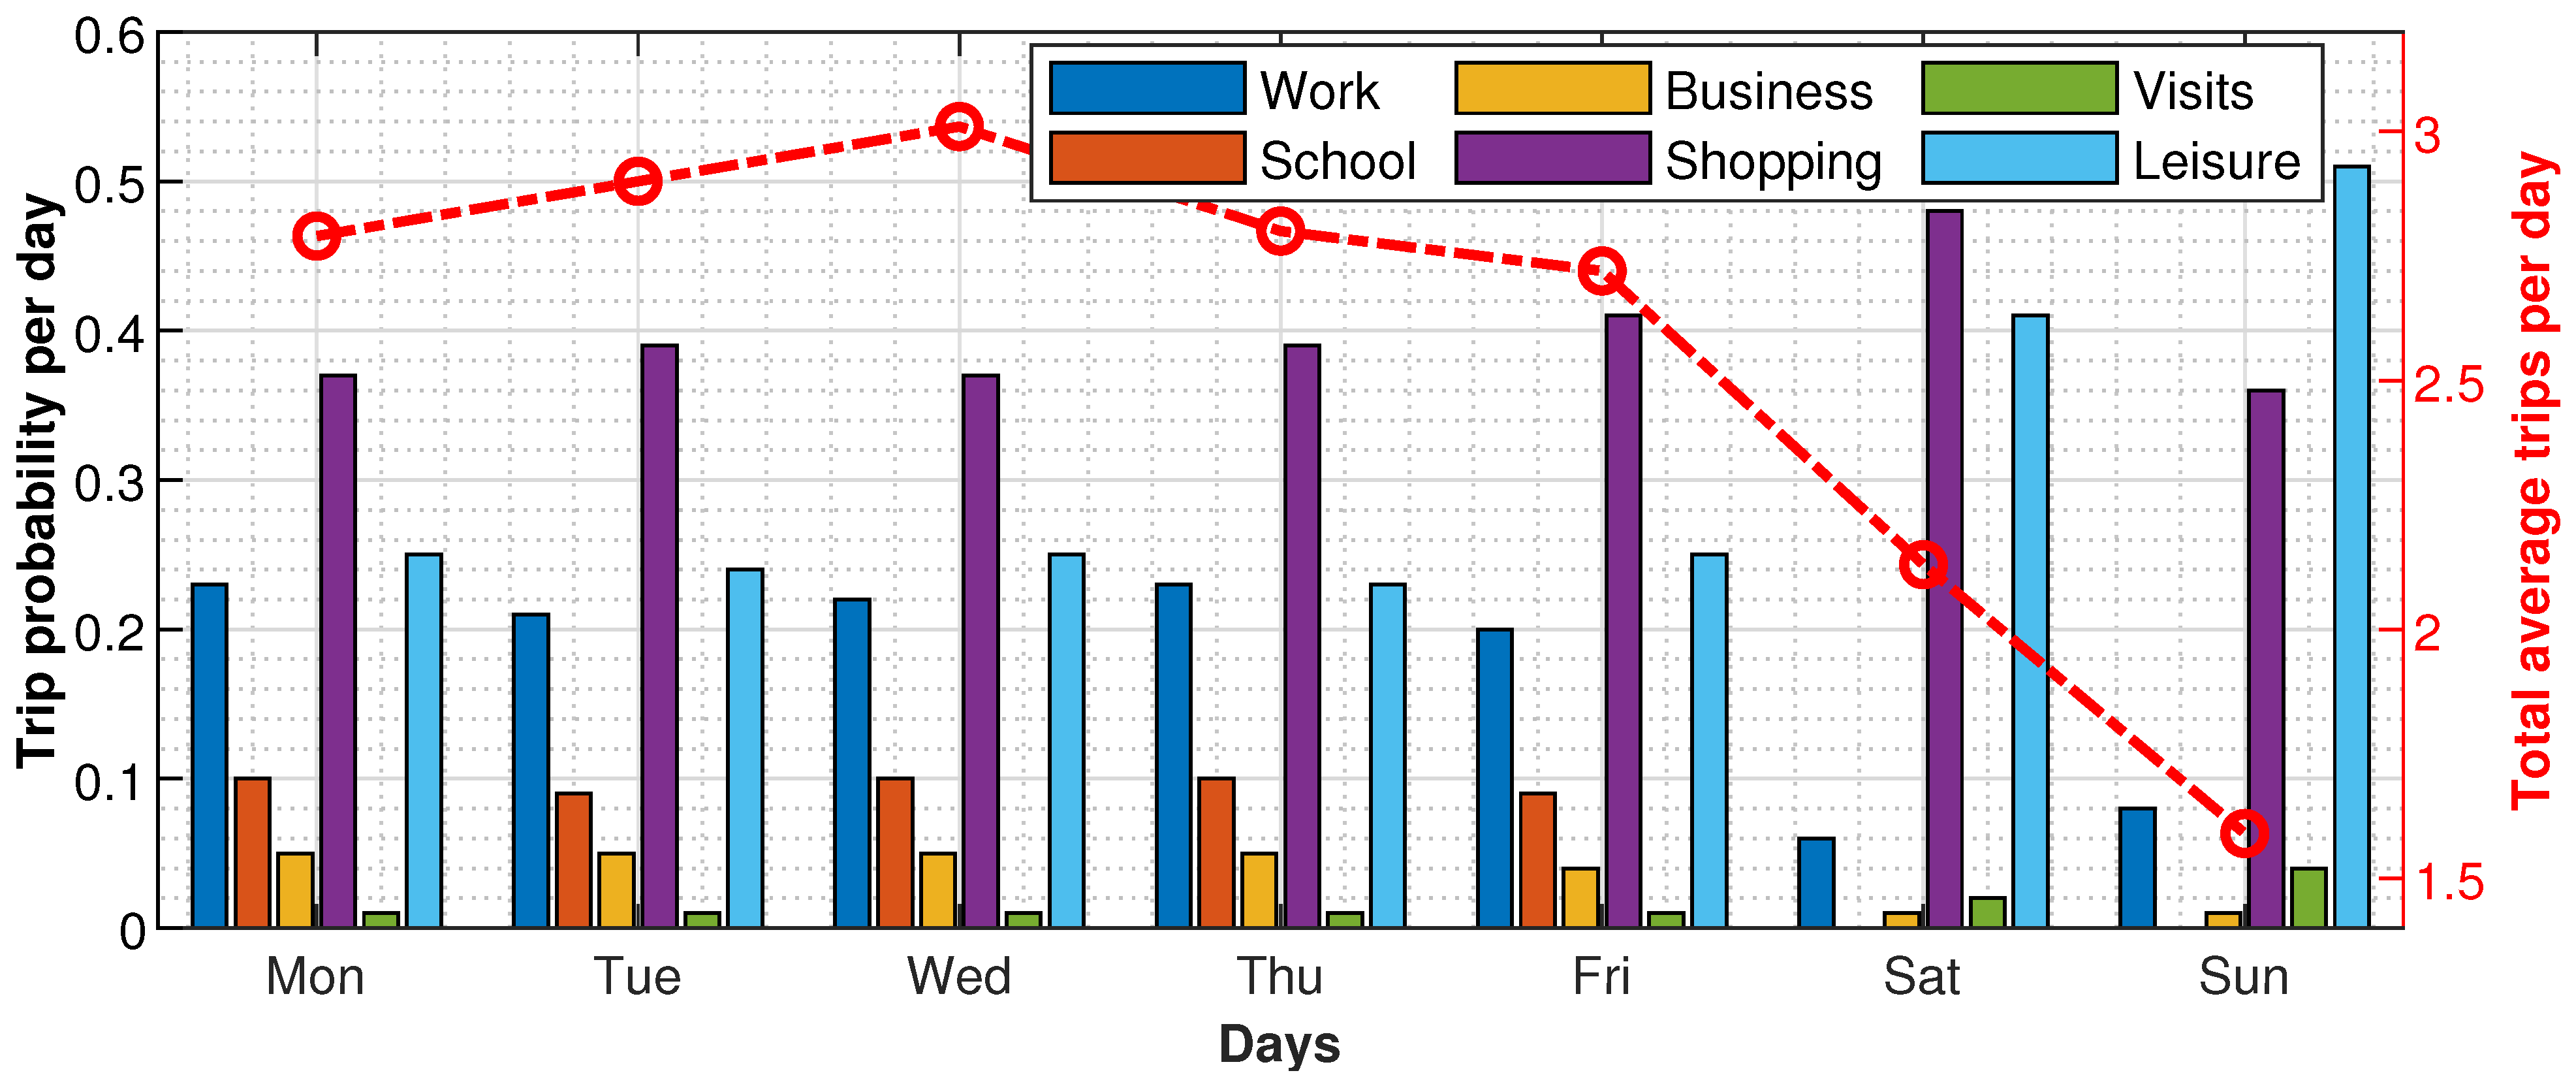
Trips are generated in response to people’s everyday activities, including work, school, travel, and leisure. We have selected three major activities for our EV load model. The most likely trip on weekdays is related to travel to work or school (WS). These drips have very low variation in terms of timing and distance. The second category of trips is related to shopping or business (SB) associated activities with significant variation for the trip starting time and travelled distance. The last category of trips is linked with leisure or vacation (LV). In contrast, these trips have a significantly high variance for both start-time and travelled distance and less likely to happen, especially on weekdays.
The probability distribution functions (PDF) of three essential parameters, trip start-time, trip distance and trip end-time, are defined for different trip categories that provide the base of the EV load model. During each iteration, the number and type of trips are selected for each day. In the next step, the trip characteristics such as start time, end time and distance travelled are estimated from their PDFs. In the last step, battery evaluation is performed after the end of each trip. The SOC is determined based on the energy consumed by the vehicle during the trip.
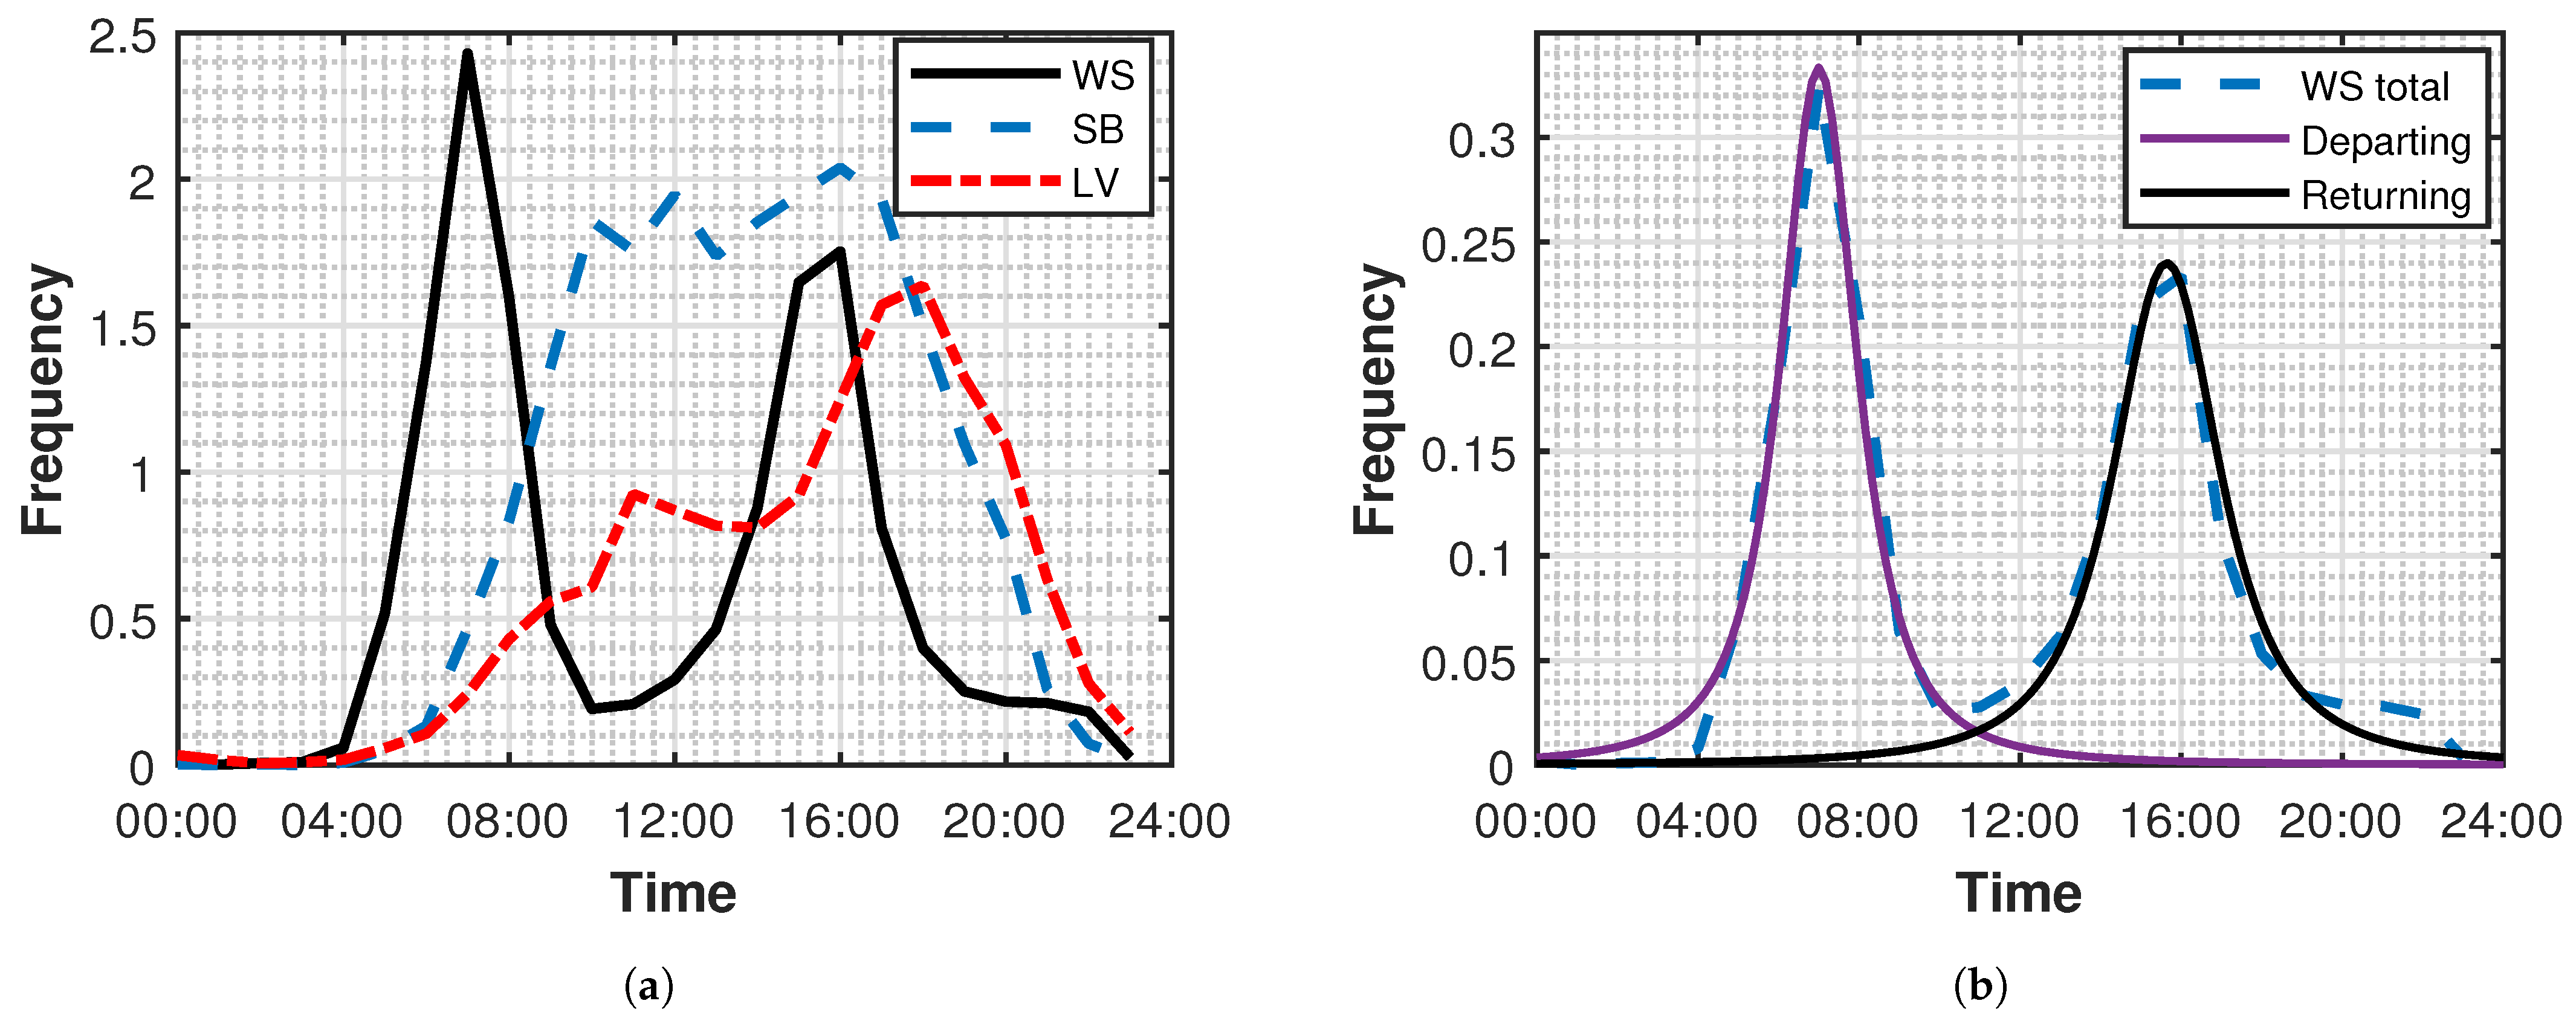
Figure 2a shows the start-time of different trip categories chosen from the NTS survey, where multiple peaks can be observed. This data is split up into incoming and outgoing trips, and probability distributions are defined for each travel activity.
Figure 2b shows the outgoing and incoming time distributions for WS trips extracted from the NTS survey data.
T-location scale distribution is used as it provides a close fit to the incoming and outgoing time data. The probability distribution function of t-location-scale distribution is shown by Equation (
1).
Here and represent the location and scale of the PDF while is the gamma function. v is the degree of freedom, and its lower values generate heavier tails. As the value of v increases, t-location-scale distribution approaches a normal distribution. A similar approach is applied to other trip activities to construct a PDF of the start time and end time of trips.
The incoming time of a trip depends on the distance travelled and time spent at the activity for which the trip demand is generated. Duration of leisure and shopping activities is calculated using Poison distribution, where the average time at the leisure and shopping activities is selected randomly between 120–180 and 20–60 min, respectively. The following relation shows the PDF of a Poisson distribution.
Here
shows the variance and
e is Euler’s number. The data of average distance travelled for various trip activities at different times of the day is also taken from the NTS survey and is shown here in
Figure 3. The distance travelled for each trip is estimated by using log-normal or Poisson distributions. The PDF of a log-normal distribution is shown by Equation (
3).
and
in Equation (
3) represents the mean and variance of the input data. The NTS survey provides the data for the number of trips for each activity per day and average trips per day. This data is used to evaluate the probability of trip as shown in
Figure 4.
5. EV Harmonic Emission Estimation
Accurate evaluation of the EV battery charging impact on the distribution grid requires understanding of charging characteristics dynamics under different operating modes and supply voltage variations. It’s a challenging task because several manufacturers are offering EVs in various sizes and battery capacity. The advancement in power electronics has led to notable changes in terms of the design and performance of EV battery chargers. The majority of commercially available EVs are equipped with level 2 chargers and are charged using slow overnight home charging as public fast-charging infrastructure is still inadequate [
32]. These chargers provide high efficiency over a wide range of supply voltage variations, including active power factor correction (a-PFC) circuits. Their harmonic emission is well under the limits provided by the standards, and total current harmonic distortions is less than 15% [
33,
34].
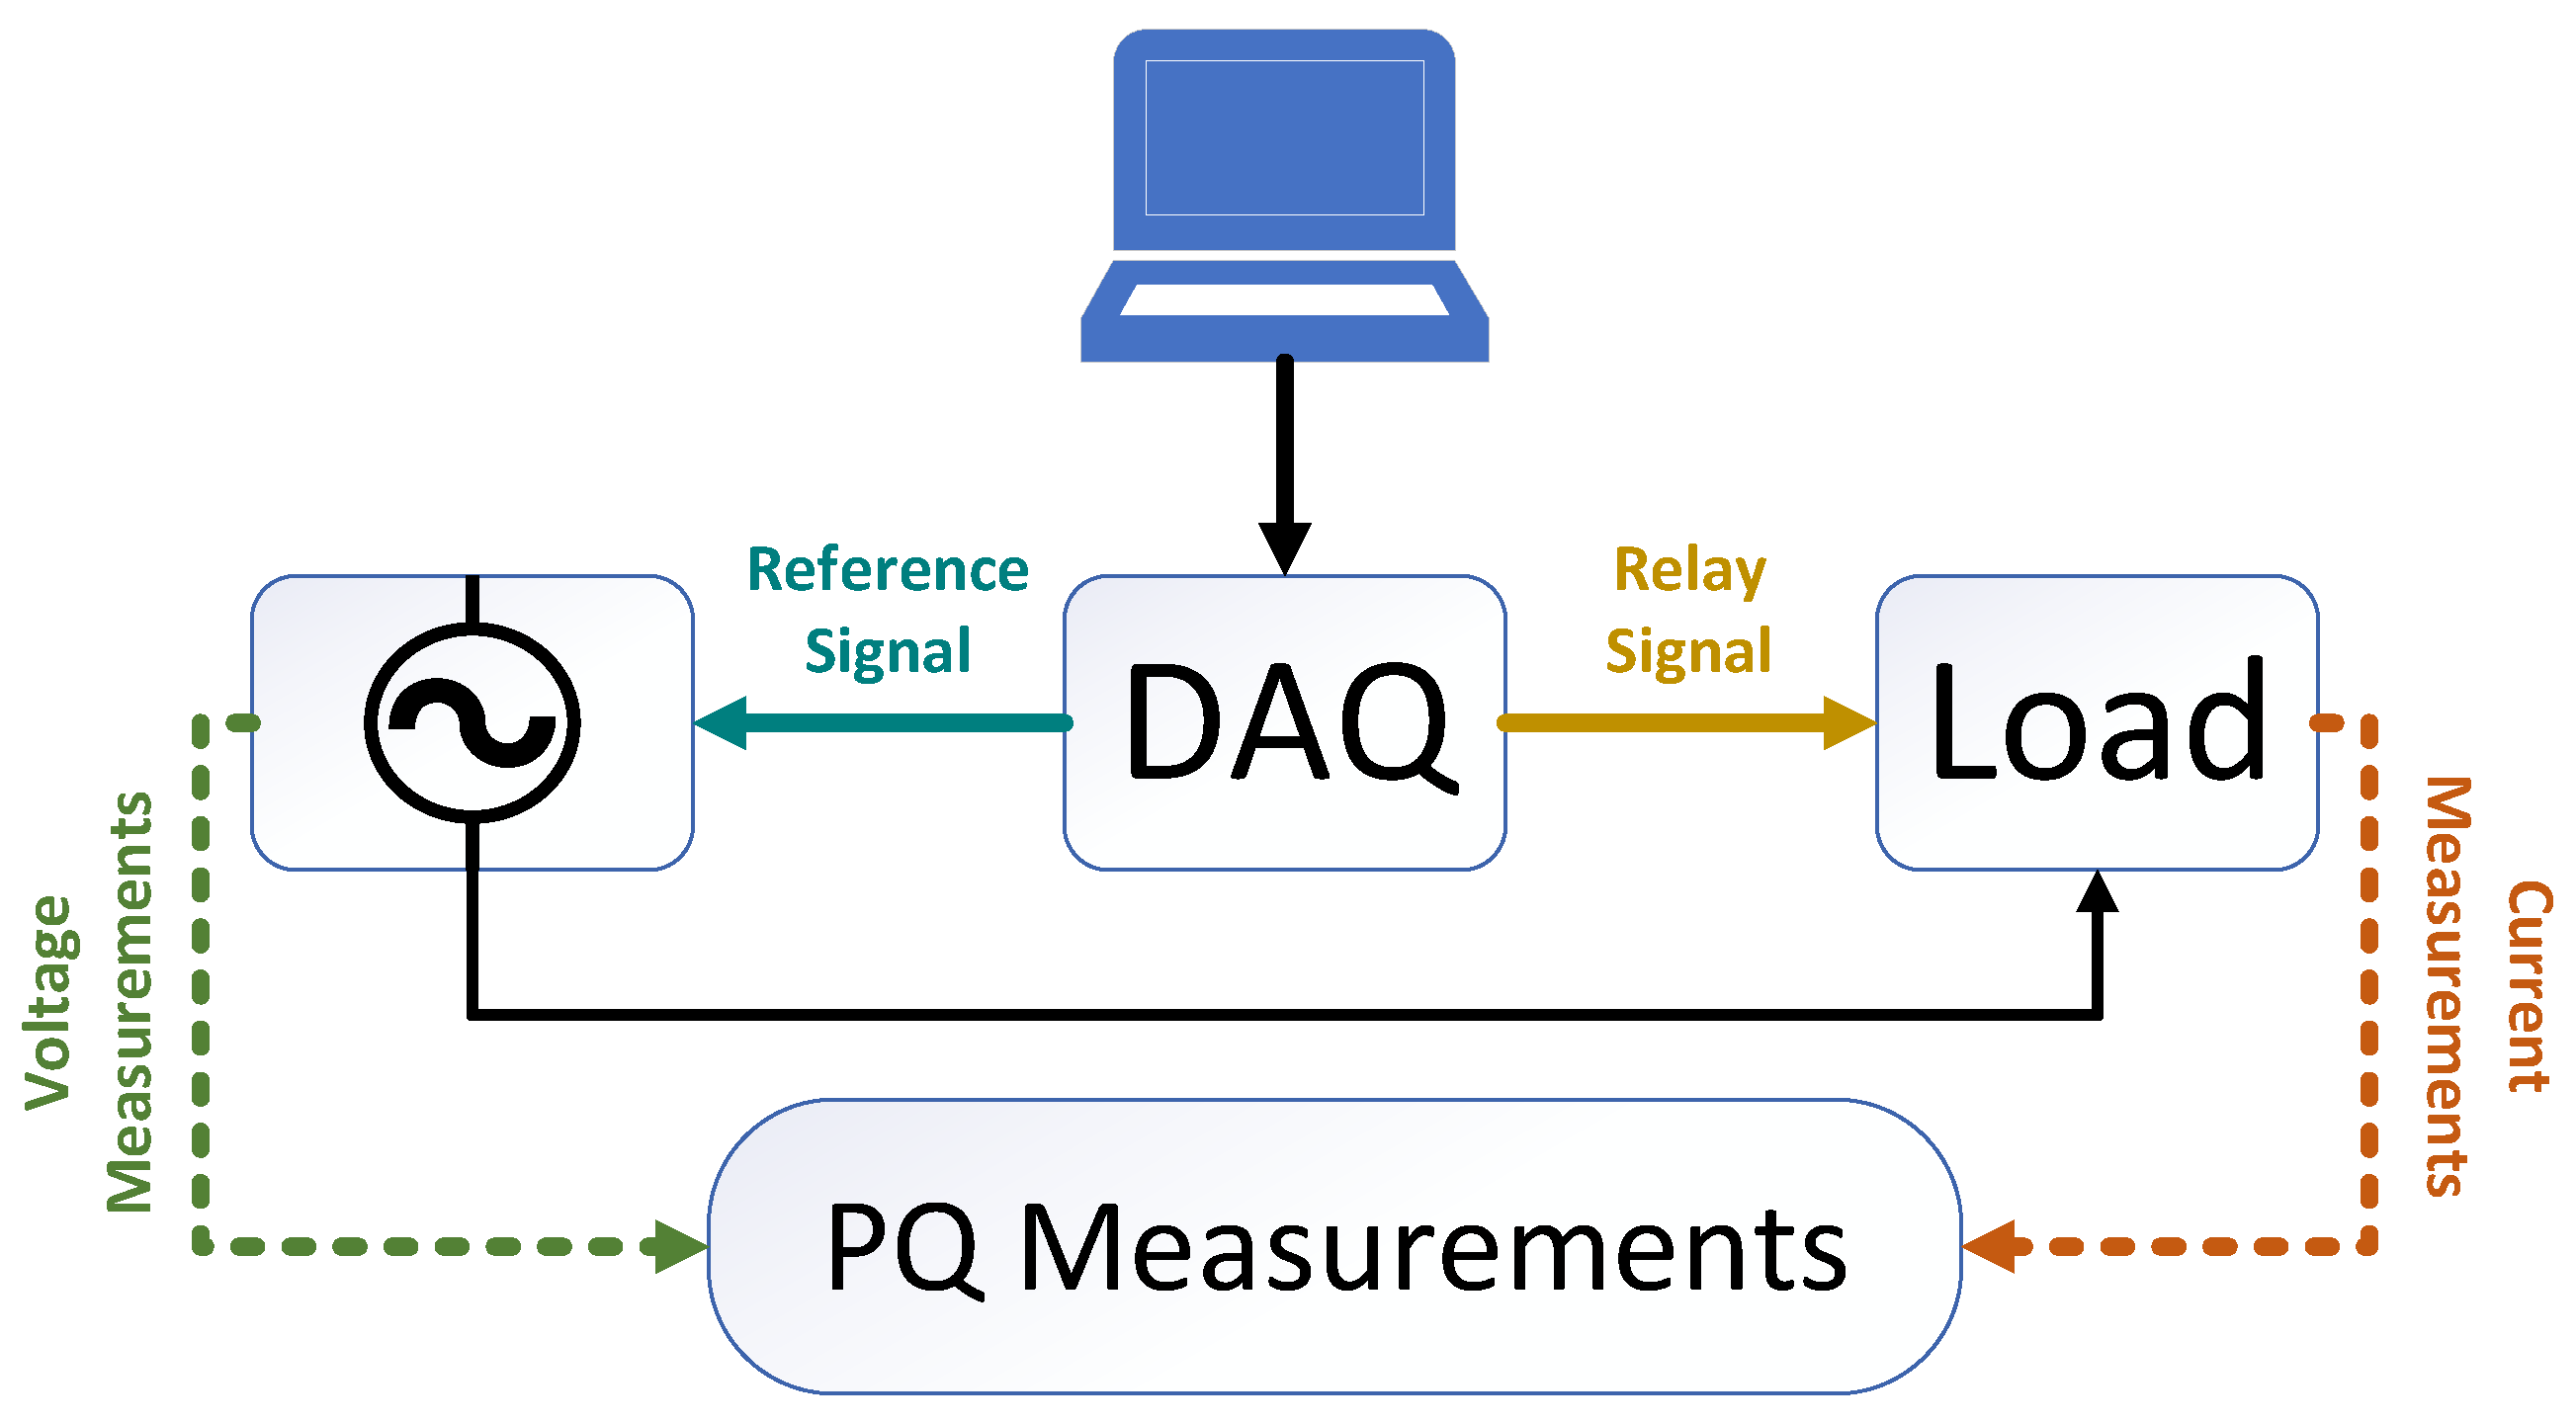
A measurement setup has been made to evaluate the current harmonic emissions of the EV battery charger under various voltage distortions. The setup consists of a 4 kVA controllable power supply Chroma 61505, and the reference signal is provided by the data acquisition module from National Instrument (NI).
Figure 5 shows the block diagram of the measurement setup. The voltage distortions are created using a MATLAB program by providing voltage harmonic magnitudes and phase angles as listed in
Table 1.
The power supply is controlled by a reference signal using the following relation.
The values of
and
is 300 V and 7.072, respectively.
is generated at a sampling frequency of 100 kHz using the following equation.
where,
is the RMS value of harmonic magnitude and
is its frequency.
represents the phase difference of the harmonic from the fundamental component of the voltage waveform. The sampling interval
is calculated using the sampling frequency
as shown by the following relation
Here,
T is the time duration of the generated waveform and
N is the number of samples in that interval. A-Eberle PQ box 200, capable of providing 1-second data averaged over 200 ms recordings, is used to record the current harmonics magnitude and phase angles. The detail of the measurements setup is provided in [
35]. Eleven different EVs including both battery-powered electric vehicle (BEV) and plug-in hybrid electric vehicle (PHEV) are measured on the voltage waveforms defined in
Table 1. The characteristics of these vehicles are summarised in
Table 2.
The impact of voltage waveform distortions on the individual harmonics is presented in
Figure 6. The vectors of the 3rd harmonic current show that the spread will change slightly for the flat top voltage waveform while the harmonic spread is nearly identical for sinusoidal and pointy top voltage waveforms. The harmonic spread for the 5th harmonic on pointy top voltage waveform is almost shifted 180 degrees in contrast to sinusoidal or flat top voltage waveform for the majority of the EVs. On the flat top voltage waveform, the 5th harmonic current is slightly increased in magnitude; however, the phase angles are almost the same as on the sinusoidal voltage waveform. The 7th harmonic current spread on the pointy top voltage waveform shows a significant change in terms of magnitude in comparison to sinusoidal or flat top voltage profiles. On the other hand, the 9th harmonic shows a wider spread for different EVs, but the change in magnitude or phase is not very high for different voltage waveforms.
To observe the impact of the large scale EV integration on the current harmonic emission in the low voltage distribution network, EV load model is used to simulate 50 EVs for 100 days. The EVs are assigned randomly from the list provided in
Table 2. The EV load model is used to simulate the travel activities to generate charging profiles based on the distance travelled during each trip. For each EV, the outgoing and incoming times of each trip during a day is estimated. The final destination is assumed to be the home. Based on the distance travelled during each trip, the state of charge of the battery is estimated. The decision of charging depends upon the state of SOC. While the EV is at home and does not have sufficient SOC to make a new trip, the EV charging will take place. The simulation is performed for weekdays only, therefore, the EV charging takes place mostly during the evening time.
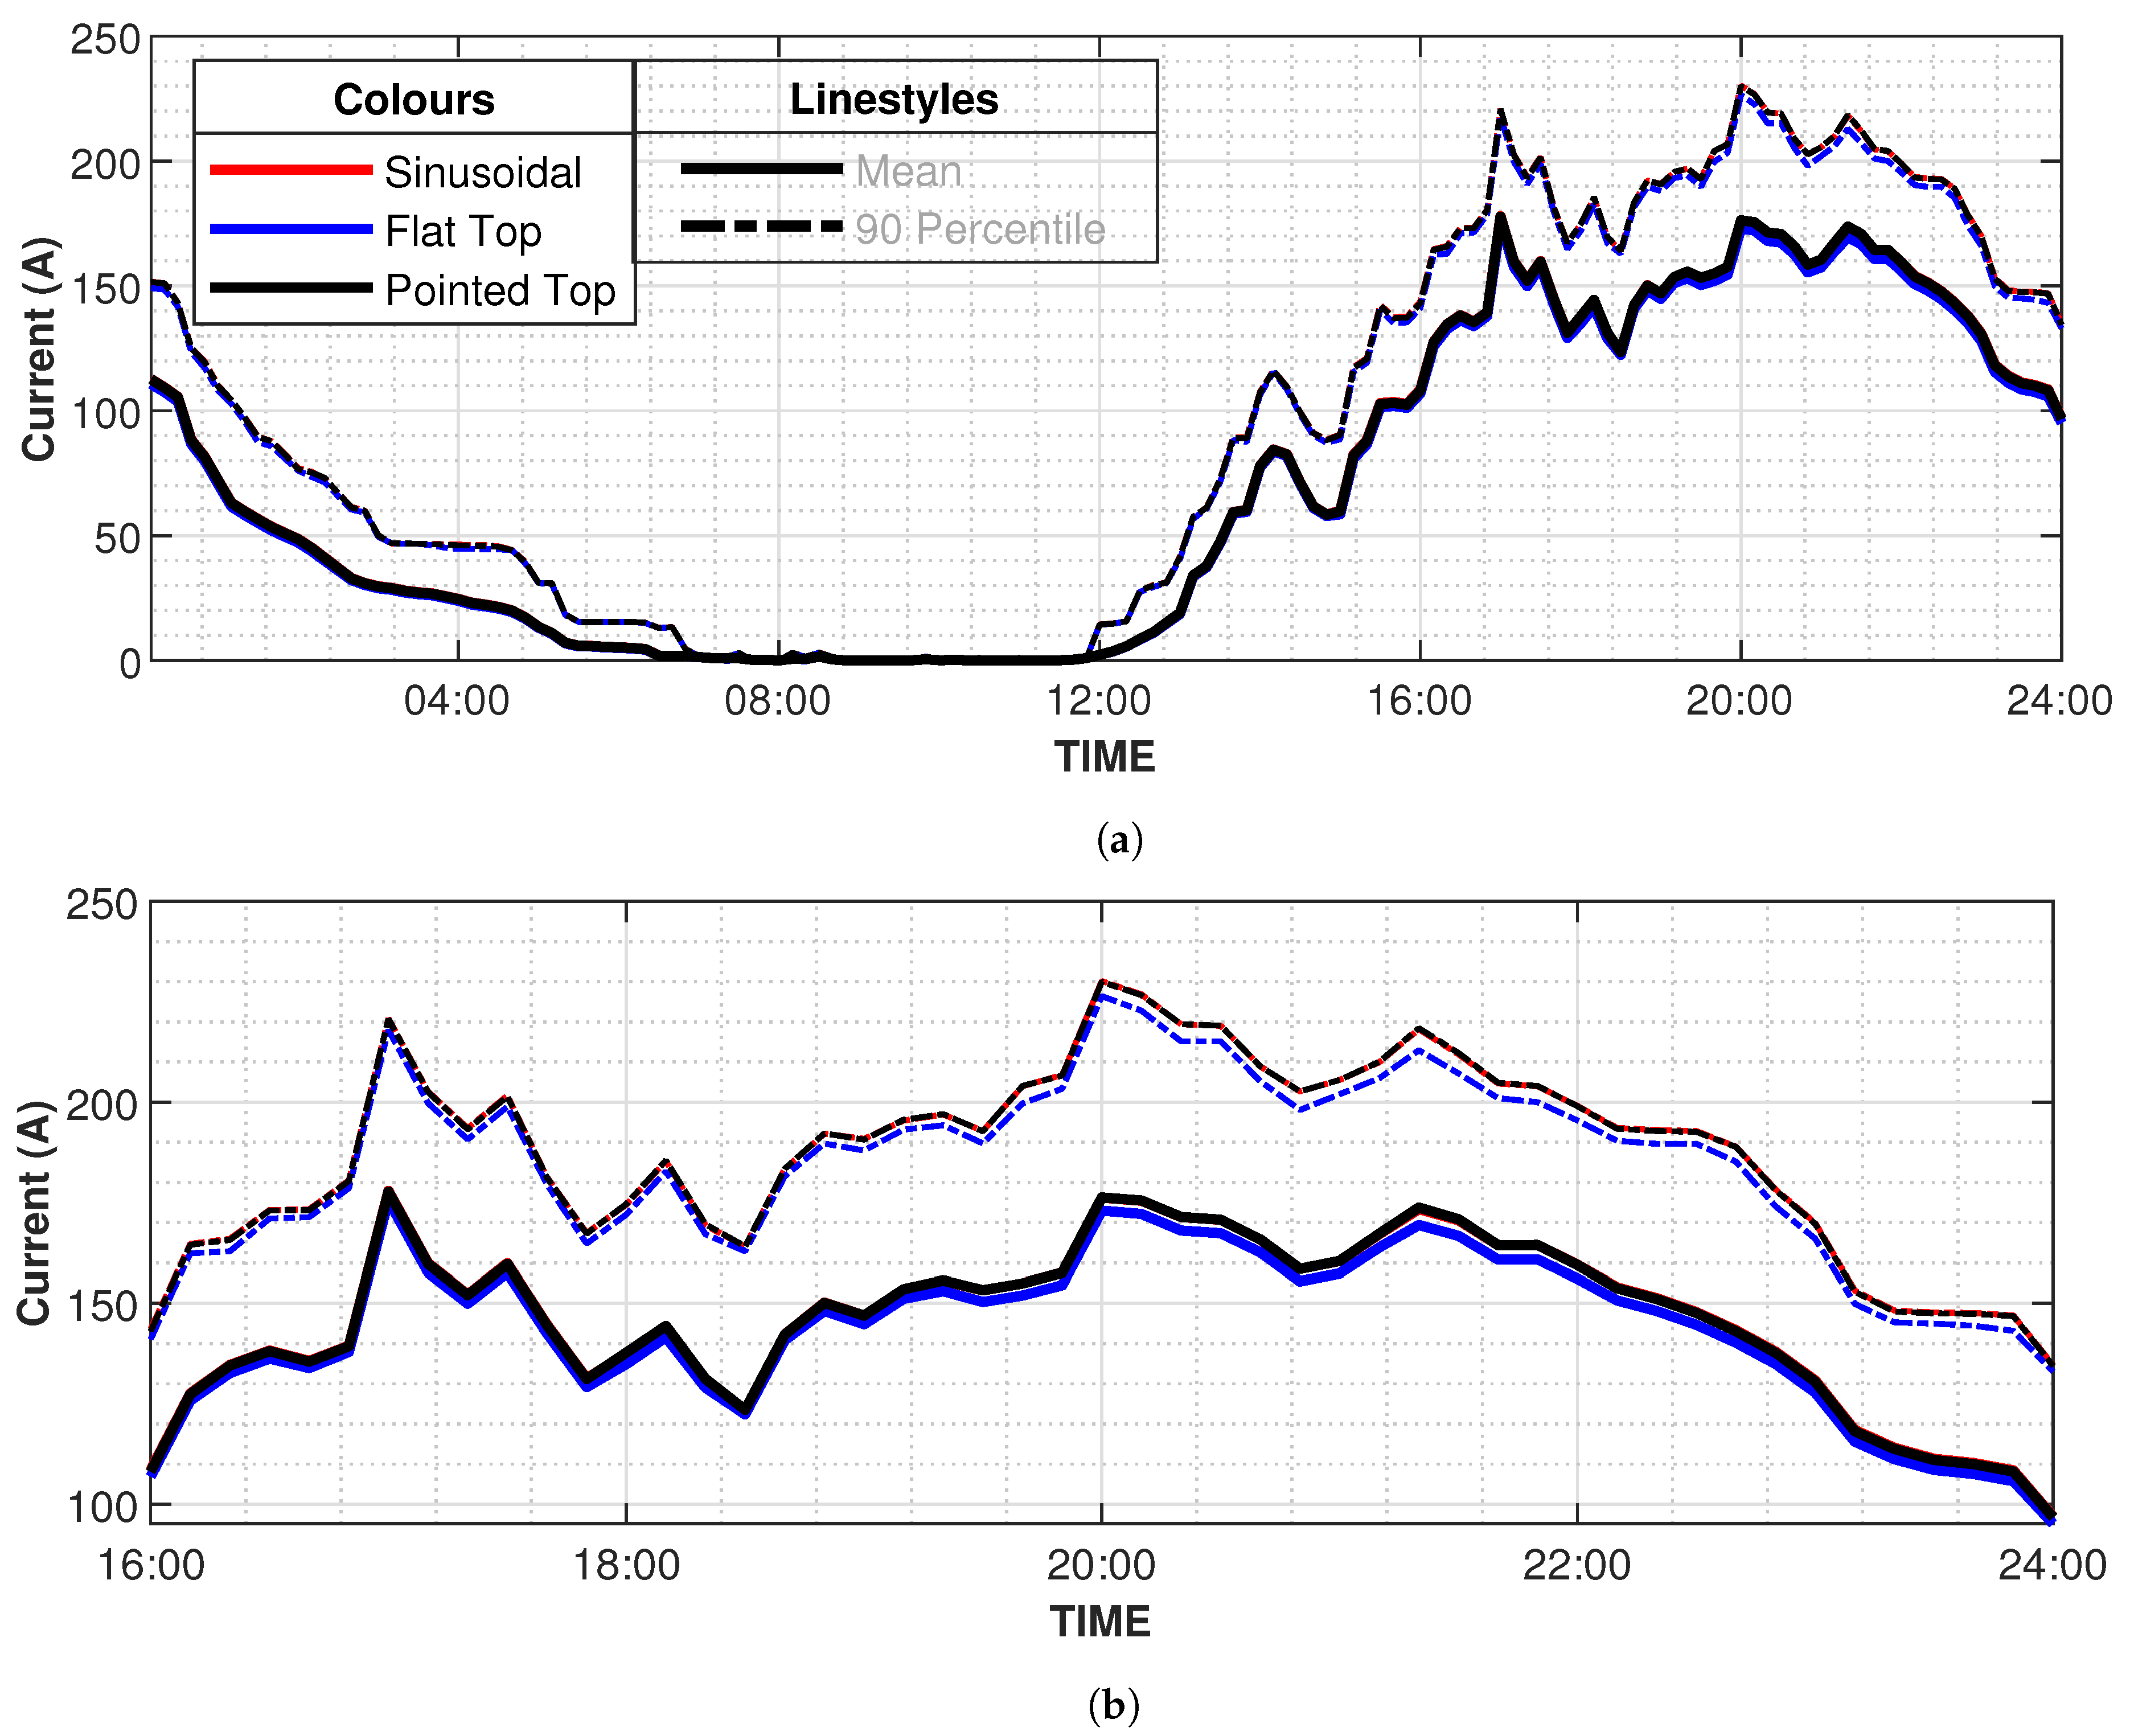
Figure 7 shows the mean and 90th percentile values of total RMS current for different voltage distortions. The bold lines indicate the mean values while the dotted line shows the 90th percentile value of the RMS current. The RMS values does not show a significant variation for different voltage waveforms and only slight variation can be observed.
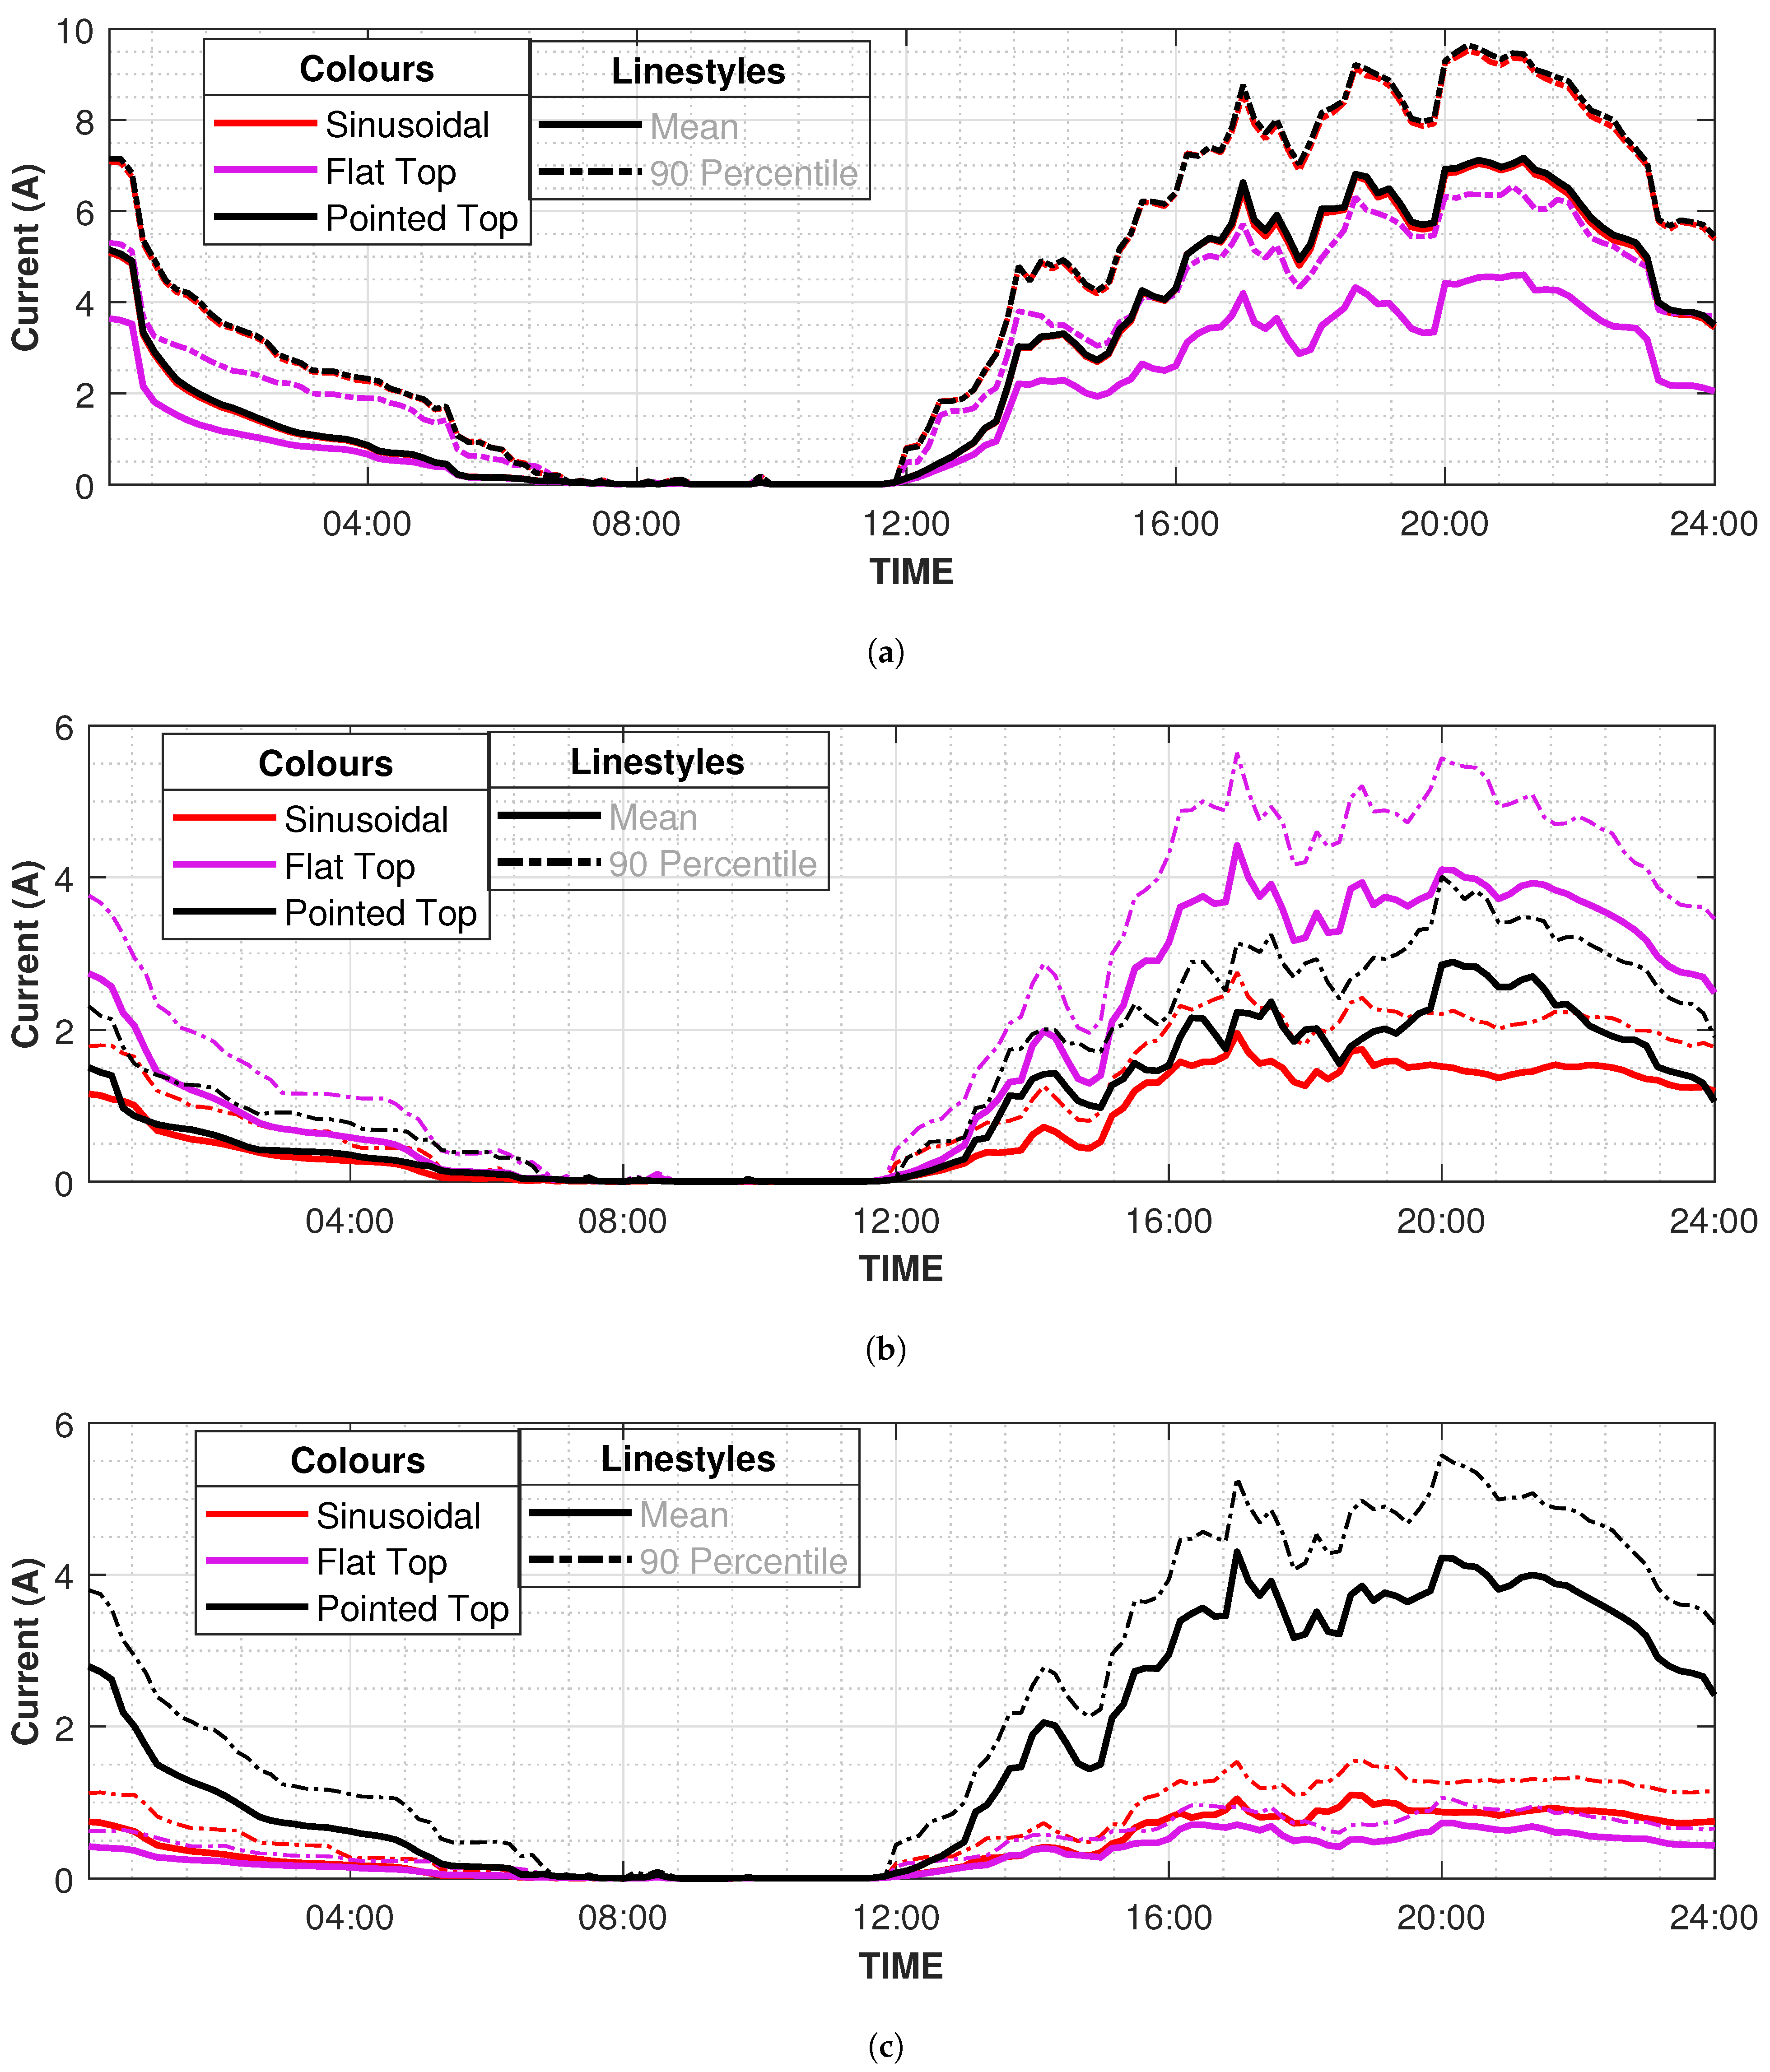
The mean and 90th percentile values of 3rd harmonic current drawn over 100 days for 50 EVs is shown in
Figure 8a. No significant variation in the 3rd harmonic current can be observed between sinusoidal and pointed top voltage waveforms, however, the values on flat top voltage waveforms are significantly less for both mean and 90th percentile values. The mean value increases to its maximum value of 6.9 A around 21:30. The mean values on flat top voltage waveform at the same time is only 4.60 A which is 33.3% less. The 5th harmonic values are more for flat top voltage waveform as shown in
Figure 8b. On sinusoidal voltage waveform, the 5th harmonic current has lowest values during the 24 h. The values slightly increase on pointed top voltage waveform shown by black bold line in
Figure 8b. The mean and 90th percentile values of the 5th harmonics crosses 4.4 and 5.6 A, respectively, during the evening peak. On the sinusoidal and pointed top voltage waveforms, the mean value increases to a maximum value of 1.9 and 2.8 A only.
The 7th harmonic emission on pointed top voltage waveform is very high in comparison to sinusoidal and flat top voltage waveforms as shown in
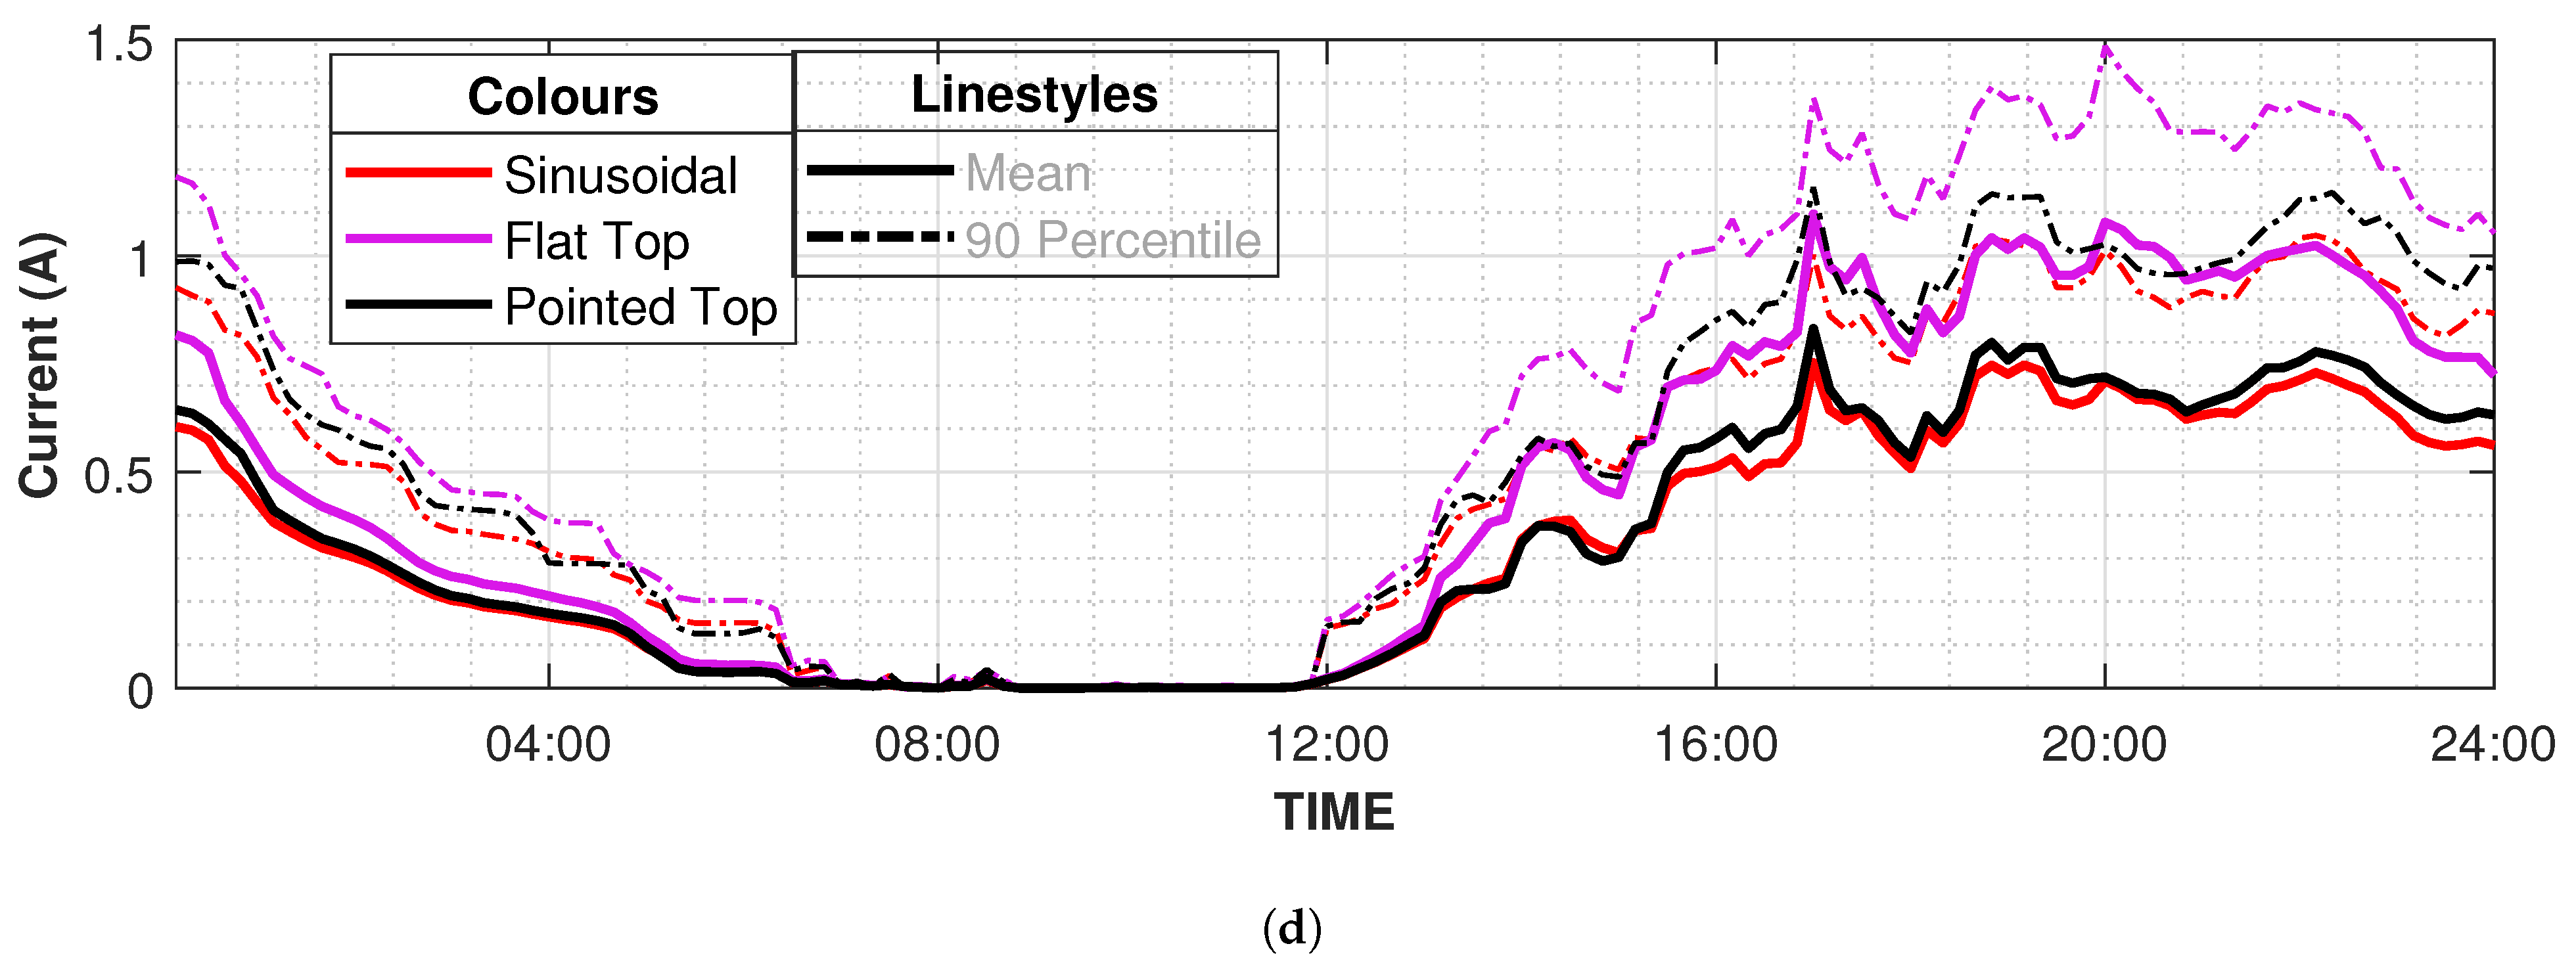
Figure 8c. The mean value exceeds 4 A for pointed top voltage waveform during the evening peak while the mean values at sinusoidal and flat top voltage waveforms are around 1 A. The values for the 9th harmonic current are more on the flat top voltage waveform with the mean value crossing 1 A during the evening time. For sinusoidal and pointed top voltage waveform, the mean values of the 9th harmonic are quite close during the whole day with the maximum value of 0.83 A.
Figure 8d shows the mean and 90 percentile values of the 9th harmonic current on different voltage distortions.
6. EV Charging Impact of Distribution Transformer
The impact of EV charging on the distribution network includes the increase in load and voltage distortions. To assess this impact, the relation between the charging start time and the evening peak should be taken into account. Evening peak load depends on the consumer behaviour of using electricity mainly influenced by regional electricity pricing mechanisms. The primary impact of additional EV load is the heating and overloading of existing distribution transformers. The additional losses may occur because of the skin and proximity effects in the windings and stray losses due to leakage flux. Consequently, the hot spot temperature rise will reduce the operating life span of the transformer and increase the probability of insulation failure. Additionally, the cable efficiency will also be reduced because of the high losses resulting from skin and proximity effects [
36].
To evaluate the impact of EV integration in the existing distribution network, a test case has been presented in this section based on the real-time measurement of the distribution grid and EV usage model. A distribution grid in Finland is measured for several days in winter to record current harmonics at the 620 kVA distribution transformer connected in Delta-Wye (Dy) with LV side grounded. In
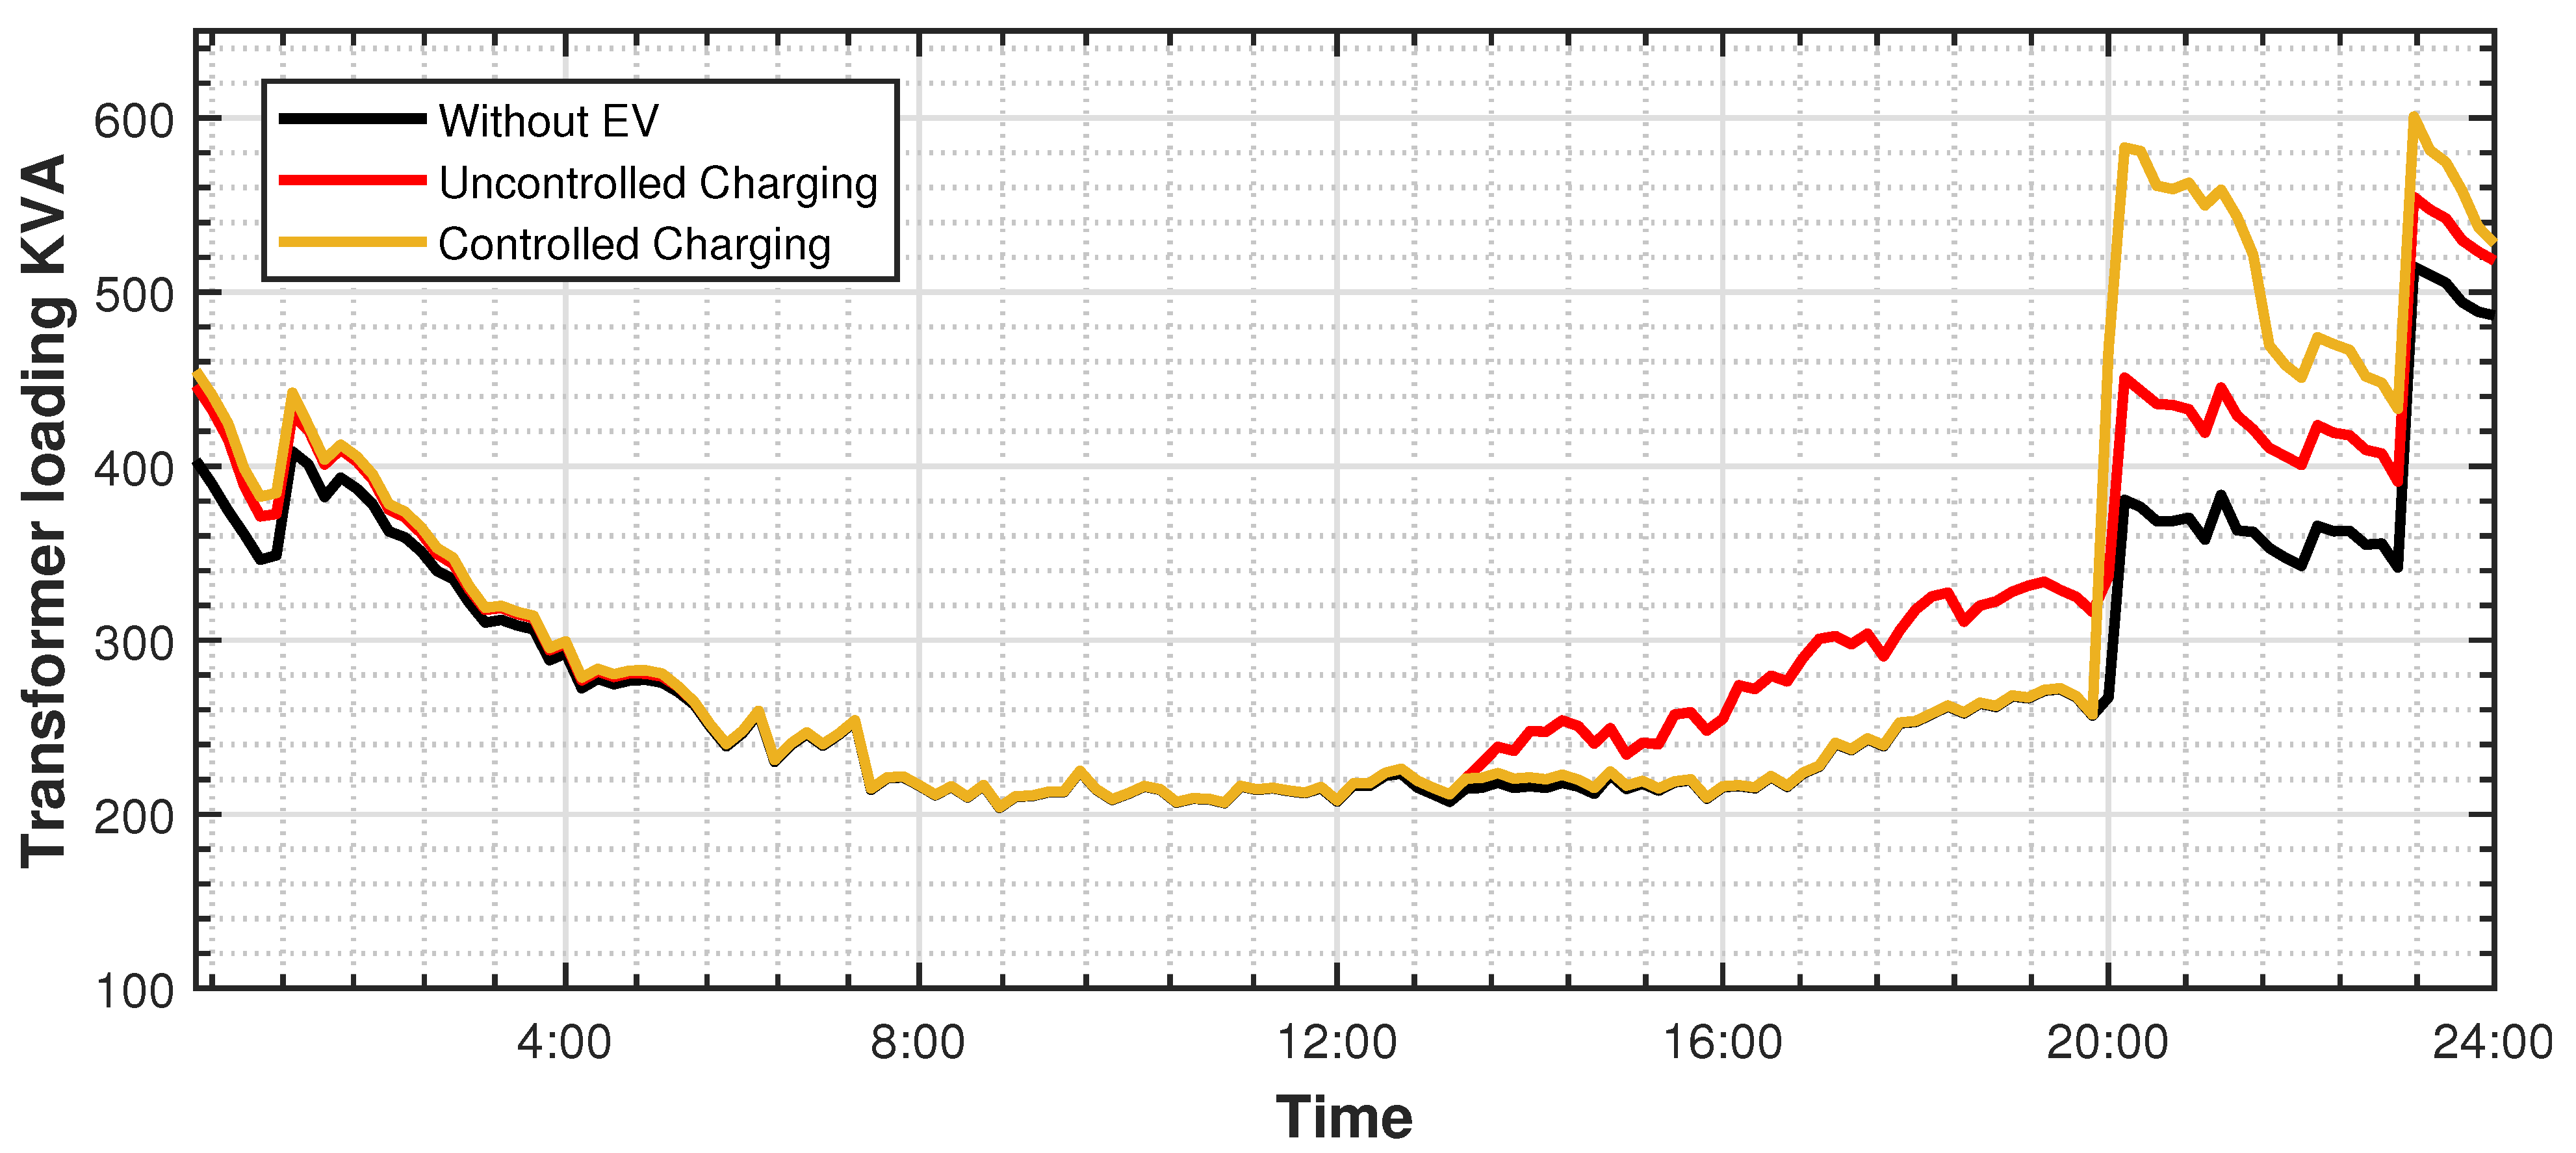
Figure 9, the black line shows the mean value of the existing load at the transformer for approximately 80 houses without any EV usage. The heating load is already shifted to 20:00 to reduce peak loads and take advantage of cheaper electricity tariffs. The heating load scheduling is performed on the user end through time-based switching.
Two different scenarios are simulated using the EV load model to estimate the additional load on the transformer. In the first case, 80% of uncontrolled EV charging load is simulated for 100 days using Monte Carlo simulations. The current harmonics estimated from the simulated EV load are aggregated with the measured current harmonic data at the distribution transformer. The mean value of transformer load is calculated and is shown by the red line in
Figure 9. The uncontrolled charging has significantly increased the transformer load by approximately 18% and 25% at 16:00 and 18:00, respectively. The transformer load significantly increased after 20:00 because of the shifted heating load in winters. The EV charging has caused additionally 15% and 7% transformer loading at approximately 20:00 and 23:30, respectively. The peak loading of the transformer is nearly 89% around 23:30.
In the second case, controlled EV charging is implemented and simulated using the EV load model. In the second case, controlled EV charging is implemented and simulated using the EV load model. Several controlled charging methodologies are available in the literature that provides smart charging algorithms to maximize utility or consumers benefits [
37,
38]. However, these schemes require additional infrastructures such as data connections and smart meters. These algorithms may also cause inconvenience to the customers and limited practical implementations [
21]. We have used controlled charging based on Time-of-Use (TOU) pricing and simulated its impact on the distribution grid using the EV load model. The TOU based controlled charging allow networks to reduce peak load by selecting appropriate peak and off-peak energy prices and required no additional infrastructure [
39,
40]. It may provide better grid utilization, especially during summertime when the heating load is not present; however, the customers may also take advantage of low price electricity during off-peak hours for their heating load during winter times.
The impact of controlled EV charging is estimated using the EV usage model. The yellow line in
Figure 9 shows the transformer loading for controlled charging scenarios. All the EVs are now forced to charge from 20:00 on wards, causing additional strain on the transformer. The transformer load has increased almost 53% at 20:00 and pushing the transformer load to nearly 95%. Furthermore, the peak load is increased to 96% because of the additional 16% EV load at 23:30. The controlled charging for EVs during winters is causing poor load management in contrast to uncontrolled charging because of the shifting of heating load during off-peak hours. The EVs cannot be scheduled between 04:00–08:00 to avoid heating load as the time span is not enough to recharge the batteries fully.
The uncontrolled charging provides better transformer utilisation for the distribution grid under consideration. It means that the time-based tariffs may cause overloading of the transformer as both EV and heating load will take advantage. However, when the heating load is minimal in the summertime, the time-based tariff and controlled charging will improve the transformer utilisation.
The hot-spot temperature of the distribution transformer is estimated using the procedure described in IEEE standard C57.110 [
41]. The values of current harmonics estimated using the EV load model for 80% EV penetration along with the measured values of current harmonics at the distribution transformer are used to calculate the hot spot conductor temperature of the 620 kVA oil-immersed transformer using the Equation (
7).
Here
and
are the hottest spot conductor temperature rise under operating and rated conditions in degree Celsius (°C).
is the per unit eddy current loss in the transformer under rated conditions.
is the loss factor due to harmonic currents in the transformer winding and calculated by using Equation (
8).
Here
h is the harmonic number and
is the highest harmonic order under consideration.
I and
are the RMS load current and RMS harmonic current, respectively.
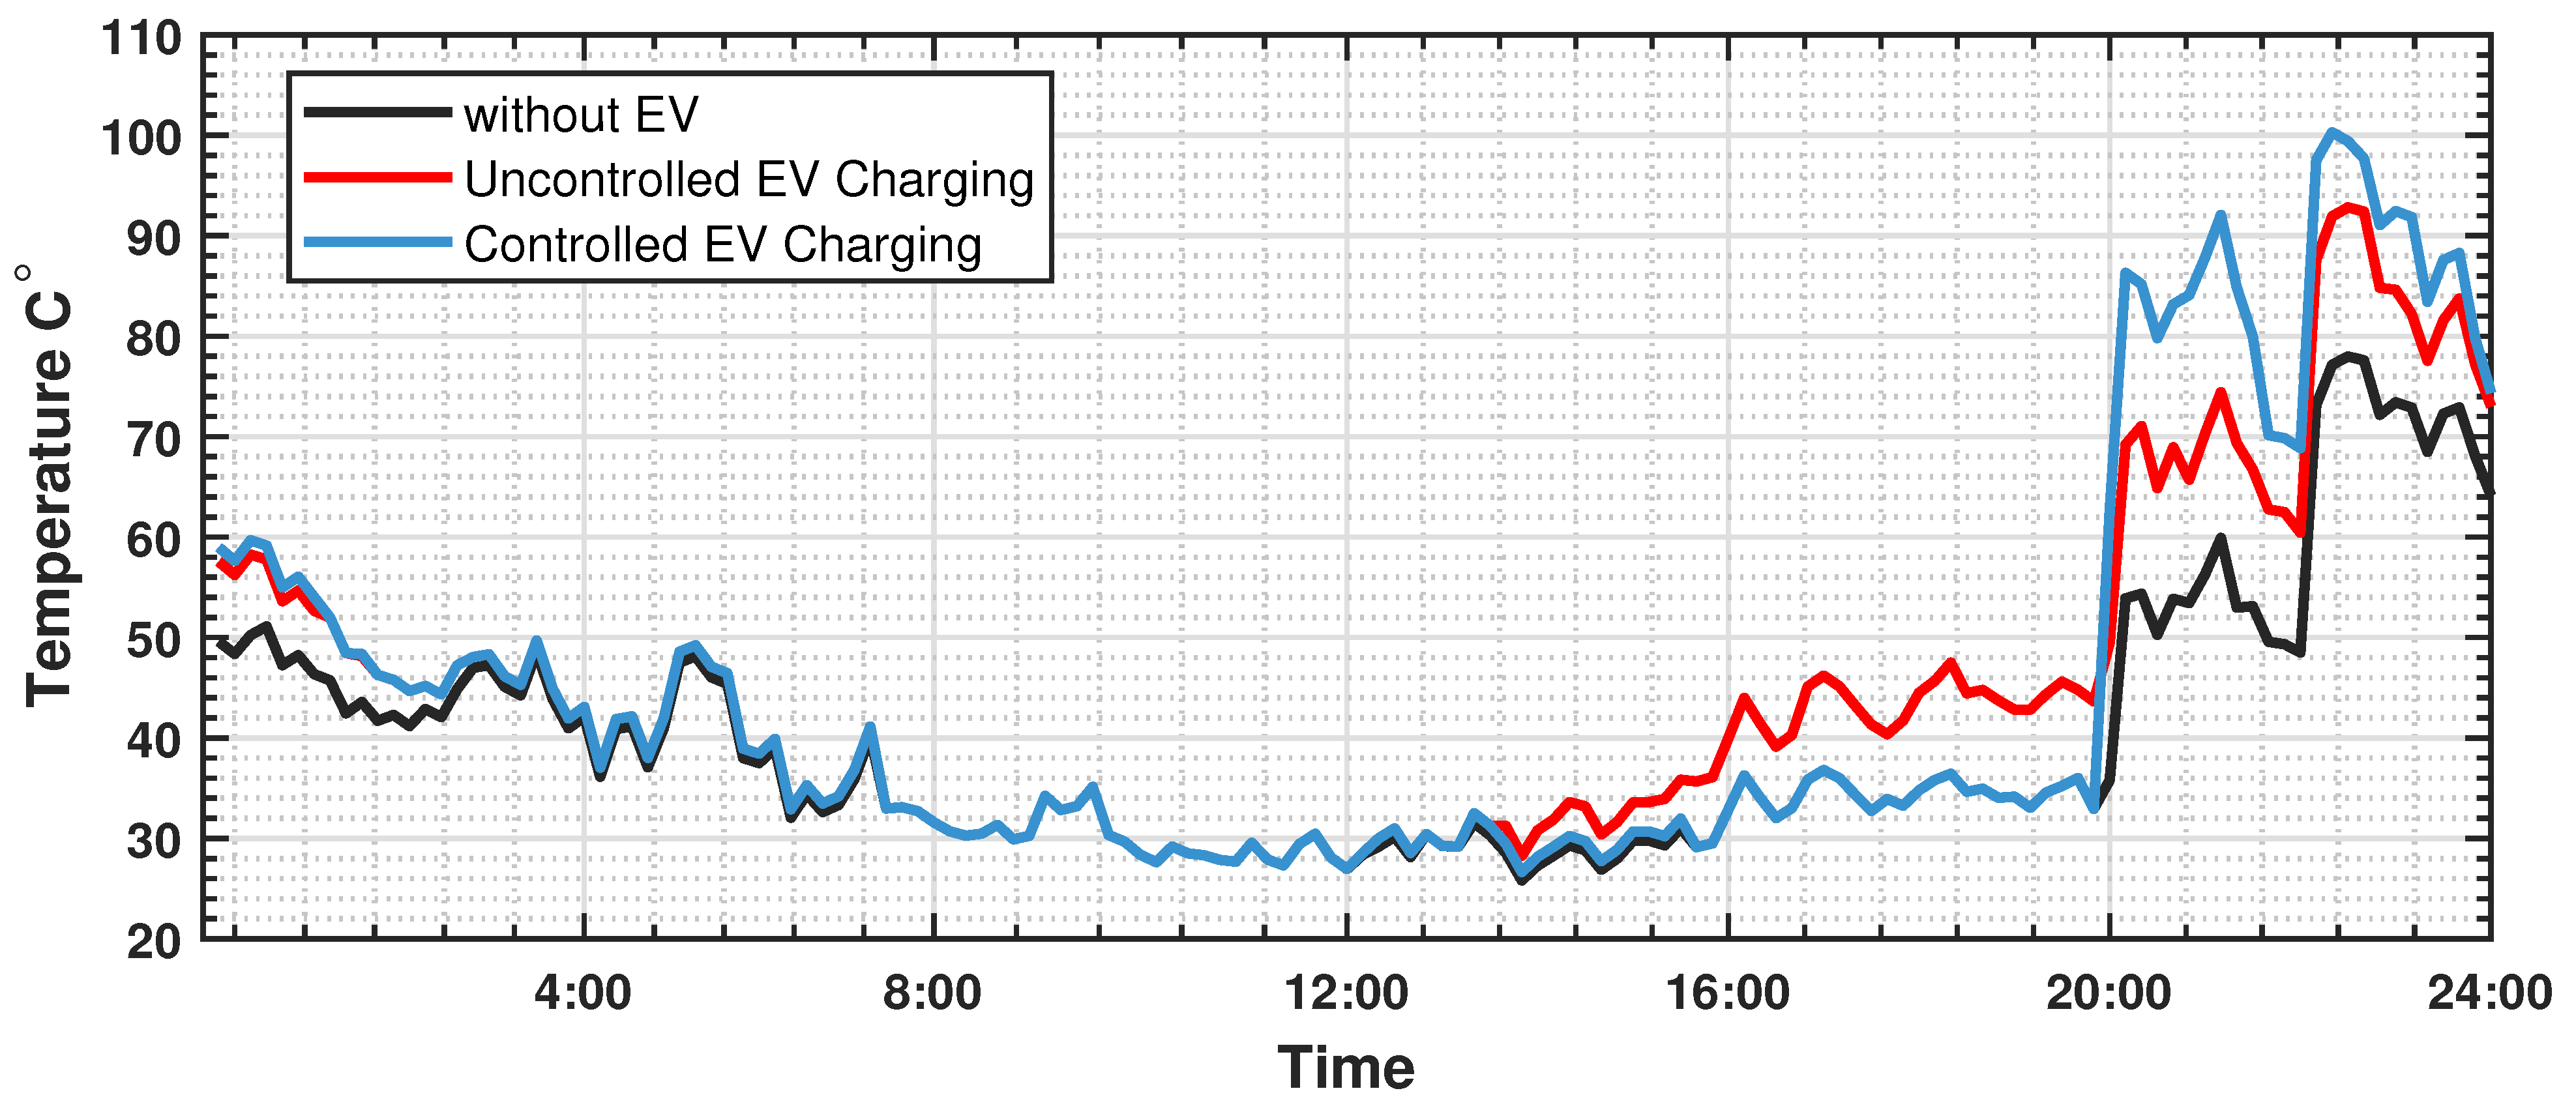
Figure 10 shows the temperature rise of the hottest spot conductor over ambient temperature for three scenarios. In the first case, the calculation is made only for the mean values of the current harmonic measurement data at the distribution transformer. The black line shows the temperature in the range of 26–52 °C between 00:00 to 20:00 without any EV load. The temperature rises to the maximum value of 77 °C during the time period of 22:00 and 24:00 because of the shifted heating load.
In the second scenario, the temperature rise for the hottest spot conductor is calculated when an additional uncontrolled EV charging load is applied. It has increased the temperature range to almost 60 °C between 00:00 to 20:00, while the maximum temperature is now almost 93 °C at 22:30. It means that uncontrolled charging has increased the maximum temperature rise of the transformer by nearly 16 C. In the controlled EV charging scenario, the maximum temperature of the transformer has increased to more than 100 °C, which is 8 °C more when uncontrolled EV charging is employed. The consistent high hot spot conductor temperature for more than 4 h a day will significantly reduce the transformer life or cause insulation failure.
The results show that EV controlled charging based on TOU electricity tariff to shift the EV load during off-peak hours will not improve the transformer utilisation for high EV penetration in the distribution grids during winter times. A more complex load shifting procedure is required where heating load and EV charging could be adjusted to improve the transformer utilisation and decrease the hot spot conductor temperature. However, it will require additional infrastructure to support the implementation smart controlled charging schemes. Furthermore, the impact of smart controlled charging algorithms on the EV customers is also unknown at this point. The results also show the validation and capability of our EV load model.
7. Conclusions
A method is proposed in this paper to estimate the current harmonic emission of electric vehicles. The model is based on the EV usage model developed to generate the SOC profiles of individual vehicles. Furthermore, probability distributions functions of various parameters such as outgoing time, distance travelled, and incoming time for different types of trips are calculated based on the data from a travel survey. Various electric vehicles are measured over different voltage waveform to record their current harmonic magnitude and phase angles. Moreover, a Monte Carlo simulation is used to estimate the harmonic emission of fifty EV over one hundred days to estimate their aggregated harmonic emission. The results show that EV harmonic emission also depends on the supply voltage harmonics, which may be affected by various nonlinear loads present in the distribution grid.
The impact of EV integration on the distribution transformer is also evaluated. The current harmonic emission at a distribution transformer, supplying power to approximately 80 households, is measured during winters. Monte-Carlo simulation is used to aggregate the estimated 80% EV charging load to the existing load at the distribution transformer for hundred days. The heating load in the measured distribution grid is shifted because of the time-based electricity tariffs. The EV charging has increased the late-night peak load more in contrast to the uncontrolled EV charging in winters because of the shifted heating load. The hottest spot conductor temperature of the transformer has risen significantly during EV charging. It indicates that TOU controlled charging may not provide the solution to improve transformer utilisation in winters, and smart controlled charging algorithms may be the only solution for the network providers to accommodate additional EV load.


 ,
, 


