Article

Biodiversity Monitoring in Long-Distance Food Supply Chains: Tools, Gaps and Needs to Meet Business Requirements and Sustainability Goals

by
Meghan Beck-O’Brien
* and
Stefan Bringezu
Center for Environmental Systems Research, University of Kassel, 34117 Kassel, Germany
*
Author to whom correspondence should be addressed.
Sustainability 2021, 13(15), 8536; https://doi.org/10.3390/su13158536
Submission received: 18 June 2021 / Revised: 20 July 2021 / Accepted: 24 July 2021 / Published: 30 July 2021

Abstract

:
Rampant loss of biodiversity and ecosystem services undermines the resilience of food systems. Robust knowledge on impacts is the first step to taking action, but long-distance food supply chains and indirect effects on and around farms make understanding impacts a challenge. This paper looks at the tools available for businesses in the food industry, especially retailers, to monitor and assess the biodiversity performance of their products. It groups tools according to their general scope to evaluate what is monitored (processes on-site, pressures on landscapes, impacts on species), at what scale (specific products, company performance, country-wide consumption levels), and compared to which baseline (pristine nature, alternative scenarios, governance targets). Altogether we find major gaps in the criteria for biodiversity or the criteria is weak in certification and standards, business accounting and reporting systems, and scientific modelling and analysis (biodiversity footprints). At the same time, massive investments have been made to strengthen existing tools, develop new ones, increase uptake and improve their effectiveness. We argue that business can and must take a leading role toward mitigating biodiversity impacts in partnership with policy makers and customers. Zero-deforestation commitments, for example, will need to be upheld by supporting changed practices in consumption (e.g., choice editing) and combating degradation within agricultural systems will require a shift toward more regenerative forms of farming (e.g., with norms embedded in robust standard systems). Operational targets are integral to monitoring biodiversity performance across all scales.

1. Introduction

Food systems are dependent on biodiversity and loss of biodiversity is causing harm and increasing risk for sustainable food systems. Simply put, biodiversity refers to the variety of life on Earth. It ranges from genetic to species to ecosystem diversity, all of which combined have enabled populations of species to interact, adapt and evolve. In food production systems, biodiversity is the basis for soil fertility, pollination, pest control and water security [1].
Sustainable food systems have been defined as: “a food system that delivers food security and nutrition for all in such a way that the economic, social, and environmental bases to generate food security and nutrition for future generations are not compromised” [2]. The authors of [3] emphasize that focusing primarily on food production alone is not solving food systems issues. While the world produces enough food to feed all of its population, almost 800 million people go hungry and 2 billion are malnourished [4]. The FAO estimates that by 2050, food production will have to increase by some 50% in order to satisfy the demands of a growing and wealthier population, with an increased demand for meat [5]. A food systems approach to policy making and implementation means promoting enhanced cooperation among food systems actors and addressing the drivers of both food production and consumption [3]. This is because consumer preferences—e.g., for processed livestock products and convenience fast foods—drive food production practices. The food industry, particularly as a “middleman” between farmers and consumers, has a critical role to play to develop, maintain and operate within sustainable food systems.
This is a particular challenge when long-distance supply chains displace impacts from consumers [6]. Roughly 25% to 50% of the total environmental impacts from consumption are estimated to be felt in regions other than where the consumption occurs [7]. For instance, 30% of global species threats [8] and 32% of the consumption of scarce water [9] have been linked with international trade. In particular, the consumption of imported coffee, tea, sugar, textiles, fish and other manufactured items leads to large “biodiversity footprints”. The authors of [10] found that agricultural products and food comprised around 50% of land-related impacts on biodiversity from EU household consumption in 2010. Further, most EU regions are already net importers of biodiversity losses and there is a shift from the domestic to foreign part of the biodiversity footprint with rising population density and income. The authors of [11] found that imports of industrialized nations play a key role in driving extinctions in tropical, biodiverse nations. This is because crops such as sugarcane, palm oil, rubber and coffee typically occupy biodiversity-rich regions, leading to disproportionately high biodiversity impacts on comparatively small areas.
Challenges are increasingly recognized by policy, business and consumers. Nearly all of the world’s governments united around the Convention on Biological Diversity (CBD) Global Strategic Plan for Biodiversity 2011–2020 and its twenty Aichi Biodiversity Targets, as well as the post-2020 global biodiversity framework. However, none of the Aichi Biodiversity targets were fully met, and for nearly one-third, development was either stagnant or worsening. In the EU, the recently adopted EU Biodiversity Strategy for 2030 aims to protect nature and reverse the degradation of ecosystems [12]. It is accompanied by the Farm to Fork Strategy with the aim of moving toward a more healthy and sustainable EU food system [13]. It proposes, e.g., the development of a sustainable food labelling framework that covers the nutritional, climate, environmental and social aspects of food products. The European Commission is also currently exploring regulatory and non-regulatory options for additional demand side measures to ensure deforestation-free supply chains. Many companies have also taken up this challenge on a voluntary basis. For example, in 2019 the Accountability Framework reported that commodity-specific disclosures (most were for timber, followed by palm oil, soy and cattle) on forest-related policies were made by 411 companies [14]. Nearly half of those companies committed to producing or sourcing commodities free of deforestation or ecosystem conversion. In practice, however, these commitments were found to lack consistency in scope, ambition and terminology. One key challenge was traceability. For example, only 16% of the companies disclosing on their soy-based supply chain were able to trace more than half of their volumes past the country level. The volume of uptake also hampers the effectiveness of zero-deforestation commitments for reducing deforestation. For example, the volume handled by committed companies comprises less than 12% of the global market for most commodities (primarily soy, cattle products and palm oil) [15]. This is indicative of a two-fold challenge for the food industry: improving monitoring capacities to efficiently trace products and increasing industry-wide uptake of commitments to garner effective results. This dual challenge not only refers to zero-deforestation commitments, but also to the monitoring and uptake of “biodiversity friendly” agricultural practices on and around farms. Both are urgently needed to make progress toward political targets and goals.
Altogether, there is strong consensus within the scientific community on the need to halt the further loss of biodiversity. This implies both zero land conversion from near-nature to far-from-nature types of land use [16,17,18,19], as well as the integration of ecosystem services into agricultural landscapes [20,21,22]. Robust knowledge on biodiversity impacts connected to specific products or supply chains is the first step to being able to make changes. This article aims to take stock of the current toolbox of methods available to companies in the food industry to monitor and assess the biodiversity performance of their products. We draw conclusions on the implications for business, policy and research.

2. Background: The Role of Food Systems in Biodiversity Conservation

The food industry has a role to play as regards two globally overarching aims: (1) halting biodiversity loss and (2) ensuring that biodiversity is able to provide core services that enable life on Earth. These aims lead to complementary approaches. It implies for (1) that halting land use change is a high priority in order to help preserve intact natural ecosystems rich in biodiversity. It means for (2) that integrating practices that help to preserve biodiversity on and around farms is crucial to ensuring ecosystem services over the long term.
As regards aim (1), the Intergovernmental Science-Policy Platform on Biodiversity and Ecosystem Services (IPBES) estimates that around 25% of species in animal and plant groups currently assessed are threatened [1]. Scientists estimate that globally there are 847 ecoregions, which are characterized by unique communities or groups of species not found elsewhere. Species extinctions at these local to regional levels even when not threatened globally, erode the ecosystem services essential to civilization in what some have described as a mass extinction event, the sixth in Earth’s history and the first induced by humans [23,24]. Land use change is the largest direct driver of biodiversity loss, with more than 80% of the threatened species on the IUCN Red List (mammals, birds, amphibians) under threat from habitat loss. Agricultural expansion is the biggest driver of land use change [25]. Over one-third of the terrestrial land surface is used for cropping or animal husbandry. A key indirect driver of land expansion for agriculture is shifts toward animal-based diets [26,27], possibly overriding population growth as the largest driver [28]. To put the extent of agricultural land into perspective, urban land area covers around 3% of the earth’s land surface (defined by administrative boundaries; built-up land area covers less than 1% of the earth’s land surface) [29].
Scientific consensus on the amount of land “available” for agriculture under sustainability considerations is growing. For example, in 2019 a commission of prominent world scientists came together to define scientific targets for the safe operating space of food systems for six key Earth system processes [16]. They estimated that it would be possible to provide healthy diets for an estimated global population of about 10 billion people by 2050 within their safe space framework. This healthy reference diet largely consists of vegetables, fruits, whole grains, legumes, nuts and unsaturated oils. It includes a low to moderate amount of seafood and poultry and no or a low quantity of red meat, processed meat, added sugar, refined grains and starchy vegetables. One quantitative target was the total global amount of cropland available that can be due to food production. It was estimated that this is 13 million km2, which can be translated to (globally) zero future land conversion of natural ecosystems into farmland. This strategy also complies with the biome boundary proposed by [18] in the overarching planetary boundaries context [30], the target of 0.20 hectares per person in 2030 proposed by [31], and is aligned with the growing calls for a “Global Deal for Nature” by scientists promoting more conservation areas [17,32,33].
As regards aim (2), the loss of diversity underpinning agricultural systems is seen as one of the most pressing challenges of this century. For example, more than 75% of global food crop types depend on animal pollination. With pollinator diversity in decline, up to USD 577 billion in annual crop output is under risk [1]. The loss of diversity within food production systems due to fewer varieties and breeds of plants and animals under cultivation, is also making agricultural systems less resilient against future climate change, pests and pathogens. For example, over 9% of domesticated breeds of mammals used for food and agriculture were extinct by 2016, with at least 1000 more under threat [34]. At the same time, agriculture is a major contributor to environmental impacts and biodiversity loss. Almost three-fourths of available freshwater resources are used for crop or livestock production and one-fourth of greenhouse gas emissions are from land clearing, crop production and fertilization [35]. Fertilizer run-off, for example, has led to more than 400 hypoxic zones or dead zones in freshwater and coastal ecosystems. Livestock production uses one-third of crop production for feed and three-quarters of agricultural land in total [36].
While the impacts as a whole are severe, widespread efforts to increase biodiversity and ecosystem services exist. For example, varied permaculture, agroforestry and agro-silvo-pastoral systems allow maintenance of biodiversity, lower degradation and increase ecosystem services. Agriculture can be shifted from a major source of degradation to a major source of regeneration [22,37,38,39,40]. It is estimated that small-scale (less than 2 hectares) farms produce around 30% of global crop production using 24% of land and with high agrobiodiversity [41]. Organic agriculture has increased over recent decades, including in larger-scale farming systems, and covered over 31 million hectares in 120 countries by 2006 [42]. The value of the global market for certified organic products was estimated to be around USD 80 billion in 2014 [43]. Ninety-one countries submitted reports to the FAO on the state of their biodiversity for food and agriculture and its management, focusing particularly on associated biodiversity and its role in the supply of supporting and regulating ecosystem services [44]. On the one hand, the report found that: “The use of a wide range of management practices and approaches regarded as favorable to the sustainable use and conservation of biodiversity for food and agriculture is reported to be increasing” [44]. On the other hand, the report concluded that: “Monitoring programmes for biodiversity for food and agriculture remain limited” [44]. This was found to be the case even in developed regions with dedicated research projects on the links between biodiversity and food supply. Altogether this implies that existing measures to incorporate and conserve biodiversity are not yet applied at large enough scales to be effective, and/or that they are systematically insufficient to solve the problem. Bad incentives may also counter efforts. For example, financial support for agriculture that is potentially harmful to nature amounted to USD 100 billion in 2015 in countries belonging to the OECD. Some subsidy reforms (e.g., to reduce unsustainable pesticide uses) have been introduced and multiple programs encouraging more sustainable practices exist. Clearly, the need for transformational change spans multiple stakeholders and systems.
Modelling from science supports the idea that a transformational shift in agricultural and food systems with positive outcomes on biodiversity is both possible and necessary [45]. For example, ref. [46] found that land use impacts from crop production, grazing and forestry together amounted to almost 60% of total worldwide loss of terrestrial ‘Mean Species Abundance’ up to 2010. Under a business-as-usual scenario, species loss would continue in the future, with the largest losses expected in sub-Saharan Africa. Under three alternative pathway scenarios, biodiversity would still be lost, but the scale of loss would be considerably less. The pathways—‘global technology pathway’, ‘decentralized solution’ and ‘consumption change’—were shown to have different potentials in different places. The authors of [47] came to similar conclusions regarding the potential to conserve biodiversity and the importance of regionally differentiated strategies. Their scenario of projected agricultural intensification would reduce the global biodiversity value of agricultural lands by 11% between 2000 and 2040. In contrast, spatial land use optimization scenarios reveal that 88% of projected biodiversity loss could be avoided through globally coordinated land use planning. Despite the unlikely implementation potential of such a measure, the study points to the huge efficiency gains possible through international cooperation. In 2018, around 60 experts in biodiversity and land use modelling joined efforts to illustrate the potential of innovative modelling techniques for informing robust science-based targets and conservation planning [48]. The study not only marked an important step forward toward mobilizing current knowledge from the land use and terrestrial biodiversity modelling communities, but also demonstrates the current capacities of the science community for codeveloping science-based business tools and monitoring approaches. For example, ref. [16] also developed a target for biodiversity loss (in terms of extinction rate) arguing that a key measure is the integration of a minimum of 10% of ecologically conserved land at fine scales (less than 1 km2) into agricultural systems. This would enable habitat connectivity and access to the services biodiversity provides to support food production. Evidence suggests, however, that this threshold has already been surpassed [49]. The authors of [20] propose a minimum habitat restoration target for working landscapes (e.g., farming, ranching and/or forestry) of at least 20%. They argue that such restoration increases the effectiveness of protected areas by offering corridors to connect wild populations across landscapes that might otherwise form barriers. Altogether, conserving biodiversity is integral to sustainable food systems and will require widespread changes in not only how food is produced, but also what food is produced at which scale.

3. Methods

There has been a mushrooming of approaches and tools to support companies in better assessing the biodiversity impacts connected to the production of consumer products. These approaches address different aspects of the challenge depending on multiple factors. For instance, is the company looking at where to invest or does it wish to monitor existing impacts across its current supply chains? Is the aim to support and track changes to farming practices on the field or is it to avoid indirect impacts, such as pressures related to land use change?
We applied a critical literature review to depict the scope, effectiveness and potential of approaches to monitor and report biodiversity. The literature review encompassed a broad range of literature related to the business community and more specifically focused on the agricultural sector and food industry. This broad scope was applied to draw relevant conclusions from a wider range of experience. The literature review encompassed not only scientific journals, but also a wide array of reports geared toward the business community. This form of literature review may have some bias in the selection of articles as well as the risk of missing some publications in the field, e.g., in comparison to a systematic review of academic literature utilizing automated software tools. However, as the purpose was to depict the state of activity and provide an informative resource for companies, this conventional form of critical review was judged the most suitable. Expert judgment was used to highlight findings from reputable sources. Three stakeholder workshops in context of the AKRIBI research project (https://www.uni-kassel.de/einrichtungen/cesr/forschungsprojekte/aktuelle-projekte/akribi.html; accessed on 10 June 2021) were also carried out, in which the results of the literature review were presented, discussed and ultimately updated.
This paper applies a breakdown of monitoring approaches into three broad categories: (1) certification and standards; (2) business guidelines and tools; and (3) biodiversity footprints. Each grouping provides a definition (what), an assessment of the state of development as regards both use and effectiveness for halting biodiversity loss and identifies challenges for greater uptake, integration and the ability to halt biodiversity loss. This grouping is not meant to be exclusive or exhaustive, but rather to provide a basis for assessing the broad scope of activities in general. It is a starting point for further exchange, knowledge sharing and innovation.

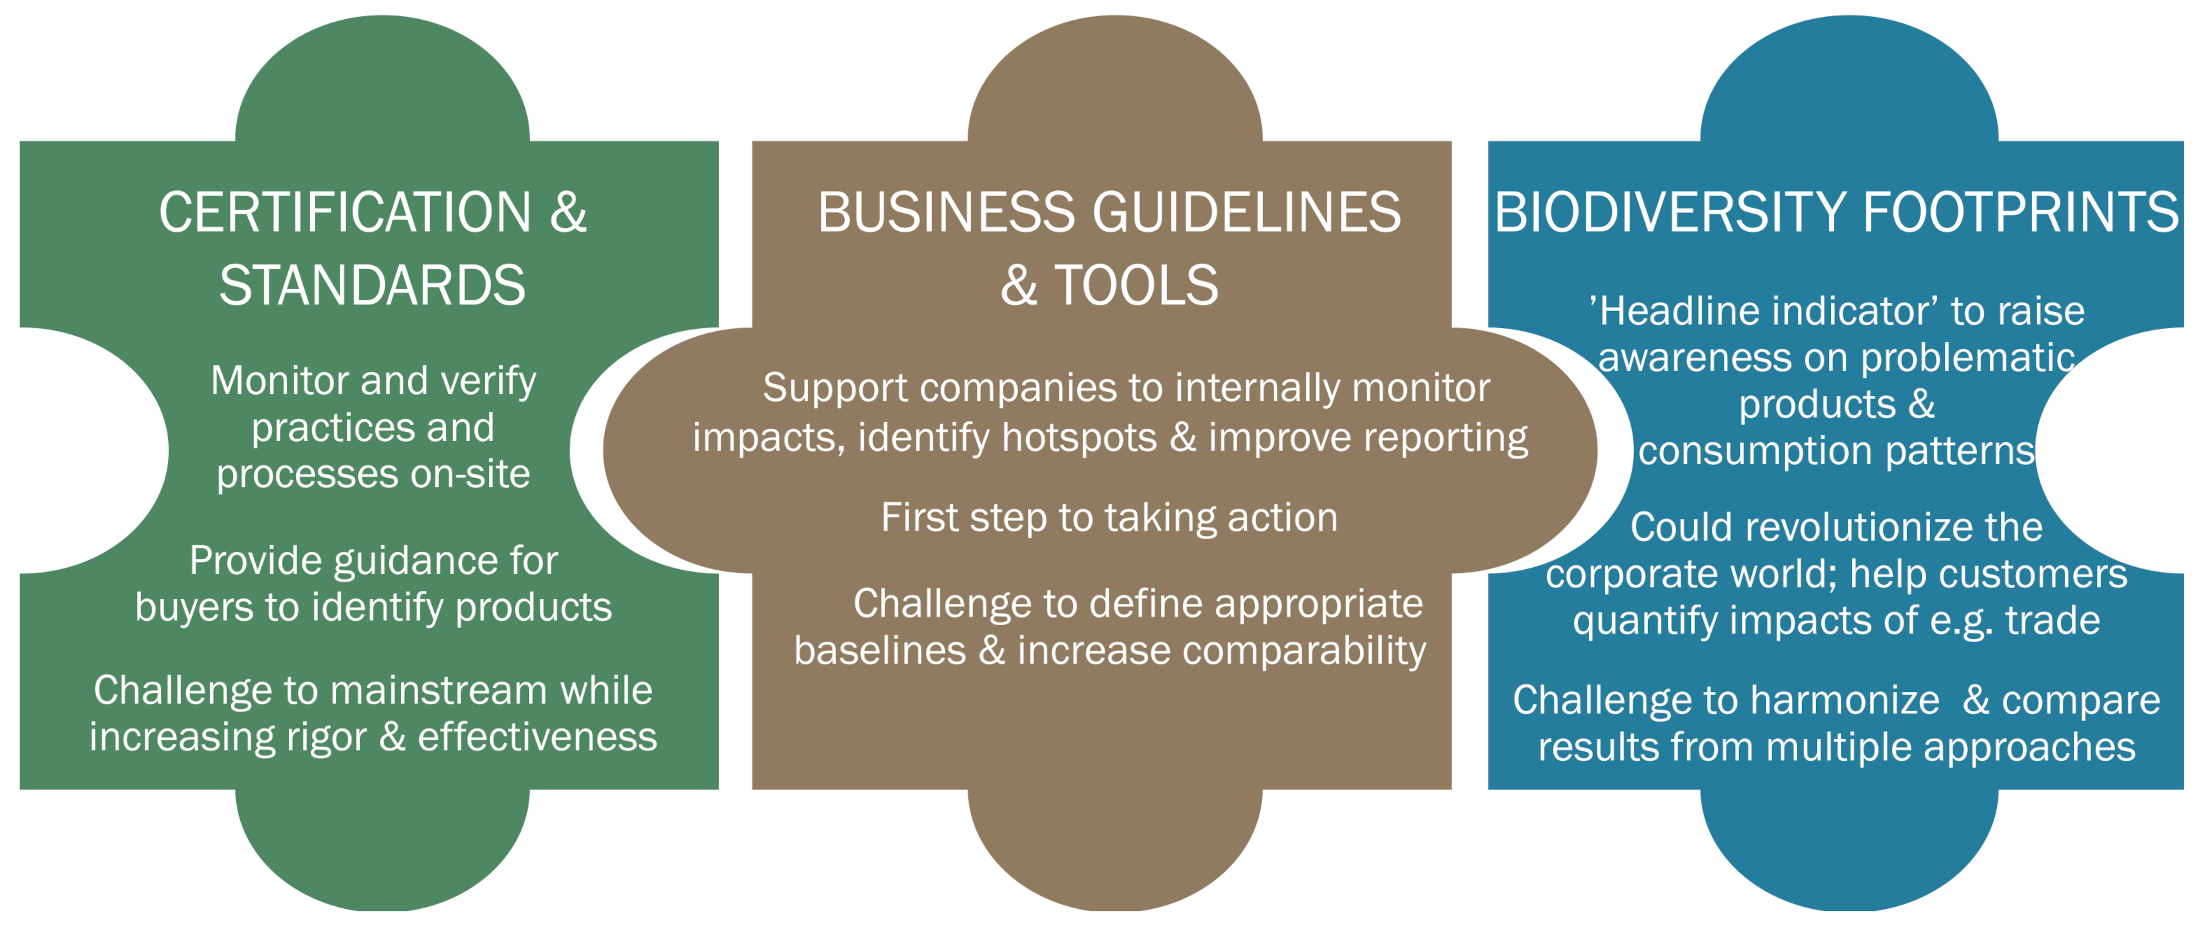
4. Findings: Biodiversity Accounting Approaches

Figure 1 depicts an overview of key findings in the complementary approaches assessed here.

4.1. Certification and Standards

In general, standards apply social, environmental and/or economic criteria by which producers and companies demonstrate that their performance meets best practice norms in primary production, processing, trading and consumption of goods. Standards are typically adopted voluntarily and paired with compliance verification, traceability systems and labels to differentiate preferable products in the marketplace. They may be used in a business-to-business context (e.g., Global G.A.P. or the Roundtable on Sustainable Palm Oil) or directed at the final consumer (e.g., Fairtrade or organic agriculture standards). The characteristic of verification is that auditors assess social and environmental practices and/or performance through on-site inspection, interviews, farm records and other corroborating information. One of the main goals of environmental advocates is to establish certification as a voluntary mechanism that would fill critical gaps in international environmental governance [50]. Indeed, certification has achieved substantial and growing market penetration, and it has garnered widespread and mainstream customer recognition in developed markets.
Environmental certification exists for a wide range of product and product lines. Most notably, cocoa, palm oil, tea and capture fisheries can now credibly claim to certify around one-tenth of global production [51]. Certified area for forests and marine schemes has increased greatly since 2000 [1]. However, despite the proliferation of standards in general, criteria for biodiversity remains weak. For example, in 2017, ref. [52] reported that the Ecolabel Index identifies 465 certification schemes across 199 countries and 25 industry sectors, of which only 10 specifically mention biodiversity.
Looking more specifically at the food industry, biodiversity is a rapidly growing and more prominent component of standards for major high-impact crops, but coverage of total agricultural land remains almost miniscule. For example, ‘The State of Sustainability Initiatives’ on Standards and Biodiversity reviewed 15 major international standard initiatives operating in the banana, cocoa, coffee, cotton, palm oil, soy, sugar, tea and cereals (rice, maize and wheat) sectors [53]. Across these sectors, commodity production compliant with one or more of the standards covered grew by 35% per annum between 2008 and 2014. In 2015, they reached an estimated trade value of USD 52.5 billion. In comparison, the average growth of conventional production over the same period was 3%. In the eight sectors where standards are most active (banana, cocoa, coffee, cotton, palm oil, soy, sugar and tea), the total area covered by standards reached 14.5 million hectares in 2014, accounting for less than 1% of global agricultural area. Even if certification covered 100% of these eight agricultural commodities (which make up the vast majority of certified product growth), only 12% of global agricultural land area would be covered. The study concluded that: “If voluntary standards are to play a major role in reducing the impacts of agriculture on biodiversity loss, they will have to, at a minimum, establish a significant presence among other crops—most notably, staple crops such as wheat, maize and rice” [53]. As regards land use change, the review found a clear emphasis on requirements directed toward habitat conservation. For example, 87% prohibited production on land recently converted from some or all types of forests and seven of the top ten requirements targeted habitat conservation.
A review of biodiversity in the standards and labels of the food sector came to similar conclusions, also finding that, so far, biodiversity criteria, in general, is weak. The study screened 54 standards and company requirements, covering all different types of standards and the most relevant global commodities for the European food market [54]. It encompassed a total number of 1263 criteria with relevance to biodiversity. They found some key examples of best practice, but also highlighted considerable gaps across standard and label schemes in general. For example, most of the standards do not include criteria addressing biodiversity beyond the immediate limits of the farm or company. Moreover, in most standards the determination of the starting point (baseline) is not required. However, a baseline is key to monitoring and assessing the impact of changed practices. Finally, although precise criteria and supply chain measures have been developed, there is a significant gap between the content ‘on paper’ and their implementation in practice. Active support for farmers who are responsible for implementing the measures is needed (e.g., training, regular visits, working groups, feedback channels, etc.). Group certifications, i.e., certifying a cooperative of smallholder producers, could also help to provide training and support while helping to avoid marginalization of smallholders. Furthermore, standards that require processes and methods for the management of biodiversity that fit into verification frameworks, i.e., measurable objectives and results, may be more cost-effective for auditors to verify. It means, in practice, focusing on the “potential created for biodiversity” [55].
However, a critical gap of product-based standards and labels, in general, is uncertainty on their effectiveness for conserving biodiversity and halting land use change. In other words, standards typically focus on production practices but do not measure the outputs or impacts of changed practices on biodiversity in the environment [56]. The authors of [57] addressed this question using a case study of coffee and cocoa. Certification of these crops has seen a rapid uptake in recent years, moving certified products well beyond their previous niche market status [58]. The authors of [59] report that 38% of global production for coffee and 22% of global production for cocoa use some form of certification scheme (including schemes that are not principally focused on biodiversity). However, ref. [57] found scant direct evidence of conservation effectiveness in their review of specific studies. They point out a spatial scale mismatch. This is the “incongruence between the scale at which farm management typically occurs and the scale at which key desired benefits are delivered” [57], based on [60,61]. For example, certification generally occurs at the unit of a single plantation or a group of smallholder farmers, but these are not necessarily connected to one another. This may limit benefits for landscape processes such as biological connectivity, watershed functions and other ecosystem services. The authors of [57] suggest two ways to address this challenge: (1) linking existing certification mechanisms with broader landscape approaches [62,63], and (2) adapting certification models to consider the landscape itself as the certified unit [64].
The authors of [51] assessed whether eco-labels prevent deforestation, finding that it is highly plausible that certification systems and eco-labels have “neither abetted, nor hindered, the conversion of forested land to agricultural production” [51]. Their study is based on the assessment of three case studies: the Roundtable on Responsible Soy (RTRS) in Brazil, the Roundtable on Sustainable Palm Oil (RSPO) in Indonesia and UTZ Certified cocoa in Côte d’Ivoire. They found strong evidence that coverage was insufficient to impact change and pointed to discouraging trends regarding a slow-down of certification in the future. An increase in ‘South-South’ trade may also slow coverage expansion due to lower levels of demand for higher priced goods with environmental certification. For example, around 12% of global banana production is certified, yet this constitutes more than 65% of globally traded bananas [53]. As regards Brazilian soy, rising demand from emerging economies—for soy as animal feed—is displacing demand from European countries with more stringent environmental sourcing commitments [65,66]. The availability of multiple and competing schemes may also drive down the stringency of standards in a race to the bottom to attract more customers [67,68]. For example, there is evidence of ‘Forum shopping’ in the Indonesian palm oil sector, where producers have supported the less demanding Indonesian Sustainable Palm Oil (ISPO) instead of the more stringent RSPO certification [69]. Significant loopholes in the content and enforcement of criteria also contributes to the mismatch between greater certification and deforestation effects. For example, partial certification allows companies to report on their selected sustainability credentials (with benefits for their reputation), while only actually changing practices on a portion of their operations. Putting a stop to such practices requires industry-wide consensus. Remote sensing and GIS data in real time could be further deployed to help monitor compliance with land conversion criteria [51].
Altogether, standards can and will likely continue to play an important role to address site specific management practices. A number of initiatives are underway to provide support and address the challenges identified in this article. For example, joint efforts to further develop and implement a ‘basic set of biodiversity criteria’ are underway in the EU Initiative, “Biodiversity in Standards and Labels for the Food Industry”. The Convention on Biological Diversity has also begun an initiative to develop a core set of commodity impact indicators for agricultural commodity production.

4.2. Business Guidelines and Tools

“Corporate reporting is a powerful tool for understanding and communicating a company’s value creation process and highlighting emerging risks and opportunities” [70]. Internal accounting and monitoring of biodiversity performance helps companies to identify their key impacts and take action to improve their performance. It also enables companies to improve transparency regarding their impacts and to report their achievements to both shareholders and customers. However, biodiversity accounting and reporting remain extremely limited. The challenge of scaling up successful approaches has been well recognized by both the scientific and business communities. Multiple initiatives, partnerships and platforms have been established to address this issue. Table 1 provides examples. Although not exhaustive, this table provides an overview of the scope of activity within the field.
Despite the recent massive proliferation of biodiversity-focused monitoring strategies for business, corporate biodiversity accountability is thought to be “very much in its infancy” [71]. For example, ref. [72] assessed the sustainability reports of the top 100 of the 2016 Fortune 500 Global companies. They found that only 5 businesses had commitments regarding biodiversity that could be classified as specific, measurable and time bound. This lack of quantitative indicators creates a challenge for comparing corporate performance [72]. By comparison, in 2015, 80% of the world’s largest 250 companies had made science-based climate commitments and disclosed information about carbon emission reductions in their sustainability reports [73]. Indeed, calls to align and harmonize sustainability reporting have been made by several organizations and coalitions [70]. While businesses are already reporting on their environmental performance within a variety of reporting schemes (e.g., EMAS and ISO 14001), these are often based on providing transparency rather than detailed measurement and monitoring of impacts. This is thought to be one of the reasons that Sustainable Development Goals (SDGs) 14 (‘life under water’) and 15 (‘life on land’) are the least well reported of the SDGs by companies. In other words, there is a perceived lack of indicators to enable that reporting [74]. In a review of how businesses measure their impacts on nature, one study found that many businesses “are not robustly assessing biodiversity and soil” [52].
Biodiversity monitoring is complex. At the same time, the conservation science community has been developing systems to monitor, evaluate and report on biodiversity outcomes from conservation activities for a long time. Much of this science has not yet reached the business world [71]. Nonetheless, there are many valuable lessons from such experiences. For example, ref. [71] aim to help businesses navigate the selection or development of indicators by putting them into the context of where they could be relevant for business activities. They introduce an overarching process designed to help businesses “know where to start, by asking the right questions upfront and seeking out existing indicators that could help measure and track their biodiversity performance” [71]. This process has many similarities with business decision-making frameworks (such as the Plan-Do-Check-Act process to guide the control and continual improvement of business processes [75]), environmental management systems and the Natural Capital Protocol. These all emphasize that indicators should always be built into larger management processes, with the initial scoping phases being critical for indicator development. Overall, biodiversity indicators should be both responsive to, and meaningful for, the business application.
In 2020, the IUCN developed “Guidelines for planning and monitoring corporate biodiversity performance” [76]. They also describe a process for companies to implement internally. Key is both the pressures-state-response framework for assessing biodiversity, and the need to develop dashboards to help companies monitor their own performance across supply chains. The ultimate aim is to use scalable linked indicators to measure a company’s biodiversity performance and support internal decision making and external disclosure. The use of scalable goals and indicators makes it possible to assess performance across multiple levels (from sites to supply chains to areas of operation), while also enabling aggregation at the corporate level for communication purposes. Examples of scalable indicators include “number of species” or “area under sustainable production”. These can be calculated and aggregated also to landscape, national, regional and global levels. The IUCN guidelines [76] define the ideal number of indicators as “the minimum number that answers the question: Has the goal or objective been achieved?” (based on [77]). This has two implications. First, dashboards may be useful for reporting. Second, setting corporate biodiversity goals is crucial to the monitoring process. Indeed, a clear, pre-defined reference is needed to measure biodiversity performance.
A number of tools are available to help businesses in general develop indicators for building up their dashboards (see Table 2). The authors of [74,78,79] review biodiversity accounting approaches for businesses and financial institutions. The reviews are considered works in progress with continuous updates by the EU Business @ Biodiversity Platform, with content inspired by joint work of the Aligning Biodiversity Measures for Business Initiative. Their focus is on biodiversity accounting approaches which rely on quantitative indicators. The list and short description of the 14 tools/approaches reviewed by [74] are distinguished with a star in Table 2.
The different metrics and aggregation approaches described in Table 2 meet different needs and answer different questions. They also may integrate the issue of time differently (e.g., annual indicators with time factored in versus static indicators). Definitions and the terminology used to describe transparent value chain boundaries, site level impact boundaries and baselines also vary between different measurement approaches and, in some cases, are not clear. These methodological differences are, however, crucial to the robustness, accuracy and interpretation of monitoring approaches. For example, “Site-based methodologies will give different results depending on how the boundaries around the assessment are drawn” [74]. There is also evidence that the baseline determined on-site changes whether targets are met, even under identical conditions. This is because the baseline is used as a measuring stick for tracking progress. At least four types of baselines can be considered: (a) state prior to the implementation of the project; (b) current state of biodiversity; (c) counterfactual scenario in which impacts are described relative to a plausible alternative state; and (d) state at an arbitrary date. Ultimately, a transparent mechanism for selecting appropriate references is key to achieving greater consistency between approaches
The authors of [74] further distinguish between two broad types of accounting approaches with implications for interpretation, data collection and supporting needs. The first approach assesses impacts on biodiversity directly. It relies both on on-site direct measurements (e.g., for species observation this could include video, capture and/or marking) and biodiversity data from global data sets, such as the IUCN species range maps. For example, companies are also starting to make good use of available global observation monitoring tools such as Global Forest Watch, SPOTT, GRAS and TRASE (see Table 3). The second approach uses models to link pressures and economic activities to biodiversity states. This is also key for footprints (see below). Some stakeholders argue that approaches based on models cannot be responsive to site level management intervention. However, this is also not their purpose (they are not designed, nor should they function as, e.g., standards). Site level data may be difficult and/or costly for some business applications (e.g., sector-wide impact assessment, supply risk analysis, portfolio risk assessment). In such cases, global data sets and extrapolations may be the only cost-effective means to measure the scale of biodiversity impacts. Improving the resolution and coverage of global data would help to address these challenges.
As regards the food industry specifically, studies have been undertaken to assess sector-specific challenges and opportunities and multiple tools are available, geared specifically to farming and biodiversity (Table 4 provides some examples). For example, in 2010, a best practices guide was developed to help point companies toward appropriate tools and methods for integrating biodiversity conservation in the food processing industry, the packaging industry and the food retail industry [81]. Altogether it found that “the food supply industry is characterized by few publications specific to the sector and its whole chain value and their relationships with biodiversity. The actions implemented to integrate biodiversity into food supply activities are more product-specific and no global guidelines dedicated to the sector have been published yet” [81]. Nonetheless, positive case studies of frontrunners were distinguished. In the last 10 years, much has happened. Many food companies have their own sourcing guidelines for suppliers and farmers and implement their own audits to control compliance. The authors of [54] present examples of good practice and map the current state of activity in this regard. The One Planet Program on Sustainable Food Systems published a report describing and mapping key existing methodologies and tools for biodiversity metrics in the food sector [80]. They came to similar results as [74], finding that many of the initiatives assessed were at least partly based on species counts (with some additionally including genetic or habitat approaches), included land use impacts as the most frequently assessed pressure (with water stress, pollution and climate change taken into account to varying degrees) and were still all ongoing (with most in pilot project stages). They further highlighted the diversity of approaches (objectives, evaluation scale, level of expertise required, etc.) relevant to different business needs which, combined, make an extensive and complementary toolkit. Nevertheless, “more work is required before biodiversity will be mainstreamed and systematically applied in business decision making” [80]. While the report argues against the perception that biodiversity is too complex to reliably monitor impacts, it also recognizes the urgent need to improve the data. In particular, the availability and suitability of data is a key area for research, including the adaption of data formats required for different assessment methods [80].

4.3. Biodiversity Footprints

Environmental footprints have become common measures to express environmental impacts and burdens of consumption and production activities. Common examples include ecological footprints, carbon footprints and water footprints. No universal definition exists, as each type of footprint addresses different impacts at different scales [82]. For example, one basic type of footprint can be used to answer the basic question “how much pressure” is exerted by the subject of interest? In other words, how much land, water, carbon, raw material, etc., is used in the production of a single product (product scale) or to supply the total consumption of, e.g., agricultural products of a country (national scale)? In the first case, results can be used to compare products with one another to identify potentially high impact products. Producers can use this information to adjust practices, retailers may shift sourcing and customers may change their purchasing behaviors. At a national level, knowledge on how much of a resource is consumed may allow policy makers to identify “overconsumption” in terms of environmental impacts and adjust policy frameworks and incentives (e.g., taxes, subsidies, R&D funding) accordingly. Overconsumption in this sense could imply that national consumption levels are above a “fair allocation” of the “safe operating space” threshold outlined by science. For example, ref. [31] estimated that 0.20 ha cropland per person would be available on average in 2030 within the safe operating space. In comparison, the EU cropland footprint of product consumption was estimated at 0.31 ha cropland per person in 2008 [83]. In this sense, biodiversity footprints would fit into the overarching framework of bioeconomy footprints for national monitoring [84]. In general, it can be said that biodiversity footprints aim to account for how much biodiversity is lost or put at risk for the production and consumption of specific products. This assessment takes place across the life cycle of those products and can be aggregated to, e.g., sector, corporation or country levels, depending on the aim of the monitoring. At all levels it can act as a ‘headline indicator’ to communicate pressures on biodiversity in one aggregated metric.
Indeed, [85] state that such a biodiversity footprint metric “is now poised to shake up the business world” [85]. The hope is that a biodiversity footprint will play a role similar to that of a carbon footprint for raising awareness and mobilizing action in business, policy, civil society and research. Monitoring and easy-to-understand communication were key first steps to trigging widespread innovation in the search for alternatives to, e.g., pollutive fossil fuels. Biodiversity footprints could help point to high-impact products and areas within the food system, helping to raise awareness, drive innovation, increase acceptance toward more sustainable supplies and drive demand toward more sustainable diets [16]. In [85], it is emphasized that a biodiversity footprint must be easy to estimate and to understand by non-specialists (transparency is crucial) and that it should represent biodiversity for itself. Indeed, “highly resolved information on biodiversity impact can galvanize support from consumer groups and provide information for particular interventions around specific species and risk hot spots” [86].
Biodiversity footprints can be applied and incorporated into company accounting and reporting. The financial sector, in particular, has shown high levels of interest into further developing biodiversity footprints. For example, ref. [87] review methods focused on the biodiversity footprint of the investments and loans of a financial institution. In this case, biodiversity footprints are used to assess risk in their asset portfolios. They also provide insight into potential trade-offs between one or more of the underlying environmental pressures. For example, a biodiversity footprint could show if the climate benefits of using biomass for energy leads to trade-offs with regard to land, water and biodiversity [88]. A generic footprint of a product or company is based on sector, product and/or country-wide averages in cases where the absence of data does not allow more precise calculations. Even in such cases, biodiversity footprints help investors to identify areas of high risk and support better balanced investment decisions. This suggests that while improving data accuracy is a priority for researchers, it should not obstruct the further development of methods for the business community.
How biodiversity footprints are measured depends on their intended use. In general, two basic methods exist: input-output (IO) oriented approaches to capture higher levels of aggregation (e.g., of sectors or countries) and life cycle analysis (LCA) oriented approaches focused more on the product level, with some hybrid approaches also in practice. IO tracks material flows within the economy. Models in this approach are generally based on matrixes with columns representing inputs to an industrial sector and rows representing outputs. Thus, they provide a mathematical representation of transactions between economic sectors and final demand categories. In ‘Environmentally Extended IO’, monetary IO tables are combined with accounts on environmental pressures, such as land use change induced biodiversity loss, in order to indicate the environmental performance of an economic sector or product group. The approach is methodologically well established. LCA focuses on the material flows and related environmental pressures of products. These are tracked and analyzed from the ‘cradle to the grave’, including, e.g., raw material consumption and emissions. Although LCA is a well-established method with international standards, it is still subject to further development. Models that aim to assess land use impacts have been continuously improved over the past two decades, in particular as regards biodiversity, but challenges remain [89]. Scientific assessments of biodiversity footprints from the agriculture sector, in particular, have increased in recent years. For example, ref. [8] calculated “implicated commodities” to look at the impacts of trade. Further seminal studies assess trade (e.g., [11,90]), identify hotspots (e.g., [91]), assess drivers (e.g., [10,92]) and derive policy recommendations (e.g., [86,93,94]). Further research focuses on improving methods, including, e.g., assessing indicators [95].
Initiatives for developing approaches and tools for business to calculate biodiversity footprints are underway (and there is overlap with many of the approaches presented above focused on the development of quantitative metrics; see also [96]). Many of these tools are in the pilot project stages. A broadly accepted metric for a biodiversity footprint does not yet exist (there is no equivalent of an IPCC endorsed carbon metric). Most focus on biodiversity rather than on ecosystem services, and account for species based on the indicators “Mean Species Abundance” (used, e.g., in IO-focused approaches) or on “Potentially Disappeared Fraction” of species (used, e.g., in LCA-based approaches).
For example, the Global Biodiversity Score is being developed to measure a company’s biodiversity footprint. The approach is reflective of other efforts in general and the report [85] provides a solid description and overview of the basic principles. Essentially, it shows how calculating the biodiversity footprint of a business requires creating a quantitative causal relationship between economic activities and their impacts on ecosystems. This is a two-step process. First, pressures (such as land use change) are linked to business activities (such as cropland expansion). This is done with, e.g., IO modelling or LCA. Second, the impacts of these pressures on ecosystems are estimated based on, in this case, the GLOBIO model [97]. The overriding principle is to calculate the contribution of raw materials—including agricultural commodities—production processes to drivers in order to deduce a footprint per quantity produced. In this way, a “footprint database” for all raw materials and by country is gradually compiled. For agricultural raw materials, this footprint database is the foundation for further evaluation. The data it contains is not based on the delineation of specific fields, but rather on “grid cells” of the terrestrial surface of the globe (e.g., it may be divided into 0.5° by 0.5° grid cells, about 54 km by 54 km at the equator). Different agricultural practices are assigned at the grid level. For example, data on national crop yields is obtained from FAO data. Five types of agricultural practices (corresponding to the five cropland types in GLOBIO) are differentiated. The biodiversity footprint of a commodity is then calculated based on, (1) the average national footprint previously calculated and (2) the share of production in the total agricultural area in that country [85]. This implies that the calculated footprint is based on generic practices instead of specific farming techniques on specific farms. The Global Biodiversity Score recognizes this dichotomy explicitly, stating: “is not intended to replace local indicators which are best suited to local or on-site biodiversity assessments” [85]. In a related approach, ref. [88] suggest the use of certification specific ‘impact correction factors’, e.g., for certified resources, but also recognize that “Even though the accuracy of the footprint may be limited due to a lack of company specific data, it offers valuable information for an investor that wants to address its potential impacts on biodiversity” [88].
An appropriate interpretation of results is needed, particularly when dealing with data with different levels of precision [88]. The choice of a baseline is critical to this. In other words, what should biodiversity footprints be compared to? For example, most uses of land will be a degradation compared to pristine nature, whereas most agricultural land uses will probably be an improvement if compared to practices like “slash and burn” agriculture. Reference values need to be derived and agreed upon, particularly in cases where the original vegetation shall no longer serve as a reference, with careful consideration of objectives, transparency and comparability. One challenge is the restoration of degraded soil, in which biodiversity could be improved. Also, ref. [88] suggest using multiple reference situations.
In a scientific assessment [91] quantified biodiversity impacts per kilogram of crop for over 160 individual crops from 250 different countries. The study made progress on LCA methods by combining high resolution yield and area maps of global crops with ecoregion specific ‘characterization factors’ for annual and permanent crops. Characterization factors indicate species loss caused by unit area of a particular land use. It was thus able to identify “the most damaging land use types causing high species loss for mammals, birds, amphibians, and reptiles globally and also on a regional scale at 5 arc minute resolution”. Aggregating the results to a country level and combining findings with trade data enabled [91] to assess biodiversity impacts associated with, for example, traded food commodities. Research to improve biodiversity and land use change integration into life cycle analysis approaches are in full swing. Three models account for spatialization: Impact World+ [98], ReCiPe [99] and LC-Impact [100]. Shortcomings regarding land use are being addressed [101]. Altogether, LCA “already deals with the potential biodiversity impacts of land use, but there are significant obstacles to overcome before its models grasp the full reach of the phenomena involved” [89]. Data uncertainty [102] is one obstacle which science is addressing. Further development of business tools may be expected to occur simultaneously.

5. Discussion

There are clear goals to halt biodiversity loss worldwide. These are becoming more pressing in the post-2020 global sustainability framework, and efforts to operationalize targets for the business context [103,104,105,106,107] have put the urgency and scale of the kind of action needed into perspective. Tools to better account for biodiversity and ecosystem services in products from the field to the shelves and on to the fork are the first step to understanding impacts and making change happen.

5.1. Approaches Are Complementary to Strengthen a System Perspective

Combined, the multiple approaches assessed here across different scales, with different stakeholders and in response to different needs, bring humanity closer to overarching sustainability goals. Transparency is key to acceptance of scientific data and for this reason it is important to keep methods and aims matched. Each of the general approaches assessed here have a role to play and should not be blurred by trying to capture all impacts and pressures with one method. Standards can particularly help to achieve a continuous improvement towards halting the loss of biodiversity on and beyond farms associated with on-site practices (promoting, e.g., regenerative agriculture, agroecological farming). To this end, biodiversity criteria must be strengthened in a way that balances rigor and transparency with accessibility and uptake. However, certification is not a tool well suited to halting land use change at higher landscape scales (this is also not what it was designed to do). The risk of indirect effects (such as farmland expansion) depends on the overall demand for land-based products. To this end, complementary approaches are needed to put food products in the context of overarching land use. For example, national level footprints (e.g., for agriculture and forest land consumption [84]) accompanied by national level targets (e.g., translated from the planetary boundary framework [31]) provide an overarching direction for policy instruments related, in particular, to market interventions and innovation support [108].
Identifying and addressing hot spots is the key focus of business guidelines promoting internal, process-oriented approaches to monitoring. These emphasize the need for companies to monitor their own biodiversity pressures and impacts. Multiple guidelines and tools have been published recently. Companies will be able to use this information to understand and mitigate risks in their supply chains, while customers, civil society and shareholders can use it to hold governments and businesses to account.
Biodiversity footprints are one tool for businesses to communicate the impacts of their products in a headline indicator. The results or lessons learned may be used for the design of new products. In comparison to other sectors, the food industry has high impacts on biodiversity [10]. This is to be expected as agriculture requires using land. Biodiversity footprints could help to approach the overarching objective of sustainable use of natural resources within planetary boundaries. Such a metric has the potential to unite global efforts. In this case, the method must be easy to understand, applicable, comparable and easy to implement.

5.2. Role of Actors and Partnerships to Apply Monitoring and Make Change Happen

This paper focused on monitoring approaches available to businesses. The degree of their success to initiate change depends on incentives provided by policy and the willingness of citizens to adjust their purchasing behaviors. Research must provide the tools and evidence for both in a robust and reliable way, as well as support innovation in promoting sustainability-driven social change. For example, the consumer responsibility principle, increasingly acknowledged in the climate change arena, could be further explored for biodiversity and ecosystem services.
Policy makers are, however, not yet fully considering the value of biodiversity and ecosystems services. As a consequence, food is often undervalued and food prices do not reflect the true cost of production [109]. The authors of [3] argue that “our paradigm of growth needs to broaden its boundaries beyond primary production and include efficiencies along the whole food chain, along with promotion of sustainable practices and diets”. A shift will require public-private partnerships and widespread awareness raising. Information campaigns informing citizens of the impacts of their consumption related to long-distance supply chains may be against the direct interest of some supply chains, but central to substitution, innovation and change in consumption practices. For example, the boom in demand for vegetarian meat alternatives in ‘Western’ countries and with young urban people is likely a result of growing knowledge related to the harmful impacts of excessive meat consumption. NGOs and investigative journalism also have a key role to play here. The widespread success of food documentaries has also certainly contributed to shifts in behaviors, e.g., the 2019 film The Game Changers grossed nearly USD 900,000 worldwide (https://www.boxofficemojo.com/release/rl3138094593/, Accessed 10 June 2021). Nonetheless, information campaigns alone are not enough. The authors of [16] describe a ladder of indicative interventions manageable by industry and governments from, e.g., providing information to choice editing.
Food retailers, as the last link of a globalized supply chain, may take on more responsibility in this sense. For example, a “no-go list” with products or ingredients which may not be sold could be one mechanism employed by food retailers to enforce commitments to, e.g., zero deforestation. Such no-go products could include substances of protected/endangered animals or plant species or products on which the production obviously violated nature conservation requirements [110]. In any case, implementing ethical supply chains is and should be a core focus for retailers. The ‘Accountability Framework Initiative’ argues that specific, measurable and time-bound commitments are an essential element of achieving ethical supply chains and communicating risks, opportunities and actions. Such commitments “provide direction and clarity on company goals, enable commitments to be pushed to upstream suppliers, and allow for clear communication of progress” [14]. In general, companies are starting to take notice and set such biodiversity commitments, but overall uptake remains very limited, even in relation to other corporate environmental commitments [111]. For example, most ‘No Net Loss’ commitments have been made by mining companies, followed by the energy and manufacturing sectors. Moreover, the effectiveness of business commitments also depends on strengthened public governance capacity. For example, in forest risk regions, this includes reductions in illegal land clearing, planting, smuggling and tax evasion. This again points to the importance of public-private partnerships. The ‘Tropical Forest Alliance’, for example, tackles the drivers of tropical deforestation using a range of market, policy and communications approaches [112]. Another option could be a “Zero-deforestation Zone”, where companies would commit to sourcing from jurisdictions that have established regional programs to reduce deforestation [113]. In any case, options exist and require public and private engagement [114].

6. Conclusions

The degree of change needed to ensure resilient and robust food systems operating within the planetary boundaries for biodiversity requires moving beyond incremental adjustments. There is widespread scientific consensus on the need for higher levels of ambition to keep food systems operating within planetary boundaries. Through new guidance, companies can now, e.g., “upscale” their impacts to cross-check with the planetary boundary target framework and/or gain support for setting their own targets aligned with global biodiversity goals. For the food industry, ethical supply chains—characterized by zero deforestation commitments and/or regenerative agriculture—could signal their dedication to shifting mindsets from “doing less bad” to “doing good”.
Businesses can take the lead toward sustainable food systems. The food industry is in a position to both demand higher levels of biodiversity inclusion from suppliers and help customers to make more sustainable choices (prioritization, no-go products, etc.). Business–science partnerships may help to develop appropriate monitoring tools and public–private partnerships could ensure that conditions for directional safe change will be met. Policy must get the incentives for change right. This means both a stronger dedication to actively promoting regenerative agriculture, as well as monitoring and, consequently, steering national consumption levels to reduce—instead of increase—global pressures on biodiversity. It requires leading a much broader information campaign directed at citizens and accompanied by a society-wide discussion on what constitutes excess and how biodiversity is valued and reflected in the price of products and services.
Altogether, to be able to meet sustainability goals, policy targets and voluntary commitments, businesses of the food industry must be equipped with the tools and means to efficiently and effectively monitor, evaluate and implement changes across their supply chains.

Author Contributions

Conceptualization, M.B.-O. and S.B.; methodology, M.B.-O. and S.B.; investigation, M.B.-O.; writing—original draft preparation, M.B.-O.; writing—review and editing, M.B.-O. and S.B.; visualization, M.B.-O.; funding acquisition, S.B. All authors have read and agreed to the published version of the manuscript.

Funding

This research was funded within the scope of the research project “Actor-oriented risk classification of origins of agricultural products based on global spatially differentiated impacts on biodiversity” (AKRIBI), funded within the FONA Research Initiative for the “Conservation of Biodiversity” of the German Federal Ministry of Education and Research grant agreement 01LC2003A.

Institutional Review Board Statement

Not applicable.

Informed Consent Statement

Not applicable.

Data Availability Statement

Data sharing not applicable.

Acknowledgments

We thank AKRIBI project partners for their work on the project, comments to the AKRIBI method paper and participation in organizing and contributing to the expert workshops. In particular, we would like to acknowledge the contributions and support of Marion Hammerl and Annekathrin Vogel (both Lake Constance Foundation), Stefan Seuring and Oliver Bischoff (both Faculty of Business and Economics, University of Kassel) and Vincent Egenolf and Amelie Meyer (both Center for Environmental Systems Research (CESR), University of Kassel). Any mistakes remain with the authors.

Conflicts of Interest

The authors declare no conflict of interest. The funders had no role in the design of the study; in the collection, analyses or interpretation of data; in the writing of the manuscript or in the decision to publish the results.

References

  1. Díaz, S.; Settele, J.; Brondízio, E.S.; Ngo, H.T.; Guèze, M.; Agard, J.; Arneth, A.; Balvanera, P.; Brauman, K.; Butchart, S.; et al. Summary for Policymakers of the Global Assessment Report on Biodiversity and Ecosystem Services of the Intergovernmental Science-Policy Platform on Biodiversity and Ecosystem Services; IPBES Secretariat: Bonn, Germany, 2019; 56p. [Google Scholar]
  2. HLPE. Food Losses and Waste in the Context of Sustainable Food Systems; A report by the High Level Panel of Experts on Food Security and Nutrition of the Committee on World Food Security: Rome, Italy, 2014. [Google Scholar]
  3. UNEP. Collaborative Framework for Food Systems Transformation: A Multi-Stakeholder Pathway for Sustainable Food Systems; One Planet Network Sustainable Food Systems Programme; UNEP: Paris, France, 2019; ISBN 978-92-807-3753-0. [Google Scholar]
  4. HLPE. Nutrition and Food Systems; A report by the High Level Panel of Experts on Food Security and Nutrition of the Committee on World Food Security: Rome, Italy, 2017. [Google Scholar]
  5. FAO. The Future of Food and Agriculture—Trends and Challenges; Food and Agriculture Organization of the United Nations: Rome, Italy, 2017. [Google Scholar]
  6. Erb, K.H.; Krausmann, F.; Lucht, W.; Haberl, H. Embodied HANPP: Mapping the spatial disconnect between global biomass production and consumption. Ecol. Econ. 2009, 69, 328–334. [Google Scholar] [CrossRef]
  7. Scholes, R.; Montanarella, L.; Brainich, A.; Barger, N.; ten Brink, B.; Cantele, M.; Erasmus, B.; Fisher, J.; Gardner, T.; Holland, T.G.; et al. Summary for Policymakers of the Thematic Assessment Report on Land Degradation and Restoration of the Intergovernmental Science-Policy Platform on Biodiversity and Ecosystem Services; IPBES Secretariat: Bonn, Germany, 2018. [Google Scholar]
  8. Lenzen, M.; Moran, D.; Kanemoto, K.; Foran, B.; Lobefaro, L.; Geschke, A. International trade drives biodiversity threats in developing nations. Nature 2012, 486, 109. [Google Scholar] [CrossRef] [PubMed]
  9. Lenzen, M.; Moran, D.; Bhaduri, A.; Kanemoto, K.; Bekchanov, M.; Geschke, A.; Foran, B. International trade of scarce water. Ecol. Econ. 2013, 94, 78–85. [Google Scholar] [CrossRef]
  10. Wilting, H.C.; Schipper, A.M.; Ivanova, O.; Ivanova, D.; Huijbregts, M.A.J. Subnational greenhouse gas and land-based biodiversity footprints in the European Union. J. Ind. Ecol. 2020, 25, 79–94. [Google Scholar] [CrossRef]
  11. Chaudhary, A.; Kastner, T. Land use biodiversity impacts embodied in international food trade. Glob. Environ. Chang. 2016, 38, 195–204. [Google Scholar] [CrossRef]
  12. European Commission. EU Biodiversity Strategy for 2030: Bringing Nature Back into our Lives; COM(2020) 380; European Commission: Brussels, Belgium, 2020. [Google Scholar]
  13. European Commission. A Farm to Fork Strategy for a Fair, Healthy and Environmentally-Friendly Food System; COM/2020/381; European Commission: Brussels, Belgium, 2020. [Google Scholar]
  14. AFi and CDP. Disclosure for a Deforestation Free Supply Chain: An Accountability Framework Baseline for 2020 and Beyond. Available online: https://accountability-framework.org/how-to-use-it/resources-library/disclosure-for-a-deforestation-free-supply-chain/ (accessed on 30 December 2020).
  15. Garrett, R.D.; Levy, S.; Carlson, K.; Gardner, T.A.; Godar, J.; Clapp, J.; Dauvergne, P.; Heilmayr, R.; le Polain de Waroux, Y.; Ayre, B.; et al. Criteria for effective zero-deforestation commitments. Glob. Environ. Chang. 2019, 54, 135–147. [Google Scholar] [CrossRef]
  16. Willet, W.; Rockström, J.; Loken, B.; Springmann, M.; Lang, T.; Vermeulen, S.; Garnett, T.; Tilman, D.; DeClerck, F.; Wood, A.; et al. Food in the Anthropocene: The EAT–Lancet Commission on healthy diets from sustainable food systems. Lancet 2019, 393, 447–492. [Google Scholar] [CrossRef]
  17. Wilson, E.O. Half Earth: Our Planet’s Fight for Life; Liveright Publishing Corporation: New York, NY, USA, 2016. [Google Scholar]
  18. Steffen, W.; Richardson, K.; Rockström, J.; Cornell, S.E.; Fetzer, I.; Bennett, E.M.; Biggs, R.; Carpenter, S.R.; de Vries, W.; de Wit, A.; et al. Planetary boundaries: Guiding human development on a changing planet. Science 2015, 347, 1259855. [Google Scholar] [CrossRef] [Green Version]
  19. Noss, R.F.; Dobson, A.P.; Baldwin, R.; Beier, P.; Davis, C.R.; Dellasala, D.; Francis, J.; Locke, H.; Nowak, K.; Lopez, R.; et al. Bolder thinking for conservation. Conserv. Biol. 2012, 26, 1–4. [Google Scholar] [CrossRef]
  20. Garibaldi, L.A.; Oddi, F.J.; Miguez, F.E.; Bartomeus, I.; Orr, M.C.; Jobbágy, E.G.; Kremen, C.; Schulte, L.A.; Hughes, A.C.; Bagnato, C.; et al. Working landscapes need at least 20% native habitat. Conserv. Lett. 2021, 14, e12773. [Google Scholar] [CrossRef]
  21. Simmonds, M.S.; Watson, J.E. Bold nature retention targets are essential for the global environment agenda. Nat. Ecol. Evol. 2018, 2, 1194–1195. [Google Scholar]
  22. DeClerck, F.; Jones, S.; Attwood, S.; Bossio, D.; Girvetz, E.; Chaplin-Kramer, B.; Enfors, E.; Fremier, A.K.; Gordon, L.J.; Kizito, F.; et al. Agricultural ecosystems and their services: The vanguard of sustainability? Curr. Opin. Environ. Sustain. 2016, 23, 92–99. [Google Scholar] [CrossRef] [Green Version]
  23. Ceballos, G.; Ehrlich, P.R.; Barnosky, A.D.; García, A.; Pringle, R.M.; Palmer, T.M. Accelerated modern human-induced species losses: Entering the sixth mass extinction. Sci. Adv. 2015, 1, e1400253. [Google Scholar] [CrossRef] [Green Version]
  24. Ceballos, G.; Ehrlich, P.R.; Dirzo, R. Biological annihilation via the ongoing sixth mass extinction signaled by vertebrate population losses and declines. Proc. Natl. Acad. Sci. USA 2017, 114, E6089–E6096. [Google Scholar] [CrossRef] [Green Version]
  25. MEA. Ecosystems and Human Well-Being: Synthesis; Millennium Ecosystem Assessment; Island Press: Washington, DC, USA, 2005. [Google Scholar]
  26. Alexander, P.; Rounsevell, M.D.A.; Dislich, C.; Dodson, J.R.; Engström, K.; Moran, D. Drivers for global agricultural land use change: The nexus of diet, population, yield and bioenergy. Glob. Environ. Chang. 2015, 35, 138–147. [Google Scholar] [CrossRef] [Green Version]
  27. Rask, K.J.; Rask, N. Economic development and food production-consumption balance: A growing global challenge. Food Policy 2011, 36, 186–196. [Google Scholar] [CrossRef]
  28. Kastner, T.; Rivas, M.J.I.; Koch, W.; Nonhebel, S. Global changes in diets and the consequences for land requirements for food. Proc. Natl. Acad. Sci. USA 2012, 109, 6868–6872. [Google Scholar] [CrossRef] [Green Version]
  29. Liu, Z.; He, C.; Zhou, Y.; Wu, J. How much of the world’s land has been urbanized really? A hierarchical framework for avoiding confusion. Landsc. Ecol. 2014, 29, 763–771. [Google Scholar] [CrossRef]
  30. Rockström, J.; Steffen, W.; Noone, K.; Persson, A.; Chapin, F.S., III; Lambin, E.F.; Lenton, T.M.; Scheffer, M.; Folke, C.; Schellnhuber, H.J.; et al. A safe operating space for humanity. Nature 2009, 461, 472–475. [Google Scholar] [CrossRef]
  31. Bringezu, S.; Schütz, H.; Pengue, W.; O’Brien, M.; Garcia, F.; Sims, R.; Howarth, R.; Kauppi, L.; Swilling, M.; Herrick, J. Assessing Global Land Use: Balancing Consumption with Sustainable Supply; A Report of the Working Group on Land and Soils of the International Resource Panel; UNEP: Paris, France, 2014. [Google Scholar]
  32. Dinerstein, E.; Olson, D.; Joshi, A.; Vynne, C.; Burgess, N.D.; Wikramanayake, E.; Hahn, N.; Palminteri, S.; Hedao, P.; Noss, R.; et al. An Ecoregion-based approach to protecting half of the terrestrial realm. BioScience 2017, 67, 534–545. [Google Scholar] [CrossRef]
  33. Locke, H. Nature Needs Half: A necessary and hopeful new agenda for protected areas. Parks 2013, 19, 9–18. [Google Scholar] [CrossRef]
  34. IPBES. The IPBES Regional Assessment Report on Biodiversity and Ecosystem Services for Asia and the Pacific; Karki, M., Senaratna Sellamuttu, S., Okayasu, S., Suzuki, W., Eds.; Secretariat of the Intergovernmental Science-Policy Platform on Biodiversity and Ecosystem Services: Bonn, Germany, 2018; 612p. [Google Scholar]
  35. Burney, J.A.; Davis, S.J.; Lobell, D.B. Greenhouse gas mitigation by agricultural intensification. Proc. Natl. Acad. Sci. USA 2010, 107, 12052–12057. [Google Scholar] [CrossRef] [Green Version]
  36. Ranganathan, J.; Vennard, D.; Waite, R.; Lipinski, B.; Searchinger, T.; Dumas, P. Shifting Diets for a Sustainable Food Future (Creating a Sustainable Food Future No. 11; World Resources Institute: Washington, DC, USA, 2016. [Google Scholar]
  37. TEEB. TEEB for Agriculture and Food: An Interim Report; United Nations Environment Programme: Geneva, Switzerland, 2015. [Google Scholar]
  38. Kremen, C. Reframing the land-sparing/land-sharing debate for biodiversity conservation. Ann. N. Y. Acad. Sci. 2015, 1355, 52–76. [Google Scholar] [CrossRef]
  39. Moraine, M.; Lumbroso, S.; Piux, X. A Comprehensive Outlook on the Diversity of Agroecological Initiatives in Europe: From Farming Systems to Food Systems, IDDRI and European Forum on Nature Conservation and Pastoralism with the support of Fondation pour le Progrès de l’Homme. 2016. Available online: https://www.iddri.org/sites/default/files/import/publications/rapport-tyfa.pdf (accessed on 30 December 2020).
  40. Loconto, A.; Jimenez, A.; Vandecandelaere, E.; Tartanac, F. What might an “agroecological” food system look like? In Sustainable Value Chains for Sustainable Food Systems; Workshop of the FAO/UNEP Programme on Sustainable Food Systems: Rome, Italy, 2016. [Google Scholar]
  41. Ricciardi, V.; Ramankutty, N.; Mehrabi, Z.; Jarvis, L.; Chookolingo, B. How much of the world’s food do smallholders produce? Glob. Food Secur. 2018, 17, 64–72. [Google Scholar] [CrossRef]
  42. Alexandros, N.; Bruinsma, J.; Bodeker, G.; Broca, S.; Ottaviani, M. World Agriculture Towards 2030/2050; Food and Agriculture Organization of the United Nations: Rome, Italy, 2012. [Google Scholar]
  43. Willer, H.; Lernoud, J. The World of Organic Agriculture—Statistics and Emerging Trends 2016; Research Institute of Organic Agriculture (FiBL), IFOAM—Organics International: Bonn, Germany; Frick, Switzerland, 2016. [Google Scholar]
  44. FAO. The State of the World’s Biodiversity for Food and Agriculture; Bélanger, J., Pilling, D., Eds.; FAO Commission on Genetic Resources for Food and Agriculture Assessments: Rome, Italy, 2019; 572p. [Google Scholar]
  45. Poore, J.; Nemecek, T. Reducing food’s environmental impacts through producers and consumers. Science 2018, 360, 987–992. [Google Scholar] [CrossRef] [Green Version]
  46. Kok, M.T.J.; Alkemade, R.; Bakkenes, M.; van Eerdt, M.; Janse, J.; Mandryk, M.; Kram, T.; Lazarova, T.; Meijer, J.; van Oorschrot, M.; et al. Pathways for agriculture and forestry to contribute to terrestrial biodiversity conservation: A global scenario-study. Biol. Conserv. 2018, 221, 137–150. [Google Scholar] [CrossRef]
  47. Egli, L.; Meyer, C.; Scherber, C.; Kreft, H.; Tscharntke, T. Winners and loser of national and global efforts to reconcile agricultural intensification and biodiversity conservation. Glob. Chang. Biol. 2018, 24, 2212–2228. [Google Scholar] [CrossRef]
  48. Leclère, D.; Obersteiner, M.; Alkemade, R.; Almond, R.; Barrett, M.; Bunting, G.; Burgess, N.; Butchart, S.; Chaudhary, A.; Cornell, S.; et al. Towards Pathways Bending the Curve Terrestrial Biodiversity Trends within the 21st Century; IIASA: Laxenburg, Austria, 2018. [Google Scholar] [CrossRef]
  49. Newbold, T.; Hudson, L.N.; Arnell, A.P.; Contu, S.; De Palma, A.; Ferrier, S.; Hill, S.L.L. Has land use pushed terrestrial biodiversity beyond the planetary boundary? A global assessment. Science 2016, 353, 289–291. [Google Scholar] [CrossRef]
  50. Steering Committee of the State-of-Knowledge Assessment of Standards and Certification. Toward Sustainability: The Roles and Limitations of Certification; RESOLVE, Inc.: Washington, DC, USA, 2012. [Google Scholar]
  51. Van der Ven, H.; Rothacker, C.; Cashore, B. Do eco-labels prevent deforestation? Lessons from non-state market driven governance in the soy, palm oil, and cocoa sectors. Glob. Environ. Chang. 2018, 52, 141–151. [Google Scholar] [CrossRef]
  52. Di Fonzo, M.; Hime, S. How Businesses Measure Their Impacts on Nature: A Gap Analysis; Working Paper 01/2017; University of Cambridge Institute for Sustainability Leadership (CISL): Cambridge, UK, 2017. [Google Scholar]
  53. Potts, J.; Voor, V.; Lynch, M.; Mammadova, A. Standards and Biodiversity: Thematic Review; The International Institute for Sustainable Development: Winnipeg, MB, Canada, 2017. [Google Scholar]
  54. LCF; GNF; Solagro; FGN; IST. Baseline Report. Biodiversity in Standards and Labels for the Food Sector; Global Nature Fund, the Lake Constance Foundation, EU LIFE Programme: Brussels, Belgium, 2017. [Google Scholar]
  55. LCF; GNF; FGN; Solagro; IST; GoodForGood. Recommendations to Improve Biodiversity Protection in Policy and Criteria of Food Standards and Sourcing Requirements of Food Companies and Retailers; EU LIFE Programme Food & Biodiversity. 2017. Available online: https://www.business-biodiversity.eu/en/recommendations-biodiversity-in-standards (accessed on 10 December 2020).
  56. Dankers, C.; Liu, P. Environmental and Social Standards, Certification and Labelling for Cash Crops; FAO: Rome, Italy, 2003. [Google Scholar]
  57. Tscharntke, T.; Milder, J.C.; Schroth, G.; Clough, Y.; DeClerck, F.; Waldron, A.; Rice, R.; Ghazoul, J. Conserving biodiversity through certification of tropical agroforestry crops at local and landscape scales. Conserv. Lett. 2015, 8, 14–23. [Google Scholar] [CrossRef] [Green Version]
  58. Millard, E. Incorporating agroforestry approaches into commodity value chains. Environ. Manag. 2011, 48, 365–377. [Google Scholar] [CrossRef] [PubMed]
  59. Potts, J.; Lynch, M.; Wilkings, A.; Huppé, G.A.; Cunningham, M.; Voora, V. (Eds.) The State of Sustainability Initiatives Review 2014: Standards and the Green Economy; IISD: Winnipeg, MB, Canada; IIED: London, UK, 2014. [Google Scholar]
  60. Edward, D.P.; Laurance, S.G. Green labelling, sustainability and the expansion of tropical agriculture: Critical issues of certification schemes. Bio. Conserv. 2012, 151, 60–64. [Google Scholar] [CrossRef]
  61. Fremier, A.K.; DeClerck, F.; Bosque-Perez, N.A.; Estrada Carmona, N.; Hill, R.; Joyal, T.; Keesecker, L.; Zion Klos, R.; Martínez-Salinas, A.; Niemeyer, R.; et al. Understanding spatial-temporal lags in ecosystem services to improve incentive mechanisms and governance. BioScience 2013, 63, 472–482. [Google Scholar] [CrossRef]
  62. Sayer, J.; Sunderland, T.; Ghazoul, J.; Pfund, J.L.; Sheil, D.; Meijaard, E.; Venter, M.; Boedhihartono, A.K.; Day, M.; Garcia, C.; et al. Ten principles for a landscape approach to reconciling agriculture, conservation, and other competing land uses. Proc. Natl. Acad. Sci. USA 2013, 110, 8349–8356. [Google Scholar] [CrossRef] [Green Version]
  63. Milder, J.C.; Hart, A.K.; Dobie, P.; Minai, J.; Zaleski, C. Integrated landscape initiatives for African agriculture, development, and conservation: A region-wide assessment. World Dev. 2014, 54, 68–80. [Google Scholar] [CrossRef]
  64. Ghazoul, J.; Garcia, C.; Kushalappa, C.G. Landscape labelling: A concept for next-generation payment for ecosystem service schemes. For. Ecol. Manag. 2009, 258, 1889–1895. [Google Scholar] [CrossRef]
  65. Schleifer, P. Private regulation and global economic change: The drivers of sustainable agriculture in Brazil. Governance 2017, 30, 687–703. [Google Scholar] [CrossRef]
  66. WWF. Soy Scorecard: Assessing the Use of Responsible Soy for Animal Feed; WWF: Gland, Switzerland, 2016. [Google Scholar]
  67. Mutersbaugh, T. Fighting standards with standards: Harmonization, rents, and social accountability in certified agrofood networks. Environ. Plan. A 2005, 37, 2033–2051. [Google Scholar] [CrossRef]
  68. Taylor, P.L. In the market but not of it: Fair trade coffee and forest stewardship council certification as market-based social change. World Dev. 2005, 33, 129–147. [Google Scholar] [CrossRef]
  69. Anderson, Z.R.; Kusters, K.; McCarthy, J.; Obidzinski, K. Green growth rhetoric versus reality: Insights from Indonesia. Glob. Environ. Chang. Part A 2016, 38, 30–40. [Google Scholar] [CrossRef]
  70. WBCSD. Reporting Matters: Navigating the Landscape: A Path Forward for Sustainability Reporting; World Business Council for Sustainable Development: Genf, Switzerland, 2019; ISBN 978-940521-77-7. [Google Scholar]
  71. Addison, P.F.E.; Carbone, G.; McCormick, N. The Development and Use of Biodiversity Indicators in Business: An Overview; IUCN: Gland, Switzerland, 2018; 16p. [Google Scholar]
  72. Addison, P.F.E.; Bull, J.W.; Milner-Gulland, E.J. Using conservation science to advance corporate biodiversity accountability. Conserv. Biol. 2019, 33, 307–318. [Google Scholar] [CrossRef] [Green Version]
  73. KPMG. Currents of Change: The KPMG Survey of Corporate Responsibility Reporting 2015; KPMG International: Amstelveen, The Netherlands, 2015. [Google Scholar]
  74. Lammerant, J.; Grigg, A.; Dimitrijevic, J.; Leach, K.; Brooks, S.; Burns, A.; Berger, J.; Houdet, J.; van Oorschot, M.; Goedkoop, M. Assessment of Biodiversity Measurement Approaches for Businesses and Financial Institutions; Update Report 2; EU Business @ Biodiversity Platform. 2019. Available online: https://ec.europa.eu/environment/biodiversity/business/index_en.htm (accessed on 10 December 2020).
  75. BSI (The British Standard Institution). Environmental Management Systems; BS EN ISO 14001: Frankfurt, Germany, 2015. [Google Scholar]
  76. Stephenson, P.J.; Carbone, G. Guidelines for Planning and Monitoring Corporate Biodiversity Performance; Draft Version for Public Comments; IUCN: Gland, Switzerland, 2020. [Google Scholar]
  77. Kusek, J.Z.; Rist, R.C. Ten Steps to a Results-Based Monitoring and Evaluation System: A Handbook for Development Practitioners; World Bank: Washington, DC, USA, 2004. [Google Scholar]
  78. Lammerant, J. Assessment of Biodiversity Accounting Approaches for Business; Discussion paper for EU Business @ Biodiversity Platform; Draft Report; Arcadis: Amsterdam, The Netherlands, 2018. [Google Scholar]
  79. Lammerant, J.; Starkey, M.; De Horde, A.; Bor, A.-M.; Driesen, K.; Vanderheyden, G. Assessment of Biodiversity Measurement Approaches for Businesses and Financial Institutions; Update Report 3 on behalf of the EU Business @ Biodiversity Platform. 2021. Available online: https://ec.europa.eu/environment/biodiversity/business/index_en.htm (accessed on 20 March 2021).
  80. Neveux, G.; Rabaud, S.; Asselin, A.; Attwood, S.; Remans, R.; Bos, G.; Duramy, J.; Bowers, K.; Mila I Canals, L.; Cranston, G.; et al. Technical Report on Existing Methodologies and Tools for Biodiversity Metrics; Core Initiative on Biodiversity One Planet Program on Sustainable Food Systems. 2018. Available online: https://www.oneplanetnetwork.org/resource/technical-report-existing-methodologies-tools-biodiversity-metrics (accessed on 1 December 2020).
  81. Business and Biodiversity Platform. Food Supply Sector and Biodiversity Conservation: Best Practice Benchmarking; Outcome of a workshop by the European Union Business and Biodiversity Platform. 2010. Available online: https://ec.europa.eu/environment/archives/business/assets/pdf/sectors/Food_Supply_Best%20Pratice%20Benchmarking_Final.pdf (accessed on 10 December 2020).
  82. Fang, K.; Song, S.; Heijungs, R.; de Groot, S.; Dong, L.; Song, J.; Wiloso, E.I. The footprint’s fingerprint: On the classification of the footprint family. Curr. Opin. Environ. Sustain. 2016, 23, 54–62. [Google Scholar] [CrossRef]
  83. Bringezu, S.; O’Brien, M.; Schütz, H. Beyond biofuels: Assessing global land use for domestic consumption of biomass: A conceptual and empirical contribution to sustainable management of global resources. Land Use Policy 2012, 29, 224–232. [Google Scholar] [CrossRef]
  84. Bringezu, S.; Distelkamp, M.; Lutz, C.; Wimmer, F.; Schaldach, R.; Hennenberg, K.J.; Böttcher, H.; Egenolf, V. Environmental and socioeconomic footprints of the German bioeconomy. Nat. Sustain. 2021, 1–9. [Google Scholar] [CrossRef]
  85. CDC Biodiversité. Global Biodiversity Score: Measuring a Company’s Biodiversity Footprint; BIODIV’ 2050 Outlook; Club B4B+: Paris, France, 2017; 44p. [Google Scholar]
  86. Green, J.M.H.; Croft, S.A.; Durán, A.P.; Balmford, A.P.; Burgess, N.D.; Fick, S.; Gardner, T.A.; Godar, J.; Suavet, C.; Virah-Sawmy, M.; et al. Linking global drivers of agricultural trade to on-the-ground impacts on biodiversity. Proc. Natl. Acad. Sci. USA 2019, 116, 23202–23208. [Google Scholar] [CrossRef] [Green Version]
  87. Berger, J.; Goedkoop, M.J.; Broer, W.; Nozeman, R.; Grosscurt, C.D.; Bertram, M.; Cachia, F. Common Ground in Biodiversity Footprint Methodologies for the Financial Sector: Working Paper; Les cahiers de biodiv’2050 No. 12; Mission Économie de la Biodiversité, CDC Biodiversité: Paris, France, 2018; Available online: https://www.mission-economie-biodiversite.com/english (accessed on 10 December 2020).
  88. PBAF. Paving the Way Towards a Harmonized Biodiversity Accounting Approach for the Financial Sector; Partnership for Biodiversity Accounting Financials. 2020. Available online: https://pbafglobal.com/files/downloads/PBAF_commongroundpaper2020.pdf (accessed on 10 December 2020).
  89. Souza, D.M.; Teixeira, R.F.M.; Ostermann, O.P. Assessing biodiversity loss due to land use with Life Cycle Assessment: Are we there yet? Glob. Chang. Biol. 2015, 21, 32–47. [Google Scholar] [CrossRef] [Green Version]
  90. Pendrill, F.; Persson, U.M.; Godar, J.; Kastner, T.; Moran, D.; Schmidt, S.; Wood, R. Agricultural and forestry trade drives large share of tropical deforestation emissions. Glob. Environ. Chang. 2019, 56, 1–10. [Google Scholar] [CrossRef]
  91. Chaudhary, A.; Verones, F.; de Baan, L.; Hellweg, S. Quantifying Land Use Impacts on Biodiversity: Combining Species—Area Models and Vulnerability Indicators. Environ. Sci. Technol. 2015, 49, 9987–9995. [Google Scholar] [CrossRef] [PubMed]
  92. Koslowski, M.; Moran, D.D.; Tisserant, A.; Verones, F.; Wood, R. Quantifying Europe’s biodiversity footprints and the role of urbanization and income. Glob. Sustain. 2020, 3, 1–12. [Google Scholar] [CrossRef] [Green Version]
  93. Godar, J.; Persson, U.M.; Tizado, E.J.; Meyfroidt, P. Towards more accurate and policy relevant footprint analyses: Tracing fine-scale socio-environmental impacts of production to consumption. Ecol. Econ. 2015, 112, 25–35. [Google Scholar] [CrossRef]
  94. Godar, J.C.; Suavet, T.; Gardner, A.; Dawkins, E.; Meyfroidt, P. Balancing detail and scale in assessing transparency to improve the governance of agricultural commodity supply chains. Environ. Res. Lett. 2016, 11, 035015. [Google Scholar] [CrossRef] [Green Version]
  95. Marquardt, S.G.; Guindon, M.; Wilting, H.C.; Steinmann, Z.J.N.; Sim, S.; Kulak, M.; Huijbregts, M.A.J. Consumption-based biodiversity footprints-do different indicators yield different results? Ecol. Indic. 2019, 103, 461–470. [Google Scholar] [CrossRef] [Green Version]
  96. IUCN. A Compass for Navigating the World of Biodiversity Footprinting Tools: An Introduction for Companies and Policymakers; The National Committee of the Netherlands of the International Union for the Conservation of Nature (IUCB)—IUCN NL: Amsterdam, The Netherlands, 2020. [Google Scholar]
  97. Alkemade, R.; van Oorschot, M.; Miles, L.; Nellemann, C.; Bakkenes, M.; ten Brink, B. GLOBIO3: A Framework to Investigate Options for Reducing Global Terrestrial Biodiversity Loss. Ecosystems 2009, 12, 374–390. [Google Scholar] [CrossRef] [Green Version]
  98. Bulle, C.; Margni, M.; Patouillard, L.; Boulay, A.M.; Bourgault, G.; De Bruille, V.; Cao, V.; Hauschild, M.; Henderson, A.; Humbert, S.; et al. IMPACT World+: A globally regionalized life cycle impact assessment method. Int. J. Life Cycle Assess. 2019, 24, 1653–1674. [Google Scholar] [CrossRef] [Green Version]
  99. Huijbregts, M.A.J.; Steinmann, Z.J.N.; Elshout, P.M.F.; Stam, G.; Verones, F.; Vieira, M.; Zijp, M.; Hollander, A.; van Zelm, R. ReCiPe 2016: A harmonized life cycle impact assessment method at midpoint and endpoint level—Report 1: Characterization. Int. J. Life Cycle Assess. 2017, 22, 138–147. [Google Scholar] [CrossRef]
  100. Verones, F.; Hellweg, S.; Azevedo, L.B.; Chaudhary, A.; Cosme, N.; Fantke, P.; Goedkoop, M.; Hauschild, M.; Laurent, A.; Mutel, C.L.; et al. LC-Impact Version 0.5; LC-Impact Project. 2016, pp. 1–143. Available online: https://lc-impact.eu (accessed on 30 December 2020).
  101. Curran, M.; de Souza, D.M.; Assumpcio, A.; de Melo, T.R.; Michelsen, O.; Vidal-Legaz, B.; Sala, S.; Canals, L.M.i. How well does LCA model land use impacts on biodiversity? A comparison with approaches from ecology and conservation Environmental science and technology. Am. Chem. Soc. 2016, 50, 2782–2795. [Google Scholar]
  102. Meyer, C.; Weigelt, P.; Kreft, H. Multidimensional biases, gaps and uncertainties in global plant occurrence information. Ecol. Lett. 2016, 19, 992–1006. [Google Scholar] [CrossRef]
  103. SBTN. Science-Based Targets for Nature Initial Guidance for Business. 2020. Available online: https://sciencebasedtargetsnetwork.org/resources/ (accessed on 30 December 2020).
  104. CISL. Linking Planetary Boundaries to Business: The First White Paper in Kering’s Series on Planetary Boundaries for Business; University of Cambridge Institute for Sustainability Leadership: Cambridge, UK, 2019. [Google Scholar]
  105. Clift, R.; Sim, S.; King, H.; Chenoweth, J.L.; Christie, I.; Clavreul, J.; Mueller, C.; Posthuma, L.; Boulay, A.M.; Chaplin-Kramer, R.; et al. The challenges of applying Planetary Boundaries as a basis for strategic decision-making in companies with global supply chains. Sustainability 2017, 9, 279. [Google Scholar] [CrossRef] [Green Version]
  106. Häyhä, T.; Lucas, P.L.; van Vuuren, D.P.; Cornell, S.E.; Hoff, H. From Planetary Boundaries to national fair shares of the global safe operating space—How can scales be bridged? Glob. Environ. Chang. 2016, 40, 60–72. [Google Scholar] [CrossRef] [Green Version]
  107. Murphy, R.J.; King, H.; Sim, S.; Chenoweth, J.; Christie, I.; Clavreul, J.; Lee, J.; Clift, R. Towards Operationalizing the Planetary Boundaries Concept in LCA for Products. In Proceedings of the SETAC Europe 25th Annual Meeting, Barcelona, Spain, 3–7 May 2015. [Google Scholar]
  108. O’Brien, M.; Wechsler, D.; Bringezu, S.; Schaldach, R. Toward a systemic monitoring of the European bioeconomy: Gaps, needs and the integration of sustainability indicators and targets for global land use. Land Use Policy 2017, 66, 162–171. [Google Scholar] [CrossRef]
  109. TEEB. TEEB for Agriculture & Food: Scientific and Economic Foundations; United Nations Environment Programme: Geneva, Switzerland, 2018. [Google Scholar]
  110. EBBC. Fact Sheet: Biodiversity in the Food Industry. European Business and Biodiversity Campaign. 2014. Available online: www.business-biodiversity.eu (accessed on 10 June 2021).
  111. De Silva, G.C.; Regain, E.C.; Pollard, E.H.B.; Addison, P.R.E. The evolution of corporate no net loss and net positive impact biodiversity commitments: Understanding appetite and addressing challenges. Bus. Strategy Environ. 2019, 28, 1481–1495. [Google Scholar] [CrossRef] [Green Version]
  112. Aiama, D.; Bennun, L.A.; Bos, G.; Edwards, S.N.; Krueger, L.; Savy, C.; Semroc, B.; Sneary, M. No Net Loss and Net Positive Impact Approaches for Biodiversity: Exploring the Potential Application of These Approaches in the Commercial Agriculture and Forestry Sectors; International Union for Conservation of Nature: Gland, Switzerland, 2015. [Google Scholar]
  113. Meyer, C.; Miller, D. Zero Deforestation Zones: The Case for Linking Deforestation-Free Supply Chain Initiatives and Jurisdictional REDD+. J. Sustain. For. 2015, 34, 6–7, 559–580. [Google Scholar] [CrossRef] [Green Version]
  114. Gardner, T.A.; Benzie, M.; Börner, J.; Dawkins, E.; Fick, S.; Garrett, R.; Godar, J.; Grimard, A.; Lake, S.; Larsen, R.K.; et al. Transparency and sustainability in global commodity supply chains. World Dev. 2018, 121, 163–177. [Google Scholar] [CrossRef] [PubMed]
Figure 1. Complementary approaches available for business to account for their biodiversity impacts.
Sustainability 13 08536 g001
Table 1. Resources for business: initiatives, partnerships, and platforms.
Resource Description
Aligning Business Measures for Biodiversity Led by UNEP-WCMC and with partners across >20 organizations, it convenes key stakeholders to improve clarity and build consensus on how businesses and financial institutions can measure and report on performance.
Biodiversity and Value Chains Intended as a community of frontrunners, companies will commit to integrating biodiversity into their strategies and taking concrete action in their value chains.
Biodiversity in Good Company The Business and Biodiversity Initiative is a cross-sectorial collaboration of companies that have joined forces to protect and sustainably use our worldwide biological diversity. Its aim is to halt the dramatic loss of ecosystems, species and genetic diversity.
Biodiversity Indicators Partnership A global initiative to promote the development and delivery of biodiversity indicators. Its primary role is to serve the global user community by responding to the indicator requests of the CBD and other biodiversity-related conventions.
Business for Nature A global coalition bringing together influential organizations and businesses to demonstrate business action and call for governments to reverse nature loss.
Cool Farm Alliance An industry platform for sustainable agriculture metric development and use.
CSR Europe A business network for Corporate Sustainability and Responsibility. They unite, inspire and support over 10,000 enterprises at the local, European and global levels in their transformation and collaboration towards sustainable growth.
EU Business @ Biodiversity Platform Provides a unique forum for dialogue and policy interface at the EU level. It was set up by the European Commission with the aim to help businesses integrate natural capital and biodiversity considerations into business practices.
EU LIFE Initiative Food & Biodiversity Helps standard organizations to integrate biodiversity criteria in their schemes and motivates food processing companies and retailers to include biodiversity criteria in their sourcing guidelines. Includes the Biodiversity Performance Tool.
European Business and Biodiversity Campaign Initiated in 2010 by a consortium of European NGOs and companies led and coordinated by the Global Nature Fund with support of the LIFE+ Programme it aims to inform the private sector about biodiversity and tools to assess and mitigate impacts.
Global Biodiversity Information Facility An international network and data infrastructure aimed at providing open access to data about all types of life on Earth. It provides common standards and open source tools to share information about where and when species have been recorded.
Global Platform on Business and Biodiversity Stems from the ongoing engagement of the CBD with the business sector to provide a global forum of dialogue among signatory parties and other stakeholders.
IPBES Business & Biodiversity Assessment The intergovernmental body which assesses the state of biodiversity and of the ecosystem services. The 2019–2030 work program includes assessment of the impact and dependence of business on biodiversity and identifies criteria and indicators.
IUCN Business & Biodiversity Program Aims to transform the way business values, manages and invests in nature. It builds bridges between stakeholders, carries out independent scientific assessments and develops policy standards and tools.
Natural Capital Coalition A global, multi-stakeholder open source platform for supporting the development of a Natural Capital Protocol aiming to set the industry norms for valuing and accounting for natural capital in business.
Natural Value Initiative An initiative led by UNEP and Fauna & Flora International to assess the dependency on biodiversity and ecosystem services of 31 companies within the food, beverage and tobacco sectors. It has been designed primarily for the financial sector.
Slow Food Foundation for Biodiversity Active in over 100 countries, it involves thousands of small-scale producers in its projects, providing technical assistance, training, producer exchanges and communication.
TEEB The Economics of Biodiversity and Ecosystem Services (TEEB) for Business puts a special focus on the impacts on and dependence of the private sector on biodiversity and ecosystem services.
The Sustainable Food System Of the One Planet Programme, contributes a systems-based approach that addresses the range and complexity of interactions in the production and consumption of food by building synergies and cooperation among stakeholders.
UN Biodiversity Lab It is a platform for building partnerships among data providers and data users to ensure that governments have access and capacity to use cutting-edge spatial data to make key conservation and development decisions.
UN Global Compact Corporate sustainability initiative with reports, e.g., including a Guideline: Sustainability in the supply chain.
We Value Nature A campaign supporting businesses and the natural capital community to make valuing nature the new normal for businesses across Europe.
WBCSD The World Business Council on Sustainable Development brings together some 200 companies. They publish a structured overview of existing tools and approaches: Ecosystem services and biodiversity tools to support business decision making.
Table 2. Examples of tools to measure the biodiversity performance of companies.
ToolDescription
Agrobiodiversity Index (ABD) * from Biodiversity InternationalIt assesses risks in food and agriculture related to low agrobiodiversity. The Index is based on 33 indicators that assess: dietary diversity, crop diversity, seed genetic diversity, level of safeguarding for the future and benefit to local livelihoods.
Biodiversity check from the Business and biodiversity campaign (EU) The check examines a company’s impacts on biodiversity in the form of an individual screening, biodiversity matrix and interviews to provide the basis for integrating biodiversity into management processes and goals.
Biological Diversity protocol * from the Endangered Wildlife Trust (South Africa)It provides biodiversity-specific guidance to measure change(s) in biodiversity components affected by business as part of an accounting framework.
Biodiversity Footprint Financial Institutions * from ASN Bank (Netherlands)It is designed to provide an overall biodiversity footprint of the economic activities a financial institution invests in.
Biodiversity Indicators for extractives * from UNEP-WCMC, Conservation International and Fauna and Flora InternationalIt is testing a methodology to meet the needs of extractive companies in understanding their performance in mitigating their impacts on biodiversity.
Biodiversity Impact Metric * from Cambridge Institute for Sustainable Leadership (UK)It was developed to assess impacts on soil and water that, combined with biodiversity, will be called ‘Healthy Ecosystems Metrics’. It was designed to assess a company’s contribution to maintenance of an ecologically functional landscape.
Biodiversity Performance Tool for the Food Sector * from Solagro (France) in the EU LIFE Project “Biodiversity in standards and labels for the food sector”It proposes a methodology to assess the integration of functional biodiversity at a farm level for food sector actors (product quality or sourcing managers), as well as for certification companies.
Biodiversity Monitoring Tool for the Food Sector * from Lake Constance Foundation (Germany) in the EU LIFE Project “Biodiversity in standards and labels for the food sector”Level 1 monitoring is a system-wide approach to evaluate the potential created for biodiversity (ecological structures, biotope-corridors, buffer zones, etc.) and the reduction of negative impacts on biodiversity (use of chemical pesticides and fertilizers, erosion, water use, etc.). Level 2 monitors mid- and long-term effects of certification on wild biodiversity.
Biodiversity-specific return on investment metric from IUCN (International)It apportions the relative contribution of threats (pressures) to each threatened species’ extinction risk to show the potential for reducing extinction risk before investment or to measure the achieved impact of conservation interventions on extinction risk over time.
Business and Biodiversity OffsetsHelps companies to achieve “no net loss” of biodiversity with tools offering ways to avoid, minimize, restore and offset project and development impacts.
Corporate Ecosystem Services Review from WBCSD and WRI (International)It consists of a structured methodology that helps managers proactively develop strategies to manage business risks and opportunities arising from their company’s dependences and impacts on ecosystems.
ENCORE (Exploring Natural Capital Opportunities, Risks and Exposure) from the Natural Capital Finance Alliance in partnership with UNEP-WCMCIt helps users to better understand and visualize the impact of environmental change on the economy, focusing on the goods and services that nature provides and the business risks of environmental degradation.
Ex-ACT (accessible, complete, time-sensitive) tool project – biodiversity indicator from FAO and AFDIt enhances the existing tool Ex-ACT (carbon balance tool) by integrating an agriculture biodiversity indicator.
Global Biodiversity Score * from CDC Biodiversité (France)It calculates the biodiversity footprint of economic activities using the indicator “Mean Species Abundance” based on GLOBIO (see below).
Environmental Profit and Loss * from Kering (France)It measures impacts (carbon emissions, water consumption, air and water pollution, land use, waste) along the entire supply chain, converting them into monetary values to quantify the use of natural resources.
InVEST (Integrated Valuation of Ecosystem Services and Tradeoffs) from the Natural Capital Project centered at Standford University (international)A suite of free, open source software models used to map (spatially-explicit) and value the goods and services from nature that sustain and fulfill human life.
LIFE Key * from LIFE Institute (Brazil)It calculates and evaluates an organization’s impact based on five environmental aspects taking into account quantity and severity criteria.
Product Biodiversity Footprint * from I-Care & Consult and Sayari (France)It combines biodiversity studies and companies’ data to quantify the impacts of a product on biodiversity all along the product’s life cycle stages in order to provide recommendations for changes.
Species Threat Abatement and Restoration Metric* from IUCN (International)It measures the contribution that investments can make to reducing species extinction risk in order to help the finance industry better target their investments to achieve conservation outcomes.
Note: Tools with a star * were included in the review [74]. Sources: Internet review [74,80].
Table 3. Examples of global observation tools using remote sensing to monitor biodiversity impacts.
ToolDescription
GeoFootprintA multi-stakeholder initiative launched by Quantis in 2018 with the aim to merge GIS and life cycle assessment into a web-based platform (including both open access and licensed services for paying customers) to provide information on, e.g., the environmental footprint of crop production.
Global Analysis and Discovery The alert system devised by the University of Maryland uses satellite imagery to collect weekly data on deforestation across the tropics. It indicates when a 30 by 30 m area has experienced disturbance in the forest canopy using NASA’s Landsat satellites to automatically flag areas.
Global Forest Watch An online platform that provides data and tools for monitoring forests. It harnesses cutting-edge technology to allow anyone to access near real-time information about where and how forests are changing around the world.
Global Risk Assessment ServicesGRAS has developed a tool to support companies by calculating a Risk Index and comparing the sustainability risk for multiple regions of interest. Analysis of high-resolution remote sensing data from the latest generation of satellites enables changes in land use to be documented (e.g., Heat Maps).
Resource WatchA dynamic platform that leverages technology, data and human networks to bring transparency about the planet right now by featuring hundreds of data sets all in one place.
Sustainability Policy Transparency ToolkitSPOTT is a free online platform supporting sustainable commodity production and trade. It assesses commodity producers, processors and traders on their public disclosure and scores tropical forestry, palm oil and natural rubber companies annually against over 100 sector-specific indicators.
TraseIt uses publicly available data to map the links between consumer countries via trading companies to the places of production. Data is free with the aim to map the trade of over 70% of total production in major forest risk commodities by 2021 (including soy, beef, palm oil, timber, pulp and paper, coffee, cocoa and aquaculture).
Trends.Earth Formerly the Land Degradation Monitoring Toolbox, it allows users to plot time series of key indicators of land change, to produce maps and other graphics that can support monitoring and reporting, and to track the impact of sustainable land management or other projects.
Table 4. Examples of tools geared toward supporting greater biodiversity uptake in farming systems.
Tool Description
Cool Farm Tool module Biodiversity Quantifies how well farm management supports biodiversity.
Ecological Focus Areas Calculator The software tool was designed to: (1) provide a facility to describe and declare features on the farm as Ecological Focus Areas, and (2) assess the impact of features on the farm with respect to their potential effects on ecosystem services, biodiversity and farm management.
Farm Sustainability Assessment It is built around a set of simple questions which standardize farm assessment.
Gaïa Biodiversity Yardstick A free internet tool consisting of 40 questions and 6 themes to make biodiversity measurable and comparable (with benchmarks).
LEAF Sustainable Farming Review LEAF (Linking Environment And Farming) is a members only self-assessment online management tool to help farmers monitor their performance related to integrated farm management, identify strengths and weaknesses and set targets for improvement.
SMART Sustainability Monitoring and Assessment RouTine A method that allows farms and companies in the food sector to assess their sustainability in a credible, transparent and comparable manner. It is fully consistent with the Sustainability Assessment of Food and Agriculture systems (SAFA) Guidelines and provides an efficient manner to apply them in practice.
Publisher’s Note: MDPI stays neutral with regard to jurisdictional claims in published maps and institutional affiliations.

