Abstract
This study performed a Life Cycle Assessment (LCA) on recovery strategies of dredged contaminated marine sediments in a large Mediterranean port located in central Italy (Tuscany) in order to find the most environmentally sound solution. The study considered marine sediments polluted by potentially toxic elements (PTEs) and/or organic compounds, two different sediment particle sizes and the combined use of three soil remediation technologies: soil washing, electrokinetic treatment and enhanced landfarming. The analyzed scenarios depended on the sediment properties and characteristics of the treatment technologies investigated, and were compared with the corresponding reference scenarios, consisting of the landfilling of dredged contaminated sediments. The LCA results show that scenarios associated with sediment recovery generated potential environmental impacts lower than the corresponding reference scenarios. Almost all the impact categories considered in the CML-IA baseline method showed an environmental convenience in the recovery of contaminated sediments, especially for abiotic depletion and global warming. Future studies should focus on optimizing the combined use of multiple technologies and reducing the resource consumptions related to their implementation in order to achieve both environmental and economic benefits.
1. Introduction
Nowadays, resource scarcity and climate changes are growing issues all around the world that researchers and practitioners will have to address in the near future []. Adopting “zero waste” thinking seems to be the right way for sustainable development []. These matters are part of the objectives of the circular economy, which calls for the resource recovery by considering waste as a product to be reused in order to achieve environmental and economic benefits without compromising the next generations [,].
In view of this, the recovery of dredged contaminated marine sediments represents a viable way to contribute to the ongoing paradigm shift. Indeed, marine sediments are often affected by pollution due to industrial, civil and port activities, and their removal is strictly necessary, involving very expensive operations in several aspects [].
This study compared the potential environmental impacts due to the recovery or landfilling of contaminated marine sediments located in a large port of central Italy (Tuscany). Generally, management of marine sediments is governed by Italian Legislative Decree 152/2006, which provides guidelines for dredging activities, aimed at the maintenance of river and coastal areas, and for the reuse of decontaminated fractions after appropriate treatments. Until the recent past, the most common management strategy of contaminated marine sediments was landfill disposal; however, this option is considered a potential risk for human health and the environment due to the release of contaminants and represents an environmentally unsustainable solution today.
Treatment Technologies Considered in This Study
Treatment of contaminated marine sediments can be achieved by means of several technologies, most of which are related to soil remediation [,]. The available treatment technologies differ in characteristics, and their use depends on sediment properties, such as particle size and type of pollution [,]. Therefore, we considered three treatment technologies, which may be combined among them, to treat sediments polluted by potentially toxic elements (PTEs) and organic compounds, namely: soil washing (SW), electrokinetic (EK) treatment and enhanced landfarming (EL).
Soil washing treatment is an ex situ technology for soil remediation. It is generally applied to coarse-grained soils (50–60%) and is capable of removing PTEs, radioactive materials and organic pollution [,,]. This technology is based on physical and/or chemical mechanisms. In the first case, soil washing implements a particle size separation of soil: theoretically, contaminants should be concentrated mainly into smaller fractions, while coarse fractions should be decontaminated. In the second case, contaminants are mainly dissolved in water solution by the use of chemicals for PH manipulation, in order to improve transfer capacity from soil to water solution [,].
Electrokinetic treatment is usually applied to low-permeability soils for PTE removal. It is an electrical process where electrodes are placed in the ground and a low-intensity direct current is applied. Electrokinetic remediation is often applied to wet soils, involving electrokinetic flows that cause the migration of charged particles and water towards the electrodes, as positive ions are attracted to the negatively charged cathode, and negative ions are attracted to the positive charged anode [,]. Specifically, electrokinetic flows occurring in the process are electroosmosis, electromigration and electrophoresis: these transport mechanisms allow for soil reclamation by collecting contaminants in the electrode wells [,]. On the other hand, the presence of an electric field can lead to several unpredictable reactions to the system; hence, research studies are continuously looking for process optimization []. Specifically, in order to understand the mechanisms involved and improve treatment processes, efforts have been made by exploring:
- The implementation of additive chemicals for pH control, which is a crucial aspect for the proper functioning of the electrokinetic process [];
- The application of a periodic electric potential [];
- The development of mathematical models to predict contaminant extraction, which can be 1D or 2D models [,,,,,].
The treatment can be applied both in situ and ex situ.
Enhanced landfarming is an evolution of the basic landfarming treatment, which is a well-established soil remediation technology based on the biodegradation of contaminants by microorganisms []. Landfarming is generally applied ex situ for soil remediation by hydrocarbon and organic pollution in fine-grained soils [,]. It is widely considered a cost-effectiveness treatment but, on the other hand, the complex kinetics of the bioremediation processes require experience and constant monitoring of pH, moisture and nutrient content []. In fact, difficulty in the management of the bioremediation process and the long times required for contaminant removal represent the greatest limit of the basic landfarming treatment. In this regard, enhanced landfarming treatment seeks an improvement in bioremediation performance, in terms of both time and removal efficiency. In particular, two techniques are mainly applied: Bioaugmentation and Biostimulation. Bioaugmentation involves inoculation in the soil of harmless microorganisms particularly efficient in the removal of contaminants, such as bacteria and fungi, while biostimulation consists of the addition of nutrients in soil, such as nitrogen and phosphorous, in order to feed microorganisms and encourage their growth [,].
Considering the above descriptions, it should be noted that the sediment particle size represents a limit for the implementation of the remediation technologies considered in this study, as they can only treat soils with specific particle size ranges.
The novelty of this study is in the assessment, from a life cycle perspective, of the combined application of the aforementioned technologies for the remediation of marine sediments contaminated by mixed pollution, in order to evaluate the best recovery strategy in environmental terms.
The Life Cycle Assessment (LCA) approach was born to quantify environmental impacts associated with a product during its entire life cycle. Only in recent decades has the LCA approach been applied to soil and water remediation processes, since waste is considered a potential source of matter or energy that could be recovered [,].
Nevertheless, to the best of our knowledge, there are still a few applications of LCA to the remediation of mixed polluted soils by combining multiple treatment technologies. Most of the studies found in the literature focused on a single pollution type, namely, soil contaminated by organic pollutants [,,,,] or PTEs []. In particular, a few studies were concerned with the marine sediments [] and treatment technologies considered in this paper.
Kim et al. (2014) [] reported an environmental assessment on the remediation of a multimetal-contaminated site by electrokinetic treatment.
Vocciante et al. (2016) [] used an LCA approach to investigate the global warming potential due to an innovative electrokinetic configuration in a 168 m3 soil reclamation.
Hou et al. (2014) [] implemented a hybrid LCA method to evaluate the sustainability of river sediment remediation by soil washing.
Instead, concerning enhanced landfarming, we found more widespread and interesting LCA applications to composting treatments, as they are very similar treatment technologies. For instance, refs. [,] conducted environmental assessments on food waste composting: the strong similarities found between these technologies allow us to take important references for our case study.
2. Materials and Methods
The study performed an LCA related to the treatment of 30,000 tons of contaminated saturated sediments, following the LCA phases defined by ISO 14040:2006 [] and ISO 14044:2006 [], namely, goal and scope definition, inventory analysis, impact assessment and interpretation.
2.1. Goal and Scope Definition
This project evaluated the potential environmental impacts due to treatment of contaminated marine sediments in a large Mediterranean port located in the center of Italy. Marine sediments were dredged in two different docks of port, showing two different particle sizes: particle size C, containing more than 50% of coarse sand (density 1.5 t/m3, moisture content 25%), and particle size F, made up of 80% clay (density 2 t/m3, moisture content 40%). Therefore, various options for their reclamation are possible. The aim of this study was to investigate scenarios for the treatment of contaminated marine sediments with different characteristics, in order to find the most environmentally sound strategy.
The on-site sediment pollution (Table 1) was estimated by analyzing 32 sediment samples dredged in port. Sample analysis aimed at calculating the average concentration of the contaminants located at a depth of 0.5 m from the seabed. On-site concentrations evinced that potentially toxic elements (PTEs), polycyclic aromatic hydrocarbons (PAHs), polychlorinated biphenyls (PCBs) and hydrocarbons exceeded regulatory concentration limits by 4, 7, 2 and 14 times, respectively. The functional unit of 30,000 tons was chosen because it represents a sufficient quantity, for which the recovery of marine sediments may be convenient compared to landfill disposal, for both economic and environmental reasons.

Table 1.
On-site contaminant concentration.
Furthermore, 30,000 tons represent a reference unit for the port under study. For both docks, approximately 300,000 tons of marine sediments are dredged every year. After dredging, sediments are transported to a temporary storage for analysis: about 10% of the dredged sediments contain hazardous pollutants and need be treated or sent to landfill. Instead, the remaining sediments (about 90%) are placed in overwhelmed cases, as they contain low contamination levels.
System boundaries included all the materials and processes involved in the treatment steps, from sediment transport to the treatment site, to reuse and/or dispose of landfill (Figure 1). The final allocation of the sediments depended on the assumptions made in the scenarios and treatments supposed for the contaminant removal. In particular, this study considered three treatment technologies for soil remediation: soil washing (SW), electrokinetic treatment (EK) and enhanced landfarming (EL). These technologies may be combined among them, as they remove different categories of contaminants, and their use may depend on the sediment particle size. Figure 2 shows the action plan followed for this project, explaining the decision-making process adopted and the characteristics of the treatment technologies considered. As mentioned, it should be noted that contaminant removal was not always allowed due to the limited effectiveness of the treatment technologies considered, and this led to the recovery or landfill disposal of sediment fractions, based on the technologies available. Obviously, even the untreated fractions may be recovered through different technologies not included in this project, such as phytoremediation [,].
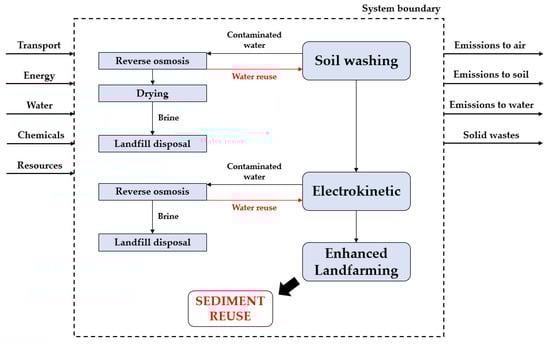
Figure 1.
System boundary. Avoided impacts are colored in red.
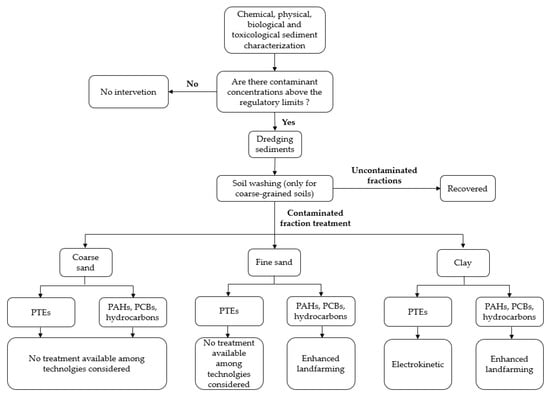
Figure 2.
Action plan followed in this study, modified by []. Adapted from Pecorini I., Iannelli R., Ceccarini A., Di Gregorio S., Pilato F. and Macchia S. (2021).
The dredging phase was not included, as it is common to all scenarios analyzed. Potential environmental impacts due to the construction of machinery and equipment used were not included, assuming they already exist and will continue to operate. Indeed, it is expected that machinery and equipment will have a certain useful life once built, while potential environmental impacts due to treatment phases occur continuously over the years.
Scenario Analysis
As mentioned, SW is a water-based treatment that implements physical or chemical mechanisms for soil remediation. In our project, we implemented the first option, consisting of soil particle size separation and contaminant concentration into the smaller fractions, while coarse materials should be decontaminated after treatment. Because of this, SW technology is applied as the first treatment when it is appropriate, and its results influence subsequent choices.
SW experimental tests were conducted on sediments with particle size C using a solid-to-liquid ratio of 1:1 and showed two different contaminant distributions after treatment. In the first case, called best case, the contaminant distribution was as expected (Table 2), as contaminants were mostly transferred to clay. On the other hand, the second case, called worst case, showed a distribution far from the ideal behavior (Table 2), resulting in a large quantity of PTEs in the coarse sand. It should be noted that PAHs, PCBs and hydrocarbons showed the same percentage of distribution for each case and respected the ideal distribution behavior of contaminants even in the worst case. As expected, experimental tests showed a negligible contribution of water in contaminant removal; hence, it was cautiously assumed that all contaminants remained in the soil fractions.
Table 2.
Contaminant distribution after soil washing treatment.
In view of this, the analyzed scenarios were based on the SW results, depending on the fraction type to be treated later. As mentioned, SW treatment can be applied to soils consisting mainly of coarse sand and, therefore, it was applied only to sediment with particle size C. Pilot-scale experimental tests showed a particle size separation performed by soil washing treatment equal to 55% of coarse sand, 30% of fine sand and of 15% clay.
The first LCA study (Figure 3) concerned sediments with particle size C. Considering the best contaminant distribution, the so-called best case, sand fractions were decontaminated after SW treatment and ready for reuse, while the clay fraction was still contaminated by all contaminant categories. In this case, two scenarios were possible: landfill disposal or recovery of the clay fraction by removing contaminants through EK and EL treatments. Obviously, sand fractions were always recovered.
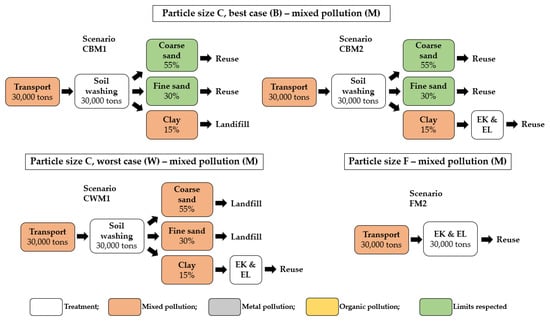
Figure 3.
Analyzed scenarios considering mixed pollution for dredged sediments (real case study).
Instead, considering the worst contaminant distribution, the so-called worst case, both sand and clay fractions were found to be contaminated after SW treatment. In this case, the only possible scenario was to recover the clay fraction and dispose of the sand fractions in landfill, since it is not possible to remove PTEs. Indeed, while hydrocarbons could be removed from fine sand fraction by EL, EK treatment cannot be applied to both sand fractions, as it requires low-permeability soils [].
The second LCA study (Figure 3) concerned sediments with particle size F. As mentioned, sediments with particle size F contained a very high percentage of clay (80%). Because of this, they could be considered as a clayey soil and it was possible to investigate a single scenario in which all sediments were recovered without implementing the SW treatment. Indeed, as shown in Figure 2, in fine fractions, PTEs can be removed by EK, while PAHs, PCBs and hydrocarbons can be removed by EL treatment. It should be noted that this scenario was independent of the distribution cases described above, as soil washing treatment was not implemented.
The aforementioned studies considered the real case where dredged sediments were contaminated by all contaminants (mixed pollution) listed in Table 2. In addition, two virtual case studies were examined, in which dredged sediments were assumed to be contaminated only by PTEs or organic compounds (PAHs, PCBs and hydrocarbon). The two virtual case studies considered all data and assumptions adopted in real cases, resulting essentially in the same scenarios to analyze. The only difference concerned the virtual scenario in which dredged sediments were assumed to be contaminated only by organic compounds, and SW treatment was implemented considering the worst contaminant distribution. In fact, after the particle size separation, even fine sand could be recovered by EL, as there were no PTEs that could not be removed in fine sand using treatment technologies taken into account (Figure A1 and Figure A2, in Appendix A).
The scenarios were nominated using letters and numbers referring to particle size, contaminant distribution, initial pollution and final destination of the sediments, identifying the scenario analyzed as explained in Table 3.
Table 3.
Scenario nomenclature.
It was assumed that EK and EL treatments lasted both six months in order to achieve a contaminant removal efficiency of 99% and obtain a contaminants concentration below the regulatory limits in any case. Several studies in the literature showed excellent results in contaminant removal by using treatment technologies considered in this project [,]. Moreover, our pilot-scale experiments on soil remediation by EK and EL treatments showed considerable results, reaching removal peaks of 72.8% (in 95 days) for PTEs and 97.8% (in 126 day) for organic compounds, respectively. For this reason, the assumption of a 99% contaminant removal rate in six months seemed plausible.
Finally, each scenario was compared with the corresponding reference scenario, consisting of the landfilling of sediments without any treatment, namely, Scenario M0, Scenario H0 and Scenario O0. It should be noted that potential environmental impacts due to the landfill disposal of sediments depend exclusively on the total amount of contaminated sediments discharged to landfill and, therefore, reference scenarios were independent of the other parameters.
2.2. Life Cycle Inventory (LCI)
Inventory analysis covered all input and output data to describe material and energy flows involved in system boundaries. The inventory was compiled by combining data collected from experimental tests on sediments and data retrieved from literature, while background data were provided from the ecoinvent 3.6 database; in particular, secondary impacts due to energy and fuel consumption were retrieved from the ecoinvent database.
2.2.1. Treatment Site
Pilot-scale experimental tests were carried out within the port area. As mentioned, the aim of this study was to investigate the best sediment recovery strategy from an environmental perspective, hoping for a continuous treatment of dredged contaminated sediments. It was therefore assumed that a large treatment site would be built 1 km away from the dredging area. Within the site, the use of building machines with a power of 100 kW [] was supposed for sediment handling in all treatment phases.
2.2.2. Soil Washing Treatment
On the basis of pilot-scale experiments carried out on sediments with particle size C, for treatment on an industrial scale it was assumed that a soil washing machine capable of treating 25 tons of sediments per hour, consuming 5 kWh/t and using a solid-to-liquid ratio of 1:1 would be used [,]. Although this ratio is rather low compared to other studies [], water consumption would still be considerable on an industrial scale, so a water recovery system is necessary. Because of this, a reverse osmosis treatment was supposed: considering the industrial plants available on the market, two reverse osmosis plants with a power of 11 kW and a maximum flow rate of 13 m3/h should be sufficient to obtain a water recovery of 85% [], resulting in a 15% supply of clean water every hour.
Water recovery raised the problem related to the disposal of brines. In fact, brine management still has many uncertainties, and their discharge into the sea is not allowed when brines were produced in decontamination processes []; therefore, the only viable option was to assume landfill disposal for the brines. Nevertheless, considering a feed water salinity of around 10,000 mg/L [,], after reverse osmosis treatment the brines would still contain a moisture content too high for landfill disposal. In view of this, a drying process was assumed in order to achieve a dry solid percentage of 80% []. According to catalogues of industrial machinery available on the market and the literature, it was assumed that a belt dryer consuming 0.8 kWh of thermal energy and 0.0375 kWh of electrical energy per kg of evaporated water would be used [].
2.2.3. Electrokinetic Treatment
For electrokinetic treatment on an industrial scale, it was assumed that sediments were placed in large square-shaped tanks. Inside the tanks, the sediment thickness was assumed to be equal to 3 m, while the surface depends on the sediment volume to be treated, based on the analyzed scenario. Moreover, the treatment was assumed to be carried out in a greenhouse having a height of 5 m and a surface sufficient to contain sediments and to perform operational phases.
The number of anode electrodes and cathode electrodes also depends on treatment surface. In this regard, we assumed to divide treatment surfaces into 2 m × 2 m square meshes, with electrodes placed on the vertices of these meshes []. Electrodes were assumed to be arranged in vertical wells with a 10 cm diameter in which catholyte (basic) and anolyte (acid) solutions can circulate in two independent circuits thorough the use of pumps. The total electrolyte circulating in the system was assumed to be equal to the volume of the installed electrode wells and the pipes connecting them.
However, it should be noted that water electrolysis generates hydroxides at the cathode and hydrogen ions at the anode, forming acid and alkaline fronts that move towards opposite electrodes by an electric field, based on particle charge. Because of this, acid dosage is fundamental to avoiding contaminant precipitation in porous medium due to alkaline fronts moving in the opposite direction, favoring contaminant migration []. Nitric Acid (HNO3) was used to maintain sediment pH under acidic conditions at the cathode, assuming a consumption of 5.6 kg per sediment ton []. Based on experimental tests and data retrieved from the literature, the energy consumption of the system was assumed to be 82 kWh/m3, considering an available power of 50 kW, a maximum electrical current of 10 A and a maximum voltage of 48 V []. These parameters were deliberately considered to be low in order to contain electricity consumption.
As shown during experimental tests, metal removal efficiency decreases after a certain period of time, and the electrolyte needed to be changed or reconditioned. As with SW treatment, water consumption would be considerable on an industrial scale, so a water recovery system is required. Because of this, a reverse osmosis treatment was supposed. The reverse osmosis process was modelled to achieve full electrolyte treatment every 24 h, resulting in 85% water recovery and 15% supply of clean water every day. Electrolyte daily flow depends on the scenarios analyzed, as they consider different sediment volumes to be treated. In any case, energy consumptions of the assumed reverse osmosis plants were estimated on the basis of the technical characteristics provided by catalogues available on the market.
After reverse osmosis treatment, it was assumed that brines were placed inside trays to facilitate natural evaporation [], exploiting the thermal efficiency available inside the greenhouse. Because of the above-mentioned reasons, it was assumed that brines were disposed of in landfill.
As mentioned, the EK treatment was assumed to be carried out in a greenhouse, also allowing for the collection of gas emissions produced during the remediation process (especially chlorine emissions) in a defined volume and their treatment before being released into the environment. For our case, the treatment of gas in scrubber was supposed, involving energy and calcium carbonate (CaCO3) consumptions. Laboratory tests showed a calcium carbonate consumption of 0.5 kg per sediment ton, assuming a full air change in the greenhouse every 30 min. Energy consumption was estimated by considering a scrubber with a maximum flow rate of 20,000 m3/h and a total power of 29.5 kW, including the fan.
2.2.4. Enhanced Landfarming Treatment
Landfarming treatment is a biodegradation-based process for soil remediation. As mentioned, this study explored the potentiality of the enhanced landfarming. EL seeks to improve and speed up the contaminant removal process by adding different additives []. The technique used is known as bioaugmentation and, in our case, landfarming treatment was enhanced by the inoculation of Fusarium oxysporium fungi, which is able to work in extreme conditions, such as in the case of marine sediments containing high salinity [,].
EL treatment was modelled by combining literature data and data provided by laboratory tests carried out on a small sediment mesocosm. For our LCA model, it was assumed that sediments were placed by building machines in piles 30 m long and with a trapezoidal cross section of 10.5 m2. Pile volume was assumed to be formed by sediments and wood chips, added as bulking material in order to keep an optimal moisture content during the process (about 60%) and to favor the formation of pore spaces for the aeration of the inner part of the piles [,]. Furthermore, the action of the wood chips is useful to obtain a pH value of the sediments close to 7. In fact, after the EK treatment, the pH of sediments is strongly acidic due to HNO3 dosage, and the acidity could inhibit biodegradation processes; therefore, a neutral pH value is required during EL treatment. A 4:1 weight ratio of sediments to wood chips was considered in each pile [], assuming a wood chip density of 0.5 t/m3.
Maintaining a certain moisture content requires above all the use of water and pile overturing, in order to encourage aeration and microbial activity. Concerning water consumption, considering similarities between landfarming and the composting process, a water consumption of 80 m3 for every 800 m3 of pile was assumed. Instead, it was assumed that piles were turned twice a month by using a turner machine. Regarding turner machine energy consumption, given the comparable dimensions of piles, based on our experience we were allowed to take into account data provided in []: according to the authors, on average, a turner machine turns a pile in 10 min, consuming 22 L of diesel per hour.
The above-mentioned data are common to a basic landfarming process but, as stated earlier, we performed a treatment of enhanced landfarming by implementing the inoculation of Fusarium oxysporium fungi. Fungi growth took place in an aerated and mixed reactor by adding malt wheat for encouraging fungi growth. Becarelli et al. (2019) [] estimated that a 90 m3 reactor running for two months should satisfy our need on an industrial scale. Instead, considering an inoculum of 10%, fungi growth would require 167 L of water per sediment ton, containing 20 grammes of spray malt wheat diluted in each liter of water. The temperature of the experimental reactor was kept between 20 and 25 °C.
Leachate produced by the biodegradation process was assumed to be recirculated back to the piles []. Treatment of gas emissions is not required, as emissions were mainly related to CO2 of biogenic origin, which is assumed not to contribute to global warming [,].
2.2.5. Landfill Disposal
Potential environmental impacts included disposal of contaminated sediments and brine, landfill management operation and transport of waste to sanitary landfill. The distance between the port and the sanitary landfill is around 50 km.
2.2.6. Sediment and Water Reuse
Sediment reuse was intended for fractions that showed contaminant concentrations below regulatory limits after treatment. A material reuse in the port where they were dredged was supposed. Environmental impacts due to the transport of decontaminated sediments to the port were considered.
However, sediment reuse induced a series of avoided impacts, namely, the extraction and marketing of filling and construction materials (clay and sand, specifically). Water recovery systems assumed for soil washing and electrokinetic treatment also resulted in avoided impacts, as tap water consumption was limited.
2.3. Impact Assessment
Life Cycle Impact Assessment (LCIA) was performed in Simapro 9.1.1 using the midpoint CML-IA baseline V3.02/EU25 method, developed by the Institute of Environmental Sciences of the Leiden University []. The CML method is well established and widely applied in several fields, especially in the study of solid waste management system LCA [].
3. Results and Discussion
The results of our LCA study, conducted according to the assumptions explained in the previous sections, are shown in Table 4. For each impact category considered in the CML-IA baseline method, Table 4 shows the percentage differences among the potential impacts generated by each analyzed scenario with respect to the corresponding reference scenario. Negative values of percentage differences indicate that the analyzed scenario has lower potential environmental impacts than the respective reference scenario for the considered category; on the contrary, positive values mean higher potential impacts. Figure 4 and Figure 5 show the contribution analysis of three indicators that are representative of the results found, namely, global warming, terrestrial ecotoxicity and acidification. For brevity of notation, the contribution analysis is shown only for the real case studies, showing the contribution of the individual processes that occurred in sediment remediation.
Table 4.
Life cycle impact assessment of the scenarios.
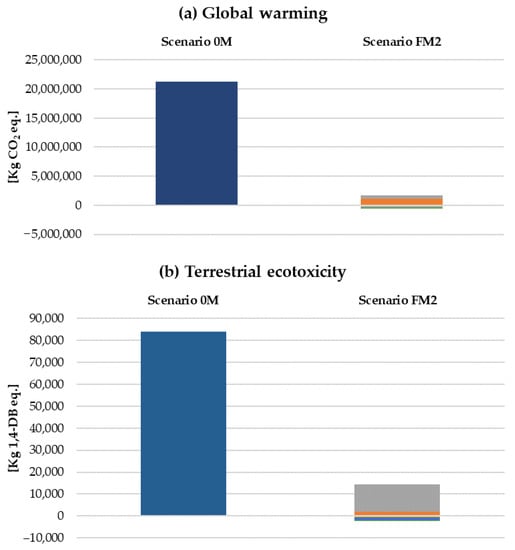
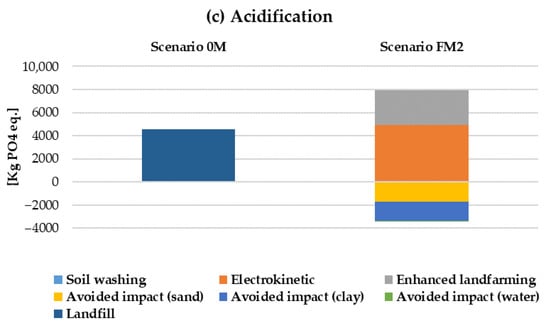
Figure 4.
Contribution analysis considering particle size F and mixed pollution (real case study). (a) Global warming; (b) Terrestrial ecotoxicity; (c) Acidification.
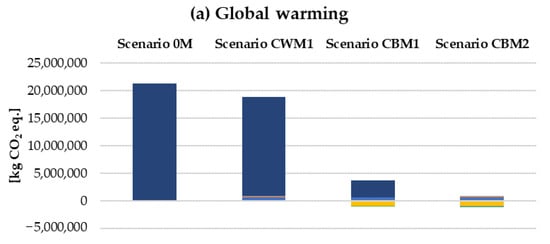
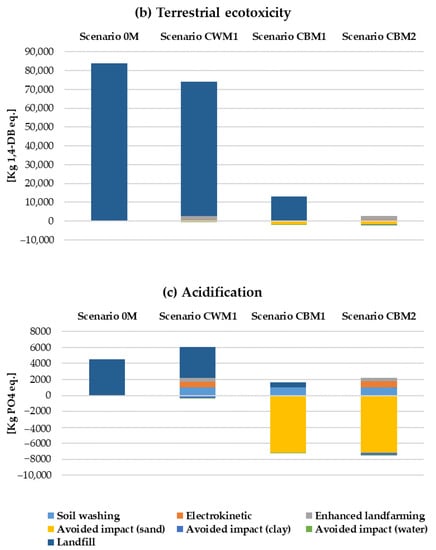
Figure 5.
Contribution analysis considering particle size C and mixed pollution (real case study). (a) Global warming; (b) Terrestrial ecotoxicity; (c) Acidification.
From an overview in Table 4, it can be said that the recovery of contaminated marine sediments generally leads to a reduction in potential environmental impacts, regardless of the sediment particle size and contaminant distribution. However, considering Scenarios CBM1 and CBM2, it should be noted that, for some impact categories, partial sediment recovery is more beneficial than the recovery of all fractions.
Focusing on real case studies, positive values of the percentage differences occur in two scenarios and refer to a few impact categories, namely, abiotic depletion (fuel), ozone layer depletion and acidification.
Concerning Scenario CWM1, the contribution analysis of acidification (Figure 5) shows that the highest impact is due to landfill disposal of the sand fractions, while avoided impacts due to recovery of the clay fraction and water are negligible. In fact, because of the worst contaminant distribution after SW treatment, in the scenario CWM1, only clay fraction can be recovered, which represents 15% of the sediment with particle size C. Scenarios CBM1 and CBM2 confirm that acidification is strongly influenced by avoided impacts, as the recovery of large quantities of sediments makes these scenarios particularly advantageous, despite the fact that the treatment of 30,000 tons of sediments generates non-negligible environmental impacts.
On the other hand, although the avoided impacts are considerable (all sediments are recovered), in the scenario FM2, acidification is not an advantageous indicator, because of the high contributions given by EL and, above all, EK (Figure 4). In particular, the greatest impacts are due to the energy consumption in EK and the use of wood chips as bulking material in EL. Therefore, even if all sediments are recovered, treating 30,000 tons of sediments by EK and EL requires high consumptions and negatively affects acidification.
Instead, global warming and terrestrial ecotoxicity are particularly sensitive to landfill disposal, considering both particle size F and C (Figure 4 and Figure 5). Therefore, potential environmental impacts associated with them decrease as the fractions of sediments disposed of in landfill decrease. Contributions given by avoided impacts are negligible for these two impact categories.
Scenarios in which dredged sediments are contaminated either by PTEs or organic compounds (virtual case studies) show almost always negative values (environmental advantages compared to the corresponding reference scenarios), even if they represent unlikely situation in the real world, as it is rare to deal with soil polluted by a single category of contaminants [,]. Irrespective of this, the absence of PTEs or organic compounds in sediments does not require, respectively, the use of EK or EL treatment, avoiding the potential environmental impacts they cause. For this reason, virtual case studies are particularly environmentally friendly.
Concerning scenarios where sediments are contaminated by PTEs, only Scenario CWH1 shows positive values for the same impact categories analyzed earlier. This is always due to the fact that EK treatment allows one to recover only the clay fraction, which represents a small portion in sediments with particle size C.
On the other hand, Scenario CWO1 shows a higher value than the corresponding reference scenario in just one impact category since, as mentioned, the absence of PTEs allows for the recovery of the fine sand fraction by EL treatment, increasing the avoided impacts deriving from material recovery and decreasing the landfill disposal of contaminated sediments. In view of this, future studies will have to consider remediation technologies with fewer constraints.
An LCA on recovery strategies of contaminated marine sediments was performed in this study, considering different sediment particle sizes and contaminant distributions. The study considered three treatment technologies for soil remediation, all of which have different characteristics.
The results show an environmental convenience in the treatment of marine sediments contaminated by PTEs and/or organic compounds.
We are aware that results were affected by the limited number of remediation technologies taken into account in this study; therefore, future research may concern the application of additional technologies (e.g., phytoremediation) and the identification of suitable chemicals to regulate sediment pH in order to optimize sequential EK and EL treatments.
Further efforts will have to concern the reduction in energy and resource consumptions in order to decrease potential environmental impacts as the quantity of recovered sediments increases. Moreover, this would lead to a reduction in maintenance and operating costs, which are important aspects that were not considered in this study.
Author Contributions
Conceptualization, F.P. (Francesco Pasciucco), I.P., S.D.G., F.P. (Fabiano Pilato) and R.I.; methodology, S.D.G., F.P. (Francesco Pasciucco), I.P. and F.P. (Fabiano Pilato); software, F.P. (Francesco Pasciucco); validation, I.P. and R.I.; formal analysis, F.P. (Francesco Pasciucco) and I.P.; investigation, I.P.; resources, I.P. and R.I.; data curation, F.P. (Francesco Pasciucco) and I.P.; writing—original draft preparation, F.P. (Francesco Pasciucco); writing—review and editing, F.P. (Francesco Pasciucco) and I.P.; visualization, I.P.; supervision, I.P. and R.I.; project administration, I.P.; funding acquisition, R.I. All authors have read and agreed to the published version of the manuscript.
Funding
This research was funded by INTERREG ITALIA-FRANCIA MARITTIMO 2014–2020-GRRinPort “Gestione sostenibile dei rifiuti e dei reflui nei porti”, grant number UniCa-Prot. N. 0082843 del 09/05/2018-[Classif. III/19], and the APC was funded by INTERREG ITALIA-FRANCIA MARITTIMO 2014–2020.
Institutional Review Board Statement
Not applicable.
Informed Consent Statement
Not applicable.
Data Availability Statement
Not applicable.
Acknowledgments
The authors would like to thank Alessio Cecchi, Simona Macchia, Andrea La Camera, Ilaria Chicca, Simone Becarelli, and Alberto Vita for their kind help.
Conflicts of Interest
The authors declare no conflict of interest.
Appendix A
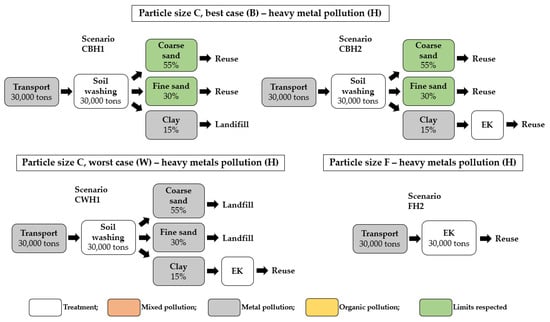
Figure A1.
Analyzed scenarios considering heavy metal pollution for dredged sediments (virtual case study).
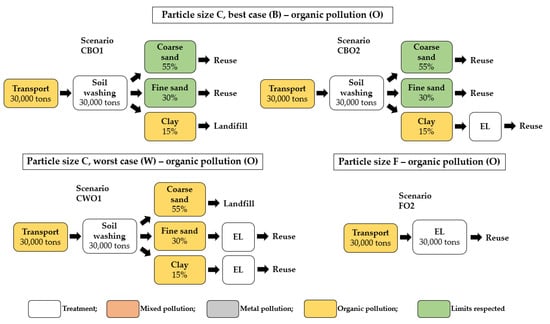
Figure A2.
Analyzed scenarios considering organic pollution for dredged sediments (virtual case study).
References
- Richardson, J.; Grose, J.; Jackson, B.; Gill, J.-L.; Sadeghian, H.B.; Hertel, J.; Kelsey, J. Effect of climate change and resource scarcity on health care. Nurs. Stand. 2014, 28, 44–49. [Google Scholar] [CrossRef]
- Lehmann, S. Resource recovery and materials flow in the city. J. Green Build. 2011, 6, 88–105. [Google Scholar] [CrossRef] [Green Version]
- Liu, L.; Ramakrishna, S. An Introduction to Circular Economy; Springer Singapore: Singapore, 2021. [Google Scholar]
- Pradel, M.; Aissani, L.; Villot, J.; Baudez, J.-C.; Laforest, V. From waste to added value product: Towards a paradigm shift in life cycle assessment applied to wastewater sludge—A review. J. Clean. Prod. 2016, 131, 60–75. [Google Scholar] [CrossRef]
- Masi, M.; Ceccarini, A.; Iannelli, R. Model-based optimization of field-scale electrokinetic treatment of dredged sediments. Chem. Eng. J. 2017, 328, 87–97. [Google Scholar] [CrossRef]
- Rulkens, W. Introduction to the Treatment of Polluted Sediments. Rev. Environ. Sci. Biotechnol. 2005, 4, 213–221. [Google Scholar] [CrossRef]
- Akcil, A.; Erust, C.; Ozdemiroglu, S.; Fonti, V.; Beolchini, F. A review of approaches and techniques used in aquatic contaminated sediments: Metal removal and stabilization by chemical and biotechnological processes. J. Clean. Prod. 2015, 86, 24–36. [Google Scholar] [CrossRef]
- Peng, J.-F.; Song, Y.-H.; Yuan, P.; Cui, X.-Y.; Qiu, G.-L. The remediation of heavy metals contaminated sediment. J. Hazard. Mater. 2009, 161, 633–640. [Google Scholar] [CrossRef] [PubMed]
- Mulligan, C.N.; Fukue, M.; Sato, Y. Sediments Contamination and Sustainable Remediation; CRC Press: Boca Raton, FL, USA, 2009. [Google Scholar] [CrossRef]
- Dermont, G.; Bergeron, M.; Mercier, G.; Richer-LaFLèche, M. Soil washing for metal removal: A review of physical/chemical technologies and field applications. J. Hazard. Mater. 2008, 152, 1–31. [Google Scholar] [CrossRef] [PubMed]
- Mann, M.J. Full-scale and pilot-scale soil washing. J. Hazard. Mater. 1999, 66, 119–136. [Google Scholar] [CrossRef]
- Liu, J.; Zhao, L.; Liu, Q.; Qiao, Z.; Sun, P.; Yang, Y. A critical review on soil washing during soil remediation for heavy metals and organic pollutants. Int. J. Environ. Sci. Technol. 2021, 1–24. [Google Scholar] [CrossRef]
- Abumaizar, R.J.; Smith, E.H. Heavy metal contaminants removal by soil washing. J. Hazard. Mater. 1999, 70, 71–86. [Google Scholar] [CrossRef]
- Bonomo, L. Bonifica di siti Contaminati; McGraw-Hill Education: Milano, Italy, 2004. [Google Scholar]
- Gregolec, G.; Roehl, K.E.; Czurda, K. Chapter 8 Electrokinetic techniques. In Trace Metals and Other Contaminants in the Environment; Elsevier: Amsterdam, The Netherlands, 2005; Volume 7. [Google Scholar]
- Kim, K.-J.; Kim, D.-H.; Yoo, J.-C.; Baek, K. Electrokinetic extraction of heavy metals from dredged marine sediment. Sep. Purif. Technol. 2011, 79, 164–169. [Google Scholar] [CrossRef]
- Iannelli, R.; Masi, M.; Ceccarini, A.; Ostuni, M.; Lageman, R.; Muntoni, A.; Spiga, D.; Polettini, A.; Marini, A.; Pomi, R. Electrokinetic remediation of metal-polluted marine sediments: Experimental investigation for plant design. Electrochim. Acta 2015, 181, 146–159. [Google Scholar] [CrossRef]
- Rozas, F.; Castellote, M. Electrokinetic remediation of dredged sediments polluted with heavy metals with different enhancing electrolytes. Electrochim. Acta 2012, 86, 102–109. [Google Scholar] [CrossRef]
- Acar, Y.B.; Alshawabkeh, A.N. Principles of electrokinetic remediation. Environ. Sci. Technol. 1993, 27, 2638–2647. [Google Scholar] [CrossRef]
- Yeung, A.T.; Gu, Y.-Y. A review on techniques to enhance electrochemical remediation of contaminated soils. J. Hazard. Mater. 2011, 195, 11–29. [Google Scholar] [CrossRef] [PubMed]
- Cameselle, C.; Reddy, K.R. Effects of Periodic Electric Potential and Electrolyte Recirculation on Electrochemical Remediation of Contaminant Mixtures in Clayey Soils. Water Air Soil Pollut. 2013, 224. [Google Scholar] [CrossRef]
- Rubio-Nieblas, V.; Pérez-Tello, M.; Jacobs, R.A.; Herrera-Urbina, R.; Moreno-Zazueta, S.A. Two-Dimensional Computational Modeling of the Electrokinetic Remediation of a Copper-Contaminated Soil Part I: Model Validation. DYNA 2014, 81, 199. [Google Scholar] [CrossRef]
- Jacobs, R.A.; Probstein, R.F. Two-dimensional modeling of electroremediation. AIChE J. 1996, 42, 1685–1696. [Google Scholar] [CrossRef]
- Rubio-Nieblas, V.; Pérez-Tello, M.; Jacobs, R.A.; Urbina, R.H. Two-Dimensional Computational Modeling of the Electrokinetic Remediation of a Copper-Contaminated Soil Part II: Sensitivity Analysis for a Triangular Soil Field. DYNA 2014, 81, 208. [Google Scholar] [CrossRef]
- Paz-Garcia, J.M.; Johannesson, B.; Ottosen, L.M.; Ribeiro, A.; Rodríguez-Maroto, J.M. Modeling of electrokinetic processes by finite element integration of the Nernst–Planck–Poisson system of equations. Sep. Purif. Technol. 2011, 79, 183–192. [Google Scholar] [CrossRef]
- Paz-Garcia, J.M.; Baek, K.; Alshawabkeh, I.D.; Alshawabkeh, A.N. A generalized model for transport of contaminants in soil by electric fields. J. Environ. Sci. Health Part A 2012, 47, 308–318. [Google Scholar] [CrossRef] [PubMed]
- Alshawabkeh, A.N.; Acar, Y.B. Electrokinetic Remediation. II: Theoretical Model. J. Geotech. Eng. 1996, 122, 186–196. [Google Scholar] [CrossRef]
- Lukić, B.; Panico, A.; Huguenot, D.; Fabbricino, M.; van Hullebusch, E.D.; Esposito, G. A review on the efficiency of landfarming integrated with composting as a soil remediation treatment. Environ. Technol. Rev. 2017, 6, 94–116. [Google Scholar] [CrossRef]
- Maila, M.P.; Cloete, T. Bioremediation of petroleum hydrocarbons through landfarming: Are simplicity and cost-effectiveness the only advantages? Rev. Environ. Sci. Biotechnol. 2004, 3, 349–360. [Google Scholar] [CrossRef] [Green Version]
- Paudyn, K.; Rutter, A.; Rowe, R.K.; Poland, J.S. Remediation of hydrocarbon contaminated soils in the Canadian Arctic by landfarming. Cold Reg. Sci. Technol. 2008, 53, 102–114. [Google Scholar] [CrossRef]
- Gan, S.; Von Lau, E.; Ng, H.K. Remediation of soils contaminated with polycyclic aromatic hydrocarbons (PAHs). J. Hazard. Mater. 2009, 172, 532–549. [Google Scholar] [CrossRef]
- Tyagi, M.; da Fonseca, M.M.; De Carvalho, C.C.C.R. Bioaugmentation and biostimulation strategies to improve the effectiveness of bioremediation processes. Biogeochemistry 2010, 22, 231–241. [Google Scholar] [CrossRef]
- Gentry, T.; Rensing, C.; Pepper, I. New Approaches for Bioaugmentation as a Remediation Technology. Crit. Rev. Environ. Sci. Technol. 2004, 34, 447–494. [Google Scholar] [CrossRef]
- Corominas, L.; Foley, J.; Guest, J.; Hospido, A.; Larsen, H.; Morera, S.; Shaw, A. Life cycle assessment applied to wastewater treatment: State of the art. Water Res. 2013, 47, 5480–5492. [Google Scholar] [CrossRef] [PubMed]
- Higgins, M.R.; Olson, T. Life-Cycle Case Study Comparison of Permeable Reactive Barrier versus Pump-and-Treat Remediation. Environ. Sci. Technol. 2009, 43, 9432–9438. [Google Scholar] [CrossRef]
- Sanscartier, D.; Margni, M.; Reimer, K.; Zeeb, B. Comparison of the Secondary Environmental Impacts of Three Remediation Alternatives for a Diesel-contaminated Site in Northern Canada. Soil Sediment Contam. Int. J. 2010, 19, 338–355. [Google Scholar] [CrossRef]
- Lemming, G.; Hauschild, M.Z.; Chambon, J.C.C.; Binning, P.J.; Bulle, C.; Margni, M.; Bjerg, P.L. Environmental Impacts of Remediation of a Trichloroethene-Contaminated Site: Life Cycle Assessment of Remediation Alternatives. Environ. Sci. Technol. 2010, 44, 9163–9169. [Google Scholar] [CrossRef] [PubMed]
- Suer, P.; Andersson-Sköld, Y. Biofuel or excavation?—Life cycle assessment (LCA) of soil remediation options. Biomass Bioenergy 2011, 35, 969–981. [Google Scholar] [CrossRef]
- Hu, X.; Zhu, J.; Ding, Q. Environmental life-cycle comparisons of two polychlorinated biphenyl remediation technologies: Incineration and base catalyzed decomposition. J. Hazard. Mater. 2011, 191, 258–268. [Google Scholar] [CrossRef] [PubMed]
- Page, C.A.; Diamond, M.L.; Campbell, M.; McKenna, S. Life-cycle framework for assessment of site remediation options: Case study. Environ. Toxicol. Chem. 1999, 18, 801–810. [Google Scholar] [CrossRef]
- Barjoveanu, G.; De Gisi, S.; Casale, R.; Todaro, F.; Notarnicola, M.; Teodosiu, C. A life cycle assessment study on the stabilization/solidification treatment processes for contaminated marine sediments. J. Clean. Prod. 2018, 201, 391–402. [Google Scholar] [CrossRef]
- Kim, D.H.; Yoo, J.-C.; Hwang, B.-R.; Yang, J.-S.; Baek, K. Environmental assessment on electrokinetic remediation of multimetal-contaminated site: A case study. Environ. Sci. Pollut. Res. 2014, 21, 6751–6758. [Google Scholar] [CrossRef]
- Vocciante, M.; Caretta, A.; Bua, L.; Bagatin, R.; Ferro, S. Enhancements in ElectroKinetic Remediation Technology: Environmental assessment in comparison with other configurations and consolidated solutions. Chem. Eng. J. 2016, 289, 123–134. [Google Scholar] [CrossRef]
- Hou, D.; Al-Tabbaa, A.; Guthrie, P.; Hellings, J.; Gu, Q. Using a hybrid LCA method to evaluate the sustainability of sediment remediation at the London Olympic Park. J. Clean. Prod. 2014, 83, 87–95. [Google Scholar] [CrossRef]
- Keng, Z.X.; Chong, S.; Ng, C.G.; Ridzuan, N.I.; Hanson, S.; Pan, G.-T.; Lau, P.L.; Supramaniam, C.V.; Singh, A.; Chin, C.F.; et al. Community-scale composting for food waste: A life-cycle assessment-supported case study. J. Clean. Prod. 2020, 261, 121220. [Google Scholar] [CrossRef]
- Saer, A.; Lansing, S.; Davitt, N.H.; Graves, R.E. Life cycle assessment of a food waste composting system: Environmental impact hotspots. J. Clean. Prod. 2013, 52, 234–244. [Google Scholar] [CrossRef]
- International Standard Organisation. ISO 14040, Environmental Management—Life Cycle Assessment—Principles and Framework; International Organization for Standardization: Geneva, Switzerland, 2006. [Google Scholar]
- International Standard Organisation. ISO 14044, Environmental Management—Life Cycle Assessment—Requirements and Guidelines; International Organization for Standardization: Geneva, Switzerland, 2006. [Google Scholar]
- Feng, N.-X.; Yu, J.; Zhao, H.-M.; Cheng, Y.-T.; Mo, C.-H.; Cai, Q.-Y.; Li, Y.-W.; Li, H.; Wong, M.H. Efficient phytoremediation of organic contaminants in soils using plant–endophyte partnerships. Sci. Total. Environ. 2017, 583, 352–368. [Google Scholar] [CrossRef]
- Lone, M.I.; He, Z.-L.; Stoffella, P.J.; Yang, X.-E. Phytoremediation of heavy metal polluted soils and water: Progresses and perspectives. J. Zhejiang Univ. Sci. B 2008, 9, 210–220. [Google Scholar] [CrossRef] [PubMed] [Green Version]
- Pecorini, I.; Iannelli, R.; Ceccarini, A.; Di Gregorio, S.; Pilato, F.; Simona, M. T3—Sviluppo di STRATEGIE di Gestione E Trattamento dei Sedimenti di Dragaggio Contaminati. Available online: http://interreg-maritime.eu/web/grrinport (accessed on 2 June 2021).
- Saleem, M.; Chakrabarti, M.H.; Irfan, M.F.; Hajimolana, S.A.; Hussain, M.A.; Diya’uddeen, B.H.; Daud, W.M.A.W. Electrokinetic remediation of nickel from low permeability soil. Int. J. Electrochem. Sci. 2011, 96, 4264–4275. [Google Scholar]
- Rosestolato, D.; Bagatin, R.; Ferro, S. Electrokinetic remediation of soils polluted by heavy metals (mercury in particular). Chem. Eng. J. 2015, 264, 16–23. [Google Scholar] [CrossRef]
- Belviolandi, P. Ricerca Sperimentale sui Processi di Lavaggio dei Suoli Contaminati E Ottimizzazione del Ciclo Acque; Universita’ Degli Studi Di Brescia: Brescia, Italy, 2004. [Google Scholar]
- Bianco, F.; Monteverde, G.; Race, M.; Papirio, S.; Esposito, G. Comparing performances, costs and energy balance of ex situ remediation processes for PAH-contaminated marine sediments. Environ. Sci. Pollut. Res. 2020, 27, 19363–19374. [Google Scholar] [CrossRef] [PubMed]
- Qasim, M.; Badrelzaman, M.; Darwish, N.N.; Darwish, N.A.; Hilal, N. Reverse osmosis desalination: A state-of-the-art review. Desalination 2019, 459, 59–104. [Google Scholar] [CrossRef] [Green Version]
- Zhou, J.; Chang, V.W.-C.; Fane, A.G. Environmental life cycle assessment of reverse osmosis desalination: The influence of different life cycle impact assessment methods on the characterization results. Desalination 2011, 283, 227–236. [Google Scholar] [CrossRef]
- Bennamoun, L.; Arlabosse, P.; Leonard, A. Review on fundamental aspect of application of drying process to wastewater sludge. Renew. Sustain. Energy Rev. 2013, 28, 29–43. [Google Scholar] [CrossRef] [Green Version]
- Arlabosse, P.; Ferrasse, J.H.; Lecomte, D.; Crine, M.; Dumont, Y.; Léonard, A. Efficient Sludge Thermal Processing: From Drying to Thermal Valorization. Mod. Dry. Technol. 2012, 4, 295–329. [Google Scholar]
- Masi, M.; Iannelli, R. Trattamento elettrocinetico di sedimenti di dragaggio portuale contaminati da metalli pesanti: Il progetto life+ ‘SEKRET’. Ing. dell’Ambiente 2015, 2. [Google Scholar] [CrossRef]
- Morillo, J.; Usero, J.; Rosado, D.; El Bakouri, H.; Riaza, A.; Bernaola, F.-J. Comparative study of brine management technologies for desalination plants. Desalination 2014, 336, 32–49. [Google Scholar] [CrossRef]
- Juwarkar, A.A.; Singh, S.K.; Mudhoo, A. A comprehensive overview of elements in bioremediation. Rev. Environ. Sci. Bio/Technol. 2010, 9, 215–288. [Google Scholar] [CrossRef]
- Suárez-Estrella, F.; García, M.D.C.V.; López, M.; Capel, C.; Moreno, J. Antagonistic activity of bacteria and fungi from horticultural compost against Fusarium oxysporum f. sp. melonis. Crop. Prot. 2007, 26, 46–53. [Google Scholar] [CrossRef]
- Alabouvette, C.; Olivain, C.; Migheli, Q.; Steinberg, C. Microbiological control of soil-borne phytopathogenic fungi with special emphasis on wilt-inducingFusarium oxysporum. New Phytol. 2009, 184, 529–544. [Google Scholar] [CrossRef]
- Becarelli, S.; Chicca, I.; Siracusa, G.; La China, S.; Gentini, A.; Lorenzi, R.; Munz, G.; Petroni, G.; Levin, D.B.; Di Gregorio, S. Hydrocarbonoclastic Ascomycetes to enhance co-composting of total petroleum hydrocarbon (TPH) contaminated dredged sediments and lignocellulosic matrices. New Biotechnol. 2019, 50, 27–36. [Google Scholar] [CrossRef]
- Evangelisti, S.; Clift, R.; Tagliaferri, C.; Lettieri, P. A life cycle assessment of distributed energy production from organic waste: Two case studies in Europe. Waste Manag. 2017, 64, 371–385. [Google Scholar] [CrossRef] [Green Version]
- Francini, G.; Lombardi, L.; Freire, F.; Pecorini, I.; Marques, P. Environmental and Cost Life Cycle Analysis of Different Recovery Processes of Organic Fraction of Municipal Solid Waste and Sewage Sludge. Waste Biomass Valorization 2019, 10, 3613–3634. [Google Scholar] [CrossRef]
- Guinée, J.B. Handbook on Life Cycle Assessment: Operational Guide to the ISO Standards; Kluwer: Dordrecht, The Netherlands, 2001. [Google Scholar]
- Laurent, A.; Bakas, I.; Clavreul, J.; Bernstad, A.; Niero, M.; Gentil, E.; Hauschild, M.Z.; Christensen, T.H. Review of LCA studies of solid waste management systems—Part I: Lessons learned and perspectives. Waste Manag. 2014, 34, 573–588. [Google Scholar] [CrossRef]
- Meng, Z.-F.; Zhang, Y.-P.; Wang, G.-D. Sorption of Heavy Metal and Organic Pollutants on Modified Soils. Pedosphere 2007, 17, 235–245. [Google Scholar] [CrossRef]
- Tang, X.; Shen, C.; Chen, L.; Xiao, X.; Wu, J.; Khan, M.I.; Dou, C.; Chen, Y. Inorganic and organic pollution in agricultural soil from an emerging e-waste recycling town in Taizhou area, China. J. Soils Sediments 2010, 10, 895–906. [Google Scholar] [CrossRef]
Publisher’s Note: MDPI stays neutral with regard to jurisdictional claims in published maps and institutional affiliations. |
© 2021 by the authors. Licensee MDPI, Basel, Switzerland. This article is an open access article distributed under the terms and conditions of the Creative Commons Attribution (CC BY) license (https://creativecommons.org/licenses/by/4.0/).