
Life Cycle Assessment of a Plant-Based, Regionally Marketed Shampoo and Analysis of Refill Options


Abstract
:1. Introduction
2. Methods
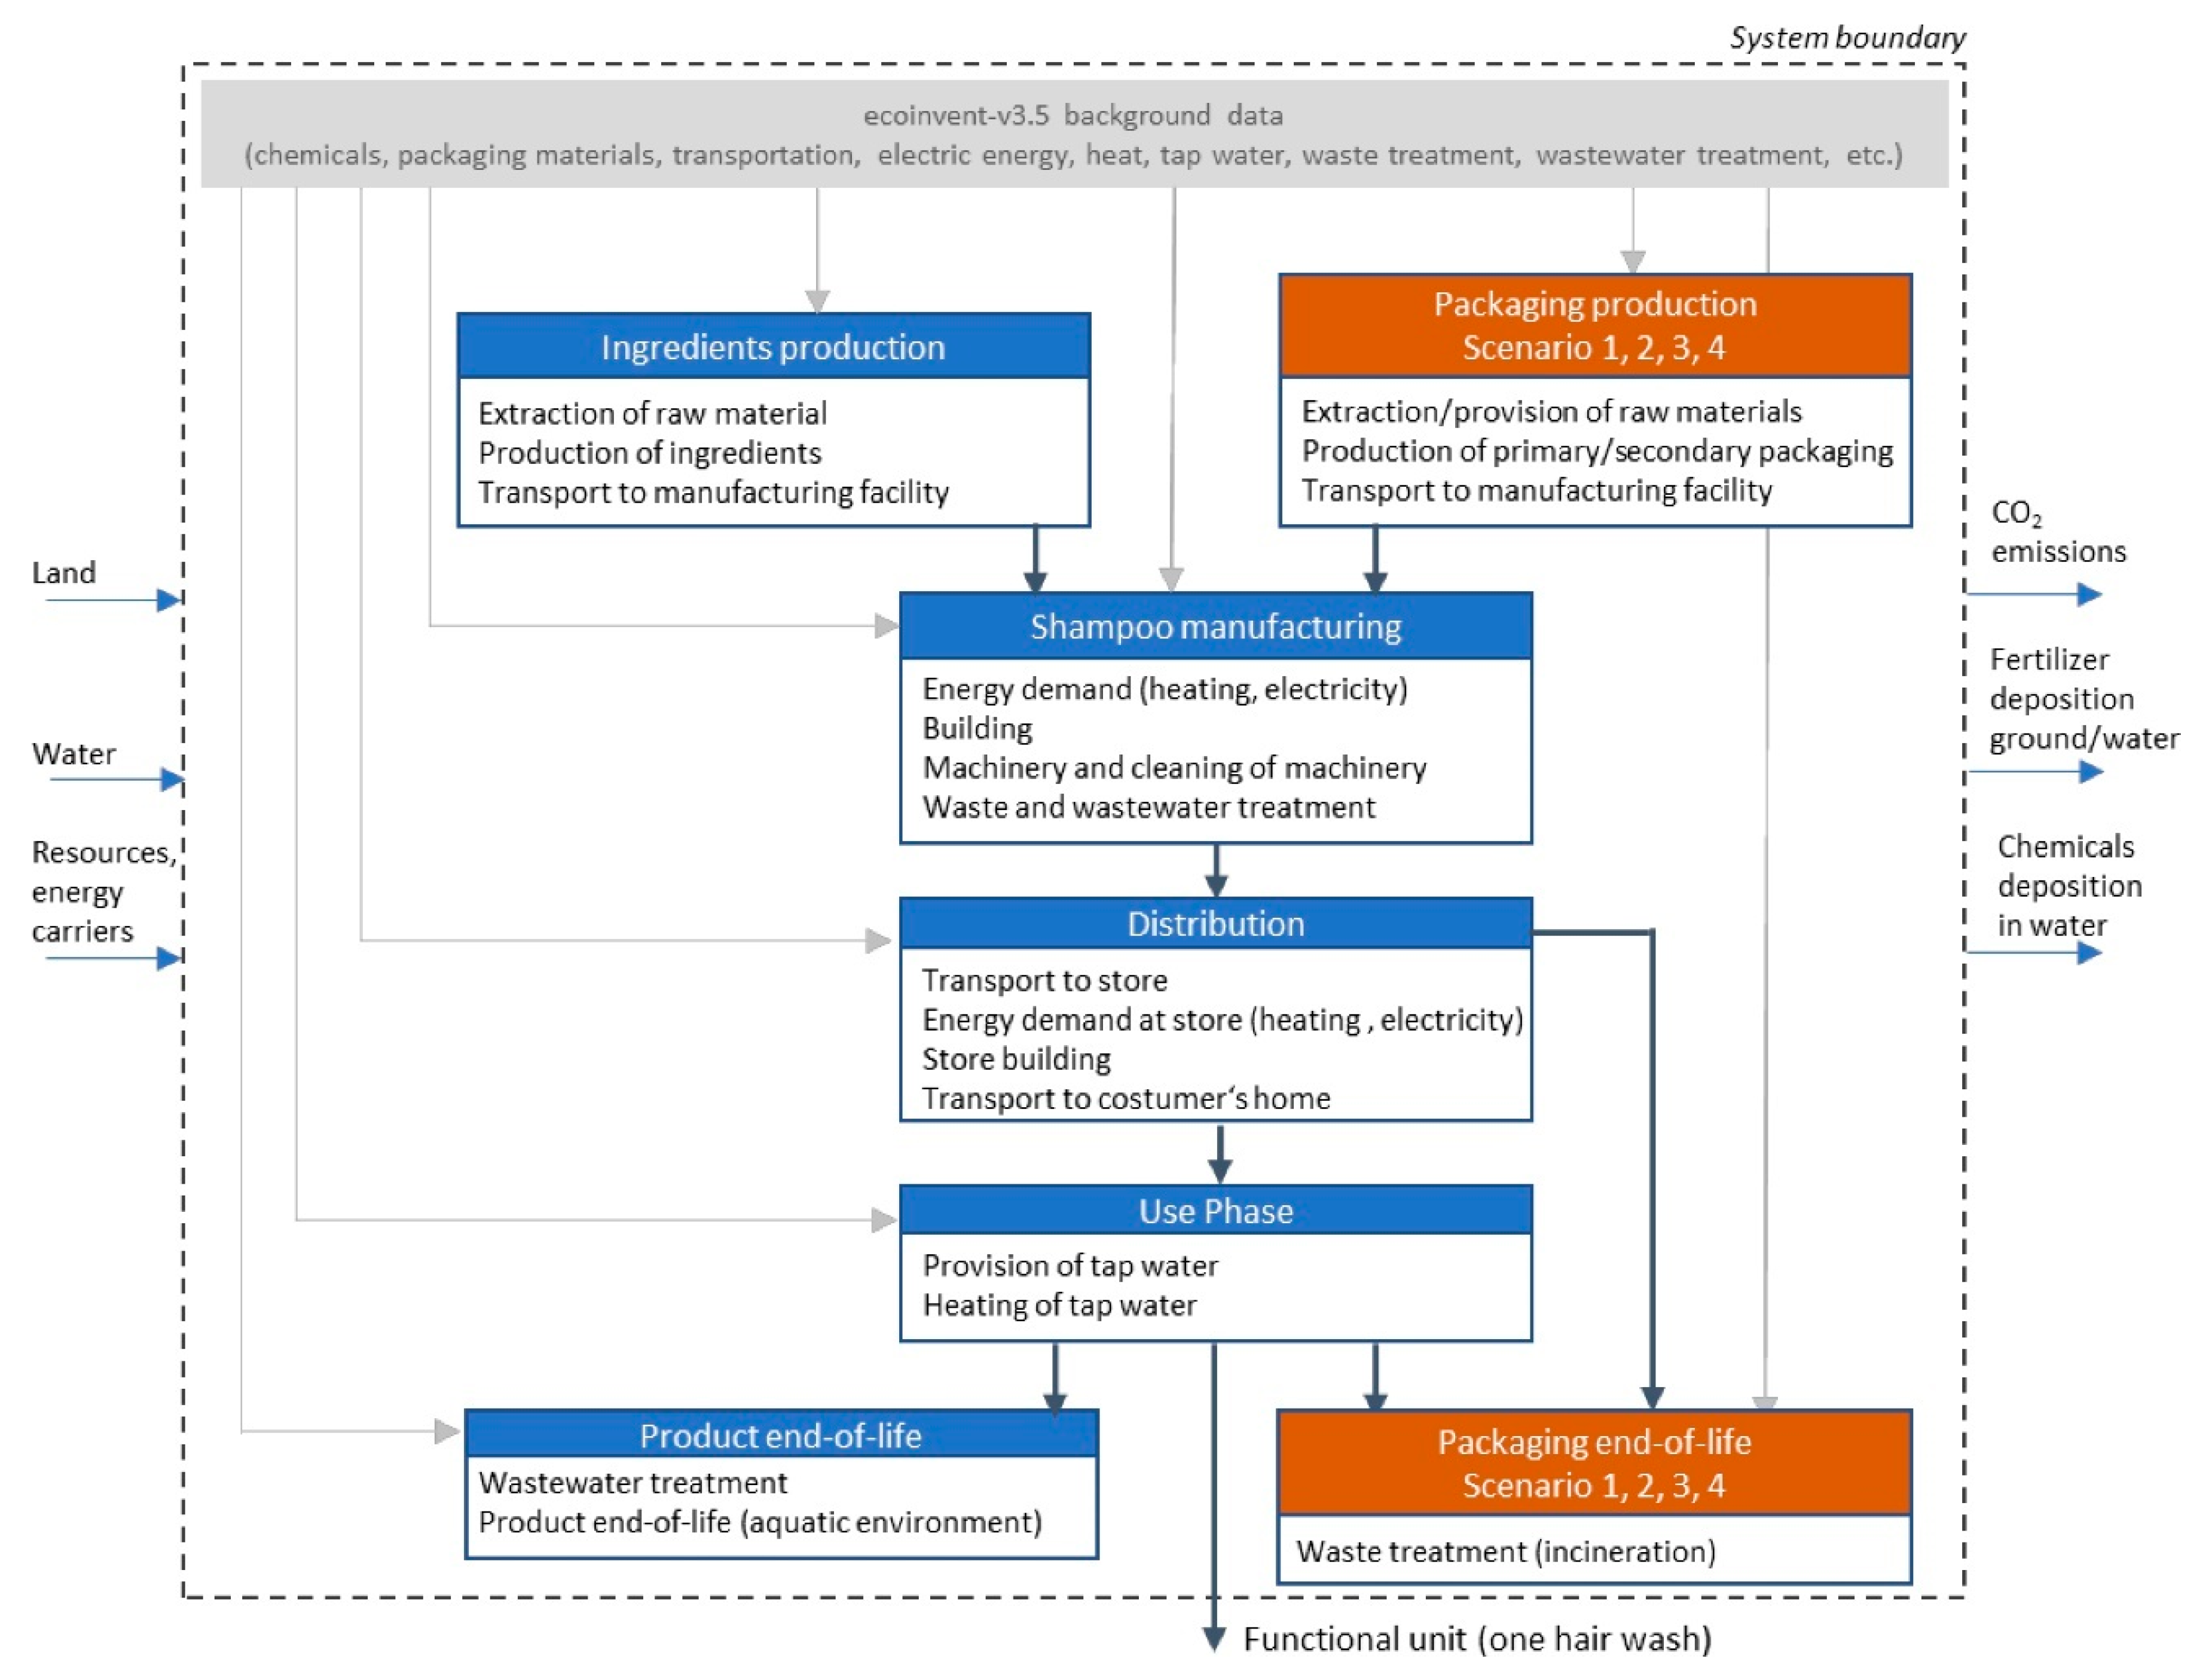
2.1. Functional Unit and Investigated Product System
- Scenario 1 represented the basic version in which the shampoo was sold in a 500 mL glass bottle, including a dispenser pump made of polyethylene (PE) and polypropylene (PP), and packed in a small carton box as part of the primary packaging;
- Scenario 2 represented an already existing refill option, which allowed customers to refill their own bottles or containers in company-owned local shops out of single-use 5 L canisters made of tin;
- Scenario 3 described a potential alternative to the existing refill option, assuming the use of single-use 25 L plastic canisters made from PE for refill;
- Scenario 4 described another potential alternative to the existing refill option, selling refill portions in 500 mL stand-up pouches made from polyethylene terephthalate (PET).
2.2. Data Collection and Life Cycle Inventory
2.3. Allocation and Recycling Processes
2.4. Impact Assessment
3. Results
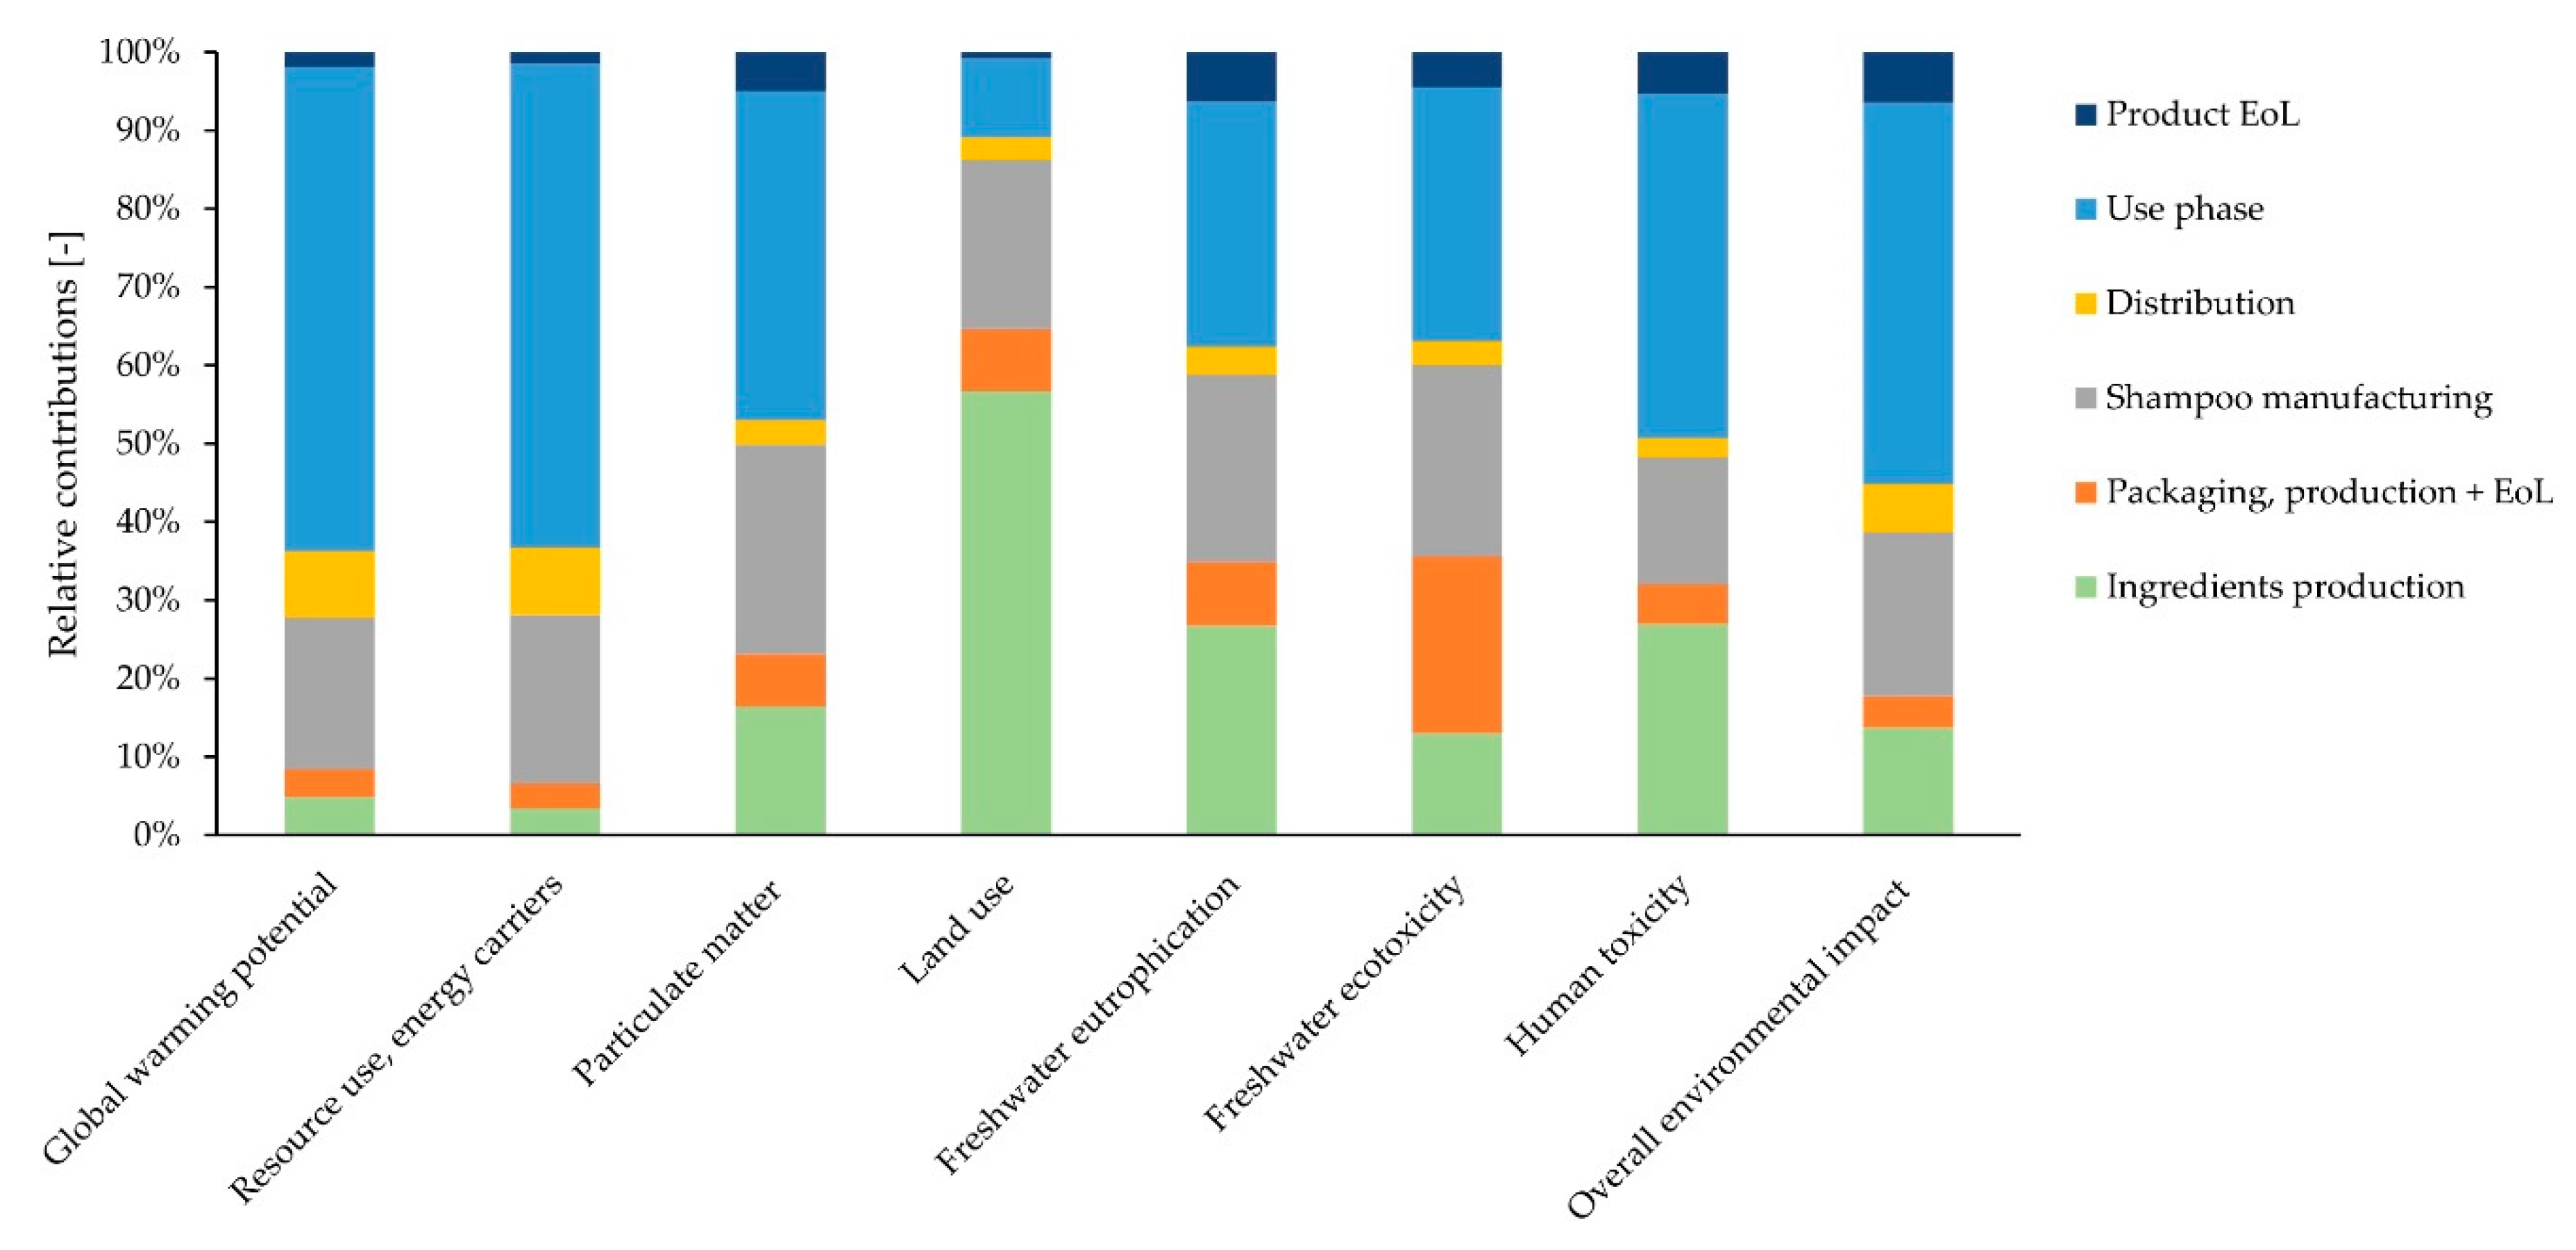
3.1. Life Cycle Environmental Impact
3.1.1. Ingredients Production
3.1.2. Packaging Production and End-of-Life
3.1.3. Shampoo Manufacturing
3.1.4. Distribution
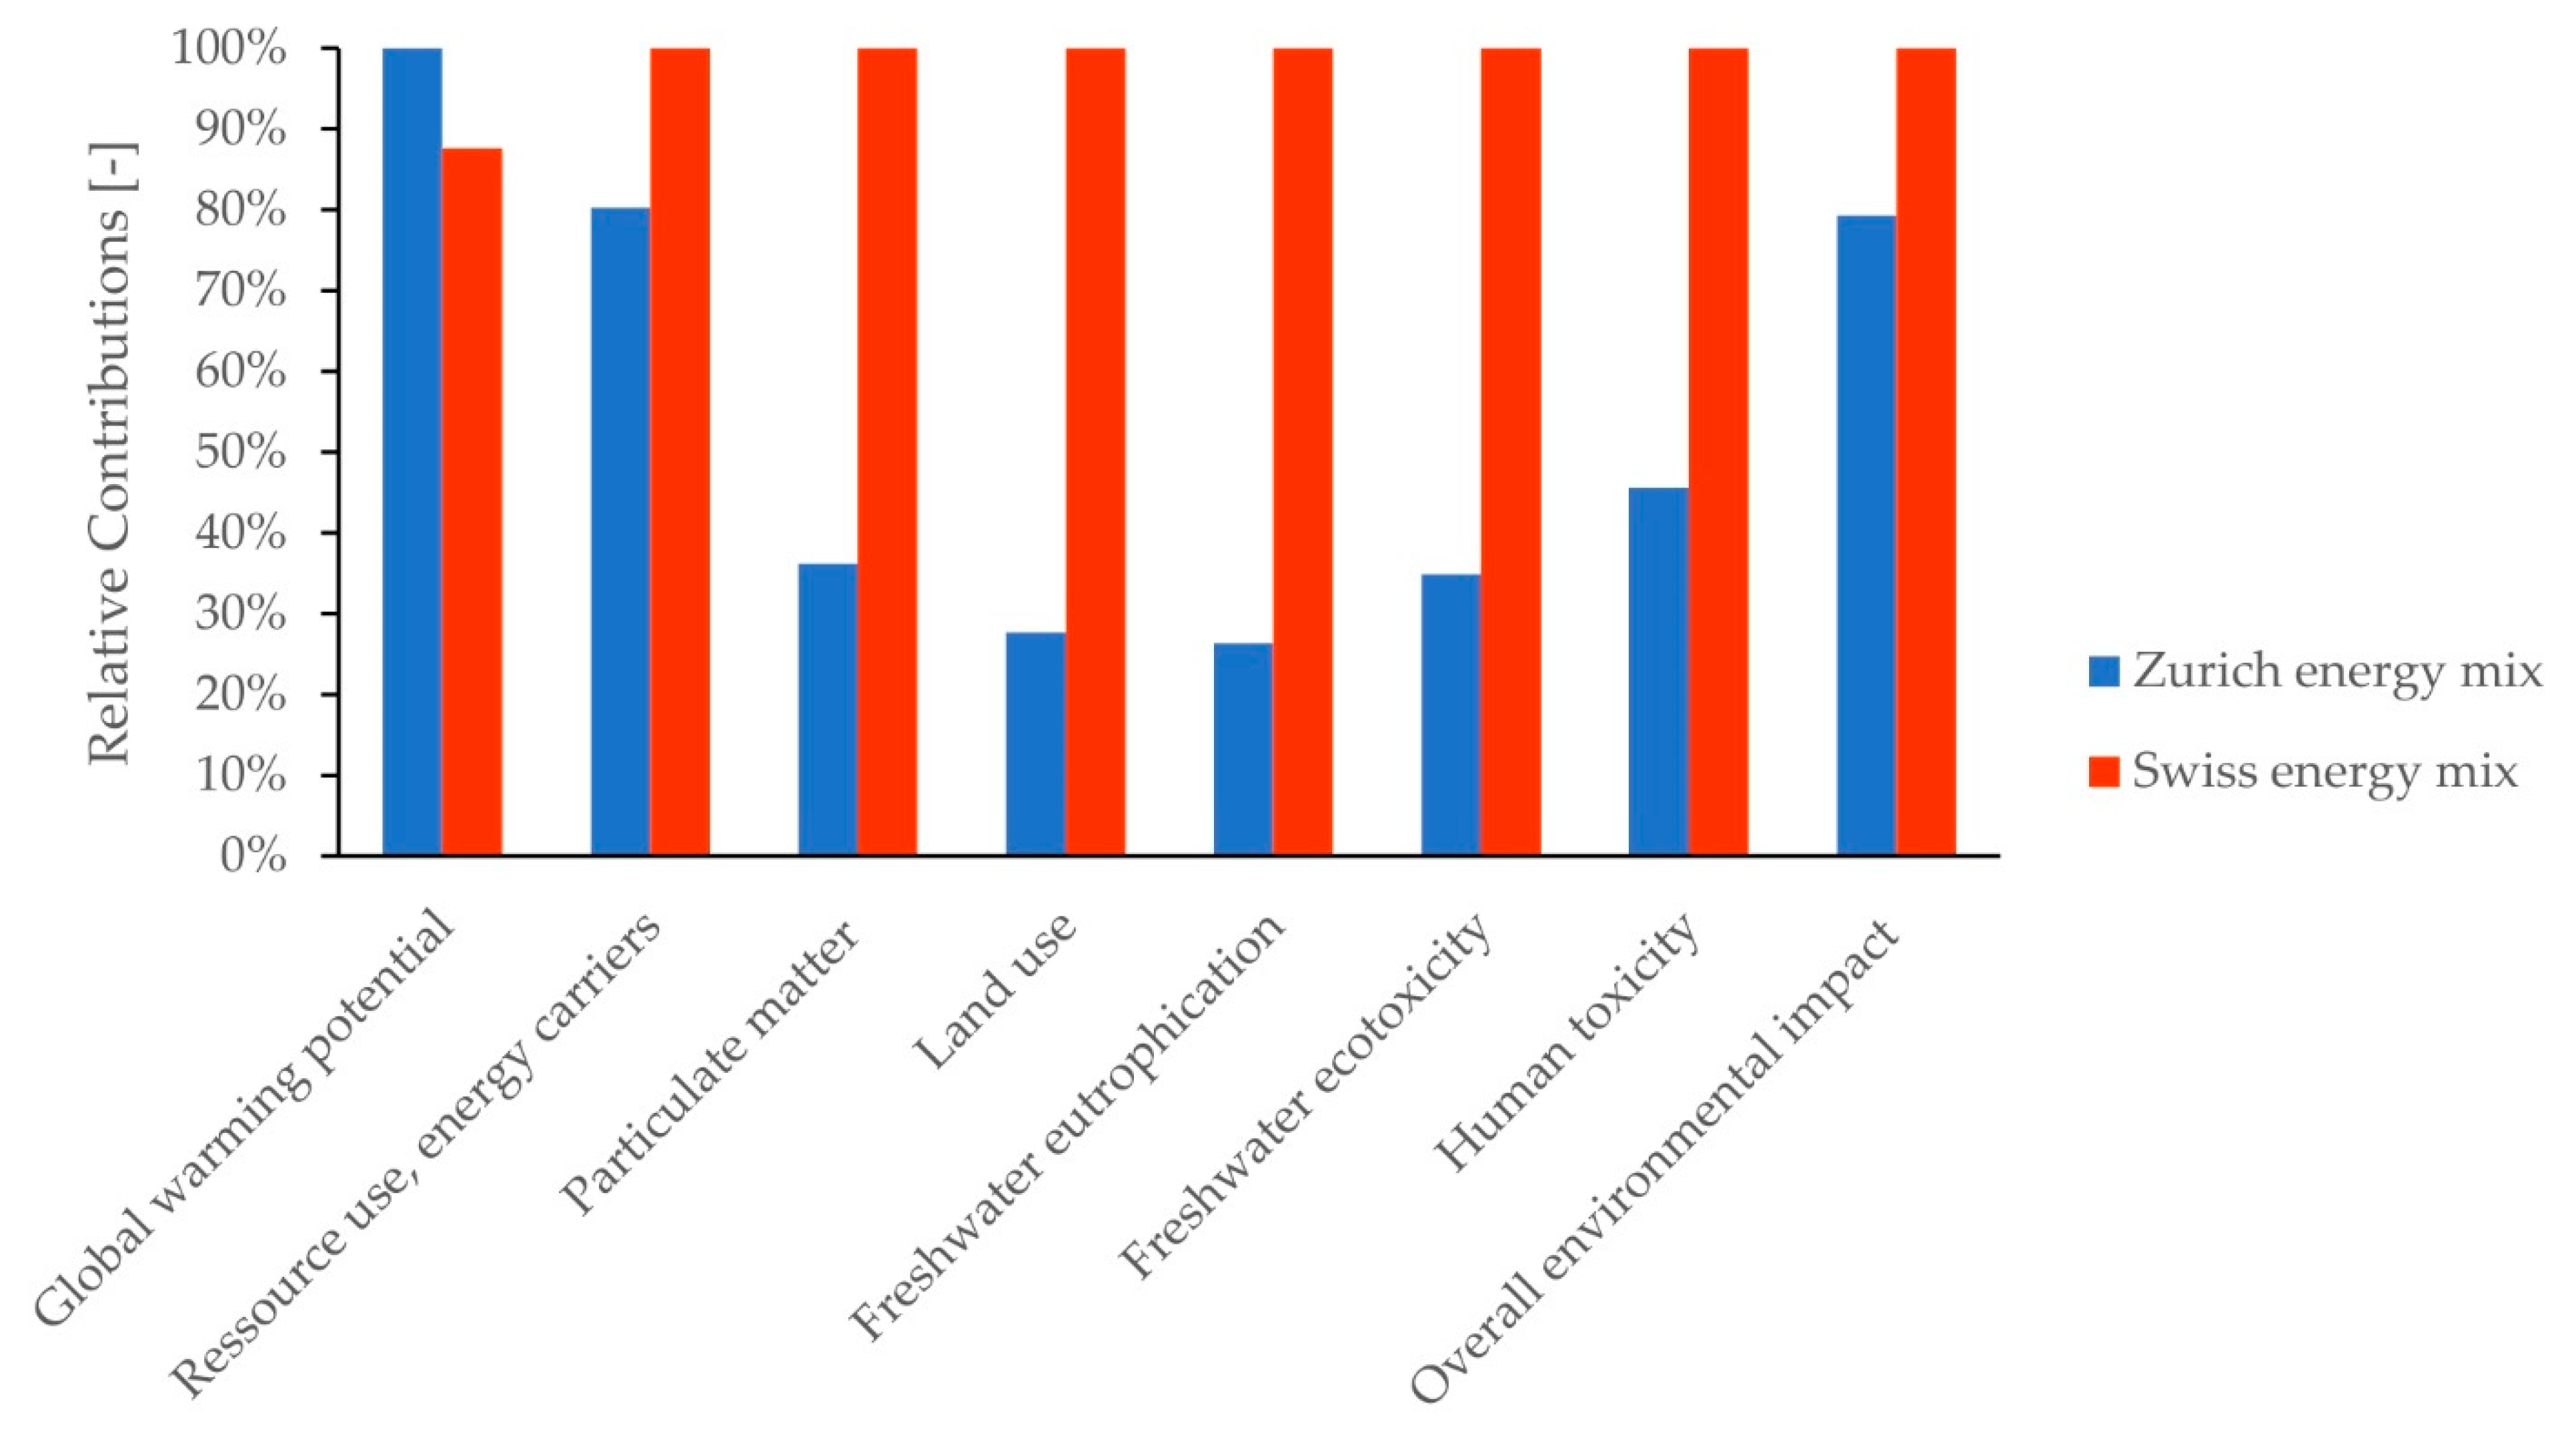
3.1.5. Use Phase
3.1.6. Product End-of-Life
3.2. Comparison of Different Packaging and Refill Scenarios
3.3. Sensitivity Analysis Concerning Use Phase
4. Discussion
4.1. Considerations on Data Quality, Limitations and Research Recommendations
4.2. Comparison to Literature
4.3. Recommendations to Mitigate Environmental Impact of Shampoo
4.3.1. Use Phase
4.3.2. Manufacturing and Distribution
4.3.3. Packaging Production and End-of-Life
4.3.4. Ingredients Production and End-of-Life
5. Conclusions
Supplementary Materials
Author Contributions
Funding
Data Availability Statement
Conflicts of Interest
References
- Ficheux, A.S.; Wesolek, N.; Chevillotte, G.; Roudot, A.C. Consumption of Cosmetic Products by the French Population. First Part: Frequency Data. Food Chem. Toxicol. 2015, 78, 159–169. [Google Scholar] [CrossRef] [PubMed]
- Hall, B.; Tozer, S.; Safford, B.; Coroama, M.; Steiling, W.; Leneveu-Duchemin, M.C.; McNamara, C.; Gibney, M. European Consumer Exposure to Cosmetic Products, a Framework for Conducting Population Exposure Assessments. Food Chem. Toxicol. 2007, 45, 2097–2108. [Google Scholar] [CrossRef] [PubMed]
- Koehler, A.; Wildbolz, C. Comparing the Environmental Footprints of Home-Care and Personal-Hygiene Products: The Relevance of Different Life-Cycle Phases. Environ. Sci. Technol. 2009, 43, 8643–8651. [Google Scholar] [CrossRef] [PubMed]
- Quantis. PEF Shampoo Screening Report in the Context of the Study into the Development of Product Environmental Footprint Category Rules (PEFCR). Available online: https://cosmeticseurope.eu/how-we-take-action/driving-sustainable-development (accessed on 20 May 2020).
- Study into the Development of Product Environmental Footprint Category Rules for Shampoo; Quantis: Lausanne, Switzerland, 2016.
- Escamilla, M.; Ferrer, A.; Fuentes, N.; Hidalgo, C.; Renata, K.; Kougoulis, J. Revision of European Ecolabel Criteria for Soaps, Shampoos and Hair Conditioners; Preliminary Results from the Technical Analysis (Draft); Joint Research Centre (JRC) of the European Commission: Brussels, Belgium, 2012. [Google Scholar]
- Rebello, S.; Asok, A.K.; Mundayoor, S.; Jisha, M.S. Surfactants: Toxicity, Remediation and Green Surfactants. Environ. Chem. Lett. 2014, 12, 275–287. [Google Scholar] [CrossRef]
- Bhadani, A.; Kafle, A.; Ogura, T.; Akamatsu, M.; Sakai, K.; Sakai, H.; Abe, M. Current Perspective of Sustainable Surfactants Based on Renewable Building Blocks. Curr. Opin. Colloid Interface Sci. 2020, 45, 124–135. [Google Scholar] [CrossRef]
- Wiegmann, K.; Hünecke, K.; Moch, K.; Hennenberg, K.J.; Fehrenbach, H. Blauer Engel Biobasierte Produkte—Abschlussbericht Teil 4: PROSA Biobasierte Wasch- und Reinigungsmittel; Federal Environmental Agency (Umweltbundesamt, UBA): Dessau-Rosslau, Germany, 2019. [Google Scholar]
- European Bioplastics. Bioplastics Market Data. Available online: https://www.european-bioplastics.org/market/ (accessed on 13 June 2020).
- Tasaki, T.; Yamakawa, H. An Estimation of the Effectiveness of Waste Prevention by Using Point-of-Sales (POS) Data—The Case of Refills for Shampoo and Hair Conditioner in Japan. Resour. Conserv. Recycl. 2011, 57, 61–66. [Google Scholar] [CrossRef]
- Coelho, P.M.; Corona, B.; ten Klooster, R.; Worrell, E. Sustainability of Reusable Packaging–Current Situation and Trends. Resour. Conserv. Recycl. X 2020, 6, 100037. [Google Scholar] [CrossRef]
- Kunamaneni, S.; Jassi, S.; Hoang, D. Promoting Reuse Behaviour: Challenges and Strategies for Repeat Purchase, Low-Involvement Products. Sustain. Prod. Consum. 2019, 20, 253–272. [Google Scholar] [CrossRef]
- Branska, L.; Patak, M.; Hromadnikova, K.; Pecinova, Z. Sales of Consumer Chemicals in Zero-Packaging Stores—A Challenge for Small and Medium-Sized Chemical Companies. Hradec Econ. Days 2021, 11, 98–106. [Google Scholar] [CrossRef]
- Haerulloh, A.A.; Hiwari, H. Bulk Store as an Effort to Reduce Marine Debris in Bajo Pulau. J. Perspekt. Pembiayaan Dan Pembang. Drh. 2020, 8, 475–486. [Google Scholar] [CrossRef]
- Boesen, S.; Bey, N.; Niero, M. Environmental Sustainability of Liquid Food Packaging: Is There a Gap between Danish Consumers’ Perception and Learnings from Life Cycle Assessment? J. Clean. Prod. 2019, 210, 1193–1206. [Google Scholar] [CrossRef]
- Dinkel, F.; Kägi, T. Ökobilanz Getränkeverpackungen, Gesamtbericht; Carbotech, A.G., Ed.; Federal Office for the Environment (FOEN): Bern, Switzerland, 2014. [Google Scholar]
- Ferrara, C.; De Feo, G. Comparative Life Cycle Assessment of Alternative Systems for Wine Packaging in Italy. J. Clean. Prod. 2020, 259, 120888. [Google Scholar] [CrossRef]
- ISO 14040:2006. Environmental Management—Life Cycle Assessment—Principles and Framework; International Organization for Standardization: Geneva, Switzerland, 2009. [Google Scholar]
- SimaPro. PRéConsultants, Amersfoort, The Netherlands. Available online: https://pre-sustainability.com/solutions/tools/simapro/ (accessed on 28 April 2021).
- McNamara, C.; Rohan, D.; Golden, D.; Gibney, M.; Hall, B.; Tozer, S.; Safford, B.; Coroama, M.; Leneveu-Duchemin, M.C.; Steiling, W. Probabilistic Modelling of European Consumer Exposure to Cosmetic Products. Food Chem. Toxicol. 2007, 45, 2086–2096. [Google Scholar] [CrossRef] [PubMed]
- Wernet, G.; Bauer, C.; Steubing, B.; Reinhard, J.; Moreno-Ruiz, E.; Weidema, B. The Ecoinvent Database Version 3 (Part I): Overview and Methodology. Int. J. Life Cycle Assess. 2016, 21, 1218–1230. [Google Scholar] [CrossRef]
- Beccali, M.; Cellura, M.; Iudicello, M.; Mistretta, M. Resource Consumption and Environmental Impacts of the Agrofood Sector: Life Cycle Assessment of Italian Citrus-Based Products. Environ. Manag. 2009, 43, 707–724. [Google Scholar] [CrossRef] [PubMed]
- Google Maps. Available online: https://www.google.ch/maps (accessed on 28 June 2020).
- Stromkennzeichnung (Electricity Disclosure). Available online: https://www.strom.ch/de/service/stromkennzeichnung (accessed on 23 October 2020).
- Erneuerbare Energien auf dem Vormarsch; City of Zurich, Switzerland. Available online: https://www.stadt-zuerich.ch/prd/de/index/statistik/publikationen-angebote/publikationen/webartikel/2017-08-21_Erneuerbare-Energien-auf-dem-Vormarsch.html#energietraegermix2017 (accessed on 28 September 2020).
- Doka, G. Life Cycle Inventories of Waste Treatment Services, Part IV Wastewater Treatment; Swiss Centre for Life Cycle Inventories: Duebendorf, Switzerland, 2003. [Google Scholar]
- Abfallmengen und Recycling 2018 im Überblick; Federal Office for the Environment (FOEN): Bern, Switzerland, 2019.
- Jordan, U.; Vajen, K. Realistic Domestic Hot-Water Profiles in Different Time Scales; Solar Heating and Cooling Program of the International Energy Agency (IEA SHC), Task 26: Solar Combisystems; University of Marburg: Marburg, Germany, 2001. [Google Scholar]
- Climate Change 2013: The Physical Science Basis. In Contribution of Working Group I to the Fifth Assessment Report of the Intergovernmental Panel on Climate Change, IPCC; Cambridge University Press: Cambridge, UK, 2014.
- Van Oers, L.; De Koning, A.; Guinée, J.B.; Huppes, G. Abiotic Resource Depletion in LCA; Road and Hydraulic Engineering Institute, Ministry of Transport and Water: Amsterdam, The Netherlands, 2002. [Google Scholar]
- Fantke, P.; Evans, J.R.; Hodas, N.; Apte, J.S.; Jantunen, M.J.; Jolliet, O.; McKone, T.E. Health impacts of fine particulate matter. In Global Guidance for Life Cycle Impact Assessment Indicators: Volume 1; UNEP/SETAC Life Cycle Initiative: Paris, France, 2016; pp. 76–99. ISBN 92-807-3630-2. [Google Scholar]
- Bos, U.; Horn, R.; Beck, T.; Lindner, J.P.; Fischer, M. LANCA®-Characterization Factors for Life Cycle Impact Assessment: Version 2.0; Fraunhofer Verlag: Stuttgart, Germany, 2016; ISBN 3-8396-0953-4. [Google Scholar]
- Struijs, J.; Beusen, A.; Van Jaarsveld, H.; Huijbregts, M.A.J. Aquatic Eutrophication. ReCiPe 2008 A Life Cycle Impact Assessment Method Which Comprises Harmonised Category Indicators at the Midpoint and the Endpoint Level. Report I Characterisation. 2009. Available online: https://www.leidenuniv.nl/cml/ssp/publications/recipe_characterisation.pdf (accessed on 9 June 2021).
- Rosenbaum, R.K.; Bachmann, T.M.; Gold, L.S.; Huijbregts, M.A.J.; Jolliet, O.; Juraske, R.; Koehler, A.; Larsen, H.F.; MacLeod, M.; Margni, M.; et al. USEtox—The UNEP-SETAC Toxicity Model: Recommended Characterisation Factors for Human Toxicity and Freshwater Ecotoxicity in Life Cycle Impact Assessment. Int. J. Life Cycle Assess. 2008, 13, 532–546. [Google Scholar] [CrossRef] [Green Version]
- Frischknecht, R.; Büsser Knöpfel, S.; Flury, K.; Stucki, M.; Ahmadi, M. Swiss Eco-Factors 2013 According to the Ecological Scarcity Method; Federal Office for the Environment (FOEN): Bern, Switzerland, 2013. [Google Scholar]
- Kemmler, A.; Spillmann, T.; Piégsa, A.; Notter, B.; Cox, B.; Jakob, M.; Catenazzi, G. Analyse des Schweizerischen Energieverbrauchs 2000–2018 nach Verwendungszwecken; Swiss Federal Office of Energy (SFOE): Bern, Switzerland, 2019. [Google Scholar]
- Ficheux, A.S.; Chevillotte, G.; Wesolek, N.; Morisset, T.; Dornic, N.; Bernard, A.; Bertho, A.; Romanet, A.; Leroy, L.; Mercat, A.C.; et al. Consumption of Cosmetic Products by the French Population Second Part: Amount Data. Food Chem. Toxicol. 2016, 90, 130–141. [Google Scholar] [CrossRef] [PubMed]
- Golsteijn, L. How to Use USEtox® Characterisation Factors in SimaPro. Available online: https://pre-sustainability.com/articles/how-to-use-usetox-characterisation-factors-in-simapro/ (accessed on 28 April 2021).
- Golsteijn, L.; Lessard, L.; Campion, J.-F.; Capelli, A.; D’Enfert, V.; King, H.; Kremer, J.; Krugman, M.; Orliac, H.; Furnemont, S.R.; et al. Developing Product Environmental Footprint Category Rules (PEFCR) for Shampoos: The Basis for Comparable Life Cycle Assessment: Product Environmental Footprint Category Rules for Shampoos. Integr. Environ. Assess. Manag. 2018, 14, 649–659. [Google Scholar] [CrossRef]
- Marktanalyse Nachwachsende Rohstoffe; Fachagentur Nachwachsende Rohstoffe e. V. (FNR): Gülzow-Prüzen, Germany, 2014; ISBN 978-3-942147-18-7.
- Zhang, Y.; Xie, D.; Ni, J.; Zeng, X. Optimizing Phosphate Fertilizer Application to Reduce Nutrient Loss in a Mustard (Brassica Juncea Var. Tumida)-Maize (Zea mays L.) Rotation System in Three Gorges Reservoir Area. Soil Tillage Res. 2019, 190, 78–85. [Google Scholar] [CrossRef]
- Scharfy, D.; Boccali, N.; Stucki, M. Clean Technologies in Agriculture—How to Prioritise Measures? Sustainability 2017, 9, 1303. [Google Scholar] [CrossRef] [Green Version]
- Wrzaszcz, W.; Prandecki, K. Agriculture and the European Green Deal. Probl. Agric. Econ. 2020, 365, 156–179. [Google Scholar] [CrossRef]
- Von Braun, J. Bioeconomy—The Global Trend and Its Implications for Sustainability and Food Security. Glob. Food Secur. 2018, 19, 81–83. [Google Scholar] [CrossRef]


| Ingredient | Function | Composition | Raw Materials |
|---|---|---|---|
| Deionized water | [70–80 w%] | tap water | |
| Propanediol | humectant | [5–10 w%] | maize |
| Coco-Glucoside | surfactant | [5–10 w%] | maize; coconut |
| (Di)Sodium Cocoyl Glutamate | surfactant | [1–5 w%] | coconut; sugar beet/wheat |
| Glycerin | emollient, conditioning | [1–5 w%] | maize/sugar beet/soybean |
| Sodium PCA | conditioning | [1–5 w%] | sugar cane |
| Sodium Levulinate | preservative | [0–1 w%] | cellulose |
| Alcohol | preservative | [0–1 w%] | sugar cane/sugar beet |
| Citric Acid | buffering | [0–1 w%] | - |
| Essential oils and plan extracts | perfuming | [0–0.5 w%] | oranges |
| Component | Material | Content of Recycled Material | Weight per FU |
|---|---|---|---|
| Scenario 1 | |||
| Bottle (500 mL) | brown glass | 69% | 5.1 g |
| Dispenser pump | PE/PP | 0% | 0.21 g |
| Covering box | cardboard | 95% | 0.54 g |
| Box (secondary packaging) | cardboard | 95% | 0.92 g |
| Scenario 2 | |||
| Canister (5 L) | tinplate | 75% | 0.83 g |
| Box (secondary packaging) | cardboard | 95% | 0.51 g |
| Scenario 3 | |||
| Canister (25 L) | PE | 0% | 0.45 g |
| Scenario 4 | |||
| Stand-up pouch (500 mL) | PET | 0% | 0.19 g |
| Box (secondary packaging) | cardboard | 95% | 0.46 g |
| Global Warming Potential | Resource Use, Energy Carriers | Particulate Matter | Land Use | Freshwater Eutrophication | Freshwater Ecotoxicity | Human Toxicity | Overall Environ. Impact | |
|---|---|---|---|---|---|---|---|---|
| Total: | 161 g CO2eq | 2.5 MJ | 3.8 × 10⁻⁹ dis. inc. | 2.1 Pt | 3.3 × 10⁻⁶ Peq | 13.6 PAF·m3·day | 1.3 × 10⁻⁸ cases | 153 eco-points |
| Ingredients; production and transport | ||||||||
| Propanediol | 1.7% | 1.4% | 5.1% | 16% | 9.8% | 4.6% | 13% | 4.3% |
| Coco-Glucoside | 1.0% | 0.6% | 3.6% | 10% | 4.7% | 2.5% | 5.0% | 2.8% |
| Essential oils | 0.4% | 0.4% | 2.8% | 12% | 3.6% | 2.3% | 1.4% | 1.9% |
| Disodium-Cocoyl-Glutamate | 0.5% | 0.3% | 1.9% | 8.3% | 3.2% | 1.2% | 3.8% | 2.1% |
| Glycerin | 0.5% | 0.2% | 0.7% | 4.0% | 1.6% | 0.3% | 1.3% | 0.9% |
| Sodium-Cocoyl-Glutamate | 0.1% | 0.1% | 0.5% | 2.2% | 0.8% | 0.3% | 1.0% | 0.6% |
| Alcohol | 0.1% | 0.05% | 0.4% | 0.9% | 0.4% | 0.3% | 0.3% | 0.2% |
| Total | 4.9% | 3.4% | 16% | 57% | 27% | 13% | 27% | 14% |
| Packaging; production, transport, EoL | ||||||||
| Glass bottle | 1.9% | 1.8% | 3.8% | 4.7% | 5.0% | 5.3% | 2.2% | 2.2% |
| Dispenser pump | 0.7% | 0.8% | 1.0% | 0.2% | 0.6% | 0.6% | 0.5% | 0.6% |
| Carton box, primary packaging | 0.3% | 0.3% | 0.7% | 1.1% | 0.9% | 6.2% | 0.9% | 0.4% |
| Carton board, secondary packaging | 0.5% | 0.5% | 1.2% | 1.8% | 1.6% | 11% | 1.4% | 0.7% |
| Total | 3.5% | 3.4% | 6.8% | 7.9% | 8.2% | 23% | 5.1% | 4.0% |
| Shampoo manufacturing | ||||||||
| Building, including offices | 3.2% | 2.1% | 12% | 19% | 6.5% | 7.8% | 6.8% | 5.4% |
| Heating, with oil | 15% | 13% | 8.8% | 0.8% | 3.7% | 7.5% | 4.5% | 11% |
| Electricity | 1.4% | 5.7% | 5.6% | 1.2% | 13% | 8.1% | 3.4% | 3.7% |
| Total | 19% | 21% | 27% | 22% | 24% | 24% | 16% | 21% |
| Distribution | ||||||||
| Building | 0.4% | 0.2% | 1.3% | 2.1% | 0.7% | 0.8% | 0.7% | 0.6% |
| Heating, with natural gas | 7.9% | 7.8% | 1.1% | 0.2% | 1.7% | 1.3% | 1.2% | 5.1% |
| Transport to costumer’s home | 0.1% | 0.4% | 0.6% | 0.6% | 0.6% | 0.5% | 0.3% | 0.3% |
| Total | 8.4% | 8.5% | 3.1% | 2.9% | 3.6% | 2.9% | 2.4% | 6.1% |
| Use phase | ||||||||
| Heat, from natural gas | 34% | 34% | 4.6% | 0.7% | 7.6% | 5.9% | 5.3% | 22% |
| Heat, from oil | 25% | 23% | 16% | 1.4% | 11% | 15% | 10% | 20% |
| Heat, from wood chips | 0.05% | 0.05% | 12% | 6.5% | 0.2% | 2.5% | 2.1% | 0.5% |
| Heat, using heat pump | 0.7% | 1.8% | 2.1% | 0.4% | 5.5% | 3.0% | 1.5% | 1.5% |
| Water use | 1.4% | 2.4% | 6.0% | 1.0% | 5.6% | 5.6% | 21% | 4.0% |
| Total | 62% | 61% | 42% | 10% | 31% | 33% | 44% | 49% |
| Product EoL | ||||||||
| Wastewater treatment | 1.8% | 1.5% | 5.0% | 0.8% | 6.3% | 4.4% | 5.2% | 6.4% |
| Total | 1.8% | 1.5% | 5.0% | 0.8% | 6.3% | 4.4% | 5.3% | 6.4% |
| scale: | 2.5–10% | 10–20% | 20–30% | >30% |
Publisher’s Note: MDPI stays neutral with regard to jurisdictional claims in published maps and institutional affiliations. |
© 2021 by the authors. Licensee MDPI, Basel, Switzerland. This article is an open access article distributed under the terms and conditions of the Creative Commons Attribution (CC BY) license (https://creativecommons.org/licenses/by/4.0/).
Share and Cite
Kröhnert, H.; Stucki, M. Life Cycle Assessment of a Plant-Based, Regionally Marketed Shampoo and Analysis of Refill Options. Sustainability 2021, 13, 8478. https://doi.org/10.3390/su13158478
Kröhnert H, Stucki M. Life Cycle Assessment of a Plant-Based, Regionally Marketed Shampoo and Analysis of Refill Options. Sustainability. 2021; 13(15):8478. https://doi.org/10.3390/su13158478
Chicago/Turabian StyleKröhnert, Hanna, and Matthias Stucki. 2021. "Life Cycle Assessment of a Plant-Based, Regionally Marketed Shampoo and Analysis of Refill Options" Sustainability 13, no. 15: 8478. https://doi.org/10.3390/su13158478
APA StyleKröhnert, H., & Stucki, M. (2021). Life Cycle Assessment of a Plant-Based, Regionally Marketed Shampoo and Analysis of Refill Options. Sustainability, 13(15), 8478. https://doi.org/10.3390/su13158478