Article

Changes in Chemical Properties of Banana Pseudostem, Mushroom Media Waste, and Chicken Manure through the Co-Composting Process

by
Mahammad Shariful Islam
1,2,
Susilawati Kasim
1,*,
Khairul Md. Alam
2,3,4,
Adibah Mohd Amin
1,
Tan Geok Hun
5 and
Mohammad Amdadul Haque
2,6
1
Department of Land Management, Faculty of Agriculture, Universiti Putra Malaysia, Serdang 43400, Malaysia
2
Bangladesh Agricultural Research Institute, Gazipur 1701, Bangladesh
3
Centre for Sustainable Farming Systems, Future Food Institute, Murdoch University, Perth, WA 6150, Australia
4
Bangladesh Agricultural Research Council, Dhaka 1215, Bangladesh
5
Department of Agriculture Technology, Faculty of Agriculture, Universiti Putra Malaysia, Serdang 43400, Malaysia
6
Department of Crop Science, Faculty of Agriculture, Universiti Putra Malaysia, Serdang 43400, Malaysia
*
Author to whom correspondence should be addressed.
Sustainability 2021, 13(15), 8458; https://doi.org/10.3390/su13158458
Submission received: 5 May 2021 / Revised: 16 June 2021 / Accepted: 7 July 2021 / Published: 28 July 2021
(This article belongs to the Section Sustainable Agriculture)

Abstract

:
Co-composting is an effective approach to biowaste management. The co-composting potential of banana pseudostem (BPS) and mushroom media waste (MMW) with chicken manure (CM) has not been explored, let alone their suitable ratios of co-composting being determined. Meanwhile, the imbalance ratios of the feedstocks used in the process severely restrict the physicochemical properties and quality of the finished product. For this reason, six different ratios of BPS, MMW, and CM, viz. 1:1:1, 1:2:1, 1:3:1, 2:1:1, 2:2:1, and 2:3:1, respectively (T1–T6), were composted together in aerobic conditions to identify the suitable ratio by evaluating the changes in the physicochemical properties in the composting process. According to the ratio of treatments, the feedstocks were mixed on fresh weight basis. The turning process of co-composting piles was repeated at seven-day intervals to maintain the uniform aeration throughout the composting period. The piles having BPS, MMW, and CM at ratios of 1:2:1, 1:3:1, and 2:3:1, respectively, demonstrated a longer thermophilic phase, indicating more complete decomposition and earlier maturity compared to piles with higher amount of BPS. Of the ratios, BPS:MMW:CM at 1:2:1 ratio (T2) resulted in the highest total nitrogen (1.53%), lowest C:N ratio (12.4), organic matter loss (54.5%), and increased CEC (41.3 cmol/kg). The highest germination index (129%) was also recorded in the T2 compost, indicating that it was toxic-free and safe for seed germination. The nutrient-rich compost with high alkaline pH (≥10) can effectively ameliorate soils of an acidic nature, for example, the acidity of Ultisols and Oxisols.

1. Introduction

Agricultural waste can potentially be recycled through composting processes (composting and co-composting) that convert it into useful resources for plant nutrition and soil health (through adding humus-like materials) [1]. One of the key considerations of composting and co-composting is the sources and types of organic materials used. Mainly, co-composting involves mixing nitrogen-rich organic wastes such as nutshells, sewage sludge, and animal manure with carbon-rich organic wastes (bulking agent) such as saw-dust, crop residue, biochar [2,3], and mushroom spent substrate [4]. On the other hand, banana pseudostem has huge potential as a co-composting material [5]. The global production of pseudostem currently amounts to approximately 336 million tonnes [6] at the rate of 60–70 tonnes ha−1 as post-harvest waste. It mostly remains unused and is simply creating more pollution. Yet, it can be a vital source of nutrients that will regulate and assist plant growth [7]. Similarly, mushroom production has risen worldwide resulting in an estimated 53 million tons of mushroom media waste (MMW) (1 kg mushroom is produced from 5 kg mushroom media substrate). Carbon (C)-rich mushroom media waste has immense promise for composting [8] because of its large surface area and contains carbohydrates, protein, fat, and many kinds of enzymes as well as fungus mycelium and residual nutrients [9,10]. The demand for livestock and the production of poultry has increased significantly with the rising human population, which has resulted in producing large quantities of manure [11,12]. With comparatively high nitrogen (N), co-composting with chicken manure helps turn various organic solid wastes into suitable composts by controlling the activity of microorganisms [11].
Silva and Bras [13] showed that chicken manure is usually rich in N but poor in C, leading to a low C:N ratio, which restricts the composting process. Apart from these, chicken manure enhanced the microbial growth and activity for efficient composting by shortening the composting period [10]. Being rich in C, the addition of mushroom media waste can act as an adsorbent of readily available N and allows the microbial population to multiply and immobilize N present in chicken manure. Conversely, banana pseudostem may help check N loss through the formation of struvite with ammonium-N (NH4+-N). Moreover, 80–90% water by weight [14] may ensure the best possible moisture content in the process. Considering the above individual properties, these materials have the potential to produce quality compost.
Previous research has studied the quality of composts produced by the co-composting method and generally proved that the method of composting, combinations between them, and the ratio at which the co-composting materials are used, determine the quality of the final compost. Accordingly, the rate of degradation and mineralization process was enhanced through the co-composting of banana peels with poultry manure [15]. Soto-Paz et al. [16] evaluated the potential of biowaste and sugarcane filter cake for composting. They recorded that the composting of biowaste and sugarcane filter cake at the 4:1 ratio showed faster maturity and stability of the final compost. Similarly, the composting of poultry manure, cellulosic sludge, and wood chips together showed faster decomposition with the increment of nutrients and organic matter (OM), while also maintaining the C:N ratio below 20 as quality compost [13]. Meunchang et al. [17] observed the rapid loss of OM from the composting of (2:1) sugarcane filter cake with its bagasse. Moreover, the co-composting of 25% wood chips and 25% green waste resulted in a quality compost with optimum pH, electrical conductivity (EC), cation exchange capacity (CEC), and germination index (GI > 80%) value [18]. As the C:N ratio of chicken manure is comparatively low, it tends to emit more ammonia than from other organic sources [19]. To deal with this problem, other materials can be used at different ratios to suppress the emissions by adjusting the material’s C:N ratio. Studying the effects of initial mixtures on the characteristics of organic matter in composts, Francou et al. [20] found little stabilization of organic matter during composting of green wastes with their large lignin content. Chicken manure compost with 42.5% (w/w) bark in the feedstock had the best quality as a soil improver in terms of organic matter content, C:P ratio, C:N ratio, and stability [21].
Likewise, research on the composting of animal manure with bulking materials such as cereal crop residues [22,23], cotton crop waste [24], and wood shavings, leaves, and sawdust [25,26] have been undertaken throughout the world. Several analyses have explored co-composting of chicken manure with farmyard manure, pig manure, animal dung, garden waste, green waste material, sawdust, animal farm litter, and bedding material [27,28,29,30]. Kalemelawa et al. [15] evaluated the aerobic and anaerobic composting of banana peels treated with inoculums. He et al. [29] used pig manure, wheat straw, and rice straw biochar in composting. Kumar et al. [30] executed simultaneous composting of sugarcane waste with mushroom substrate and wheat straw to improve compost quality. Similarly, Czekała et al. [31] also investigated biochar with poultry manure and wheat straw in the aerobic co-composting process in their study.
However, not enough research has been published on co-composting using banana wastes and the subsequent physicochemical changes that occur during composting. Most research has been done in the laboratory, but here, the nutrient parameters are limited. Such studies’ results did not truly reflect the utility of crop demand in agriculture. Banana pseudostem is a highly alkaline organic waste that contains cellulose and lignin with 75–85% moisture [32]. The addition of excessive moisture and inappropriate ratios of a mixture may lead to delaying the process through the poor window, which does not favor microbe and quality compost [33].
The inherent moisture in the banana pseudostem along with a suitable ratio of MMW and frequent turning would create a congenial condition for faster decomposition in the process. Composting of these materials together may alleviate the negative impacts of individual waste on crops and might turn the compost into a balanced organic fertilizer able to synchronize the release of nutrients with the demand of crops in acidic soil. To the best of our knowledge, no research has investigated the decomposition of banana pseudostem and mushroom media waste with chicken manure to utilize them as organic fertilizer through co-composting. Therefore, in order to make effective compost, the ratio of the substrate mixture must first be determined. The objective of the study was to identify the suitable ratio of banana pseudostem to mushroom media waste in co-composting with chicken manure.

2. Materials and Methods

2.1. Materials Collection, Preparation, and Pile Management

The required amounts of semi-humified chicken manure (CM), mushroom media waste (MMW), and banana pseudostem (BPS) samples were collected from QL Ansan Poultry Farm Sdn Bhd, Rawang (3°27′31.97″ N and 101°35′21.23″ E), Nas Agro Farm, Sepang (2°50′52.64″ N and 101°44′38.23″ E), and Banting, (2°48′16.1″ N and 101°30′10.99″ E), Malaysia, respectively. The collected CM and MMW were properly cleaned, sieved, and preserved separately in an open polyshade house at ambient temperature (25 °C to 28 °C). The day before composting, fresh banana pseudostems were chopped down into desirable sizes then crushed with a 14 HP, woodchipper machine (Model: Ohashi-GS122GB, Obashi Ecological technology, Sakimura Chiyoda Kanzaki Saga, Japan). Banana pseudostem sap was collected through the outlet pipe during the crushing of banana pseudostem. The sap was subjected to the addition of an extra 250 g urea and maintained moisture (at 60–70%) in the composting piles. In each pile, the 250 g of urea was evenly sprinkled in each layer of feedstock mixtures with pseudostem sap and water. It was uniformly spattered in different layers in the final mixture during pile preparation to promote decomposition. The piles were protected with a rainproof, non-transparent and thick plastic canvas from any unexpected weather disturbance. Turning and mixing (manually by shovel) were done weekly to allow uniform airflow throughout the composting period. The initial chemical properties of individual materials were measured prior to the co-composting process (Table 1).

2.2. Research Design

The raw materials of BPS, MMW, and CM were mixed manually with six ratios, viz., T1 = 1:1:1, T2 = 1:2:1, T3 = 1:3:1, T4 = 2:1:1, T5 = 2:2:1, and T6 = 2:3:1, respectively, before the compost piles were prepared for each treatment. The compost pile was 2 m length × 1.2 m width × 1.0 m height in size volume. According to the treatment ratio, each compost pile received in total 500 kg of three feed stocks as fresh weight basis where the initial moistures of CM, MMW, and BPS were 14.5%, 8.5%, and 59.2%, respectively. Each pile had two replications and samples were replicated three times following Randomized Complete Block design.

2.3. Collection and Preparation of Compost Samples for Physicochemical Analysis

A 300 g of bulk sample was randomly collected from different places (6) of two compost pile in each round of turning and mixture and divided into two parts. The first part of these samples was air-dried and passed through the 0.25- and 0.1-mm sieves and sample repeated three times for physicochemical analysis. Each sub-sample was considered as replication. The second part of the compost samples was immediately preserved in a refrigerator at 4–5 °C for seed germination test.

2.4. Monitoring of Temperature Profile (°C) and Moisture in the Composting Process

The temperature was recorded daily in the morning (before 8 am) and evening (after 5 pm) from the three places of the piles (central, mid-peripheral, and lower-peripheral positions) by portable Mercury thermometer (Alchl Thrmter, Labworld, India). In that case, half portion of the thermometer was dipped into the pile from the top centre while the whole portion was dipped from the mid and lower-peripheral position to get the actual average temperature [16]. The ambient temperature was also recorded by the same thermometer at the same times. The daily six readings per compost pile recorded in the morning (3) and evening (3) were averaged.The compost moisture was measured by the gravimetric method where sample was dried at 105 °C until reaching the constant weight [34]. The moisture (%) was calculated following the equation: moisture   ( % ) = ( W 1 W 2 ) W 1 ×   100 , where weight of compost before oven drying (W1) and weight of compost after oven drying (W2).

2.5. Chemical Analysis of the Compost Samples

The pH was measured from the compost samples by a digital pH meter (HI 2211 pH meter, Hanna instrument, Woonsocket, RI, USA) at the ratio of 1:10 (w/v) water-soluble extract, whereas 1:20 (w/v) ratio of the sample with water was used to determine EC by digital EC meter (Hanna 2300) as described by Gaind [35]. The total C, N, and sulfur (S) were determined by Leco TruMac CNS analyzer. The C:N ratio was calculated from the total C and total N values. The TOC and OM contents of compost samples were estimated by loss on ignition method [36]). The CEC was determined by the ammonium acetate (pH 7.0) leaching method [37]. Inorganic N was determined using the method of Keeney and Nelson [38]. The total contents of K, Ca, Mg, Na, Mn, Cu, and Zn were determined by atomic absorption spectrophotometer (A Analyst 800, PerkinElmer Corporation, Norwalk, CT, USA) followed by dry ashing method, based on Cottenie [37], and the amount of P was determined by auto-analyzer (Yellow method) from the same sample.

2.6. Compost Toxicity Test

The germination index of radish seeds was tested via the water extraction procedure as suggested by Guo et al. [39]. Briefly, the compost samples and deionized water at the ratio of 1:10 (w/v) was centrifuged for 15 min at 4000 rpm and filtered through 0.45 µm filter paper. A 5 mL of filtrate was pipetted in to 20 mm × 100 mm triplicate sterilizer Petri dish after placing double filter papers on it. Thirty randomly selected radish seeds were placed evenly on filter paper, sealed, and kept on the Petri dish in a dark place for 72 h at room temperature. The total number of germinated seeds were counted in the Petri dish and recorded as a percentage. Root length of the germinated seeds was measured by image J. software [40]. The germination index (GI) was calculated by the following equation:
GI   ( % ) = [ SG   ( % )   of   treatment × RL ] / [ SG   of   control   ( % ) ×   RL   of   control ] ×   100 ,
where SG = seed germination of treatments, RL = root length of the treatments (cm).

2.7. Statistical Analysis

Data were subjected to analysis by PROC ANOVA in the RCBD design (SAS, 9.4). The treatment means were compared by protected Least Significant Difference Test (LSD) at the 5% probability level [41].

3. Results

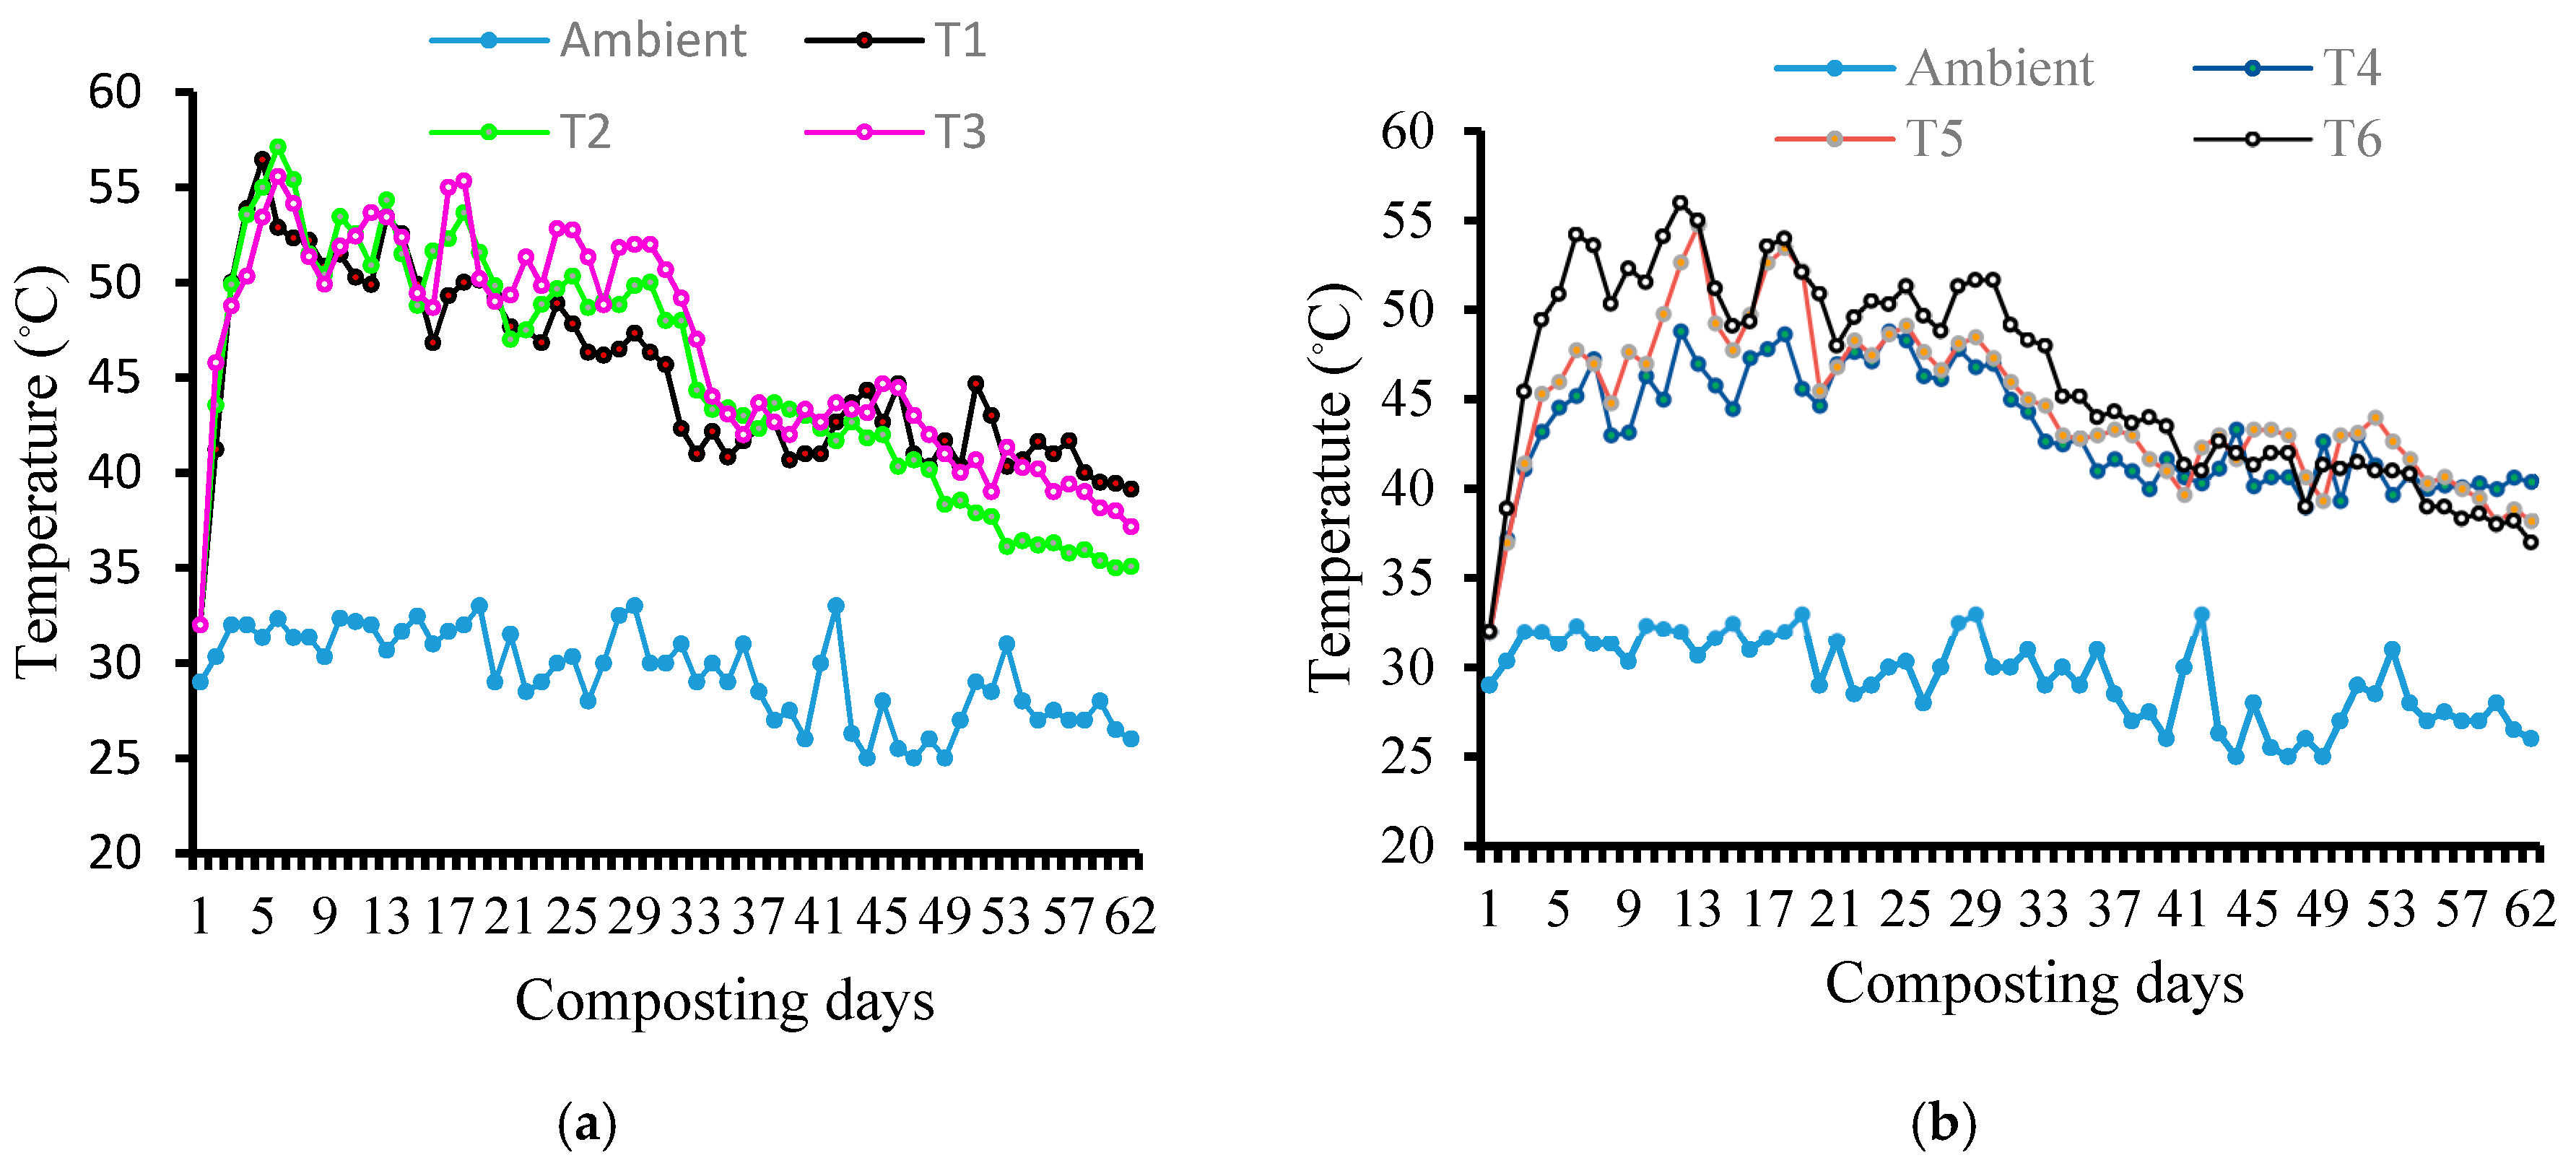
3.1. Monitoring Temperature Profile during the Composting Period

Irrespective of treatments, the temperature rise from the first day and reached the peak at 4–5 days. The use of BPS, MMW, and CM at different ratios had varied temperatures over the co-composting period (Figure 1a,b). The temperature reaching the thermophilic phase for piles T2 (1:2:1 BPS:MMW:CM), T3 (1:3:1 BPS:MMW:CM), and T6 (2:3:1 BPS:MMW:CM) lasted up to 29 days, while for T1 pile (1:1:1 BPS:MMW:CM), the phase lasted for 4–19 days (Figure 1a,b). However, T5 pile (2:2:1 BPS:MMW:CM) took 13–19 days to reach the same phase (52.7 °C to 55.0 °C). Elsewhere, the temperature ranged from 45.4 °C to 48.8 °C in T4 pile (2:1:1 BPS:MMW:CM) and it consistently remained below the thermophilic stage (<50 °C) throughout the composting period. After a longer mesophilic phase (40–50 °C), the temperature in all the piles (except T4 pile) started falling and reached cooling stage (<40 °C) after 58, 49, 52, 58, and 55 days, respectively.

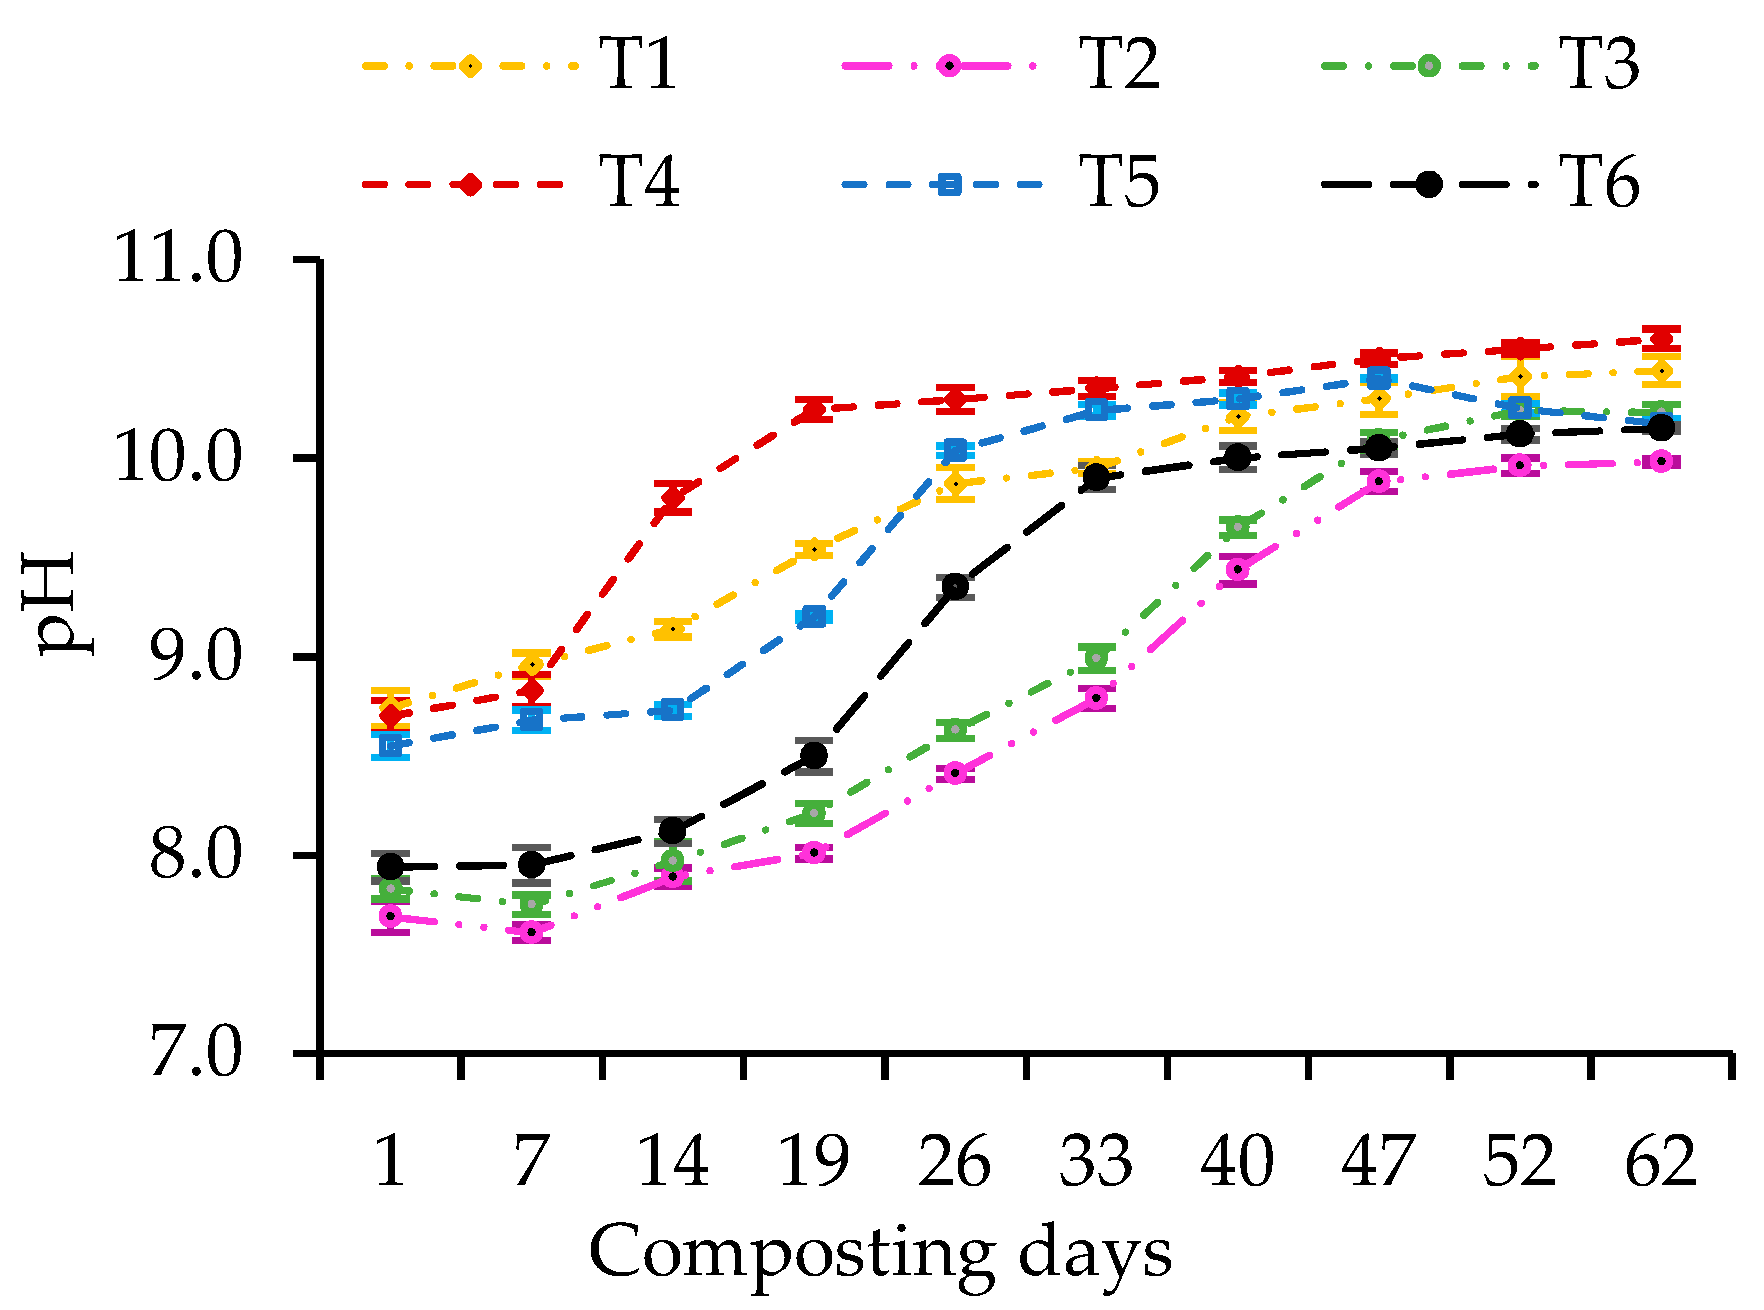
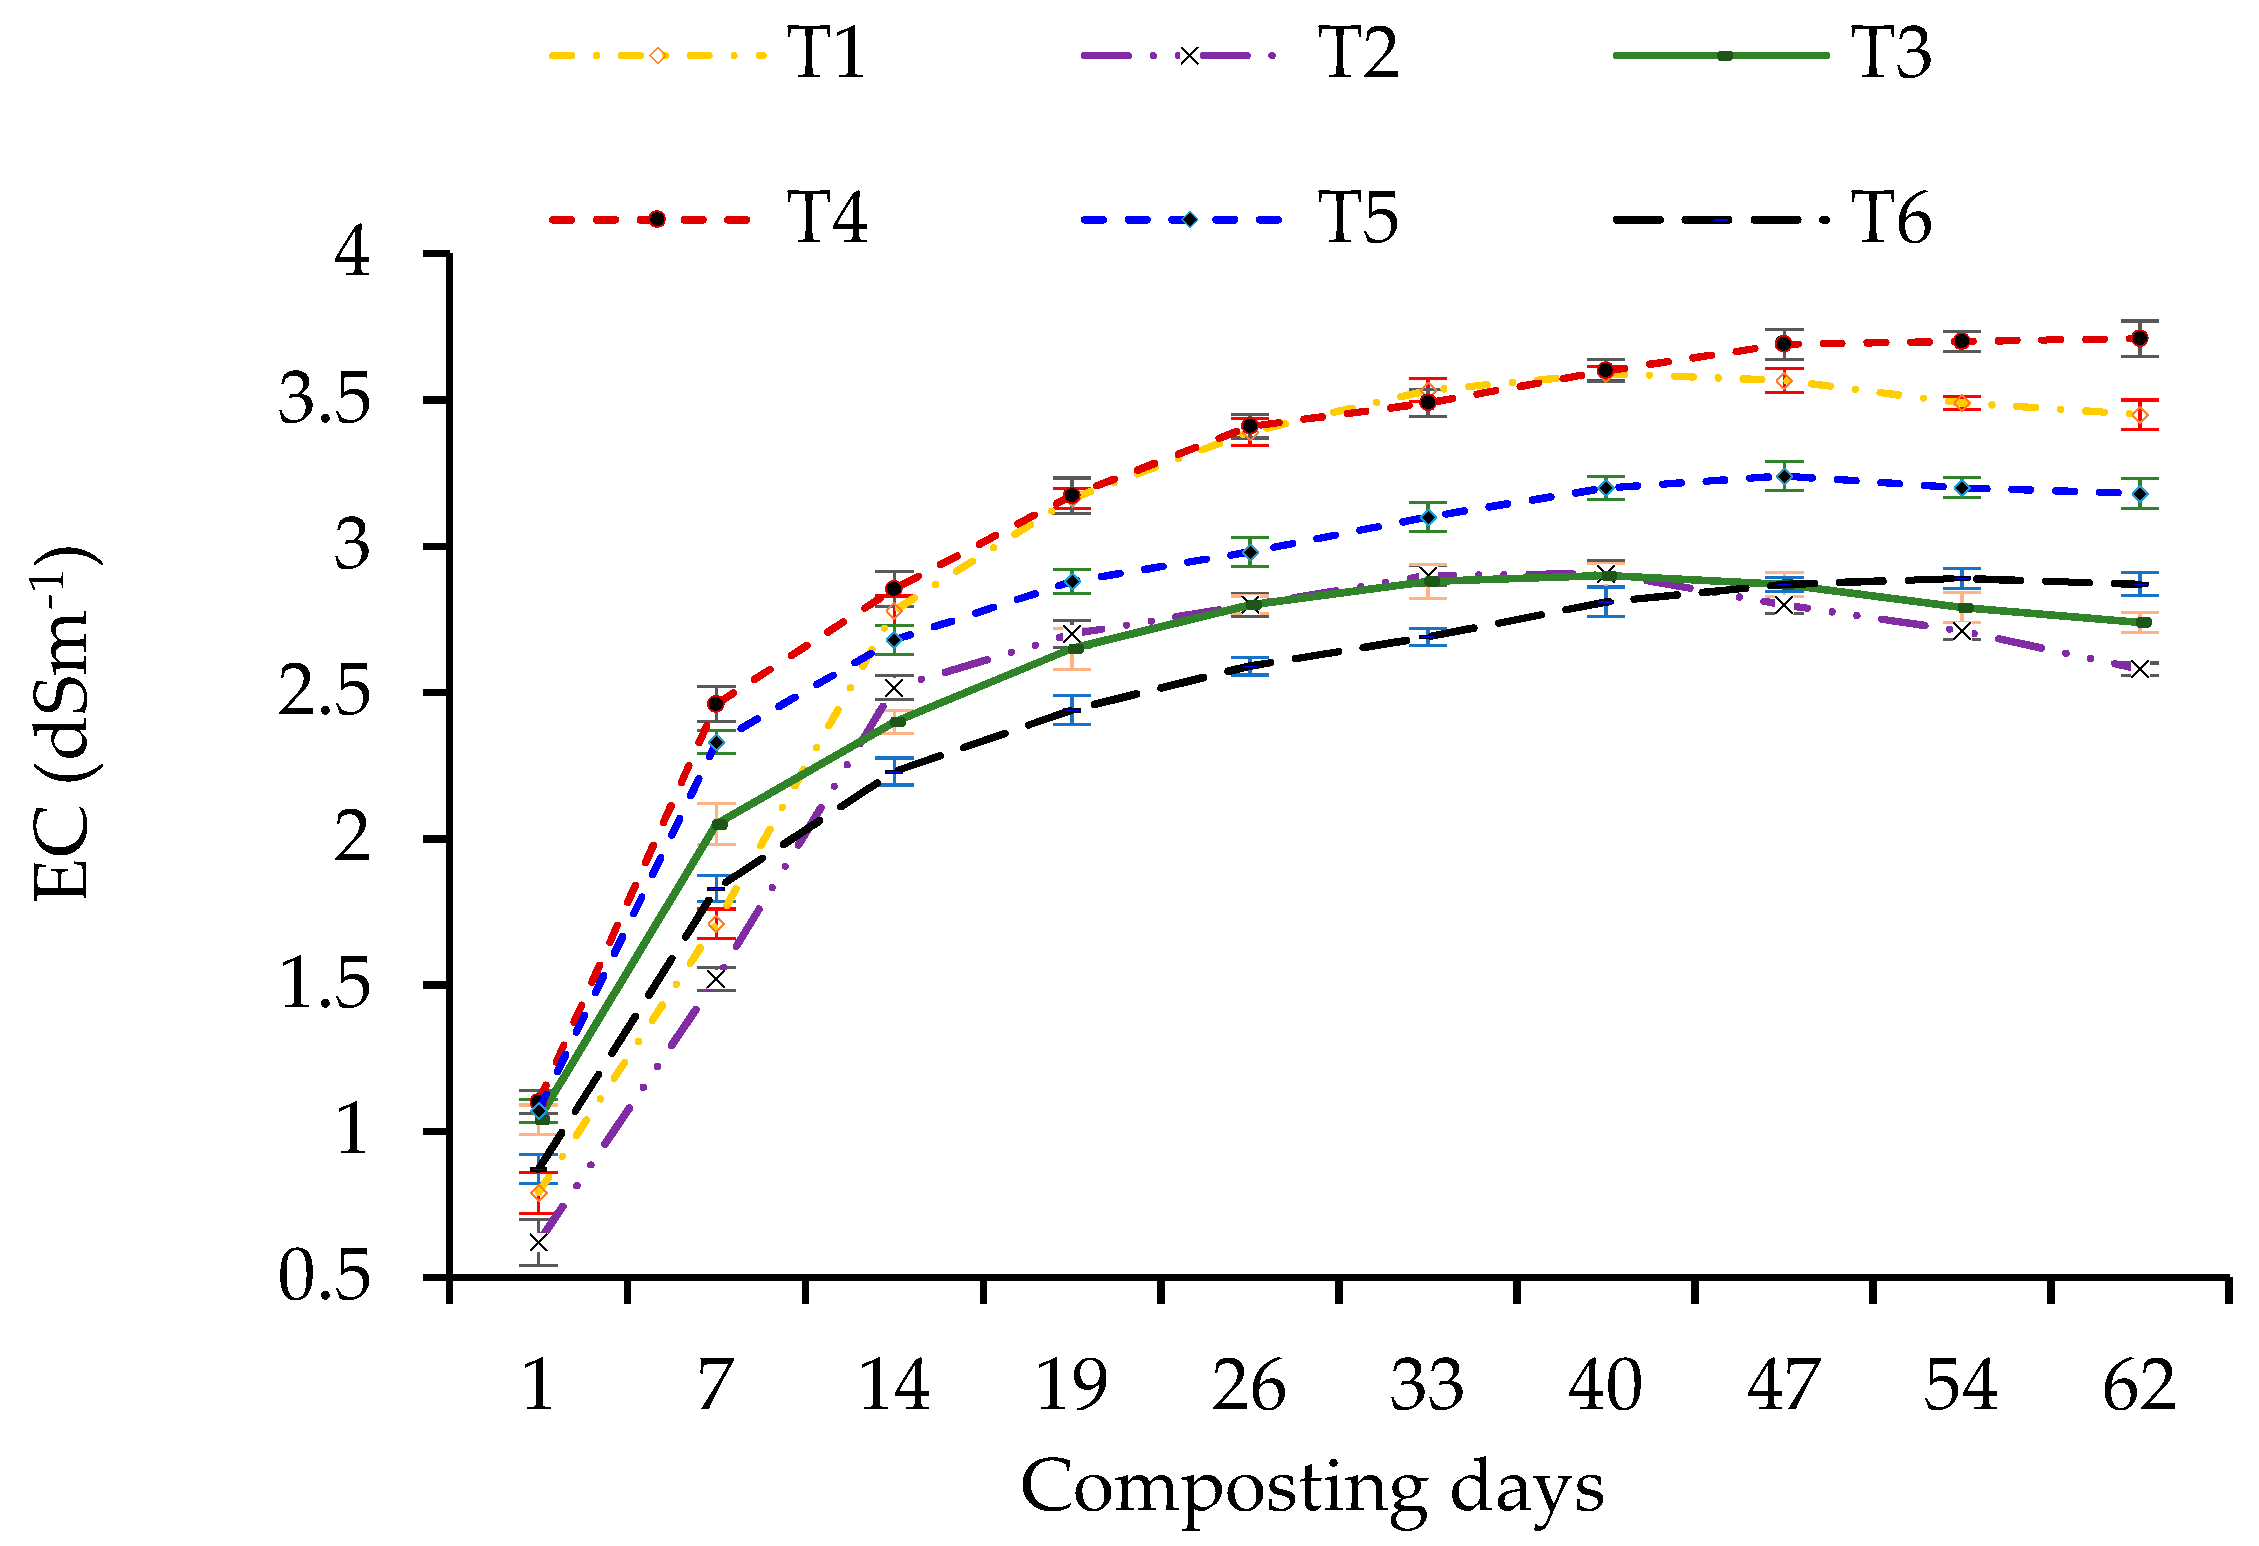
3.2. Changes in pH and EC during the Co-Composting

During the composting period, the pH levels in the piles were consistently varied. An increase in the pH and EC levels was observed in each co-compost pile (treatment) (Figure 2 and Figure 3). In the primary stage of composting, pH values revealed a slight decline or remained unchanged up to 7 days in the T2 pile having increased the amount of MMW followed by the T3 pile, where the T4 pile, with a larger amount of BPS, showed a sharp increase in pH value. In the secondary stage, the pH increased gradually up to the final compost. Generally, pH varied from 7.69–8.74 in the initial stage and from 10.0–10.6 in the final stage. However, in the final compost, the lowest pH level (10.0) was recorded in the T2 pile having an increased amount of MMW (1:2:1 of banana pseudostem, mushroom media waste, and chicken manure) followed by the T3 (1:3:1 BPS:MMW:CM) pile, while the highest pH (10.6) was recorded in the T4 (2:1:1) pile where BPS was used in an increased ratio. The EC increase was accompanied by the rising temperature in the co-compost under process (Figure 1a,b). In the final compost, EC ranged from 2.38 to 3.71 dS m−1 in the compost piles, while the T2 pile mixed with the increased amount of MMW displayed the lowest EC value (2.38 dS m−1), followed by T3 (2.68 dS m−1) treatment. In the last stage of the co-composting process, the highest EC (3.71 dS m−1) was recorded in the T4 pile, which was mixed with increased BPS substrate.

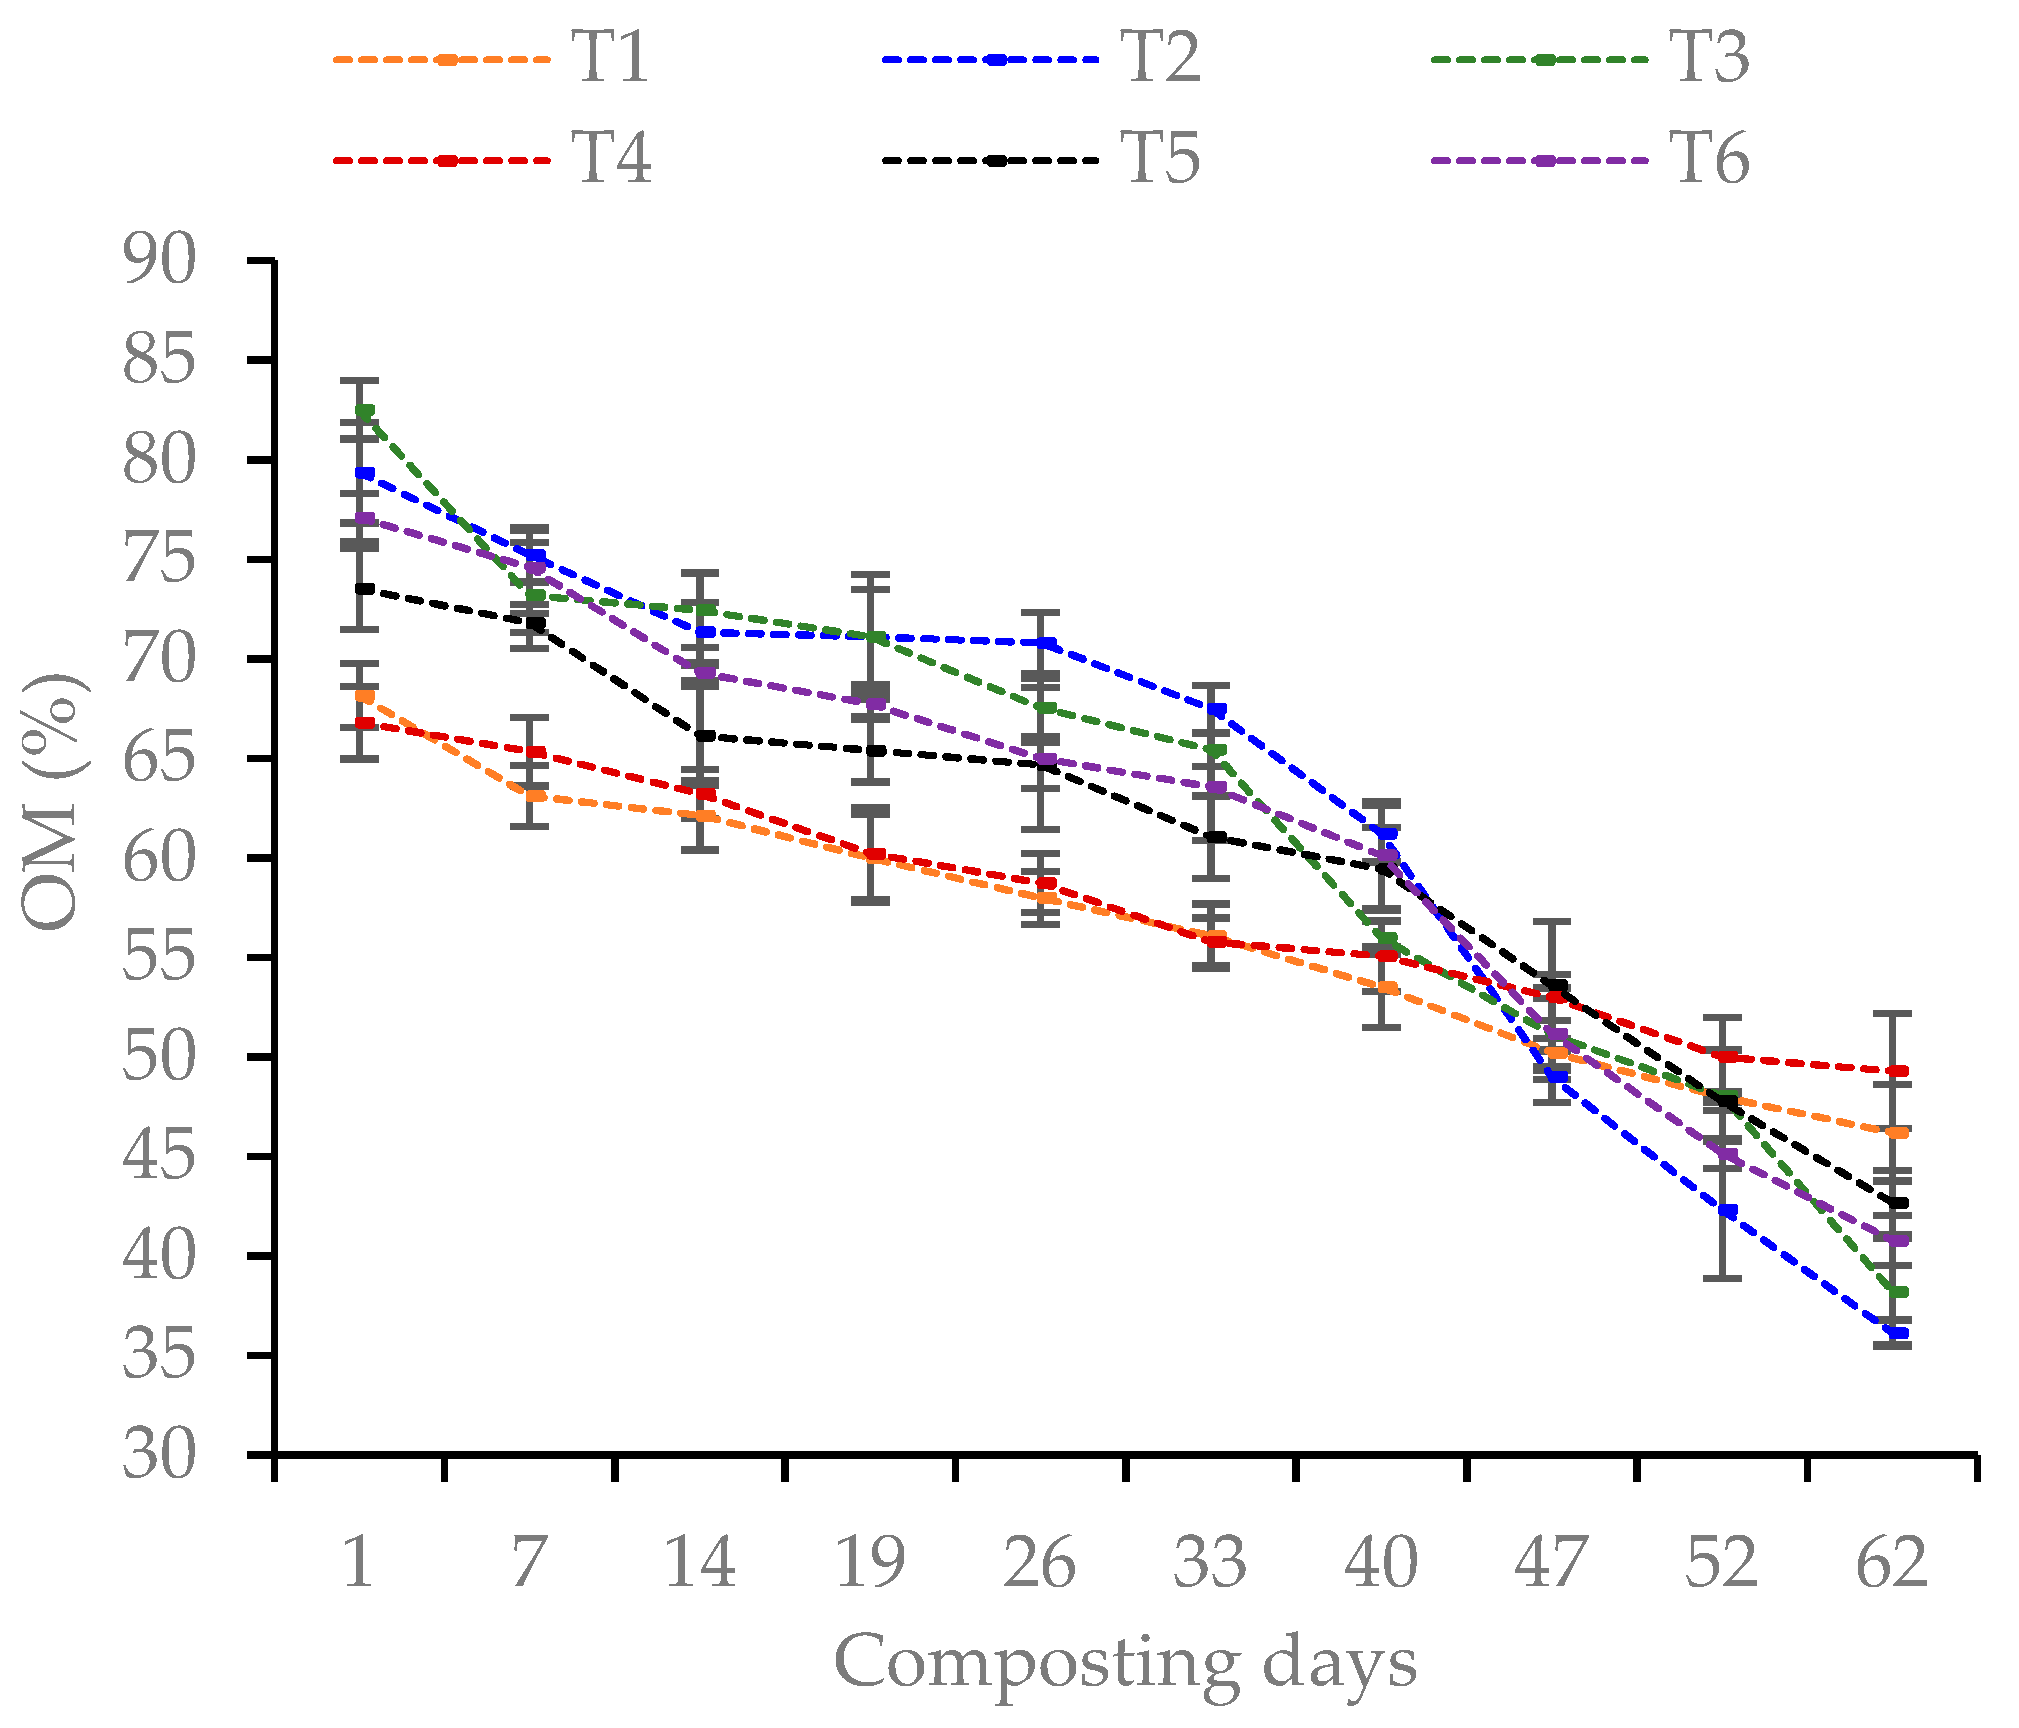
3.3. Organic Matter Degradation

The mixing of BPS, MMW, and CM in different ratios significantly influenced the OM degradation in the process (Figure 4). Throughout the composting period, the rapid reduction of OM was recorded in the T2 pile with 1:2:1 BPS:MMW:CM (79.4% to 36.13%), which was followed by the T3 pile, while the slowest decomposition was recorded in the T4 pile having a larger amount of BPS used (2:1:1 BPS:MMW:CM). The decomposition of the initial substrate biomass fell from 66.8% to 49.29% in the T4 pile. However, the highest (54.5%) relative loss of OM was calculated from the initial to the final stage of the T2 pile of co-compost with double the MMW used compared to the T4 pile.

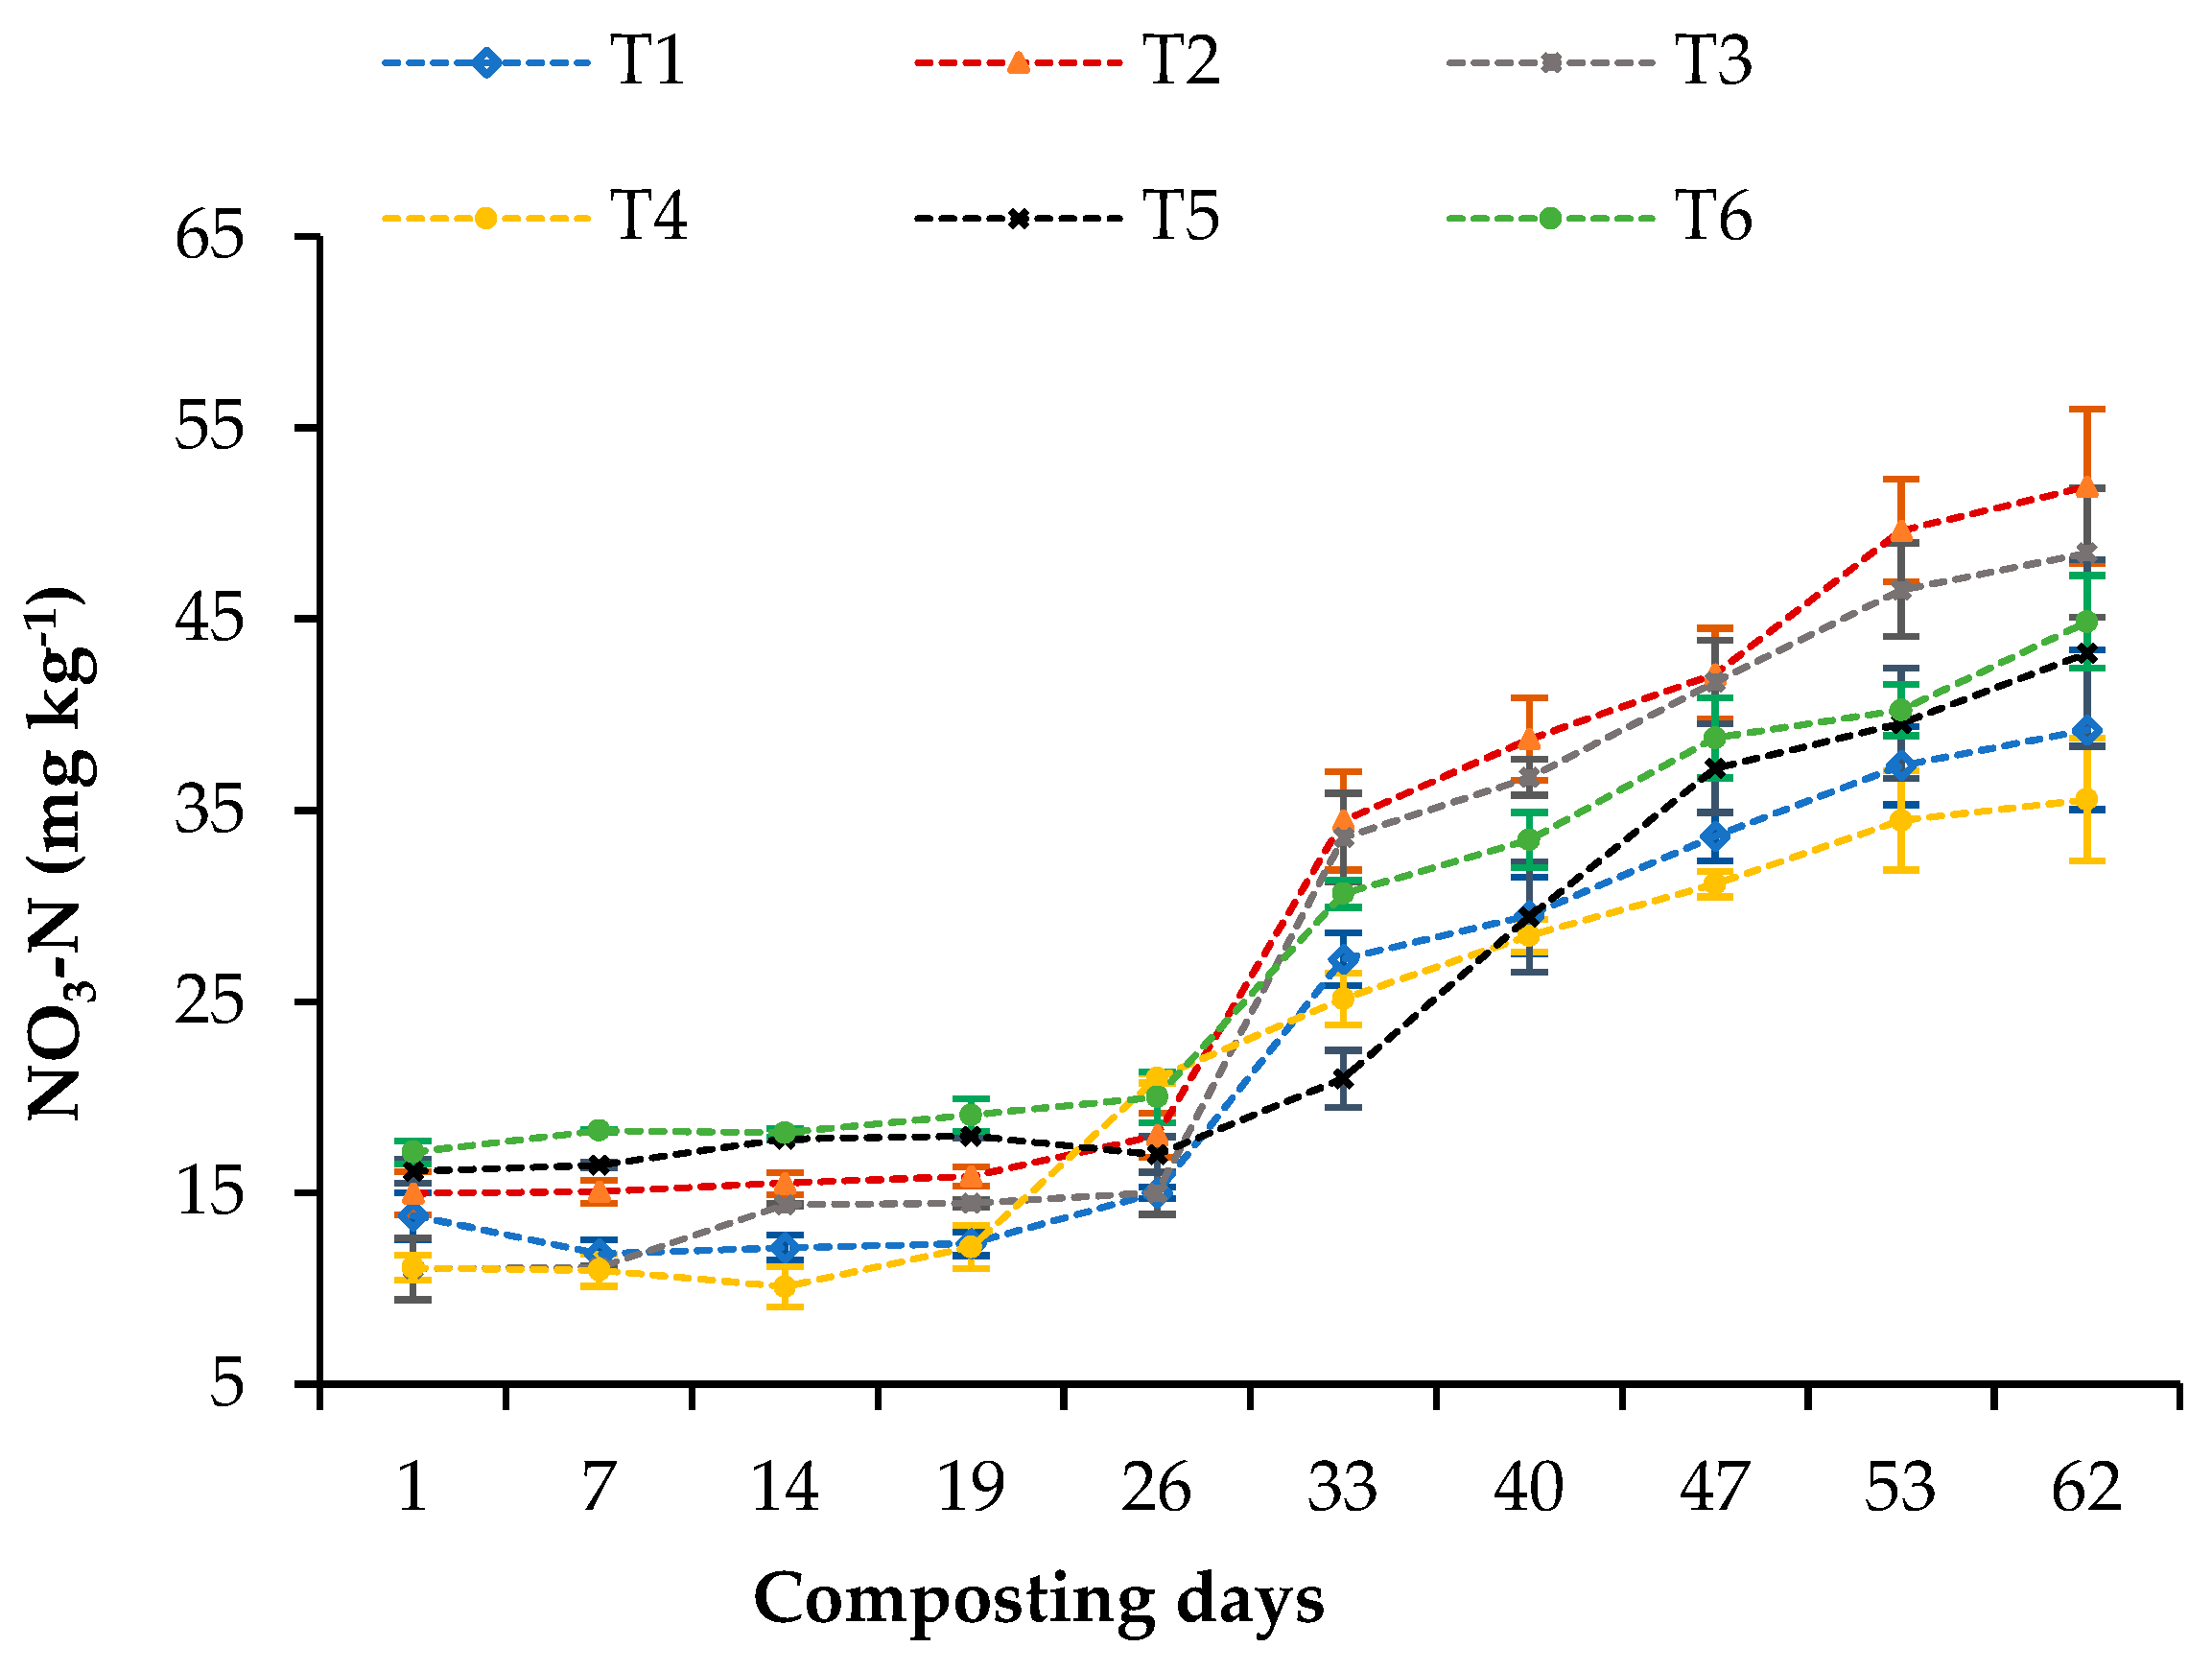
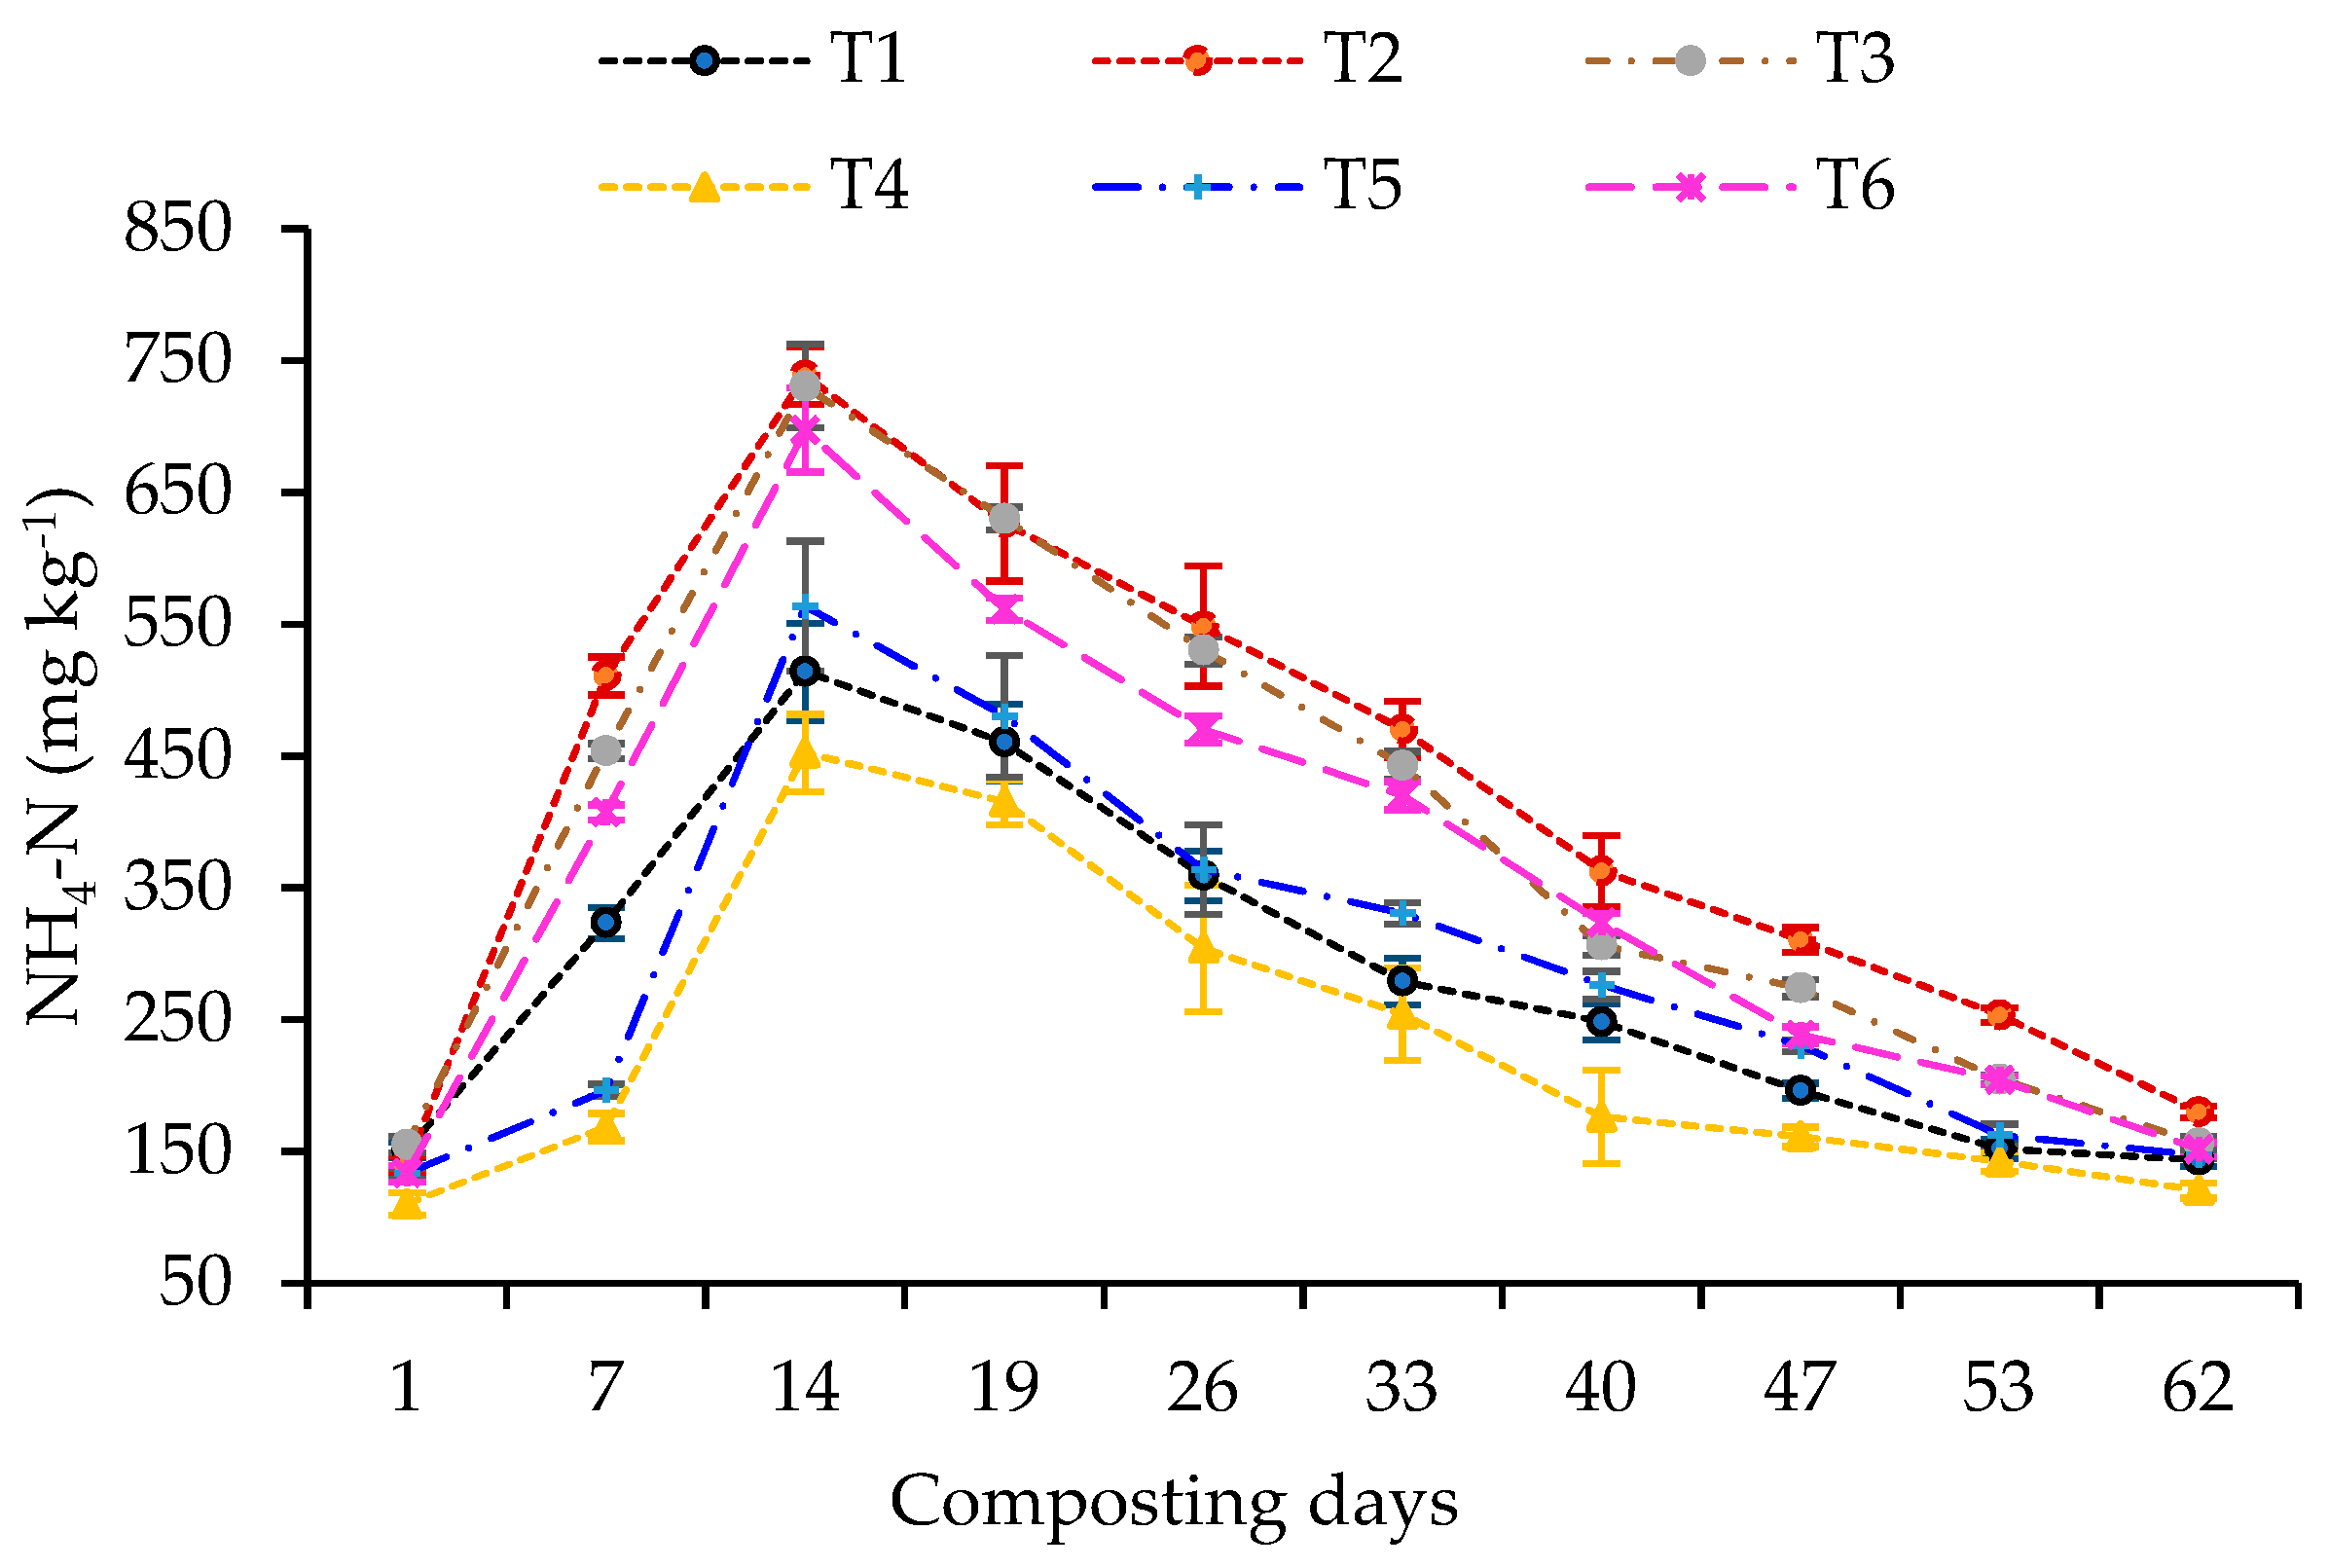
3.4. Changes of Total N, NH4-N, and NO3-N

Changes of N were influenced by different ratios of feedstocks used in co-composting. The highest total N was recorded in T2 having 1:2:1 of BPS, MMW, and CM (1.53%) along with T5 having 2:2:1 of BPS, MMW, and CM (1.48%) piles, while the lowest N (1.10%) was recorded in the T4 pile (2:2:1 BPS:MMW:CM) (Table 2). In all piles, the total N loss varied from 11.1% to 23.6% from the initial to the end of the composting, which was recorded in the T2 and T1 piles with an equal amount of feedstocks, respectively. NH4-N ranged from 452–738 mg kg−1 in the first two weeks and decreased gradually to 120–179 mg kg−1 at the end of composting (Figure 5). However, T2, having a higher amount of MMW, had the largest amount of NH4-N (179 mg kg−1) while the pile having higher BPS (T4 pile) had the lowest (120 mg kg−1) at the final stage (Figure 5). The trend of NO3-N increased with the decline of NH4-N in all compost piles, and finally, significantly higher values of NO3-N were recorded in the T2 (51.9 mg kg−1) pile, followed by the T3 pile (48.5 mg kg−1), and the lowest (35.55 mg kg−1) in the T4 pile (Figure 6).

3.5. Changes in Moisture

Among the treatments, the moisture content, total C, total N, and the C:N ratio fell from the initial to final stage whereas the CEC was increased significantly (p ≤ 0.05) (Table 2). The moisture content varied from 68.5% to 79.3% in the initial stage and 36.3% to 50.1% in the final stage. The minimum moisture (36.3%) was observed in the final compost at T3 pile, which was statistically similar to the T2 (38.6%) pile, while the maximum moisture of 50.1% was recorded from T4 compost (50% banana pseudostem, 25% mushroom media waste, and 25% chicken manure).

3.6. Changes in Total C

A remarkable decrease in TOC was found from the beginning to the final compost and it ranged from 25.9–53.9% in the piles where 31.7%, 53.9%, 52.8%, 25.9%, 41.4%, and 46.5% were recorded in the T1, T2, T3, T4, T5, and T6 piles, respectively. The highest reduction of 53.9% appeared in the T2 (1:2:1 ratio) pile and 25.9% in the T4 (2:1:1 ratio) pile. Of the six compost mixtures, however, the lowest content (18.9%) of organic C was recorded in T2, and the highest was 25.6% in T4, followed by the T1 (24.1%) co-compost pile.

3.7. Changes in C:N Ratio

All the compost samples had a C:N ratio below 20 except for T4 (23.3), while the lowest C:N ratio (12.4) in T2 was statistically identical to (1:3:1) the T3 (13.8) pile at the end of composting (Table 2). Moreover, the C:N ratio of the compost significantly decreased by 10.6%, 48.7%, 45.7%, 4.31%, 30.3%, and 35.3% in the T1–T6 treatments, respectively. Among the treatments, the highest C:N ratio decreased (48.7%) in T2 and the lowest (4.31%) was in T4 from initial to final compost.

3.8. Changes in CEC

The CEC for all treatments has shown a significant increase in the final compost (Table 2). The piles T2 (1:2:1 BPS:MMW:CM), T3 (1:3:1 BPS:MMW:CM), and T5 (2:2:1 BPS:MMW:CM) showed statistically identical results of CEC where the numerically higher value was obtained from T2 treatment (41.3 cmol kg−1) and a lower value was found in the T4 treatment (32.1 cmol kg−1). In the final compost, CEC was higher by 45% than that of the initial condition.

3.9. Changes in Macro- and Micro-Nutrients

Co-composting of BPS, MMW, and CM in different ratios had varied nutrient concentrations in the final compost (Table 3). In the final compost, the highest values of P (9.84 g kg−1), Ca (14.8 g kg−1), Zn (456 mg kg−1), Cu (60.7 mg kg−1), and Mn (784 mg kg−1) were recorded from the T2 pile having BPS, MMW, and CM at a 1:2:1 ratio but the highest values of K (12.1 g kg−1), Mg (5.94 g kg−1), Na (2.70 g kg−1), and S (300 g kg−1) were recorded in the T1 pile. This was comparable to the lowest value of all nutrients observed in the T4 compost, having a higher amount of BPS added (50%). However, the concentrations of P, K, Ca, Na, and Zn were increased by 79.2%, 73.3%, 44.7%, 41.2%, and 86.1%, respectively, in the T2 pile. In contrast, the amounts of K, Mg, and Na in the T4 pile, having more BPS (50%), fell by 7.08%, 8.56%, and 1.87%, respectively, compared to their corresponding initial value.

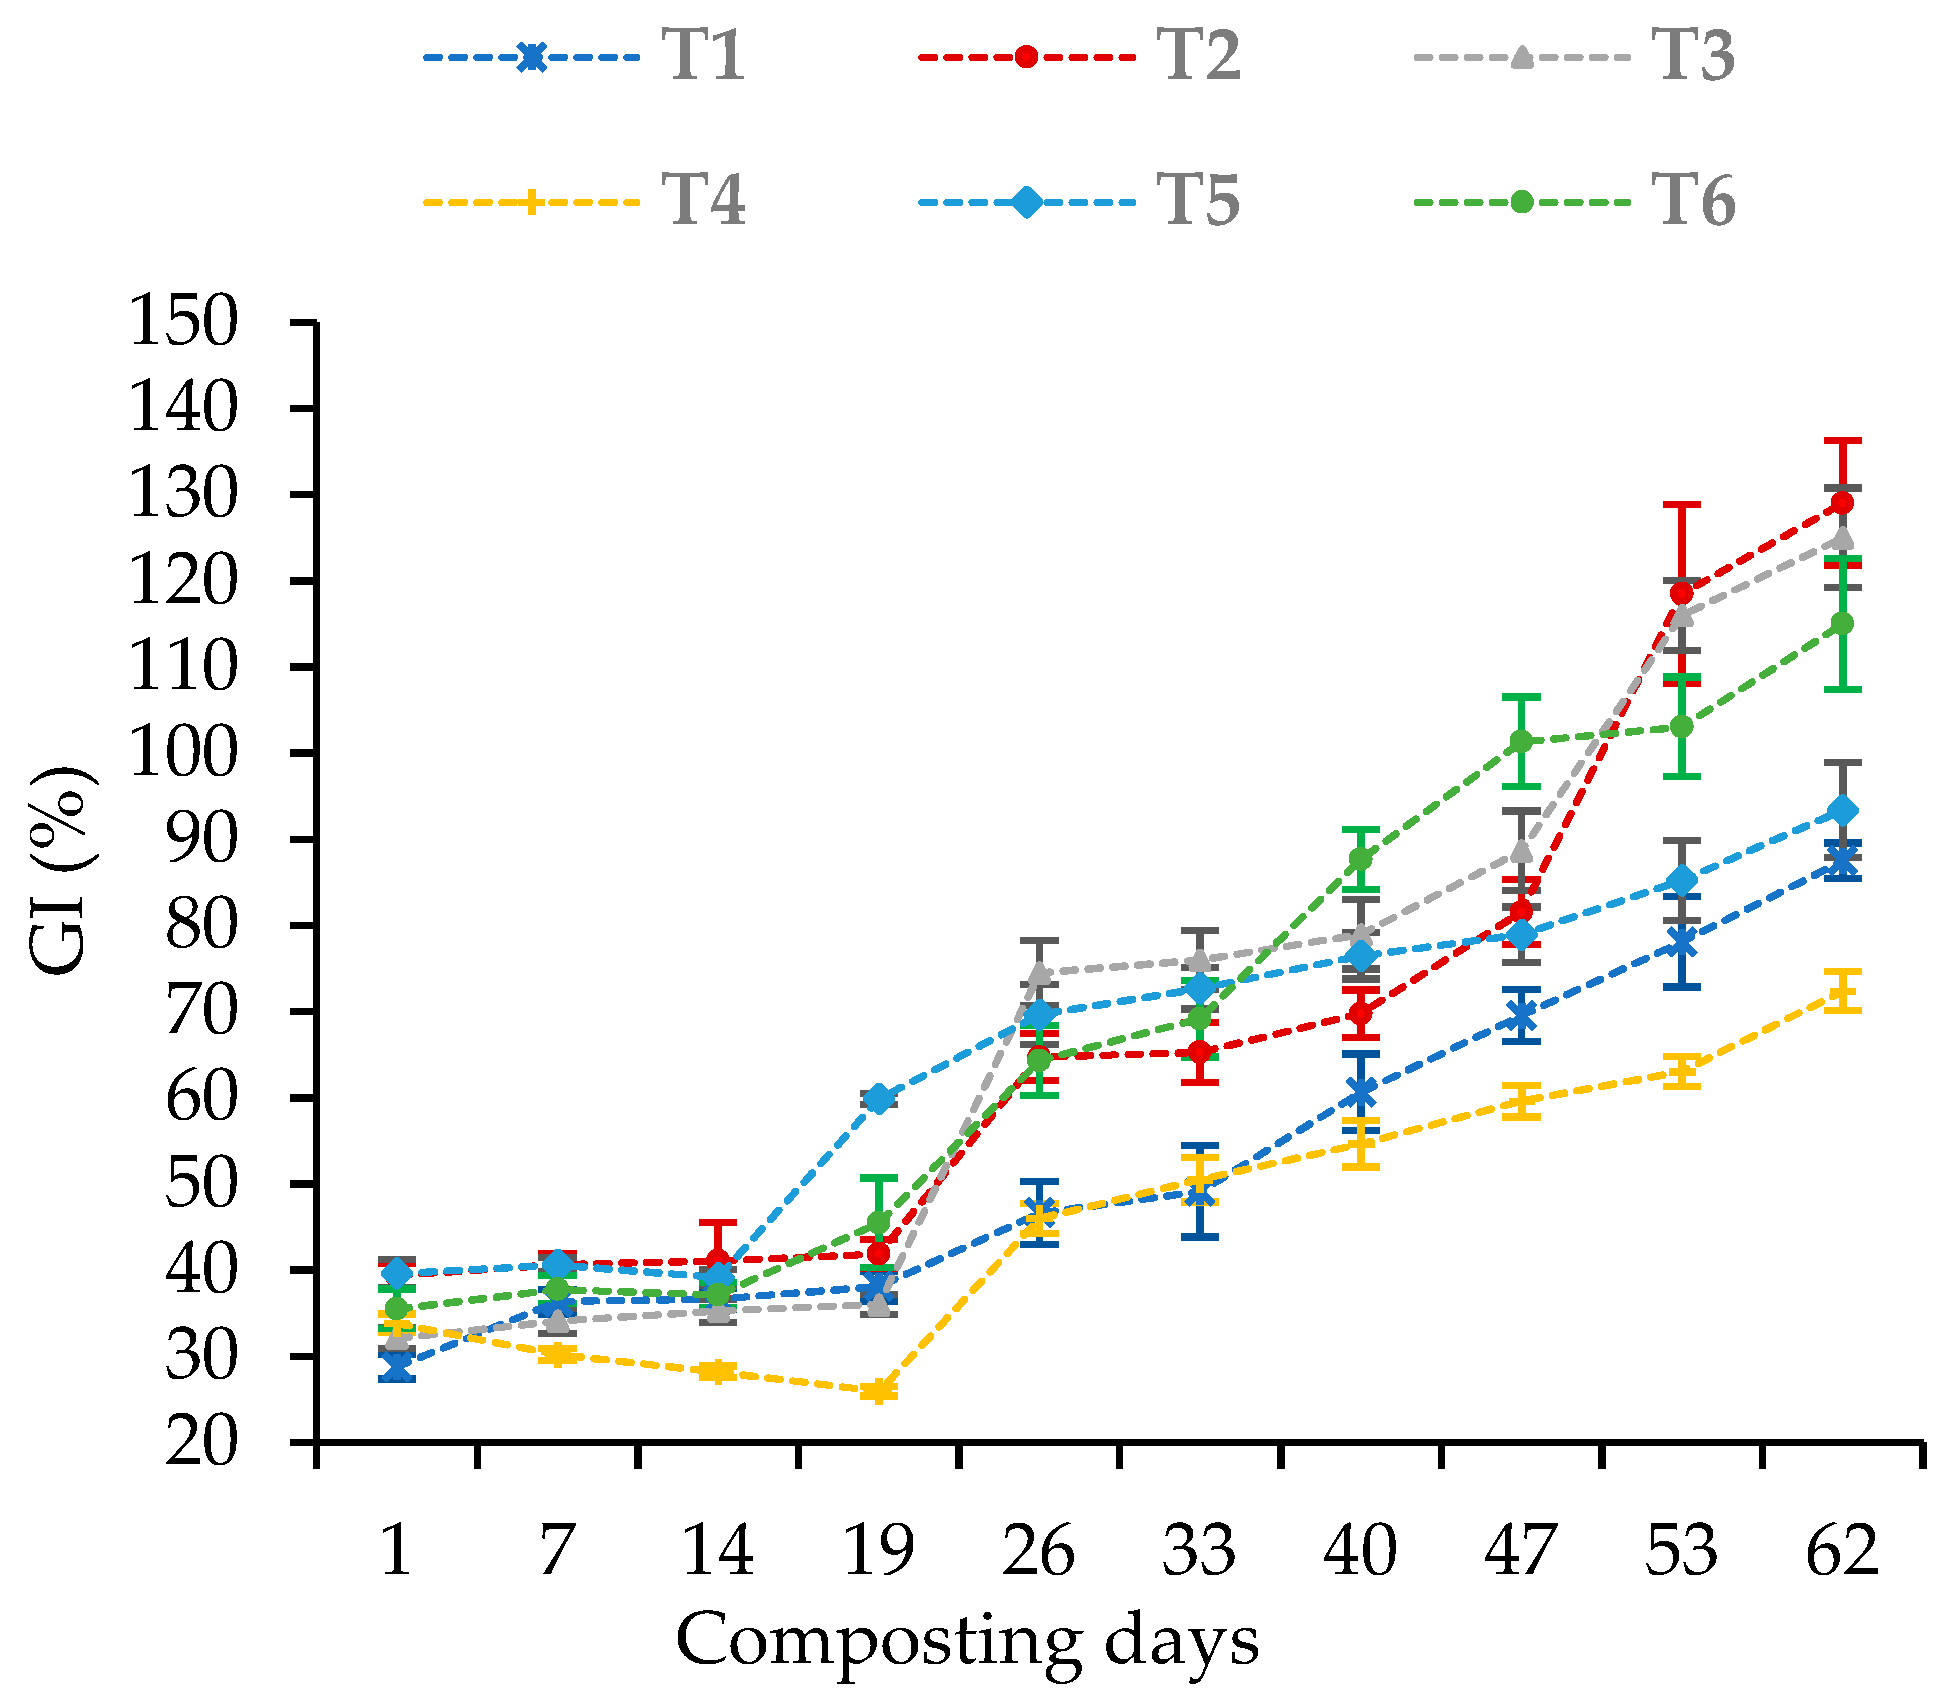
3.10. Germination Index (%) under the Compost

The germination index showed a parallel or straight trend up to the 14th day in all piles except the T4 pile (with a higher amount of BPS), which experienced a slight decline up to the 19th day. In the study, the GI (%) started to increase from 14–19 days in all piles (T1–T6) towards the end of composting (Figure 7). The order of the GI values was 129, 125, 115, 93.4, 87.5, and 72.4% in T2, T3, T6, T5, T1, and T4 piles, respectively. The maximum germination index (129%) was recorded in T2 pile having a higher amount of MMW used, which was statistically similar to T3 (125%), while the T4 pile showed the lowest 72.4% from the final compost.

4. Discussion

The final composts, which had banana pseudostem (BPS), mushroom media waste (MMW), and chicken manure (CM) at the ratios of 1:2:1 and 1:3:1, did better in compost production and germination of sweet corn seeds. Based on the physical and chemical changes recorded during the co-composting, it emerged that the compost piles having more MMW was transformed into a compost of good quality. These composts showed better maturity and stability based on the temperature, C:N ratio, CEC, weight loss (CO2 evolution), nutrient concentration, and seed germination. These features are discussed in more detail below.

4.1. Monitoring Temperature during the Composting

Temperature during composting is an important indicator of its maturity and quality [42]. An ideal composting process consists of three phases of temperature, namely, the thermophilic (>50 °C), mesophilic (40–50 °C), and cooling phases (<40 °C), where the thermophilic stage represents the rapid decomposition of organic matter through microbial activity and the mesophilic and cooling phases may cause increased nitrous oxide emission [43]. The decline of the temperature below 40 °C expressed the maturity of compost [44]. In our study, the T2 pile showed a faster rise in temperature and longer thermophilic phase lasting up to 30 days followed by T3 due to the incorporation of 50% mushroom media waste (MMW) as a C source. The microbial degradation of added OM materials that released CO2 led to an increase in the compost temperature [45]. Some researchers even showed that two stage co-composting has double thermophilic stages indicating even faster decomposition and maturity of compost [44]. Throughout the whole process, T4 treatment did not reach the thermophilic stage due to the addition of a higher amount (50%) of BPS while excess moisture was evident in BPS. However, the early drop in temperature by the 49th day to cooling phase (<40 °C) indicated 13 days earlier maturity of the T2 compost compared to T4. The declining temperature also meant that the small portion of the easily degradable composting materials remained in the cooling phase [46].

4.2. Changes in pH and EC during the Co-Composting

The pH and EC are important parameters in composting, and they indicate the rate of decomposition of compost as well as the suitability of its application in soil. Overall, the compost piles resulted in an alkaline pH (≥10) and a higher EC value from 2.38–3.71 dS m−1 due to the use of alkaline materials rich in K and Ca (Table 1, Figure 3). During the initial stage (1–21 days), the pH showed an unchanged or slightly increasing trend. After 21 days of co-composting, the pH significantly increased with the decrease in the temperature, the mineralization of organic N, and the release of NH4 ions. A similar trend was detected by Jolanun and Towprayoon [47]. In the present study, T2 (1:2:1) had the lowest value of pH (10.0) followed by the T3 (1:3:1) pile, which received 25% BPS, 50% MMW, and 25% CM in the process (Figure 2). This outcome was consistent with the pH (9.3–9.7) of banana peel compost as studied by Kalemelawa et al. [15], who reported that high K concentrations in banana waste forms a strong base (KOH) that increases the pH value. However, the T2 compost with moderately alkaline pH could be effective in diminishing the acidity of acidic soil. In addition, T1 (33.33% BPS) and T4 (50% BPS) piles were BPS-dominated composts which recorded higher EC values. The added BPS and/or CM contained a higher amount of K and Ca salts (Table 1), which increased the EC of the composts. The release of mineral salts due to volume loss via decomposition, increased the EC values studied by Silva and Brás [13]. Considering the individual EC of the piles, T2 resulted in the most suitable value of 2.38 dS m−1, followed by the acceptable limit of EC < 3 dS m−1 [48]. Thus, the T2 compost having 25% BPS, 50% MMW, and 25% CM is suitable as an organic fertilizer.

4.3. Changes in OM, TOC, C:N, and CEC during the Co-Composting

Due to the long-term persistence of thermophilic temperatures, more organic matter is lost in the T2 pile (1:2:1 BPS:MMW:CM), resulting in a lower OM (36.1%) content in the final compost (Figure 4). In this study, the T2 pile having a higher proportion (50%) of MMW contained the various type of enzymes (results are included in another manuscript under review), and fungus mycelium [9], thereby resulting in 54.5% of OM loss. This amount of reduction in OM in the present study is consistent with the reduction of OM (47–52%) in the study conducted by Kulcu et al. [49]. A more than 42% reduction in OM was considered able to stabilize the process [16]. Fang et al. [9] also recorded the reduction of OM in the mushroom substrate composting material. Moreover, the addition of a higher proportion of MMW with lower BPS may create a favorable microbial environment through better aeration in the composting and facilitate the faster degradation of OM [42]. On the other hand, the T1 (33.3% BPS, 33.3% MMW, and 33.3% CM) and T4 (50% BPS, 25% MMW, and 25% CM) piles were recorded with the higher OM content in the final compost than the T2 pile. It strongly suggests that those piles were partially decomposed due to a limitation in microbial activity or higher moisture content (72 to 79%). In addition, the existing lignin and cellulose in banana pseudostem [32] were slowly degraded and persisted for a longer period of time, thus confirming higher OM contents in the T1 and T4 piles.
In the composting process, the C content promotes the degradation of OM. A low C concentration can restrict biomass formation and compromise degradation [16]. The greater reduction of total organic carbon (TOC) content in T2 (53.8%) and T3 (52.8%) piles (Table 2) indicated the higher bio-oxidation of OM maintained by the thermophilic temperature (Figure 1a). In this study, the reduction of the C:N ratio is mainly due to the decomposition of organic matter (loss of C as CO2 via transformation). In the course of decomposition during composting, the increase of the total N% was associated with the volume reduction. The increase in inorganic N in the T2 co-compost pile (having higher MMW) may contribute to the total N increase as well as the low C:N ratio. The strong sorption capacity of the added MMW bulk material may also help adsorb N on its large surface area. The highest reduction of C (53.8%) through OM decomposition was also associated with the low C:N ratio (12.4) (Table 2). These outcomes reflect the result of composting of wood chips with green waste as documented elsewhere [18]. The compost with a < 20 C:N ratio is more acceptable as noted by Gaind [35].
On the other hand, as the BPS had lower C content, even under high moisture (79.3%) content in it, the OM decomposition and loss of C did slow down (Figure 4 and Table 2). The higher C:N ratio (23.3) in the T4 compost (2:1:1 BPS:MMW:CM) is associated with these. The N loss through volatilization might also affect the low C:N ratio obtained in the final compost. The results are consistent with Mohee et al. [48] who discovered that microbial consumption of C decreased the C:N ratio of the compost. In the present study, the CEC was increased in all treatments from the initial to final compost (Table 2), and it varied from treatment to treatment and with the amount of added banana pseudostem and mushroom media waste. The CEC was greater of those treatments due to higher decomposition of added banana pseudostem and mushroom media waste, particularly in the T2 compost. This may explain the high content of exchangeable cations in BPS and MMW (Table 1).
Zhang and Sun [18] obtained a 45% increase in CEC from the co-composting of wood chips and green waste compared to green waste that was similar to the T2 compost. Bahtiar et al. [7] studied banana waste as a vital source of Na, K, Ca, and Mg as possibly increasing the CEC in compost. Moreover, the carboxyl and phenolic functional groups may emerge from the humification of organic materials which can increase the CEC in T2 compost. This finding appeared to agree with what Steiner et al. [50] found. The greater CEC value also represents the higher decomposition rate and nutrient retention capacity of compost [50]. Although the T4 (2:1:1 of BPS, MMW, and CM) compost contained BPS in greater amounts, the CEC was comparatively lower than that of T1 (1:1:1) and T2 (1:2:1) compost. However, at the initial stage, the addition of 50% BPS in the T4 treatment may lead to having excess moisture that ultimately leached down some cations and lowered the CEC value (Table 3).

4.4. Changes in TN and Inorganic N during the Co-Composting

The stimulated microbial activity under high temperature and alkaline pH degrades the organic compounds and might induce ammonia volatilization and reduced TN in the pile having an increased amount of MMW (T2 pile). The loss of TN 11.1% was much lower than that of TN loss 21–40% from the co-composting of biowaste and sugarcane filter cake [16]. Composts with 1–2% N have minimal effect on N fertilizer requirements for crop production [51]. However, TN in T2 (1.53%) compost remained within this range for agricultural use. In addition, the T2 pile receiving a higher proportion of MMW, which could assimilate NH3 on its large surface and in turn contribute NO3-N [18] as well as TN. A similar finding was noted by Guo et al. [39]. Most of the inorganic N remained in the form of NH4-N and low levels of NO3-N were detected in the compost.
During the composting, a reverse trend of NH4-N and NO3-N production was evident in all the piles followed by a typical composting process [52]. A similar trend was observed by Kalemelawa et al. [15] from banana peel compost. In the final stage, T2 showed a significantly (p < 0.05) higher value (179 mg kg−1) of NH4-N over the other piles, which increased NH4-N by 28.5% from the initial value (140 mg kg−1) due to the decomposition of organic compounds (Figure 5). This increase in NH4-N was due to the degradation of protein and amino acid by NH4+ ions [53]. After 14 days, NH4-N decreased with the volatilization of NH3 due to high temperature (>40 °C) and high alkaline pH (10) as mentioned by Meng et al. [46]. Furthermore, the fall in temperature may have activated the nitrifying bacteria for nitrification [54], which might be attributed to the highest NO3-N (51.9 mg kg−1) in the T2 compost at the final stage. On the other hand, excess moisture from BPS may inactivate nitrifying bacteria that can affect the NO3-N production in the T4 pile where increasing use of BPS was evident.

4.5. Changes in Nutrients Density during the Co-Composting

The content of macronutrients is a very important variable of compost [51]. Macro and micronutrients in the final compost were significantly (p < 0.05) influenced by the amount of BPS and MMW in the composting process (Table 3). Results indicated that the T2 (25% BPS with 50% MMW) compost increased the highest percentages of nutrient concentrations (P 79.23%, K 73.30%, Ca 44.67%, Na 41.18%, and Zn 86.10%) followed by T3 from the initial to final compost (Table 3) compared to other piles. It was due to the complete decomposition of OM through a longer thermophilic phase [55] (Figure 1a,b). These results agreed with the findings of Kalemelawa et al. [15], who observed the increase in P (86%) and K (34%) in banana peel with cow dung compost. Ultra et al. [56] detected extremely large amounts of K, Ca Mg, and Na in banana waste compost. Moreover, the T2 and T3 composts resulted in extremely large amounts of Zn, Cu, and Mn through the humification of the added BPS and MMW. These outcomes were similar to Chimuka and Manungufala [57], who suggested that Cu and Zn have a strong affinity to adsorb with organic and carbonate fractions in compost. In another study, Hsu and Lo [58] indicated that decomposition of OM increased the amount of Cu, Mn, Zn in compost by almost two- to threefold, which resulted in a greatly improved compost product. On the other hand, the T4 pile, which received 50% BPS, showed the incomplete decomposition of OM due to the limitation of C (34.55%) and excess moisture (Table 2). The excess moisture (79%) from BPS created a poor window system and microbial inactivity for OM degradation [39]. Moreover, excess moisture in T4 (50% BPS) compost influenced leaching loss of K (7.08%), Ca (14.90%), Mg (8.56%), and Na (1.87%), so the value of the final content was lower than that of the initial one. This is despite the banana pseudostem being rich in cations [59]. Thus, the T1 and T5 piles showed a higher increment of K, Mg, and Na in the final product. However, all the nutrients in the T2 compost (1:2:1 i.e., 25% BPS, 50% MMW, and 25% CM) can be potential sources of organic fertilizer for crop production and especially for low pH soil.

4.6. Changes in Germination Index during the Co-Composting

The seed germination test is the most sensitive indicator for evaluating the phytotoxicity and maturity of compost [60]. This study showed that the GI declined or remained unchanged in the initial stage, and it may have been due to the formation of organic acids or salts at a high temperature, prevailing up to 19 days in the compost pile. This result is consistent with the findings of Guo et al. [39]. After 19 days, GI started to increase in all piles mainly due to the degradation of toxic substances [61] throughout the study period. In the final stage of composting, all the compost piles with varied feedstock ratios (T1–T3) and (T5–T6) showed a GI value above 80%, except T4, which documented higher BPS. T2 and T3 resulted in higher GI values of 129% and 125%, respectively, with the addition of 20–25% of BPS in the composting. The higher GI might be attributed to their maturity and being free of toxic substances or less toxic to germination of seedlings, as found by Zorpas and Loizidou [62]. The GI value showed <80% in the T4 pile, which means that the BPS might not have been decomposed properly, excessive salts were present in it, and/or toxic substances were added from the higher amount of BPS (2:1:1 of BPS:MMW:CM) to the process. In short, 20–25% of BPS with 50–60% MMW had higher seed germination that can be safe for application in agricultural soil.

5. Conclusions

The present study examined the optimal ratio of banana pseudostem, mushroom media waste, and chicken manure for the composting process, which was monitored in connections with temperature, pH, EC, OM, TOC, C:N ratio, CEC, TN, and other nutrients as a function of time. Around half the proportion of BPS to MMW enhanced composting process by extending the duration of thermophilic phase; improved the pH, EC, CEC values; and increased the macro- and micronutrient concentrations. Of the six combinations of feedstocks, the addition of BPS, MMW, and CM at a 1:2:1 ratio (25% BPS, 50% MMW, 25% CM) decomposed earlier and performed better in terms of acceptable pH value (10), suitable C:N ratio (<15), nutrients content and showed no toxicity to crops. That is why the optimal seed germination was associated with the improved compost properties. The highly alkaline pH of the compost samples suggests that it could be employed for the upgradation of acidic soils. However, the effectiveness of these alkaline composts has yet not been tested in the field level. Thus, the next research would be forwarded to using this compost in a soil–plant system in acidic soil, especially Ultisols and Oxisols.

Author Contributions

Conceptualization, M.S.I. and S.K.; methodology, M.S.I. and M.A.H.; formal analysis, M.S.I., S.K., and M.A.H.; investigation, M.S.I. and S.K.; resources, M.S.I.; data curation, M.S.I., A.M.A., T.G.H., and K.M.A.; writing—original draft preparation, M.S.I.; writing—review and editing, S.K., T.G.H., and K.M.A.; visualization, M.S.I.; supervision, S.K. and K.M.A. All authors have read and agreed to the published version of the manuscript.

Funding

This research was funded by National Agricultural Technology Program—Phase 2 project (NATP-2), Bangladesh Agricultural Research Council (BARC), Farmgate, Dhaka-1215, Bangladesh.

Institutional Review Board Statement

Ethical review and approval were waived for this study, due to no obligatory rules existed for having Institutional Review Board Statement.

Informed Consent Statement

Not applicable.

Data Availability Statement

Data is not publicly available, though the data may be made available on request from the corresponding author.

Acknowledgments

The authors would like to express his gratitude to the authority of the National Agricultural Technology Programme, the Bangladesh Agricultural Research Council, and the Bangladesh Agricultural Research Institute for providing fellowship to perform research at the Faculty of Agriculture, Universiti Putra Malaysia. All faculty members and staff of the Department of Land Management are highly acknowledged because of their continuous technical support and cooperation in order to complete the research.

Conflicts of Interest

The authors declare no conflict of interest.

References

  1. Bonoli, A.; Zanni, S.; Awere, E. Organic waste composting and sustainability in low-income communities in Palestine: Lessons from a pilot project in the village of Al Jalameh, Jenin. Int. J. Recycl. Org. Waste Agric. 2019, 8, 253–262. [Google Scholar] [CrossRef] [Green Version]
  2. Wang, X.; Chen, L.; Xia, S.; Zhao, J. Changes of Cu, Zn, and Ni chemical speciation in sewage sludge co-composted with sodium sulfide and lime. J. Environ. Sci. 2008, 20, 156–160. [Google Scholar] [CrossRef]
  3. Petric, I.; Helić, A.; Avdić, E.A. Evolution of process parameters and determination of kinetics for co-composting of organic fraction of municipal solid waste with poultry manure. Bioresour. Technol. 2012, 117, 107–116. [Google Scholar] [CrossRef]
  4. Yu, H.; Xie, B.; Khan, R.; Shen, G. The changes in carbon, nitrogen components and humic substances during organic-inorganic aerobic co-composting. Bioresour. Technol. 2019, 271, 228–235. [Google Scholar] [CrossRef]
  5. Sharma, M.; Patel, S.N.; Sangwan, R.S.; Singh, S.P. Biotransformation of banana pseudostem extract into a functional juice containing value added biomolecules of potential health benefits. Indian J. Exp. Biol. 2017, 55, 453–462. [Google Scholar]
  6. FAO. FAOSTAT [WWW Document]. 2017. Available online: http://www.fao.org/faostat/en/#data/QC (accessed on 31 January 2017).
  7. Bahtiar, S.A.; Muayyad, A.; Ulfaningtias, L.; Anggara, J.; Priscilla, C.; Miswar, M. Compost use banana weevil (Musa Acuminata) to boost growth and content of sugar sweet corn (Zea mays L. Saccharata). J. Agric. Sci. 2017, 14, 18–22. [Google Scholar]
  8. Medina, E.; Paredes, C.; Pérez-Murcia, M.D.; Bustamante, M.A.; Moral, R. Spent mushroom substrates as component of growing media for germination and growth of horticultural plants. Bioresour. Technol. 2009, 100, 4227–4232. [Google Scholar] [CrossRef]
  9. Fang, W.; Zhang, P.; Gou, X.; Zhang, H.; Wu, Y.; Ye, J.; Zeng, G. Volatile fatty acid production from spent mushroom compost: Effect of total solid content. Int. Biodeterior. Biodegrad. 2016, 113, 217–221. [Google Scholar] [CrossRef]
  10. Blazy, V.; De Guardia, A.; Benoist, J.C.; Daumoin, M.; Lemasle, M.; Wolbert, D.; Barrington, S. Odorous gaseous emissions as influence by process condition for the forced aeration composting of pig slaughterhouse sludge. Waste Manag. 2014, 34, 1125–1138. [Google Scholar] [CrossRef]
  11. Preusch, P.L.; Adler, P.R.; Sikora, L.J.; Tworkoski, T.J. Nitrogen and Phosphorus Availability in Composted and Uncomposted Poultry Litter. J. Environ. Qual. 2002, 31, 2051–2057. [Google Scholar] [CrossRef]
  12. Hepperly, P.; Lotter, D.; Ulsh, C.Z.; Seidel, R.; Reider, C. Compost, Manure and Synthetic Fertilizer Influences Crop Yields, Soil Properties, Nitrate Leaching and Crop Nutrient Content Paul. Compost Sci. Util. 2009, 17, 117–126. [Google Scholar] [CrossRef]
  13. Silva, M.E.; Brás, I. Co-Composting of Poultry Manure with Different Organic Amendments. Int. J. Environ. Ecol. Eng. 2016, 10, 848–852. [Google Scholar]
  14. Bilba, K.; Arsene, M.A.; Ouensanga, A. Study of banana and coconut fibers. Botanical composition, thermal degradation and textural observations. Bioresour. Technol. 2007, 98, 58–68. [Google Scholar] [CrossRef] [PubMed]
  15. Kalemelawa, F.; Nishihara, E.; Endo, T.; Ahmad, Z.; Yeasmin, R.; Tenywa, M.M.; Yamamoto, S. An evaluation of aerobic and anaerobic composting of banana peels treated with different inoculums for soil nutrient replenishment. Bioresour. Technol. 2012, 126, 375–382. [Google Scholar] [CrossRef] [PubMed]
  16. Soto-Paz, J.; Oviedo-Ocaña, E.R.; Manyoma, P.C.; Marmolejo-Rebellón, L.F.; Torres-Lozada, P.; Barrena, R.; Sánchez, A.; Komilis, D. Influence of mixing ratio and turning frequency on the co-composting of biowaste with sugarcane filter cake: A mixture experimental design. Waste Biomass Valorization 2020, 11, 2475–2489. [Google Scholar] [CrossRef]
  17. Meunchang, S.; Panichsakpatana, S.; Weaver, R.W. Co-composting of filter cake and bagasse; by-products from a sugar mill. Bioresour. Technol. 2005, 96, 437–442. [Google Scholar] [CrossRef]
  18. Zhang, L.; Sun, X. Influence of bulking agents on physical, chemical, and microbiological properties during the two-stage composting of green waste. Waste Manag. 2016, 48, 115–126. [Google Scholar] [CrossRef]
  19. Nakasaki, K.; Nagasaki, K.; Ariga, O. Degradation of fats during thermophilic composting of organic waste. Waste Manag. Res. 2004, 22, 276–282. [Google Scholar] [CrossRef]
  20. Francou, C.; Linères, M.; Derenne, S.; Le Villio-Poitrenaud, M.; Houot, S. Influence of green waste, biowaste and paper-cardboard initial ratios on organic matter transformations during composting. Bioresour. Technol. 2008, 99, 8926–8934. [Google Scholar] [CrossRef]
  21. Vandecasteele, B.; Reubens, B.; Willekens, K.; De Neve, S. Composting for increasing the fertilizer value of chicken manure: Effects of feedstock on P availability. Waste Biomass Valorization 2014, 5, 491–503. [Google Scholar] [CrossRef]
  22. Petric, I.; Selimbašić, V. Composting of poultry manure and wheat straw in a closed reactor: Optimum mixture ratio and evolution of parameters. Biodegradation 2008, 19, 53–63. [Google Scholar] [CrossRef]
  23. Wang, P.; Changa, C.M.; Watson, M.E.; Dick, W.A.; Chen, Y.; Hoitink, H.A.J. Maturity indices for composted dairy and pig manures. Soil Biol. Biochem. 2004, 36, 767–776. [Google Scholar] [CrossRef]
  24. Paredes, C.; Roig, A.; Bernal, M.P.; Sánchez-Monedero, M.A.; Cegarra, J. Evolution of organic matter and nitrogen during co-composting of olive mill wastewater with solid organic wastes. Biol. Fertil. Soils 2000, 32, 222–227. [Google Scholar] [CrossRef]
  25. Ahn, H.K.; Richard, T.L.; Glanville, T.D. Laboratory determination of compost physical parameters for modeling of airflow characteristics. Waste Manag. 2008, 28, 660–670. [Google Scholar] [CrossRef] [PubMed]
  26. Huang, G.F.; Wong, J.W.C.; Wu, Q.T.; Nagar, B.B. Effect of C/N on composting of pig manure with sawdust. Waste Manag. 2004, 24, 805–813. [Google Scholar] [CrossRef]
  27. Khan, S.; Chao, C.; Waqas, M.; Arp, H.P.H.; Zhu, Y.G. Sewage sludge biochar influence upon rice (Oryza sativa L) yield, metal bioaccumulation and greenhouse gas emissions from acidic paddy soil. Environ. Sci. Technol. 2013, 47, 8624–8632. [Google Scholar] [CrossRef] [PubMed]
  28. Petric, I.; Mustafić, N. Dynamic modeling the composting process of the mixture of poultry manure and wheat straw. J. Environ. Manage. 2015, 161, 392–401. [Google Scholar] [CrossRef]
  29. He, X.; Yin, H.; Han, L.; Cui, R.; Fang, C.; Huang, G. Effects of biochar size and type on gaseous emissions during pig manure/wheat straw aerobic composting: Insights into multivariate-microscale characterization and microbial mechanism. Bioresour. Technol. 2019, 271, 375–382. [Google Scholar] [CrossRef]
  30. Kumar, R.; Verma, D.; Singh, B.L.; Kumar, U.; Shweta. Composting of sugar-cane waste by-products through treatment with microorganisms and subsequent vermicomposting. Bioresour. Technol. 2010, 101, 6707–6711. [Google Scholar] [CrossRef]
  31. Czekała, W.; Malińska, K.; Cáceres, R.; Janczak, D.; Dach, J.; Lewicki, A. Co-composting of poultry manure mixtures amended with biochar—The effect of biochar on temperature and C-CO2 emission. Bioresour. Technol. 2016, 200, 921–927. [Google Scholar] [CrossRef]
  32. Oliveira, L.; Cordeiro, N.; Evtuguin, D.V.; Torres, I.C.; Silvestre, A.J.D. Chemical composition of different morphological parts from “Dwarf Cavendish” banana plant and their potential as a non-wood renewable source of natural products. Ind. Crops Prod. 2007, 26, 163–172. [Google Scholar] [CrossRef]
  33. Onwosi, C.O.; Igbokwe, V.C.; Odimba, J.N.; Eke, I.E.; Nwankwoala, M.O.; Iroh, I.N.; Ezeogu, L.I. Composting technology in waste stabilization: On the methods, challenges and future prospects. J. Environ. Manage. 2017, 190, 140–157. [Google Scholar] [CrossRef]
  34. Krishnan, Y.; Bong, C.P.C.; Azman, N.F.; Zakaria, Z.; Othman, N.; Abdullah, N.; Ho, C.S.; Lee, C.T.; Hansen, S.B.; Hara, H. Co-composting of palm empty fruit bunch and palm oil mill effluent: Microbial diversity and potential mitigation of greenhouse gas emission. J. Clean. Prod. 2017, 146, 94–100. [Google Scholar] [CrossRef]
  35. Gaind, S. Effect of fungal consortium and animal manure amendments on phosphorus fractions of paddy-straw compost. Int. Biodeterior. Biodegrad. 2014, 94, 90–97. [Google Scholar] [CrossRef]
  36. Tiquia, S.M.; Richard, T.L.; Honeyman, M.S. Effect of windrow turning and seasonal temperatures on composting of hog manure from hoop structures. Environ. Technol. 2000, 21, 1037–1046. [Google Scholar] [CrossRef]
  37. Cottenie, A. Soil testing and plant testing as a basis of fertilizer recommendation. FAO Soils Bull. 1980, 38, 70–73. [Google Scholar]
  38. Keeney, D.R.; Nelson, D.W. Nitrogen inorganic forms. In Methods of Soil Analysis Part 2; Page, A.L., Keeney, D.R., Baker, D.E., Miller, R.H., Ellis, R.J., Eds.; Agron. Monogr 9. ASA and SSSA: Madison, WI, USA, 1982; pp. 159–165. [Google Scholar]
  39. Guo, R.; Li, G.; Jiang, T.; Schuchardt, F.; Chen, T.; Zhao, Y.; Shen, Y. Effect of aeration rate, C/N ratio and moisture content on the stability and maturity of compost. Bioresour. Technol. 2012, 112, 171–178. [Google Scholar] [CrossRef] [PubMed]
  40. Mirmostafaee, S.; Azizi, M.; Fujii, Y. Study of allelopathic interaction of essential oils from medicinal and aromatic plants on seed germination and seedling growth of lettuce. Agronomy 2020, 10, 163. [Google Scholar] [CrossRef] [Green Version]
  41. SAS. SAS Statistical Software; Release 9.4; SAS Institute: Cary, NC, USA, 2008. [Google Scholar]
  42. Zhang, L.; Sun, X. Changes in physical, chemical, and microbiological properties during the two-stage co-composting of green waste with spent mushroom compost and biochar. Bioresour. Technol. 2014, 171, 274–284. [Google Scholar] [CrossRef]
  43. Li, R.; Wang, J.J.; Zhang, Z.; Shen, F.; Zhang, G.; Qin, R.; Li, X.; Xiao, R. Nutrient transformations during composting of pig manure with bentonite. Bioresour. Technol. 2012, 121, 362–368. [Google Scholar] [CrossRef]
  44. Awasthi, M.K.; Pandey, A.K.; Bundela, P.S.; Wong, J.W.C.; Li, R.; Zhang, Z. Co-composting of gelatin industry sludge combined with organic fraction of municipal solid waste and poultry waste employing zeolite mixed with enriched nitrifying bacterial consortium. Bioresour. Technol. 2016, 213, 181–189. [Google Scholar] [CrossRef]
  45. Luo, W.H.; Yuan, J.; Luo, Y.M.; Li, G.X.; Nghiem, L.D.; Price, W.E. Effects of mixing and covering with mature compost on gaseous emissions during composting. Chemosphere 2014, 117, 14–19. [Google Scholar] [CrossRef] [Green Version]
  46. Meng, L.; Li, W.; Zhang, S.; Wu, C.; Lv, L. Feasibility of co-composting of sewage sludge, spent mushroom substrate and wheat straw. Bioresour. Technol. 2017, 226, 39–45. [Google Scholar] [CrossRef]
  47. Jolanun, B.; Towprayoon, S. Novel bulking agent from clay residue for food waste composting. Bioresour. Technol. 2010, 101, 4484–4490. [Google Scholar] [CrossRef]
  48. Mohee, R.; Boojhawon, A.; Sewhoo, B.; Rungasamy, S.; Somaroo, G.D.; Mudhoo, A. Assessing the potential of coal ash and bagasse ash as inorganic amendments during composting of municipal solid wastes. J. Environ. Manage. 2015, 159, 209–217. [Google Scholar] [CrossRef]
  49. Kulcu, R.; Sönmez, I.; Yaldiz, O.; Kaplan, M. Composting of spent mushroom compost, carnation wastes, chicken and cattle manures. Bioresour. Technol. 2008, 99, 8259–8264. [Google Scholar] [CrossRef] [PubMed]
  50. Steiner, C.; Das, K.C.; Melear, N.; Lakly, D. Reducing Nitrogen Loss during Poultry Litter Composting Using Biochar. J. Environ. Qual. 2010, 39, 1236–1242. [Google Scholar] [CrossRef] [PubMed] [Green Version]
  51. Sullivan, D.M.; Bary, A.I.; Miller, R.O.; Brewer, L.J. Interpreting Compost Analyses; Oregon State University Extension Service: Corvallis, OR, USA, 2018; pp. 1–10. [Google Scholar]
  52. Tiquia, S.M.; Tam, N.F.Y. Fate of nitrogen during composting of chicken litter. Environ. Pollut. 2000, 110, 535–541. [Google Scholar] [CrossRef]
  53. Hu, W.; Zheng, G.; Fang, D.; Cui, C.; Liang, J.; Zhou, L. Bioleached sludge composting drastically reducing ammonia volatilization as well as decreasing bulking agent dosage and improving compost quality: A case study. Waste Manag. 2015, 44, 55–62. [Google Scholar] [CrossRef] [PubMed]
  54. Tiquia, S.M. Evolution of extracellular enzyme activities during manure composting. J. Appl. Microbiol. 2002, 92, 764–775. [Google Scholar] [CrossRef] [PubMed] [Green Version]
  55. Li, R.; Wang, Q.; Zhang, Z.; Zhang, G.; Li, Z.; Wang, L.; Zheng, J. Nutrient transformation during aerobic composting of pig manure with biochar prepared at different temperatures. Environ. Technol. 2015, 36, 815–826. [Google Scholar] [CrossRef]
  56. Ultra, V.U.; Mendoza, D.M.; Briones, A.M. Chemical changes under aerobic composting and nutrient supplying potential of banana residue compost. Renew. Agric. Food Syst. 2005, 20, 113–125. [Google Scholar] [CrossRef]
  57. Chimuka, L.; Manungufala, T.E. Sources, Bioavailability and Fate of Heavy Metals and Organic Contaminants in Compost Manure. Dyn. Soil Dyn. Plant 2009, 3, 32–38. [Google Scholar]
  58. Hsu, J.H.; Lo, S.L. Effect of composting on characterization and leaching of copper, manganese, and zinc from swine manure. Environ. Pollut. 2001, 114, 119–127. [Google Scholar] [CrossRef]
  59. Ho, L.H.; Noor Aziah, A.A.; Bhat, R. Mineral composition and pasting properties of banana pseudo-stem flour from Musa acuminata x balbisiana cv. Awak grown locally in Perak, Malaysia. Int. Food Res. J. 2012, 19, 1479–1485. [Google Scholar] [CrossRef]
  60. Luo, Y.; Liang, J.; Zeng, G.; Chen, M.; Mo, D.; Li, G.; Zhang, D. Seed germination test for toxicity evaluation of compost: Its roles, problems and prospects. Waste Manag. 2018, 71, 109–114. [Google Scholar] [CrossRef]
  61. Yang, F.; Li, G.X.; Yang, Q.Y.; Luo, W.H. Effect of bulking agents on maturity and gaseous emissions during kitchen waste composting. Chemosphere 2013, 93, 1393–1399. [Google Scholar] [CrossRef]
  62. Zorpas, A.A.; Loizidou, M. Sawdust and natural zeolite as a bulking agent for improving quality of a composting product from anaerobically stabilized sewage sludge. Bioresour. Technol. 2008, 99, 7545–7552. [Google Scholar] [CrossRef]
Figure 1. Temperature during the composting as affected by T1–T3 treatments (a); Temperature during the composting as affected by T4–T6 treatments (b).
Sustainability 13 08458 g001
Figure 2. Changes of pH during the composting. Each marker point represents mean (n = 3), and the vertical bars indicate Standard Error of Means (S.E.M). Legends: BPS, MMW, and CM mixed at T1 = 1:1:1, T2 = 1:2:1, T3 = 1:3:1, T4 = 2:1:1, T5 = 2:2:1, and T6 = 2:3:1, respectively.
Sustainability 13 08458 g002
Figure 3. Changes of EC during the composting. Each marker point represents mean (n = 3), and the vertical bars indicate Standard Error of Means (S.E.M). Legends: BPS, MMW, and CM mixed at T1 = 1:1:1, T2 = 1:2:1, T3 = 1:3:1, T4 = 2:1:1, T5 = 2:2:1, and T6 = 2:3:1, respectively.
Sustainability 13 08458 g003
Figure 4. Degradation of organic matter during the composting period. The vertical bars indicate Standard Error of Means (S.E.M). Legends: BPS, MMW, and CM mixed at T1 = 1:1:1, T2 = 1:2:1, T3 = 1:3:1, T4 = 2:1:1, T5 = 2:2:1, and T6 = 2:3:1, respectively.
Sustainability 13 08458 g004
Figure 5. Changes of NH4-N during the composting. Each marker point represents mean (n = 3), and the vertical bars indicate Standard Error of Means (S.E.M). Legends: BPS, MMW, and CM mixed at T1 = 1:1:1, T2 = 1:2:1, T3 = 1:3:1, T4 = 2:1:1, T5 = 2:2:1, and T6 = 2:3:1, respectively.
Sustainability 13 08458 g005
Figure 6. Changes of NO3-N during the composting. Each marker point represents mean (n = 3), and the vertical bars indicate Standard Error of Means (S.E.M). Legends: BPS, MMW, and CM mixed at T1 = 1:1:1, T2 = 1:2:1, T3 = 1:3:1, T4 = 2:1:1, T5 = 2:2:1, and T6 = 2:3:1, respectively.
Sustainability 13 08458 g006
Figure 7. Changes of germination index in different treatments over the composting period. Each marker point represents mean (n = 3), and the vertical bars indicate Standard Error of Means (S.E.M). Legends: BPS, MMW, and CM mixed at T1 = 1:1:1, T2 = 1:2:1, T3 = 1:3:1, T4 = 2:1:1, T5 = 2:2:1, and T6 = 2:3:1, respectively.
Sustainability 13 08458 g007
Table 1. Physicochemical characteristics of the raw materials used in the co-composting process.
PropertiesBanana Pseudostem (BPS)Chicken Manure (CK)Mushroom Media Waste (MMW)
Moisture (%)59.23 ± 4.7414.52 ± 0.5928.50 ± 0.35
pH10.41 ± 0.189.53 ± 0.336.19 ± 0.13
EC (dSm−1)4.74 ± 0.144.66 ± 0.130.70 ± 0.02
Total C (%)35.14 ± 1.2323.57 ± 1.0840.12 ± 1.42
OM (%)77.78 ± 2.1050.0 ± 1.9594.94 ± 3.03
C:N ratio73.20 ± 1.568.93 ± 0.2616.05 ± 0.51
Total N (%)0.48 ± 0.072.64 ± 0.062.50 ± 0.06
CEC (cmol (+)/kg−1)30.00 ± 1.2524.85 ± 1.1424.35 ± 0.88
Potassium (K, g kg−1)14.06 ± 0.5712.59 ± 0.473.24 ± 0.16
Calcium (Ca, g kg−1)9.60 ± 0.3512.36 ± 0.4312.27 ± 0.55
Magnesium (Mg, g kg−1)2.52 ± 0.093.60 ± 0.142.41 ± 0.08
Sodium (Na, g kg−1)0.87 ± 0.042.48 ± 0.090.55 ± 0.04
Total P (g kg−1)7.40 ± 0.316.20 ± 0.248.02 ± 0.37
Copper (mg kg−1)35.40 ± 1.7041.60 ± 1.6614.10 ± 0.59
Manganese (Mn, mg kg−1)160.3 ± 6.25360.2 ± 13.69101.2 ± 5.06
Zinc (Zn, mg kg−1)60.2 ± 2.4032.72 ± 0.98163.8 ± 7.17
Mean ± Standard deviation are the average of three replicated samples (dry basis).
Table 2. Changes of moisture, C:N ratio, total N, and cation exchange capacity of different compost by co-composting.
ParametersTimeT1T2T3T4T5T6
Moisture content (%)Initial
Final
72.12 ± 2.35 ab
45.24 ± 1.10 b
68.52 ± 1.96 b
38.55 ± 0.94 d
70.6 ± 1.73 ab
36.25 ± 0.74 d
79.32 ± 2.91 a
50.10 ± 1.43 a
75.1 ± 1.53 ab
43.41 ± 0.71 bc
73.39 ± 1.19 ab
40.21 ± 0.70 cd
Total Organic C (%)Initial
Final
35.25 ± 1.00 ab
24.08 ± 0.59 ab
40.96 ± 1.01 a
18.90 ± 0.55 d
42.56 ± 0.97 a
20.09 ± 0.57 cd
34.55 ± 1.13 c
25.61 ± 0.52 a
37.98 ± 0.93 abc
22.25 ± 0.40 bc
39.80 ± 1.13 ab
21.28 ± 0.69 cd
Total N (%)Initial
Final
1.91 ± 0.04 a
1.46 ± 0.03 a
1.70 ± 0.03 b
1.53 ± 0.04 a
1.68 ± 0.04 b
1.45 ± 0.04 a
1.42 ± 0.03 c
1.10 ± 0.02 b
1.76 ± 0.04 ab
1.48 ± 0.03 a
1.70 ± 0.03 b
1.42 ± 0.02 a
C:NInitial
Final
18.44 ± 0.60 c
16.49 ± 0.40 b
24.09 ± 0.58 ab
12.35 ± 0.25 d
25.33 ± 0.82 a
13.76 ± 0.22 cd
24.33 ± 0.39 ab
23.28 ± 0.52 a
21.57 ± 0.70 b
15.03 ± 0.42 bc
23.14 ± 0.42 ab
14.98 ± 0.30 bc
CEC (cmol kg−1)Initial
Final
24.85 ± 0.81 ab
38.00 ± 0.50 bc
27.48 ± 0.63 ab
41.28 ± 0.98 a
27.77 ± 0.56 a
40.14 ± 0.90 a
24.00 ± 0.81 b
32.14 ± 0.55 c
25.42 ± 0.71 ab
38.50 ± 0.68 abc
25.21 ± 0.90 ab
40.07 ± 0.88 ab
Here, compost piles, viz. T1 = 1:1:1, T2 = 1:2:1, T3 = 1:3:1, T4 = 2:1:1, T5 = 2:2:1, and T6 = 2:3:1, indicates mixture ratio of banana pseudostem (BPS), mushroom media waste (MMW), and chicken manure (CM) respectively. Mean ± standard error within the row followed by the same letter are not statistically significant at p ≥ 0.05 by LSD Test.
Table 3. Changes of total macro- and micronutrients of different treatments (T1–T6) during the composting period.
TreatmentsP (g kg−1)K (g kg−1)Ca (g kg−1)
InitialFinal% IncreaseInitialFinal% IncreaseInitialFinal% Increase
T14.14 ± 0.13 bc6.76 ± 0.27 b63.297.47 ± 0.18 b12.1 ± 0.47 a61.986.64 ± 0.26 b8.97 ± 0.19 c35.09
T25.49 ± 0.20 a9.84 ± 0.35 a79.235.28 ± 0.11 c9.15 ± 0.46 b73.3010.23 ± 0.23 a14.8 ± 0.17 a44.67
T36.20 ± 0.15 a10.4 ± 0.16 a67.744.84 ± 0.22 c8.04 ± 0.42 b66.129.88 ± 0.09 a14.2 ± 0.26 ab43.72
T43.45 ± 0.10 c4.39 ± 0.12 c27.2510.6 ± 0.12 a9.85 ± 0.35 ab−7.085.97 ± 0.14 c5.08 ± 0.17 d−14.90
T53.69 ± 0.13 bc6.64 ± 0.26 b79.956.04 ± 0.14 c9.26 ± 0.25 b53.316.43 ± 0.17 b8.46 ± 0.20 c31.57
T64.39 ± 0.17 b7.50 ± 0.20 b70.845.81 ± 0.17 c7.55 ± 0.22 b29.959.18 ± 0.19 a12.8 ± 0.26 b39.43
LSD (0.05)0.841.19-1.322.41-1.281.65-
TreatmentsMg (g kg−1)Na (g kg−1)S (mg kg−1)
InitialFinal% IncreaseInitialFinal% IncreaseInitialFinal% Increase
T13.77 ± 0.11 bc5.94 ± 0.03 a57.562.05 ± 0.02 b2.70 ± 0.04 a31.71270 ± 8.15 a300 ± 6.12 a11.11
T23.45 ± 0.02 c4.81 ± 0.04 b39.421.70 ± 0.02 d2.40 ± 0.02 b41.18200 ± 4.89 d250 ± 4.08 c25.00
T33.38 ± 0.07 c4.62 ± 0.03 c36.691.81 ± 0.01 c2.31 ± 0.03 c27.62190 ± 3.67 d270 ± 8.16 bc42.11
T44.51 ± 0.16 a4.12 ± 0.04 d−8.652.14 ± 0.02 a2.10 ± 0.02 d−1.87230 ± 5.30 bc290 ± 3.26 ab26.09
T53.91 ± 0.04 b4.86 ± 0.03 b24.301.81 ± 0.03 c2.30 ± 0.03 c27.07250 ± 4.89 ab260 ± 4.48 c4.00
T63.40 ± 0.08 c4.59 ± 0.03 c35.001.59 ± 0.02 e2.14 ± 0.05 d34.59210 ± 4.08 cd250 ± 2.85 c19.05
LSD (0.05)0.440.13-0.040.08-23.7321.19-
TreatmentsZn (mg kg−1)Cu (mg kg−1)Mn (mg kg−1)
InitialFinal% IncreaseInitialFinal% IncreaseInitialFinal% Increase
T1170 ± 3.26 d230 ± 6.12 d35.331.3 ± 1.02 ab49.0 ± 1.33 b56.5270 ± 11.02 cd470 ± 8.16 d74.1
T2245 ± 4.08 a456 ± 6.53 a86.128.7 ± 0.81 b60.7 ± 1.17 a111319 ± 11.71 ab784 ± 13.88 a145.8
T3241 ± 4.10 ab426 ± 6.53 ab76.821.4 ± 0.57 c59.6 ± 1.06 a178255 ± 6.12 d670 ± 12.24 b162.7
T4150 ± 4.08 e170 ± 2.04 e13.333.4 ± 0.73 a34.0 ± 0.74 c1.8342 ± 8.97 a370 ± 6.12 e8.2
T5193 ± 2.86 c310 ± 8.16 c60.629.3 ± 0.53 b51.3 ± 0.69 b75.1292 ± 4.89 bc583 ± 8.87 c99.7
T6224 ± 4.49 b419 ± 7.75 b87.122.3 ± 0.93 c47.7 ± 0.37 b113.9244 ± 5.71 d602 ± 12.23 c146.7
LSD (0.05)18.8231.11-3.536.61-35.5050.09-
Here, piles, viz., T1 = 1:1:1, T2 = 1:2:1, T3 = 1:3:1, T4 = 2:1:1, T5 = 2:2:1, and T6 = 2:3:1, indicate mixture ratio of BPS, MMW, and CM respectively. Mean ±standard error within the column followed by the same letter are not statistically significant at p ≥ 0.05 by LSD Test.
Publisher’s Note: MDPI stays neutral with regard to jurisdictional claims in published maps and institutional affiliations.

