Article

Nexus between Natural Resources and Environmental Degradation: Analysing the Role of Income Inequality and Renewable Energy

Faculty of Management and Economics, Kunming University of Science and Technology, Kunming 650093, China
*
Author to whom correspondence should be addressed.
Sustainability 2021, 13(15), 8364; https://doi.org/10.3390/su13158364
Submission received: 18 June 2021 / Revised: 9 July 2021 / Accepted: 19 July 2021 / Published: 27 July 2021

Abstract

:
Globally, as the environment deteriorates, use of renewable energy is increasing. The discrepancy between inequalities, sustainable sources, and natural resources, on the other hand, is enormous. As a consequence, the current research simulated the link between income inequality, renewable energy, and carbon emissions from 1990 to 2018. The long run and short run interaction were estimated using an autoregressive distribution lag (ARDL) model. According to the study’s findings, improvements in sustainable power, as well as income inequality, are producing a rise in environmental quality. Natural resources seem to have a significantly positive influence on the environment’s quality. Furthermore, the study found that financial development and environmental quality have a bidirectional causal link. According to the conclusions of this study, government authorities should support the use of renewable energy, i.e., sources to optimize carbon release.

1. Introduction

In recent years, growing concern about environmental degradation and income inequality has given environmental issues a new dimension by linking them to socioeconomic inequalities [1]. It has become a crucial scientific subject to figure out whether or not income inequality has an impact on environmental degradation [2]. As a result, studies were conducted to investigate economic inequality’s influence on environmental measures, such as CO2 emissions, environmental deficiency, water, and air pollution [3]. Many studies have been conducted to describe environmental issues. For example, [4,5,6] stated that environmental problems stem from income and power inequalities, whereas [7,8] concluded that income inequality has no effect on environmental quality.
In terms of economic development, the global economy has done well, but not so well in terms of welfare distribution and environmental concerns [3]. As a result, one of the most fundamental hurdles to developing a peaceful society is wealth income inequality. The growing worsening of income distribution has arisen as a key socioeconomic issue, arousing the interest of both industrialized and emerging countries, particularly since the 1980s [3]. Baloch et al. [9] have considered the concept between income gain and CO2 release, and found that as wealth rises, environmental quality declines. While it may help poor people in developing nations, it exacerbates environmental damage. Income disparity has a huge impact on environmental deterioration and poverty [9]. In addition, the Sustainable Development Goals show that growing income inequality and environmental deterioration are grave challenges to humankind. Long-term development and income disparity are intrinsically intertwined [9].
It is critical to promote sustainable development today in order to make the right decision. Therefore, to achieve sustainable development, 193 United Nations member countries established the 2030 Sustainable Development Goals in 2015 [3]. This plan’s framework is to reduce financial condition and inequalities, enhance the environment quality, and establish strong foundations to respond to existing commercial, social, and climate change [10]. According to world popular sentiment, the main impediments to sustainability are income inequality and deteriorating environmental quality [11]. In the same context, Ref [10] stated that inequalities and climate change are major challenges.
Furthermore, the global increase in production has an impact on energy and natural resource consumption. Globalization, population growth, and industrialization, are all factors that resulted in severe environmental alterations [12]. Economies grow on the consumption of massive energy, which have many challenges, and environmental quality is one of the most concerning because it impacts climate change and poverty levels through a range of effects on agriculture production and health of the people [13]. To sustain the economic growth and development, economies require large amounts of energy. Increase in human activities and population growth not only requires the supply of natural resources, such as land, drinking water, and clean air, but the accumulated goods and services, and externalities produced in the form of pollution and greenhouse gas emissions grow disproportionately. The increase in the economic activities leads to environmental concerns due to emission levels and demand for energy [14].
According to the BP statistical analysis report generated in 2019, fossil fuels including coal, crude oil, and natural gas account for 75% of worldwide energy use, limiting energy efficiency and generating serious environmental issues [15]. CO2 emissions grew from 11,193.9 million tonnes in 1965 to 33,890 million tonnes in 2018; such rapid carbon emissions will place further burden on the ecosystem [16]. As a result, energy efficiency and CO2 emission reduction have become critical components of accomplishing long-term development objectives. In addition, as environmental issues deteriorate, renewable energy has evolved as an important choice for accomplishing long-term improvement objectives [17], but it is a maintainable source that generates less CO2 than fossil fuels.
Increased economic activity raises environmental concerns [18]. The environmental consequences of these activities affect both the domestic economy and the global economy, as all countries are now interconnected due to globalization [14]. Economic development contributes to climate change and environmental sustainability by driving the economy toward industrialization, growing agricultural performance, and work natural resource exploitation. Most of these networks are created due to environmental degradation and the development of toxic chemicals [19]. Use of natural resources, such as agriculture, deforestation, and mining, has an impact on the environment.
CO2 emissions have increased significantly in recent years, posing a serious threat to human development. Despite international organizations efforts to reduce carbon emissions by implementing new strategies, CO2 emissions increased by 1.7% in 2018 [20]. Respective studies, including [21,22] noted that when considering environmental quality, financial development and overseas investment are key aspects to examine. Charfeddine and Kahia (2003) described two aspects that show a relationship between the financial enhancement and the emission of CO2 [23]. First, financial enhancement can result in lower capital costs, fewer credit restrictions, lower interest rates, and the provision of funds for more energy-efficient projects. Second, financial development can improve environmental quality by advancing research and development, boosting economic growth, and bringing advanced technologies [24]. Financial development provides an opening for the developing countries to use advanced and energy-efficient machinery that will use low energy and will be efficient for the environment [25].
Pakistan is located in South Asia and is abundant in resources such as land, forestry, fossil fuels, energy, metal, fuel, gemstones, mercury, salts, and platinum. The world’s 2nd largest salt mine, 2nd largest mine of coal, 5th largest mine of gold, 7th largest mine of copper, world’s 12th largest rice output, and the world’s 11th largest wheat cultivation are all located here [26]. It is primarily an agricultural country that relies on agriculture and natural resources [26]. Pakistan is confronted with a number of challenges, including climate change and energy crises. The Pakistani government is working hard to overcome energy crises and achieve economic development. The China–Pakistan Economic Corridor is a step in coordinating coal, hydropower, and renewable resource energy-related initiatives through local energy economic development [27]. In 1965, the renewable energy consumption rate was about 41 Terawatt-hours and 561 Terawatt-hours at the beginning of the 2000s. It increased an average of 16.4% between 2007 and 2017 and reached 2480.4 Terawatt-hours in 2018. Although there has been significant growth in renewable energy consumption, it still accounts for only 4% of total primary energy consumption [28].
The nexus between financial development, renewable energy, natural resources, and income inequality has been studied by different researchers who identified different results. For example, Seetanah et al. [21], Shahbaz et al. [22], and Shao [29] stated that financial development must be considered while evaluating environmental problems [21,29,30]. Lin, [31], Xu et al. [32], Huang and Zhao, [33], Xiong et al. [34], and Zhang and Zhang [35] identified a positive relationship between financial development and environmental degradation [30,31,32,33,34]. Shahbaz et al. [25], Talaei et al. [36], and Saud and Chen [37] reported a negative relationship [37,38,39], while He [40] and Ding et al. [41] resulted that financial development has no impact on CO2 emissions [40,41]. Charfeddine and Kahia [23] reported both positive and negative relationships [23].
To reduce global warming it is universally accepted to adopt renewable energy because it is clean due to low emissions [42]. Danish et al. [43], Alola et al. [44], Nguyen and Kakinaka, [45], Destek and Sarkodie, [46], Baloch and Zhang, [47], Dogan and Taspinar [48], Bello et al. [49], and Destek, [50] identified that renewable energy consumption promotes environmental quality [41,42,43,44,45,46,47,48].
Natural resources and economic growth are the main factors to improve environmental quality [49,50,51,52]. Environmental degradation occurs due to the depletion of natural resources so it is a key indicator [50]. Tauseef Hassan et al. [53], Akhter et al. [54], and Danish et al. [55] resulted a positive relation with environmental degradation [52,54].
Income inequality may mitigate or intensify CO2 emissions [55]. The more income inequality, consumption of high polluting goods and services will be greater, which eventually increases the emissions [55,56]. Liu et al. [11], Torras and Boyce, [5]), Baloch et al. [9] and Hailemariam et al. [57]) resulted a positive link between income inequality and environmental degradation [5,9,11,57]. The studies of Ravallion et al. [51], Gassebner et al [58], Hao et al. [59], and Greiner and Mcgee, [60] show that income inequality is negatively associated with carbon emissions [51,56,57,58].
Pakistan is facing a severe environmental degradation problem and the CO2 emissions reached 1% of the total planet emissions [59]. This contamination directly affects ecosystems and creates social unrest and instability in the economy. In the urban areas of Pakistan, air contaminants and the level of pollutants is four times higher than the limits from the World Health Organization [60]. The depletion of natural resources and deforestation are the main factors for the environmental degradation. The remaining percentage of the forest is now 2.23%, which leads to biodiversity loss, habitat conservation loss, and woody biomass loss [61]. Due to the rise in the temperature, Pakistan faces a decrease in agriculture production, reduction in the forest covered areas, and environmental degradation. This rise in the temperature is a great threat to the green zone of the country, i.e., south eastern Balochistan, north eastern Balochistan, Southern Punjab, and Sindh [62].
Based on the stated context, this study aims to examine the link between the emissions of CO2, income inequality, and renewable energy. Moreover, this study seeks to address the key research questions: what impacts do financial development, income inequality, and renewable energy have on environmental degradation in the context of Pakistan? This research makes some significant contributions to the existing literature. To begin, as far as we know, this study is the first attempt to address the link between carbon emissions, income inequality, financial development, natural resources, and renewable energy. Second, to avoid specification bias, two additional variables, financial development and natural resources, were used as control variables. Third, an ARDL bound testing methodology was used to resolve whether the variables have a long run relationship and the robustness of the results are investigated through a bound test [63].
Following is a reminder of the study.
A comprehensive overview of the literature follows in the next section. The model’s development, econometric technique, and data source are all described under the methodology section. The empirical analysis and discussion are demonstrated in the analytical findings section, and the conclusions and policy ramifications are presented in the last part.

2. A Brief Overview of Related Literature

This unit covers an overview of the related literature, i.e., the nexus between natural resources, income inequality, renewable energy, financial development, and environmental degradation.

2.1. Nexus between Natural Resources and Environmental Degradation

Natural resources, whether in their raw form or after processing, are socially, politically, and economically advantageous in the natural environment [64]. The importance of the globalization–natural resources relationship cannot be overstated. Danish et al. [55], for example, discussed the influence of natural resources and renewable energy on environmental contamination. They tested the Environmental Kuznets Curve (EKC) assumptions and discovered that natural resources in Brazil, China, and India had no effect on CO2 emissions [53]. They also investigated how Russia’s natural resources help to reduce pollution.
Natural resource abundance is a key component, to extract and contribute a valuable part in the GDP, particularly for the developing countries [26,64]. Natural resources and financial growth are the most significant factors to increase the quality of an environment [65], but other human activities, such as lower agricultural production and water pollution, have negative environmental repercussions. Natural resource depletion promotes environmental degradation, which is a significant indicator [50].
Increasing economic growth advantage to enhanced use of natural resources [49] and the unsustainable use of natural resources in both developed and developing nations produces major environmental issues, such as deforestation, water shortage, and climate change [53]. However, fast economic progress in the Brazil, Russia, India, China, and South Africa (BRICS) economies has resulted in a number of environmental challenges, mainly CO2 emissions [53,66,67]. Further, the interconnectedness of energy, water, and the environment must be taken into account. Zhang et al. [68] investigated the relationship among economic development, energy usage, air pollution, and carbon emissions expenditure. It was explored and discovered that energy consumption rises with economic growth, while energy efficiency and environmental degradation or air emissions fall [66]. Litovitz et al. [69] projected that the extraction of unconventional shale gas in Pennsylvania resulted in USD 7.2 to USD 32 million in air pollution emissions and health consequences [67]. Furthermore, [68] evaluated the link between per capita primary greenhouse gas emissions and carbon dioxide emissions in major Asian cities and concluded that waste generation per capita and GDP per capita are both positively connected to carbon dioxide emissions per capita.
Furthermore, [69] evaluated the interplay between renewable energy and supply chains in the United States, resulting in decreased greenhouse gas emissions and a 50% reduction in water consumption. Moreover, [70] investigated agricultural-related environmental issues such as land degradation due to erosion, the use of organic chemicals, waterlogging, water salinity, and the depletion of forests and water resources, as well as the relationship between energy factors, consumption of nuclear energy, electricity, power, and fossil fuels, and industrialization, which includes industrial expansion, beverages, and cigarettes. GDP growth, agricultural expansion, and manufacturing service growth are all indicators of economic development. There was a link between environmental variables like CO2 emissions, population density, and water resources, as well as resource variables such as mineral depletion, natural depletion, and forest depletion, and economic variables such as growth, industrialization, environmental degradation, and resource depletion.

2.2. Nexus between Income Inequality and Environmental Degradation

Human activities have affected every part of the environment. Rising environmental dangers, most notably global warming, are endangering the long-term survival of socioeconomic and biological systems. CO2 is the most significant contributor to greenhouse gas emissions, drawing scientists and policymakers to research the variables controlling emission levels [71,72,73]. For sustainable living and pollution, greenhouse gas emissions must be controlled to a particular level, and CO2 is the most significant component of greenhouse gas emissions, drawing researchers and politicians to explore the variables influencing emission levels [55]. Environmental Kuznets curve theories are commonly used in related research, and their effectiveness has been proved [74,75]. Although EKC research has revealed a variety of variables that impact CO2 emissions, the relevance of income inequality has yet to be investigated. Income inequality has the potential to reduce or increase CO2 emissions through a variety of mechanisms. Income disparity may multiply CO2 emissions owing to polluting preferences of the rich, leading to low environmental regulations, which may discourage environmental protection and social responsibility-taking behaviors, and culminating in severe environmental degradation [55]. According to political economic theory, when income inequality develops, so does consumption of high-polluting goods and services, resulting in an increase in emissions [74]. Similarly, the competitiveness model in [75] emphasized how income inequality influences consumption status and working hours, both of which tend to increase as inequality grows. Energy consumption grows in tandem with the economy and home consumption, resulting in increased CO2 emissions [76].
The second school of thought asserted that income inequality reduces CO2 emissions because a greater proportion of poorer people live outside the carbon economy, and the negative impact is magnified in developing nations [8]. The marginal propensity to emit (MPE) could be used to examine the link between inequalities and emission; MPE may change based on revenue level [56]. When the MPE of low-income groups is higher, then the target is to reduce the inequality and increase the emission of CO2. When they have a low MPE, policies aimed at reducing inequality decrease emissions. Apart from the previously mentioned multipath ways in which income inequality effects CO2 emissions, economic, financial, and political institutions are also relevant. The least corrupt government enacts strict environmental regulations to ensure a high-quality environment and to protect the rights of the poor, thus modifying the consequence of inequality on emission [77], whereas the policies of climate change can alter the significant influence of inequality on the emission [78].

2.3. Nexus between Renewable Energy and Environmental Degradation

The world is confronted with a slew of issues, the most pressing of which are sustainable development and environmental preservation. Reduced atmospheric phenomenon gaseous state, of which CO2 emissions are a critical component, is the most effective method for maintaining biodiversity [79]. The increasing degradation of the environment poses a threat to human survival, demanding the usage of clean and safe energy. Researchers and policymakers agree that the stated goal of shifting from non-renewable to renewable energy is vital. Wind, tides, sunshine, hydropower, and geothermal energy are examples of renewable energy sources that can regenerate quickly [80]. Gorus and Aslan [81] investigated the elements that contribute to environmental deterioration in the Middle East and North Africa (MENA) since 1980 to 2013, and discovered that the use of constant energy is one of them [82]. If global warming is to be averted, renewable energy sources must be created. For example, [83] investigated the effects of renewable energy on constant energy and income in five member countries of MERCOSUR (Argentina, Brazil, Paraguay, Uruguay, Venezuela) and determined that alternative sources reduce CO2 emissions while non-renewable energy raises CO2 emissions. The same conclusions were obtained by other countries [81].
Furthermore, [84] investigated the association between renewable energy and energy efficiency in order to foster a more environmentally friendly environment, and discovered that RE improves the Nigerian environmental quality. Dinç and Akdo [85] examined the relationship between RE output, development, and the usage of total energy from 1980 to 2016, and demonstrated a connection circle between RE and development [86].
Yazdi and Beygi [87] investigated the consequences of renewable energy on Africa’s CO2 emissions. Their findings show that trade and renewable energy can improve environmental quality by lowering CO2 emissions [88]. Using augmented mean group (AMG) estimation techniques, [85] evaluated the influence of renewable energy, urbanization, and commerce on ecological footprints in Columbia, Indonesia, Turkey, Egypt, Vietnam, and South Africa from 1990 to 2014. According to the findings, utilizing renewable energy and trading enhances environmental quality, but using non-renewable energy and trading destroys it. Furthermore, [41] used panel data estimators Fully Modified Ordinary Least Squares (FMOLS) and Dynamic Ordinary Least Squares (DOLS) econometric techniques on BRICS data from 1992 to 2016 and discovered that renewable energy and urbanization increase environmental quality by reducing ecological footprint.
BRICS (Brazil, Russia, China, and South Africa) nations’ ecological footprints were also empirically examined using panel data from 1992 to 2016 by [87]. Renewable energy, urbanization, and natural resources were included in the EKC model; renewable energy has a prohibitive influence on the natural footmark. Hanif et al. [89] used data from 1990 to 2015 to analyze the impact of renewable energy on CO2 emissions in 25 higher and lower middle-income nations. Using two-step General Methods of Moments (GMM) estimate methodologies, they discovered that renewable energy helps to reduce CO2 emissions and elaborated decarbonization of economies and promotion of renewable energy [90].

2.4. Nexus between Financial Development and Environmental Degradation

One of the predominant trends that has emerged is financial development. Economic growth and development measures and activities increase environmental risks and have become a global issue in the field of environmental economics [72]. The primary difficulties for humankind are economic growth and environmental conservation, and they have emerged as the most serious concerns in both industrialized and developing countries [91]. These issues have piqued the interest of environmentalists and economists seeking to comprehend the association between development and ecological quality [89,92,93]. Many researchers have identified an association between financial growth and emission of CO2. Well-established economic institutions can mitigate environmental pollution through technological innovation, lower-cost environmentally friendly projects, and reduced energy intensity, allowing energy efficiency to be improved [94]. For example, [95,96,97,98,99,100,101] discovered that economic growth lowers CO2 emissions and thus protects the environment. Furthermore, [102,103,104,105] discovered a non-significant association between economic growth and CO2 emissions.
Similarly, the empirical results of a Pooled Mean Group (PMG-panel ARDL) approach by [106] illustrates that the economic growth has a large and beneficial influence on carbon emissions in developing (D8) and developed (G8) nations from 1999 to 2013.

3. Methodology

The goal of this study is to figure out how renewable energy, income inequality, financial development, natural resources, and environmental deterioration are linked. Evidence acquired in Pakistan from 1990 to 2018 has been used to look at the link between the variables and the control variables. Various econometric methodologies have been used by many scholars to examine the long and short run connections among variables. We evaluated the ARDL bound testing methodology suggested by [107] because of its multiple benefits. An ARDL bound test methodology is suitable for small data set, and it delivers both short and long run estimations via a simple linear transformation. Missing variables and autocorrelations can be mitigated [108]. It applies whether the underlying variables are integrated at order zero I (0), order one I (I), or mutually integrated.

3.1. Empirical Model

In our work, we followed the studies of [92,109,110,111,112,113] to examine the association between renewable energy, income inequality, and environmental degradation. The impact of these variables on environmental degradation can be expressed as follows in a linear logarithmic form:
L o g C O 2 t = β 0 + β 1 t L o g F D t + β 2 t L o g I N E N t + β 3 t L o g N R t + β 4 t L o g R E t + ε t
In the given Equation (1) CO2t is the CO2 environmental deterioration and is measured in terms of emissions per capita. pFDt is the financial development, INENt is the income inequality, NRt is the natural resources, and REt is the renewable energy. Whereas β0 is invariant term, β1, β2, β3, and β4 are coefficients of explanatory variables, while ε is error correction term.
Furthermore, to utilize the bound testing, Equation (1) can be reformulated as an ARDL form of the (VECM) vector error-correction model
Δ L o g C O 2 = β 0 C O 2 + k = 1 n β 1 k Δ L o g C O 2 ( t k ) + k = 0 n β 2 k Δ L o g F D ( t k ) + k = 0 n β 3 k Δ L o g I N E N ( t k ) + k = 0 n β 4 k Δ L o g N R ( t k ) + k = 0 n β 5 k Δ L o g R E ( t k ) + λ 1 C O 2 Δ L o g C O 2 ( t 1 ) + λ 2 C O 2 Δ L o g N R ( t 1 ) + λ 3 C O 2 Δ L o g F D ( t 1 ) + λ 4 C O 2 Δ L o g I N E N ( t 1 ) + λ 5 C O 2 Δ L o g R E ( t 1 ) + ε 1 t
Δ L o g F D = β 0 F D + k = 1 n β 1 k Δ L o g F D ( t k ) + k = 0 n β 2 k Δ L o g C O 2 ( t k ) + k = 0 n β 3 k Δ L o g I N E N ( t k ) + k = 0 n β 4 k Δ L o g N R ( t k ) + k = 0 n β 5 k Δ L o g R E ( t k ) + λ 1 F D Δ L o g F D ( t 1 ) + λ 2 F D Δ L o g N R ( t 1 ) + λ 3 F D Δ L o g C O 2 ( t 1 ) + λ 4 F D Δ L o g I N E N ( t 1 ) + λ 5 F D Δ L o g R E ( t 1 ) + ε 1 t
Model (3) impact of financial development on CO2 emissions.
Δ L o g I N E N = β 0 I N E N + k = 1 n β 1 k Δ L o g I N E N ( t k ) + k = 0 n β 2 k Δ L o g C O 2 ( t k ) + k = 0 n β 3 k Δ L o g F D ( t k ) + k = 0 n β 4 k Δ L o g N R ( t k ) + k = 0 n β 5 k Δ L o g R E ( t k ) + λ 1 I N E N Δ L o g I N E N ( t 1 ) + λ 2 I N E N Δ L o g N R ( t 1 ) + λ 3 I N E N Δ L o g C O 2 ( t 1 ) + λ 4 I N E N Δ L o g F D ( t 1 ) + λ 5 I N E N Δ L o g R E ( t 1 ) + ε 1 t
Model (4) represents the impact of income inequality on CO2 emissions.
Δ L o g N R = β 0 N R + k = 1 n β 1 k Δ L o g N R ( t k ) + k = 0 n β 2 k Δ L o g C O 2 ( t k ) + k = 0 n β 3 k Δ L o g F D ( t k ) + k = 0 n β 4 k Δ L o g I N E N ( t k ) + k = 0 n β 5 k Δ L o g R E ( t k ) + λ 1 N R Δ L o g N R ( t 1 ) + λ 2 N R Δ L o g I N E N ( t 1 ) + λ 3 N R Δ L o g C O 2 ( t 1 ) + λ 4 N R Δ L o g F D ( t 1 ) + λ 5 N R Δ L o g R E ( t 1 ) + ε 1 t
Model (5) is the impact of natural resources on CO2 emissions.
Δ L o g R E = β 0 R E + k = 1 n β 1 k Δ L o g R E ( t k ) + k = 0 n β 2 k Δ L o g C O 2 ( t k ) + k = 0 n β 3 k Δ L o g F D ( t k ) + k = 0 n β 4 k Δ L o g I N E N ( t k ) + k = 0 n β 5 k Δ L o g N R ( t k ) + λ 1 R E Δ L o g R E ( t 1 ) + λ 2 R E Δ L o g I N E N ( t 1 ) + λ 3 R E Δ L o g C O 2 ( t 1 ) + λ 4 R E Δ L o g F D ( t 1 ) + λ 5 R E Δ L o g N R ( t 1 ) + ε 1 t
Model (6) represents impact of Renewable energy on CO2 emissions.
Here, Δ the initial variance, λ represent the long run coefficient, and the residual error is ε. The alternate conception H1: λ1 = λ2 = λ3 = λ4 = λ5 = 0 was compared to the null hypothesis of co-integration Ho: λ1λ2λ3λ4λ5 ≠0
Co-integration must be confirmed using the F statistic prior to long run estimate, with the upper and lower limits guiding the decision. The null hypothesis having no co-integration will be excluded when the F-statistic exceeds the upper boundary, while the rest of the hypothesis whose F-statistic drops below the lower bound will be accepted. The outcome is also unconvincing if the F-statistic values occurred among the upper and lower boundaries [108].
The long and short run findings are created when the co-integration is validated. Indicative tests such the ARCH, LM, and Ramsey tests were conducted to assess the model’s stability. Model stability and applicability for policy recommendations were further evaluated using robustness tests, cumulative sum (CUMUS), and cumulative sum of squares (CUSUM sq).
Granger causality was conducted to identify the underlying route between variables in addition to co-integration confirmation. If the Granger causality test was used to the first difference, the findings would be biased. In this scenario, using an error correction term to estimate long run relationship would be reliable. As a result, the phrase “error correction” is defined and implicit. The error-correcting term model is as follows:
[ L o g C O 2 L o g F D L o g I N E N L o g R E L o g N R ] = [ β 1 β 2 β 3 β 4 β 5 ] = [ β 11 k β 12 k β 13 k β 14 k β 15 k β 21 k β 22 k β 23 k β 24 k β 25 k β 31 k β 32 k β 33 k β 34 k β 35 k β 41 k β 42 k β 43 k β 44 k β 45 k β 51 k β 52 k β 53 k β 54 k β 55 k ] = [ Δ L o g C O 2 i t Δ L o g F D i t Δ L o g I N E N i t Δ L o g R E i t Δ L o g N R i t ] = [ n 1 n 2 n 3 n 4 n 5 ] = e c t i t 1 + [ ε 1 t ε 2 t ε 3 t ε 4 t ε 5 t ]
where ect−1 represents the existence of long run causality, t stand for time period, k is an appropriate lag length, and εt stochastic error term.

3.2. Data and Data Sources

By considering the time series data from 1990 to 2018, the researchers looked at the relationship between renewable energy, income inequality, and degradation of environment in Pakistan. The time period from 1990 to 2018 is based on the availability of data. As in earlier research, CO2 was employed as a proxy for environmental deterioration as well as a dependent variable. On the other hand, the Gini coefficient is employed as a substitution for income disparity. For further details, look at Table 1.

4. Empirical Outcomes and Discussion

4.1. Stationarity Procedure

The unit root test is important, earlier confirming the co-integration test between the variables.
It shows the level of stationarity. To confirm stationarity among variables, different unit root tests, i.e., Augmented Dickey–Fuller (ADF), Dickey & Fuller, 1979, (Phillips & Perron, 1988) applied. The results of the stationarity test summarized in Table 2 demonstrate that all variables are stable at a first variance and none of the factors are incorporated at order 2, indicating that the ARDL bound testing approach [107] is adequate for this investigation.

4.2. Bound Testing Approach

Before long and short run assessment, it is essential to ascertain co-integration among the under-consideration variables. For this purpose, we performed bound testing approach. Outcomes of the bound testing method and other investigative tests reported in Table 3 confirmed the variables co-integration. So, the hypothesis was rejected for all of the equations.

4.3. Verification of Cointegration

To catch the existence of co-integration among the variables, we have used Johnson’s co-integration approach. The Eigen value and trace statistic showed the presence of co-integration among the variables. Rendering the rules, if the probability value is more than 0.05 then the null hypothesis will be conclusive, and if its value is below the range of 0.05 then the null hypothesis will be rejected. The estimated results of trace statistics concluded in Table 4 confirmed three co-integrations and two no co-integration relationships, while max-eigen statistic demonstrates two co-integrations relationship and three no co-integration relation. Next after the confirmation of no co-integration, we have to follow vector error-correction model.

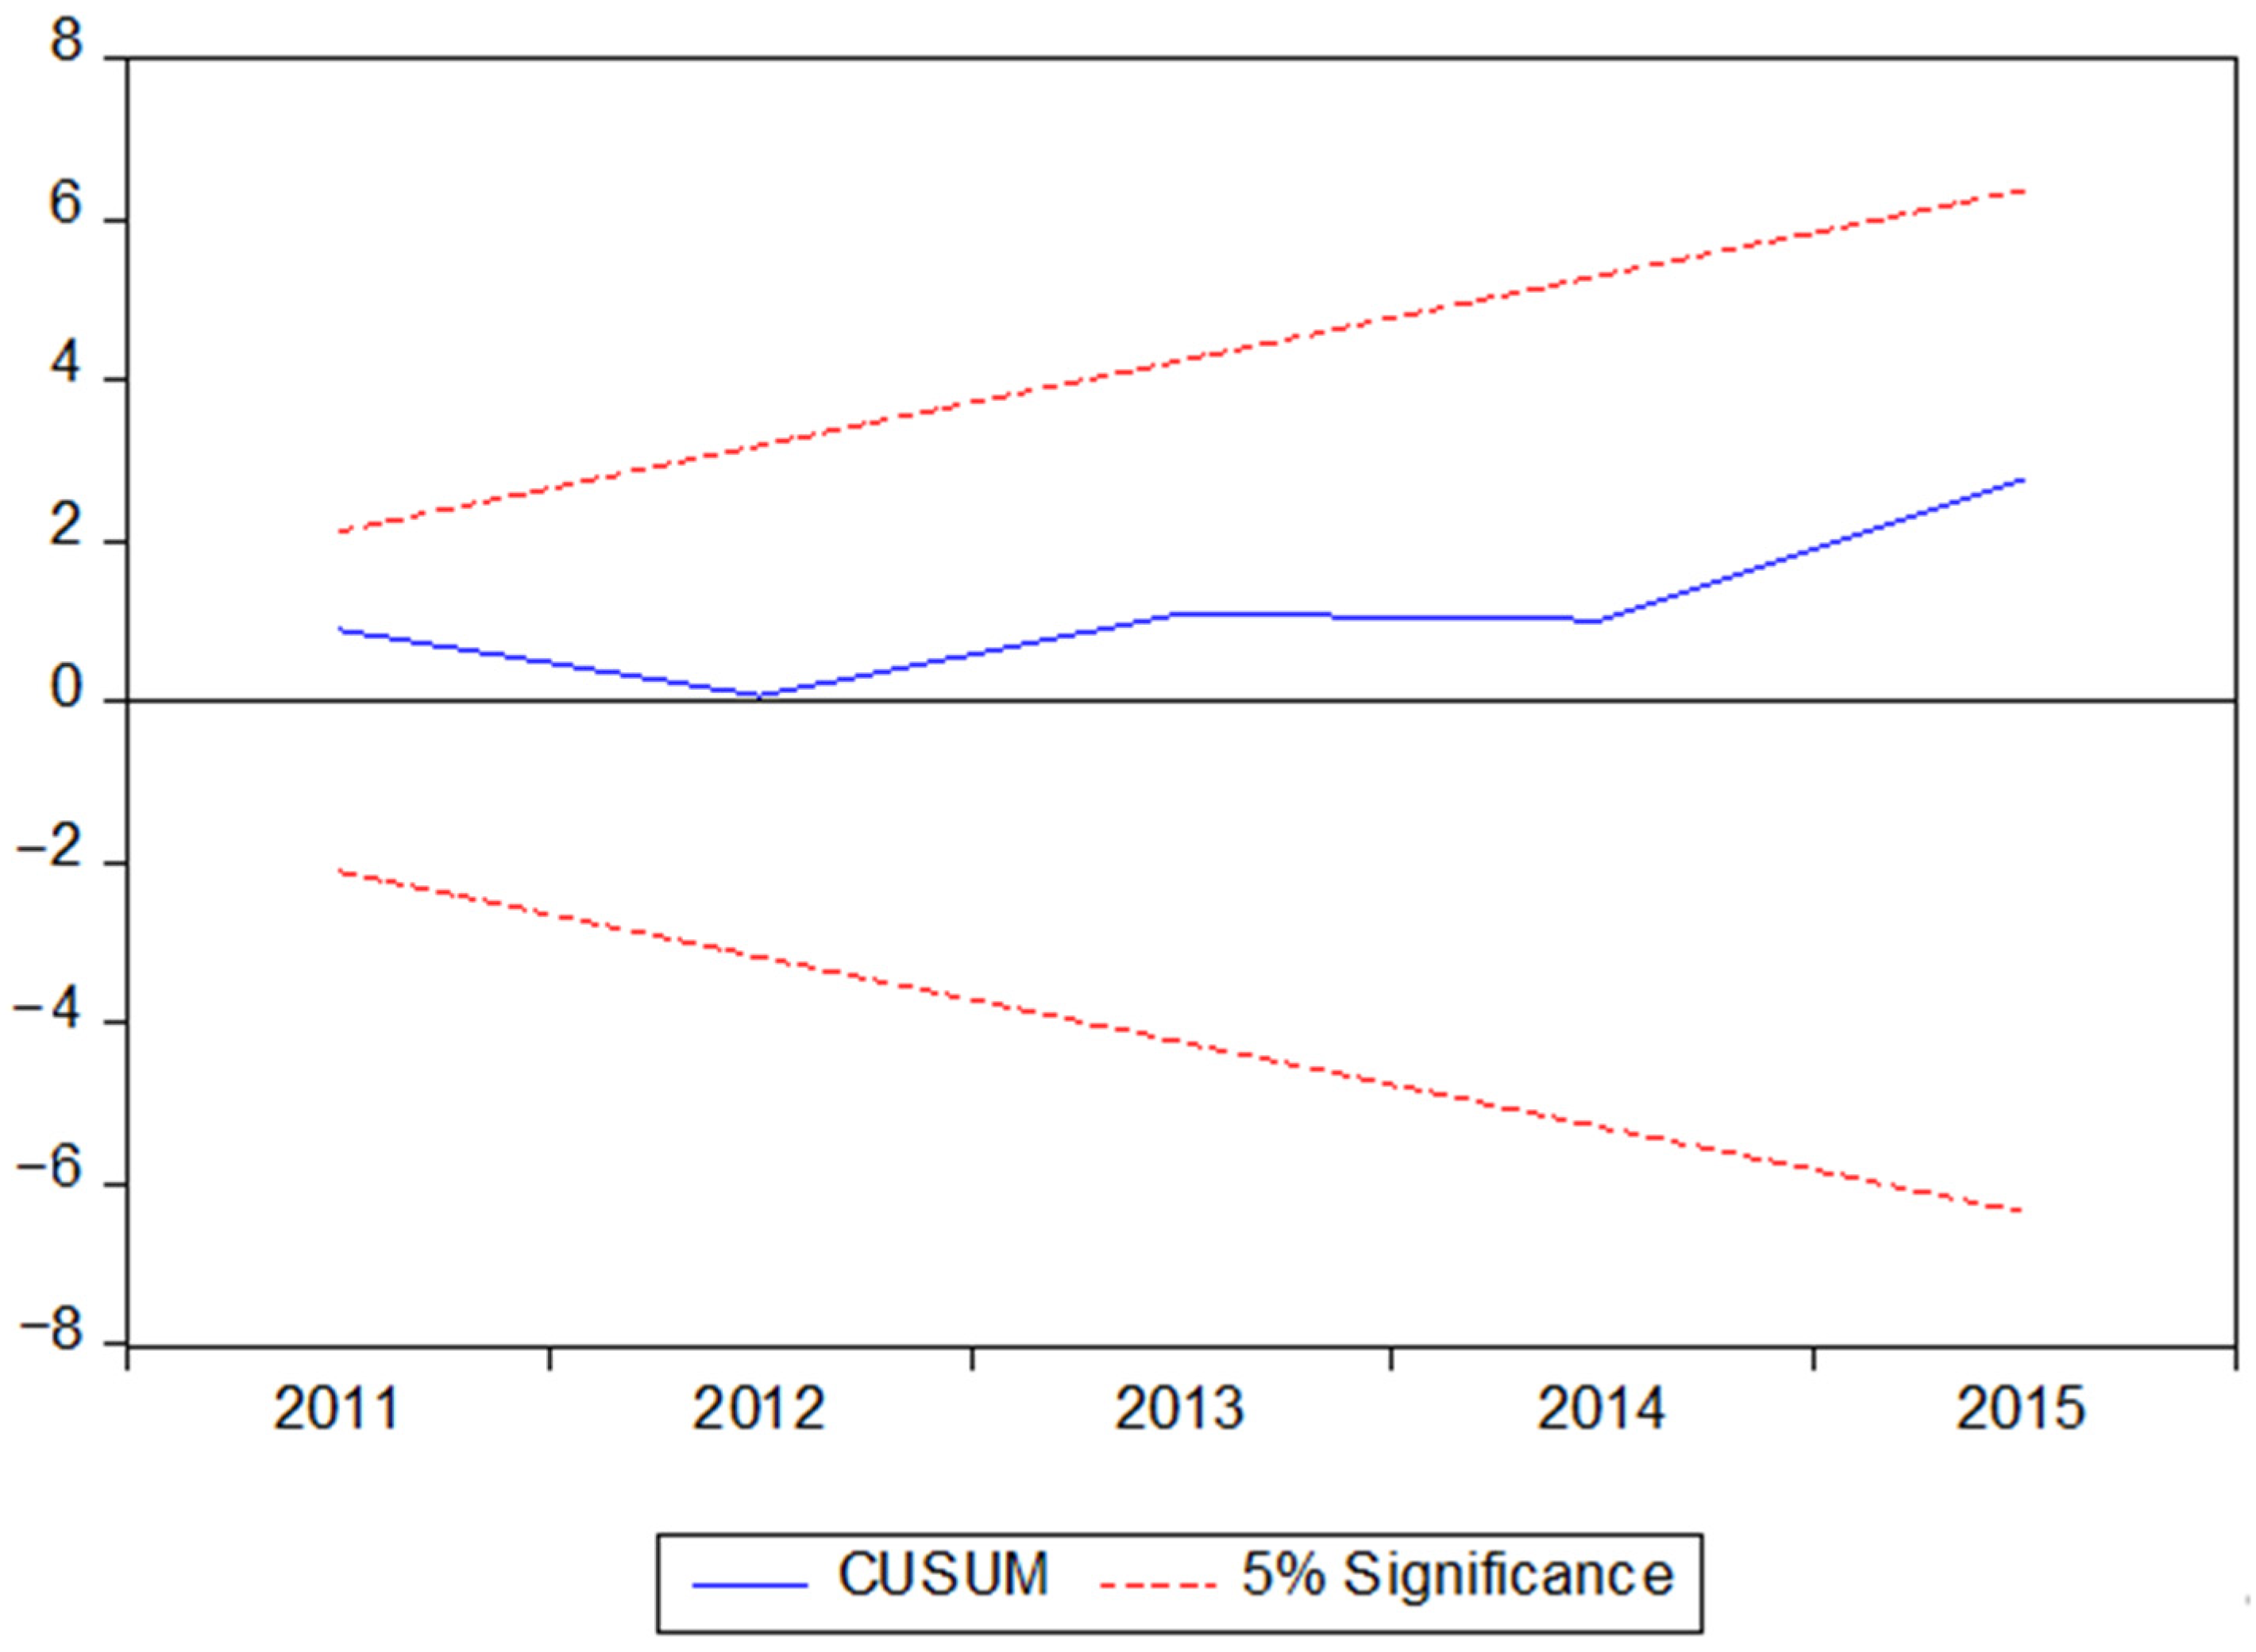
4.4. Long-Run and Short-Run Estimates

We utilized the ARDL model to determine the short and long run coefficients after establishing the co-integration of the variables, which is the most essential component of the study. All of the research variables are transformed into logarithmic form and the long and short run estimation results are reported in Table 5. Financial development, income inequality, and renewable energy all have a detrimental impact on the environment that is statistically significant. Natural resources, at the other side, have an important and beneficial influence on the degradation of the environment.
I.
The drive of this empirical study was to look at the link between financial development, income inequality, renewable energy, and degradation of the environment.
II.
The model’s dependent variable is carbon emissions, whereas the independent variables are renewable energy, income inequality, and financial development. We validated that no variable was integrated at order 2 before implementing the ARDL bound testing methodology. Following that, we used an inferred bound testing strategy to confirm the long run association using the F-statistic. Also, the outcomes indicate that the variables were co-integrated. Finally, the ARDL methodology was used to interpret the short and long run estimate. Table 5 demonstrates the estimated outcomes of the short and long run estimates.
III.
The estimated coefficient value of financial growth indicates a negative and important link with CO2 emissions. According to the findings, increasing financial development by 1% reduces carbon dioxide emissions by 0.057%.
According to the findings of this study, financial development may be the best solution for minimizing environmental deterioration due to its long-term and short-term influence on CO2 emissions. Environmental degradation will be reduced if the Pakistani government continues to grant financing to green energy investment projects. Financial development may aid in the adoption of new environmentally friendly technology, which can be accomplished through the backing of national credit to Pakistan’s private sector. It is a method of increasing capitalization, technology, and income impact. The findings are consistent with previous research [30,33,114,115,116,117,118,119,120,121].
Here is a significant and negative association between income inequality and environmental degradation. The results reported in Table 5 show that, if income inequality raises by 1%, carbon dioxide emissions decrease by 2.29800%.
The reasons for the antagonistic relation between income inequality and CO2 emissions is a long trade-off and the existence of the marginal propensity to emit (MPE) hypothesis between these two variables. As Pakistan is at a development stage in which different industries have different intensity levels of emissions, trying to shift from agriculture to heavy industrial phase, the result is increased emissions, while at the future stage of development, there will be a shift from higher industrial to a services industrial sector, which will have a decrease in the emission rate. Similarly, the same results were also investigated by [26] for OECD (Organization for Economic Co-operation and Development) nations and [51] for China they suggested that to improve the income equality by increasing the income level of poor people will increase the energy and CO2 emissions. Another cause for the negative link between income inequality and CO2 emissions is reducing economic development disparity. Reducing income inequality in the developing countries will raise CO2 emissions due to secondary industries. These outcomes are maintained by the work of [8,51,122,123,124,125].
The coefficient value of renewable energy indicates that energy has an important negative relation with environmental degradation. The derived results show that 1% raise in renewable energy causes 2.873368% decrease in CO2 emissions.
The outcomes shown in Table 5 verify that usage of renewable energy is a vital substitute to reduce CO2 emissions and can be reproduced using the existing resources. The use of renewable energy sources like solar energy, biomass energy, geothermal energy, wind, and hydropower energy can reduce the negative environmental impacts because they have less CO2 emissions than other energy sources. Our results are supported by the studies of [125,126,127,128,129,130]. Heavy investment in environmentally friendly technologies can make the production process effective and clean. The government should support R&D activities to promote renewable energy and foreign investment to develop renewable energy systems.
Furthermore, the coefficient significance of natural resource is 0.056812, suggesting positive and significant relation with environmental degradation in the long run. The reported results indicate that 1% rise in the depletion of natural resources leads to 0.056812% upsurge in CO2 emissions. The coefficient significance of the natural resources is −0.177473 in the short run. As the natural resources are considered the basic ingredients for the growth and development of a region [131]
At the initial stages of growth and development, the region depends on the consummation of natural resources, and later the demand for good air starts [132]. The same results were also identified by [133].
This result is consistent with the outcomes of previous research [26,55,134,135]. Natural resources have an optimistic association with the environmental degradation, which indicates that increasing natural resource extraction and unsustainable use results in increased CO2 emissions in Pakistan. Traditional methods of utilizing natural resources, as well as reliance on fossil fuels, have increased environmental stress. Due to irresponsible usage and a low percentage of renewable energy, Pakistan’s natural resources are not ecologically friendly. To alleviate environmental deterioration, the Pakistani government should take steps to ensure the sustainable practice of natural resources, reduce reliance on fossil fuels, increase R&D budget allocation for natural resource exploitation, and investigate renewable energy sources. This research is also consistent with [19,136,137].
In addition, the autoregressive conditional heteroscedasticity (ARCH), Lagrange Multiplier (LM), regression specification error test and RAMSEY diagnostic tests were used to establish the absenteeism of autocorrelation and heteroscedasticity, as shown in Table 5. Furthermore, cumulative sum (CUSUM) and cumulative sum of squares (CUSUMsq) approaches are employed to ensure the model’s stability represented in Equation (1) The results of CUSUM and CUSUMsq are illustrated in Figure 1 and Figure 2, indicating that the model is deep-rooted and will be utilized for beneficial policy implications, while the trend of variables are represented in Figure 3.

4.5. Granger Causality Results

The ARDL estimations give long run and short run outcomes but do not provide information about the route of causality. Therefore, to determine the direction of causality between the variables, we applied the vector error-correction model (VECM) Granger causality approach. The causality test is conducted. The results reported in Table 6 show long run causality between financial development and renewable energy. In short run, unidirectional causality is detected among financial growth and carbon emission, natural resources and financial development, and among natural resources and renewable energy. For practical policy implication, Granger causality is important.

5. Conclusions

This study aims to determine the linkage between financial development, renewable energy, income inequality, natural resources and environmental degradation, and to attain environmental sustainability in Pakistan. For this purpose, we analyzed the nexus between natural resources, income inequality, financial development, renewable energy, and environmental degradation for the period 1990 to 2018. To measure the long run association between the variables, ARDL bound testing approach was applied. Lastly, several diagnostic techniques, i.e., RAMSEY, LM, and ARCH, were employed. Financial development, income inequality, and renewable energy have negative and significant association with carbon emission. Natural resources have an optimistic and important association with environmental degradation. Renewable energy and financial development have bidirectional causality.

6. Policy Suggestions

As resulted, income inequality negatively impacts environmental degradation, so fairer income distribution reduces the CO2 emissions by decreasing the economic concern of individuals, which can raise the demands for an excellent environment. The reasonable income distribution decreases individuality and increases collective consciousness, which is an essential feature in supporting quality environmental awareness. The reduction in income inequality through more equitable income distribution can balance political power distribution, while the decay in the power of higher-ups and elite groups will avert the slackening of environmental protective cover policies. The pressure group of conventional energy corporations can be reduced through fairer income distribution and power, which can influence the policymakers. Thus, the policies should be shaped according to the standards which become more sensitive about environmental degradation. Income inequality can be reduced through proper campaigns and awareness in the low-level income population where the excessive emissions from various activities, such as the burning of fossil fuels and cutting of forests, lead to environmental degradation. The government should establish fair income distribution systems. In addition, the government can reduce income inequality by investing in human capital and infrastructure effectively.
Renewable energy has negatively and significantly been associated with the CO2 emission. These results suggest that government officials promote sustainable energy production through incentives such as tax breaks and banking services. Due to the negative impact, the government should allocate more budget for research and development in such a move to boost the utilization of renewable energy sources. The increasing CO2 emissions can be minimized with the renewable energy resources. A set of regulations and legislations for the use of sustainable power in its manufacturing and utilization (solar, tide, wind, hydropower, geothermal, etc.) is necessary for green development. Foreign investors should be encouraged to invest in clean and green technologies through strengthening relations with the developed and clean energy production countries. The government of Pakistan needs to make their environmental policies stricter and compel enterprises to use green energy sources and sustainable practices. Pakistan has copious renewable energy resources, but investment must make it a source to combat environmental degradation.
Natural resources have a negative impact on environmental degradation. Possible measures should be taken to ensure the sustainable use of natural resources and minimize the utilization of natural resources. To control natural resource abstraction and promote environmental quality, it is important to educate the population regarding environmentally friendly products and reduce the extreme deforestation and destruction of the land. Policymakers should focus on technology advancement and proper use of natural resources because, currently, it is used in backward and non-optimal ways. To deal with energy generation companies, policymakers should pay attention to natural resources.

7. Future Research Directions

The study was conducted on the limited availability of data, so it excluded some determinants of environmental degradation. Future research may look at industrialization and globalization, socioeconomic, demographic, agriculture, forest, land use and energy consumption, water productivity, value-added agriculture services, and environmental regulations. In addition, this study analyzed CO2 as a dependent variable, so future research may analyze carbon footprint, PM2.5 emissions, ecological footprint, and health expenditure as a dependent variable. Similarly, different inequality indicators, wealth inequality, wage inequality, and top 1% of income earners can be studied as independent variables with environmental degradation. Moreover, the existence of EKC hypotheses for the same variables will also contribute to the literature and policy implications.

Author Contributions

Y.W., I.U. and Y.G., all the authors have equal contributions in this study. All authors were actively involved in the conceptualization, methodology, formal analysis, validation, and data curation. Moreover I.U. has written the original draft and Y.W. did the review and editing. All authors have read and agreed to the published version of the manuscript.

Funding

This study is funded by Kunming University of Science and Technology, Kunming, China.

Institutional Review Board Statement

This study has already been approved by departmental research committee of Kunming University of Science and Technology, Kunming, China.

Informed Consent Statement

Not applicable.

Data Availability Statement

Can be retrieved from World Bank, World Inequality Data Base and OECD.

Acknowledgments

The authors are thankful to the reviewers for their valuable suggestions, which improve the quality of this study.

Conflicts of Interest

The authors declare no conflict of interest.

References

  1. Wolde-Rufael, Y.; Idowu, S. Income distribution and CO2 emission: A comparative analysis for China and India. Renew. Sustain. Energy Rev. 2017, 74, 1336–1345. [Google Scholar] [CrossRef]
  2. Jorgenson, A.K.; Schor, J.B.; Knight, K.W.; Huang, X. Domestic Inequality and Carbon Emissions in Comparative Perspective. Sociol. Forum 2016, 31, 770–786. [Google Scholar] [CrossRef]
  3. Uzar, U. Is income inequality a driver for renewable energy consumption? J. Clean. Prod. 2020, 255, 120287. [Google Scholar] [CrossRef]
  4. Boyce, J.K. Economics Inequality as a Cause of Environmental Degradation—Marginal Marginal Losers Level of Environmental Degradation. Ecol. Econ. 1994, 11, 169–178. [Google Scholar] [CrossRef] [Green Version]
  5. Torras, M.; Boyce, J.K. Income, inequality, and pollution: A reassessment of the environmental Kuznets Curve. Ecol. Econ. 1998, 25, 147–160. [Google Scholar] [CrossRef]
  6. Uzar, U.; Eyuboglu, K. The nexus between income inequality and CO2 emissions in Turkey. J. Clean. Prod. 2019, 227, 149–157. [Google Scholar] [CrossRef]
  7. Scruggs, L.A. Political and Economic Inequality and the Environment. Ecol. Econ. 1998, 26, 259–275. [Google Scholar] [CrossRef]
  8. Grunewald, N.; Klasen, S.; Martínez-Zarzoso, I.; Muris, C. The Trade-off Between Income Inequality and Carbon Dioxide Emissions. Ecol. Econ. 2017, 142, 249–256. [Google Scholar] [CrossRef] [Green Version]
  9. Baloch, M.A.; Danish; Khan, S.U.-D.; Ulucak, Z.Ş.; Ahmad, A. Analyzing the relationship between poverty, income inequality, and CO2 emission in Sub-Saharan African countries. Sci. Total. Environ. 2020, 740, 139867. [Google Scholar] [CrossRef]
  10. United Nations. The Sustainable Development Goals Report 2019; United Nations: New York, NY, USA, 2019. [Google Scholar]
  11. Liu, C.; Jiang, Y.; Xie, R. Does income inequality facilitate carbon emission reduction in the US? J. Clean. Prod. 2019, 217, 380–387. [Google Scholar] [CrossRef]
  12. Ding, Q.; Khattak, S.I.; Ahmad, M. Towards sustainable production and consumption: Assessing the impact of energy productivity and eco-innovation on consumption-based carbon dioxide emissions (CCO2) in G-7 nations. Sustain. Prod. Consum. 2021, 27, 254–268. [Google Scholar] [CrossRef]
  13. Hallegatte, S.; Rozenberg, J. Climate change through a poverty lens. Nat. Clim. Chang. 2017, 7, 250–256. [Google Scholar] [CrossRef]
  14. Padhan, H.; Haouas, I.; Sahoo, B.; Heshmati, A. What matters for environmental quality in the Next Eleven Countries: Economic growth or income inequality? Environ. Sci. Pollut. Res. 2019, 26, 23129–23148. [Google Scholar] [CrossRef]
  15. Ruhe, C.W. Statistical Review. JAMA 1973, 225, 299–306. [Google Scholar] [CrossRef]
  16. United Nations. United Nations Climate Action Summit 2019; United Nations: New York, NY, USA, 2019. [Google Scholar]
  17. Burke, M.J.; Stephens, J. Political power and renewable energy futures: A critical review. Energy Res. Soc. Sci. 2018, 35, 78–93. [Google Scholar] [CrossRef]
  18. Rafindadi, A.A.; Usman, O. Globalization, energy use, and environmental degradation in South Africa: Startling empirical evidence from the Maki-cointegration test. J. Environ. Manag. 2019, 244, 265–275. [Google Scholar] [CrossRef] [PubMed]
  19. Sarkodie, S.A. The invisible hand and EKC hypothesis: What are the drivers of environmental degradation and pollution in Africa? Environ. Sci. Pollut. Res. 2018, 25, 21993–22022. [Google Scholar] [CrossRef]
  20. Ahmad, M.; Jiang, P.; Majeed, A.; Raza, M.Y. Does financial development and foreign direct investment improve environmental quality? Evidence from belt and road countries. Environ. Sci. Pollut. Res. 2020, 27, 23586–23601. [Google Scholar] [CrossRef]
  21. Seetanah, B.; Sannassee, R.V.; Fauzel, S.; Soobaruth, Y.; Giudici, G.; Nguyen, A.P.H. Impact of Economic and Financial Development on Environmental Degradation: Evidence from Small Island Developing States (SIDS). Emerg. Mark. Financ. Trade 2018, 55, 308–322. [Google Scholar] [CrossRef]
  22. Shahbaz, M.; Nasir, M.A.; Roubaud, D. Environmental degradation in France: The effects of FDI, financial development, and energy innovations. Energy Econ. 2018, 74, 843–857. [Google Scholar] [CrossRef] [Green Version]
  23. Charfeddine, L.; Kahia, M. Impact of renewable energy consumption and financial development on CO2 emissions and economic growth in the MENA region: A panel vector autoregressive (PVAR) analysis. Renew. Energy 2019, 139, 198–213. [Google Scholar] [CrossRef]
  24. Tamazian, A.; Chousa, J.P.; Vadlamannati, K.C. Does higher economic and financial development lead to environmental degradation: Evidence from BRIC countries. Energy Policy 2009, 37, 246–253. [Google Scholar] [CrossRef]
  25. Shahbaz, M.; Raghutla, C.; Song, M.; Zameer, H.; Jiao, Z. Public-private partnerships investment in energy as new determinant of CO2 emissions: The role of technological innovations in China. Energy Econ. 2020, 86, 104664. [Google Scholar] [CrossRef] [Green Version]
  26. Hassan, S.T.; Xia, E.; Huang, J.; Khan, N.H.; Iqbal, K. Natural resources, globalization, and economic growth: Evidence from Pakistan. Environ. Sci. Pollut. Res. 2019, 26, 15527–15534. [Google Scholar] [CrossRef]
  27. Latif, Z.; Xin, W.; Khan, D.; Iqbal, K.; Pathan, Z.H.; Salam, S.; Jan, N. ICT and sustainable development in South Asian countries. Hum. Syst. Manag. 2017, 36, 353–362. [Google Scholar] [CrossRef]
  28. Goss, R.M. BP Statistical Review of World Energy 1982. BP Stat. Rev. World Energy 1983, 1–69. [Google Scholar]
  29. Shao, Y. Does FDI affect carbon intensity? New evidence from dynamic panel analysis. Int. J. Clim. Chang. Strat. Manag. 2018, 10, 27–42. [Google Scholar] [CrossRef]
  30. Shahbaz, M.; Naeem, M.; Ahad, M.; Tahir, I. Is natural resource abundance a stimulus for financial development in the USA? Resour. Policy 2018, 55, 223–232. [Google Scholar] [CrossRef]
  31. Lin, F. Trade openness and air pollution: City-level empirical evidence from China. China Econ. Rev. 2017, 45, 78–88. [Google Scholar] [CrossRef]
  32. Xu, Z.; Baloch, M.A.; Danish; Meng, F.; Zhang, J.; Mahmood, Z. Nexus between financial development and CO2 emissions in Saudi Arabia: Analyzing the role of globalization. Environ. Sci. Pollut. Res. 2018, 25, 28378–28390. [Google Scholar] [CrossRef]
  33. Huang, L.; Zhao, X. Impact of financial development on trade-embodied carbon dioxide emissions: Evidence from 30 provinces in China. J. Clean. Prod. 2018, 198, 721–736. [Google Scholar] [CrossRef]
  34. Xiong, L.; Tu, Z.; Ju, L. Reconciling Regional Differences in Financial Development and Carbon Emissions: A Dynamic Panel Data Approach. Energy Procedia 2017, 105, 2989–2995. [Google Scholar] [CrossRef]
  35. Zhang, Y.; Zhang, S. The impacts of GDP, trade structure, exchange rate and FDI inflows on China’s carbon emissions. Energy Policy 2018, 120, 347–353. [Google Scholar] [CrossRef]
  36. Talaei, A.; Pier, D.; Iyer, A.V.; Ahiduzzaman, M.; Kumar, A. Assessment of long-term energy efficiency improvement and greenhouse gas emissions mitigation options for the cement industry. Energy 2019, 170, 1051–1066. [Google Scholar] [CrossRef]
  37. Saud, S.; Danish; Chen, S. An empirical analysis of financial development and energy demand: Establishing the role of globalization. Environ. Sci. Pollut. Res. 2018, 25, 24326–24337. [Google Scholar] [CrossRef] [PubMed]
  38. Wang, L.; Vo, X.V.; Shahbaz, M.; Ak, A. Globalization and carbon emissions: Is there any role of agriculture value-added, financial development, and natural resource rent in the aftermath of COP21? J. Environ. Manag. 2020, 268, 110712. [Google Scholar] [CrossRef]
  39. Saud, S.; Chen, S.; Danish; Haseeb, A. Impact of financial development and economic growth on environmental quality: An empirical analysis from Belt and Road Initiative (BRI) countries. Environ. Sci. Pollut. Res. 2019, 26, 2253–2269. [Google Scholar] [CrossRef] [PubMed]
  40. He, Q. Fiscal decentralization and environmental pollution: Evidence from Chinese panel data. China Econ. Rev. 2015, 36, 86–100. [Google Scholar] [CrossRef]
  41. Ding, T.; Ning, Y.; Zhang, Y. The contribution of China’s bilateral trade to global carbon emissions in the context of globalization. Struct. Chang. Econ. Dyn. 2018, 46, 78–88. [Google Scholar] [CrossRef]
  42. Li, J.; Zhang, X.; Ali, S.; Khan, Z. Eco-innovation and energy productivity: New determinants of renewable energy consumption. J. Environ. Manag. 2020, 271, 111028. [Google Scholar] [CrossRef] [PubMed]
  43. Danish; Ulucak, R.; Khan, S.U.-D. Determinants of the ecological footprint: Role of renewable energy, natural resources, and urbanization. Sustain. Cities Soc. 2020, 54, 101996. [Google Scholar] [CrossRef]
  44. Alola, A.A.; Yalçiner, K.; Alola, U.V.; Akadiri, S.S. The role of renewable energy, immigration and real income in environmental sustainability target. Evidence from Europe largest states. Sci. Total. Environ. 2019, 674, 307–315. [Google Scholar] [CrossRef]
  45. Nguyen, K.H.; Kakinaka, M. Renewable energy consumption, carbon emissions, and development stages: Some evidence from panel cointegration analysis. Renew. Energy 2019, 132, 1049–1057. [Google Scholar] [CrossRef]
  46. Destek, M.A.; Sarkodie, S.A. Investigation of environmental Kuznets curve for ecological footprint: The role of energy and financial development. Sci. Total. Environ. 2019, 650, 2483–2489. [Google Scholar] [CrossRef] [PubMed]
  47. Baloch, M.A.; Zhang, J.; Iqbal, K.; Iqbal, Z. The effect of financial development on ecological footprint in BRI countries: Evidence from panel data estimation. Environ. Sci. Pollut. Res. 2019, 26, 6199–6208. [Google Scholar] [CrossRef]
  48. Dogan, E.; Taspinar, N.; Gokmenoglu, K.K. Determinants of ecological footprint in MINT countries. Energy Environ. 2019, 30, 1065–1086. [Google Scholar] [CrossRef]
  49. Bello, M.O.; Solarin, S.A.; Yen, Y.Y. The impact of electricity consumption on CO 2 emission, carbon footprint, water footprint and ecological footprint: The role of hydropower in an emerging economy. J. Environ. Manag. 2018, 219, 218–230. [Google Scholar] [CrossRef] [PubMed]
  50. Destek, M.A.; Ulucak, R.; Dogan, E. Analyzing the environmental Kuznets curve for the EU countries: The role of ecological footprint. Environ. Sci. Pollut. Res. Int. 2018, 25, 29387–29396. [Google Scholar] [CrossRef] [PubMed]
  51. Lorente, D.B.; Shahbaz, M.; Roubaud, D.; Farhani, S. How economic growth, renewable electricity and natural resources contribute to CO2 emissions? Energy Policy 2018, 113, 356–367. [Google Scholar] [CrossRef] [Green Version]
  52. Solarin, S.A.; Al-Mulali, U. Influence of foreign direct investment on indicators of environmental degradation. Environ. Sci. Pollut. Res. 2018, 25, 24845–24859. [Google Scholar] [CrossRef] [PubMed]
  53. Hassan, S.T.; Xia, E.; Lee, C.-C. Mitigation pathways impact of climate change and improving sustainable development: The roles of natural resources, income, and CO2 emission. Energy Environ. 2021, 32, 338–363. [Google Scholar] [CrossRef]
  54. Akhter, W.; Zaman, K.; Nassani, A.A.; Abro, M.M.Q. Nexus between natural and technical disaster shocks, resource depletion and growth-specific factors: Evidence from quantile regression. Nat. Hazards 2020, 104, 1–27. [Google Scholar] [CrossRef]
  55. Danish; Baloch, M.A.; Mahmood, N.; Zhang, J.W. Effect of natural resources, renewable energy and economic development on CO2 emissions in BRICS countries. Sci. Total. Environ. 2019, 678, 632–638. [Google Scholar] [CrossRef] [PubMed]
  56. Guo, Y.; You, W.; Lee, C. Research in environmental governance and innovation CO 2 Emissions, Income Inequality, and Country Risk: Some International Evidence. Environ. Sci. Pollut. Res. 2020. [Google Scholar] [CrossRef]
  57. Hailemariam, A.; Dzhumashev, R.; Shahbaz, M. Carbon emissions, income inequality and economic development. Empir. Econ. 2019, 59, 1139–1159. [Google Scholar] [CrossRef]
  58. Ravallion, B.M.; Heil, M.; Jalan, J. Carbon Emissions and Income Inequality. Oxf. Econ. Pap. 2000, 52, 651–669. [Google Scholar] [CrossRef]
  59. Gassebner, M.; Gaston, N.; Lamla, M.J. Relief for the environment? The importance of an increasingly unimportant industrial sector. Econ. Inq. 2008, 46, 160–178. [Google Scholar] [CrossRef]
  60. Hao, Y.; Chen, H.; Zhang, Q. Will income inequality affect environmental quality? Analysis based on China’s provincial panel data. Ecol. Indic. 2016, 67, 533–542. [Google Scholar] [CrossRef]
  61. Greiner, P.T.; McGee, J.A. Divergent Pathways on the Road to Sustainability: A Multilevel Model of the Effects of Geopolitical Power on the Relationship between Economic Growth and Environmental Quality. Socius Sociol. Res. Dyn. World 2018, 4. [Google Scholar] [CrossRef] [Green Version]
  62. Abbas, S.; Kousar, S.; Yaseen, M.; Mayo, Z.A.; Zainab, M.; Mahmood, M.J.; Raza, H. Impact assessment of socioeconomic factors on dimensions of environmental degradation in Pakistan. SN Appl. Sci. 2020, 2, 1–16. [Google Scholar] [CrossRef] [Green Version]
  63. Global Health Workforce Alliance. Country Case Study Pakistan’s Lady Health Worker Programme GHWA Task Force on Scaling Up Education and Training for Health Workers; WHO: Geneva, Switzerland, 2008. [Google Scholar]
  64. Ohlsson, L. Livelihood Conflicts: Linking Poverty and Environment as Causes of Conflict; Swedish International Development Cooperation Agency: Stockholm, Sweden, 2000. [Google Scholar]
  65. Ullah, W. Climate Change Vulnerability of Pakistan Towards Natural Disasters: A Review. Int. J. Environ. Prot. Policy 2016, 4, 126. [Google Scholar] [CrossRef] [Green Version]
  66. Bayer, C.; Hanck, C. Combining non-cointegration tests. J. Time Ser. Anal. 2013, 34, 83–95. [Google Scholar] [CrossRef]
  67. Bayramov, A. Review: Dubious nexus between natural resources and conflict. J. Eurasian Stud. 2018, 9, 72–81. [Google Scholar] [CrossRef]
  68. Zhang, X.; Wu, L.; Zhang, R.; Deng, S.; Zhang, Y.; Wu, J.; Li, Y.; Lin, X.; Li, L.; Wang, Y.; et al. Evaluating the relationships among economic growth, energy consumption, air emissions and air environmental protection investment in China. Renew. Sustain. Energy Rev. 2013, 18, 259–270. [Google Scholar] [CrossRef]
  69. Litovitz, A.; Curtright, A.; Abramzon, S.; Burger, N.; Samaras, C. Estimation of regional air-quality damages from Marcellus Shale natural gas extraction in Pennsylvania. Environ. Res. Lett. 2013, 8, 014017. [Google Scholar] [CrossRef]
  70. Lee, T.; van de Meene, S. Comparative studies of urban climate co-benefits in Asian cities: An analysis of relationships between CO2 emissions and environmental indicators. J. Clean. Prod. 2013, 58, 15–24. [Google Scholar] [CrossRef]
  71. Arent, D.; Pless, J.; Mai, T.; Wiser, R.; Hand, M.; Baldwin, S.; Heath, G.; Macknick, J.; Bazilian, M.; Schlosser, A.; et al. Implications of high renewable electricity penetration in the U.S. for water use, greenhouse gas emissions, land-use, and materials supply. Appl. Energy 2014, 123, 368–377. [Google Scholar] [CrossRef]
  72. Mudakkar, S.R.; Zaman, K.; Khan, M.M.; Ahmad, M. Energy for economic growth, industrialization, environment and natural resources: Living with just enough. Renew. Sustain. Energy Rev. 2013, 25, 580–595. [Google Scholar] [CrossRef]
  73. Chen, Y.; Lee, C.-C. Does technological innovation reduce CO2 emissions?Cross-country evidence. J. Clean. Prod. 2020, 263, 121550. [Google Scholar] [CrossRef]
  74. Sarkodie, S.A.; Ozturk, I. Investigating the Environmental Kuznets Curve hypothesis in Kenya: A multivariate analysis. Renew. Sustain. Energy Rev. 2020, 117, 109481. [Google Scholar] [CrossRef]
  75. Chen, Y.; Lee, C.-C. The impact of real estate investment on air quality: Evidence from China. Environ. Sci. Pollut. Res. 2020, 27, 22989–23001. [Google Scholar] [CrossRef]
  76. Ray, D.; Baland, J.; Dagnelie, O. Inequality and Inefficiency in Joint Projects. Econ. J. 2007, 117, 922–935. [Google Scholar] [CrossRef] [Green Version]
  77. Schor, J. Time, Labour and Consumption: Guest Editor’s Introduction. Time Soc. 1998, 7, 119–127. [Google Scholar] [CrossRef]
  78. Cushing, L.; Morello-Frosch, R.; Wander, M.; Pastor, M. The Haves, the Have-Nots, and the Health of Everyone: The Relationship Between Social Inequality and Environmental Quality. Annu. Rev. Public Health 2015, 36, 193–209. [Google Scholar] [CrossRef] [Green Version]
  79. He, J.; Makdissi, P.; Wodon, Q.; He, J.; Makdissi, P.; Wodon, Q. Corruption, Inequality, and Environmental Regulation; Departement d’Economique de l’École de Gestion à l’Université de Sherbrooke: Sherbrooke, QC, Canada, 2017. [Google Scholar]
  80. Bae, J.H. Impacts of Income Inequality on CO 2 Emission under Different Climate Change Mitigation Policies. Korean Econ. Rev. 2018, 34, 187–211. [Google Scholar]
  81. Gorus, M.S.; Aslan, M. Impacts of economic indicators on environmental degradation: Evidence from MENA countries. Renew. Sustain. Energy Rev. 2019, 103, 259–268. [Google Scholar] [CrossRef]
  82. Abdulla, A.; Vaishnav, P.; Sergi, B.; Victor, D. Limits to deployment of nuclear power for decarbonization: Insights from public opinion. Energy Policy 2019, 129, 1339–1346. [Google Scholar] [CrossRef]
  83. Nathaniel, S.; Nathaniel, S. Ecological Footprint, Urbanization, and Energy Consumption in South Africa: Including the Excluded. Environ. Sci. Pollut. Res. 2019, 26, 27168–27179. [Google Scholar] [CrossRef] [PubMed]
  84. De Souza, E.S.; Freire, F.; Pires, J. Determinants of CO2 emissions in the MERCOSUR: The role of economic growth, and renewable and non-renewable energy. Environ. Sci. Pollut. Res. 2018, 25, 20769–20781. [Google Scholar] [CrossRef] [PubMed]
  85. Dinç, D.T.; Akdoğan, E.C. Renewable Energy Production, Energy Consumption and Sustainable Economic Growth in Turkey: A VECM Approach. Sustainability 2019, 11, 1273. [Google Scholar] [CrossRef] [Green Version]
  86. Kahia, M.; Ben Jebli, M.; Belloumi, M. Analysis of the impact of renewable energy consumption and economic growth on carbon dioxide emissions in 12 MENA countries. Clean Technol. Environ. Policy 2019, 21, 871–885. [Google Scholar] [CrossRef]
  87. Yazdi, S.K.; Beygi, E.G. The dynamic impact of renewable energy consumption and financial development on CO2emissions: For selected African countries. Energy Sources Part B Econ. Plan. Policy 2017, 13, 13–20. [Google Scholar] [CrossRef]
  88. Riti, J.S.; Shu, Y. Renewable energy, energy efficiency, and eco-friendly environment (R-E5) in Nigeria. Energy Sustain. Soc. 2016, 6, 1. [Google Scholar] [CrossRef] [Green Version]
  89. Hanif, I.; Raza, S.M.F.; de Santos, P.G.-; Abbas, Q. Fossil fuels, foreign direct investment, and economic growth have triggered CO2 emissions in emerging Asian economies: Some empirical evidence. Energy 2019, 171, 493–501. [Google Scholar] [CrossRef]
  90. Nathaniel, S.; Anyanwu, O.; Shah, M.I. Renewable energy, urbanization, and ecological footprint in the Middle East and North Africa region. Environ. Sci. Pollut. Res. 2020, 27, 14601–14613. [Google Scholar] [CrossRef] [PubMed]
  91. Danish; Ulucak, R. How do environmental technologies affect green growth? Evidence from BRICS economies. Sci. Total. Environ. 2020, 712, 136504. [Google Scholar] [CrossRef] [PubMed]
  92. Ibrahiem, D.M. Do technological innovations and financial development improve environmental quality in Egypt? Environ. Sci. Pollut. Res. 2020, 27, 10869–10881. [Google Scholar] [CrossRef]
  93. Uddin, G.A.; Salahuddin, M.; Alam, K.; Gow, J. Ecological footprint and real income: Panel data evidence from the 27 highest emitting countries. Ecol. Indic. 2017, 77, 166–175. [Google Scholar] [CrossRef]
  94. Fakher, H.-A. Investigating the determinant factors of environmental quality (based on ecological carbon footprint index). Environ. Sci. Pollut. Res. 2019, 26, 10276–10291. [Google Scholar] [CrossRef]
  95. Danish; Wang, B.; Wang, Z. Imported technology and CO2 emission in China: Collecting evidence through bound testing and VECM approach. Renew. Sustain. Energy Rev. 2018, 82, 4204–4214. [Google Scholar] [CrossRef]
  96. Hermes, N.; Lensink, R. Foreign direct investment, financial development and economic growth. J. Dev. Stud. 2003, 40, 142–163. [Google Scholar] [CrossRef] [Green Version]
  97. Jalil, A.; Feridun, M. The impact of growth, energy and financial development on the environment in China: A cointegration analysis. Energy Econ. 2011, 33, 284–291. [Google Scholar] [CrossRef]
  98. King, R.G.; Levine, R. Finance and Growth: Schumpeter Might Be Right. Q. J. Econ. 1993, 108, 717–737. [Google Scholar] [CrossRef]
  99. Shahbaz, M.; Jam, F.A.; Bibi, S.; Loganathan, N. Multivariate granger causality between co2 emissions, energy intensity and economic growth in portugal: Evidence from cointegration and causality analysis. Technol. Econ. Dev. Econ. 2015, 22, 47–74. [Google Scholar] [CrossRef]
  100. Shahbaz, M.; Hye, Q.M.A.; Tiwari, A.; Leitão, N.C. Economic growth, energy consumption, financial development, international trade and CO2 emissions in Indonesia. Renew. Sustain. Energy Rev. 2013, 25, 109–121. [Google Scholar] [CrossRef] [Green Version]
  101. Tadesse, S. Financial Development and Technology. SSRN 2005. [Google Scholar] [CrossRef] [Green Version]
  102. Tamazian, A.; Rao, B.B. Do economic, financial and institutional developments matter for environmental degradation? Evidence from transitional economies. Energy Econ. 2010, 32, 137–145. [Google Scholar] [CrossRef] [Green Version]
  103. Zhang, Y.-J. The impact of financial development on carbon emissions: An empirical analysis in China. Energy Policy 2011, 39, 2197–2203. [Google Scholar] [CrossRef]
  104. Çoban, S.; Topcu, M. The nexus between financial development and energy consumption in the EU: A dynamic panel data analysis. Energy Econ. 2013, 39, 81–88. [Google Scholar] [CrossRef]
  105. Islam, F.; Shahbaz, M.; Ahmed, A.U.; Alam, M. Financial development and energy consumption nexus in Malaysia: A multivariate time series analysis. Econ. Model. 2013, 30, 435–441. [Google Scholar] [CrossRef] [Green Version]
  106. Omri, A.; Daly, S.; Rault, C.; Chaibi, A. Financial development, environmental quality, trade and economic growth: What causes what in MENA countries. Energy Econ. 2015, 48, 242–252. [Google Scholar] [CrossRef] [Green Version]
  107. Ozturk, I.; Acaravci, A. The long-run and causal analysis of energy, growth, openness and financial development on carbon emissions in Turkey. Energy Econ. 2013, 36, 262–267. [Google Scholar] [CrossRef]
  108. Shoaib, H.M.; Rafique, M.Z.; Nadeem, A.M.; Huang, S. Impact of financial development on CO2 emissions: A comparative analysis of developing countries (D8) and developed countries (G8). Environ. Sci. Pollut. Res. 2020, 27, 12461–12475. [Google Scholar] [CrossRef] [PubMed]
  109. Pesaran, M.H.; Shin, Y.; Smithc, R.J. Bounds testing approaches to the analysis of level relationships. J. Appl. Econ. 2001, 16, 289–326. [Google Scholar] [CrossRef]
  110. Narayan, S.; Narayan, P.K. An empirical analysis of Fiji’s import demand function. J. Econ. Stud. 2005, 32, 158–168. [Google Scholar] [CrossRef]
  111. Asif, S.; Naqvi, A.; Ale, S.; Shah, R.; Mehdi, M.A. Revealing Empirical Association among Ecological Footprints, Renewable Energy Consumption, Real Income, and Financial Development: A Global Perspective. Environ. Sci. Pollut. Res. 2020, 24, 42830–42849. [Google Scholar]
  112. Sarkodie, S.A.; Adams, S. Renewable energy, nuclear energy, and environmental pollution: Accounting for political institutional quality in South Africa. Sci. Total. Environ. 2018, 643, 1590–1601. [Google Scholar] [CrossRef]
  113. Narayan, P.K. The saving and investment nexus for China: Evidence from cointegration tests. Appl. Econ. 2005, 37, 1979–1990. [Google Scholar] [CrossRef]
  114. Dogan, E.; Seker, F. The influence of real output, renewable and non-renewable energy, trade and financial development on carbon emissions in the top renewable energy countries. Renew. Sustain. Energy Rev. 2016, 60, 1074–1085. [Google Scholar] [CrossRef]
  115. Karasoy, A. Drivers of carbon emissions in Turkey: Considering asymmetric impacts. Environ. Sci. Pollut. Res. 2019, 26, 9219–9231. [Google Scholar] [CrossRef] [PubMed]
  116. Khan, S.; Peng, Z.; Li, Y. Energy consumption, environmental degradation, economic growth and financial development in globe: Dynamic simultaneous equations panel analysis. Energy Rep. 2019, 5, 1089–1102. [Google Scholar] [CrossRef]
  117. Zaidi, S.A.H.; Zafar, M.W.; Shahbaz, M.; Hou, F. Dynamic linkages between globalization, financial development and carbon emissions: Evidence from Asia Pacific Economic Cooperation countries. J. Clean. Prod. 2019, 228, 533–543. [Google Scholar] [CrossRef]
  118. Abbasi, F.; Riaz, K. CO2 emissions and financial development in an emerging economy: An augmented VAR approach. Energy Policy 2016, 90, 102–114. [Google Scholar] [CrossRef]
  119. Khan, M.K.; Teng, J.Z. The impact of macroeconomic and financial development on carbon dioxide emissions in Pakistan: Evidence with a novel dynamic simulated ARDL approach. Environ. Sci. Pollut. Res. 2020, 27, 39560–39571. [Google Scholar] [CrossRef] [PubMed]
  120. Ahmed, F.; Kousar, S.; Pervaiz, A.; Ramos-Requena, J. Financial Development, Institutional Quality, and Environmental Degradation Nexus: New Evidence from Asymmetric ARDL Co-Integration Approach. Sustainability 2020, 12, 7812. [Google Scholar] [CrossRef]
  121. Asif, S.; Khan, K.B.; Anser, M.K.; Nassani, A.A.; Abro, M.M.Q.; Zaman, K. Dynamic interaction between financial development and natural resources: Evaluating the ‘Resource curse’ hypothesis. Resour. Policy 2020, 65, 101566. [Google Scholar] [CrossRef]
  122. Hübler, M. The inequality-emissions nexus in the context of trade and development: A quantile regression approach. Ecol. Econ. 2017, 134, 174–185. [Google Scholar] [CrossRef]
  123. Heerink, N.; Mulatu, A.; Bulte, E. Income inequality and the environment: Aggregation bias in environmental Kuznets curves. Ecol. Econ. 2001, 38, 359–367. [Google Scholar] [CrossRef]
  124. Kasuga, H.; Takaya, M. Does inequality affect environmental quality? Evidence from major Japanese cities. J. Clean. Prod. 2017, 142, 3689–3701. [Google Scholar] [CrossRef]
  125. Qu, B.; Zhang, Y. Effect of income distribution on the environmental kuznets curve. Pac. Econ. Rev. 2011, 16, 349–370. [Google Scholar] [CrossRef]
  126. Abdul, S.; Khan, R.; Zhang, Y.; Nathaniel, S. Green supply chain performance and environmental sustainability: A panel study. LogForum 2020, 16, 141–159. [Google Scholar]
  127. Eyuboglu, K.; Uzar, U. Examining the roles of renewable energy consumption and agriculture on CO2 emission in lucky-seven countries. Environ. Sci. Pollut. Res. 2020, 27, 45031–45040. [Google Scholar] [CrossRef] [PubMed]
  128. Teng, J.-Z.; Khan, M.K.; Chishti, M.Z. Effect of foreign direct investment on CO2 emission with the role of globalization, institutional quality with pooled mean group panel ARDL. Environ. Sci. Pollut. Res. 2021, 28, 5271–5282. [Google Scholar] [CrossRef] [PubMed]
  129. Wolde-Rufael, Y.; Weldemeskel, E.M. Environmental policy stringency, renewable energy consumption and CO2 emissions: Panel cointegration analysis for BRIICTS countries. Int. J. Green Energy 2020, 17, 568–582. [Google Scholar] [CrossRef]
  130. Baloch, A.; Shah, S.Z.; Noor, Z.M.; Magsi, H.B. The nexus between income inequality, economic growth and environmental degradation in Pakistan. GeoJournal 2018, 83, 207–222. [Google Scholar] [CrossRef]
  131. Khan, S.; Yahong, W. Symmetric and Asymmetric Impact of Poverty, Income Inequality, and Population on Carbon Emission in Pakistan: New Evidence From ARDL and NARDL Co-Integration. Front. Environ. Sci. 2021, 9. [Google Scholar] [CrossRef]
  132. Hussain, J.; Zhou, K.; Guo, S.; Khan, A. Investment risk and natural resource potential in “Belt & Road Initiative” countries: A multi-criteria decision-making approach. Sci. Total. Environ. 2020, 723, 137981. [Google Scholar] [CrossRef]
  133. Khan, A.; Muhammad, F.; Chenggang, Y.; Hussain, J.; Bano, S.; Khan, M.A. The impression of technological innovations and natural resources in energy-growth-environment nexus: A new look into BRICS economies. Sci. Total. Environ. 2020, 727, 138265. [Google Scholar] [CrossRef]
  134. Kwakwa, P.A.; Alhassan, H.; Adu, G. Effect of natural resources extraction on energy consumption and carbon dioxide emission in Ghana. Int. J. Energy Sect. Manag. 2020, 14, 20–39. [Google Scholar] [CrossRef]
  135. Khan, A.; Chenggang, Y.; Hussain, J.; Bano, S.; Nawaz, A. Natural resources, tourism development, and energy-growth-CO2 emission nexus: A simultaneity modeling analysis of BRI countries. Resour. Policy 2020, 68, 101751. [Google Scholar] [CrossRef]
  136. Zafar, M.W.; Zaidi, S.A.H.; Khan, N.R.; Mirza, F.M.; Hou, F.; Kirmani, S.A.A. The impact of natural resources, human capital, and foreign direct investment on the ecological footprint: The case of the United States. Resour. Policy 2019, 63, 101428. [Google Scholar] [CrossRef]
  137. Wu, S.; Li, L.; Li, S. Natural resource abundance, natural resource-oriented industry dependence, and economic growth: Evidence from the provincial level in China. Resour. Conserv. Recycl. 2018, 139, 163–171. [Google Scholar] [CrossRef]
Figure 1. The outcome of cumulative sum (CUSUM).
Sustainability 13 08364 g001
Figure 2. The outcome of cumulative sum of square (CUSUMsq).
Sustainability 13 08364 g002
Figure 3. Trend of variables.
Sustainability 13 08364 g003
Table 1. Data Measurements and Sources.
VariableSymbolsDefinitionsData Source
Carbon dioxide emissionCO2CO2 emission per capitaOur world in Data
Natural resourceNRTotal natural resources rents (% of GDP)World Bank
Income Inequality Gini indexINEN“The Gini index is a measurement of the income distribution of a country’s residents”. 0 represents perfect equality, and 100 means perfect inequality.World Inequality Data Base
Renewable EnergyREAccess to electricity (%) Contribution of renewables to total primary energy supply (TPES)OECD
Financial DevelopmentFDDomestic loan or credit provision to the private sectorsWorld Bank
Table 2. Results of ADF, PP, and DF-GLS unit root tests. (Data used: 1990–2018).
Augmented Ducky–Fuller (ADF) TestPhillips–Perron Test StatisticDF-GLS Test Statistic
At LevelAt First DifferenceAt LevelAt First DifferenceAt LevelAt First Difference
Variablet-statistic
(Prob.)
t-statistic
(Prob.)
t-statistic
(Prob.)
t-statistic
(Prob.)
t-Statistict-Statistic
LOGCO20.180806
(0.9663)
−3.707578 b
(0.0119)
0.260147
(0.9716)
−5.666896 a
(0.0001)
0.752239−5.052051 a
LOGFD−1.065109
(0.7151)
−4.499995 a
(0.0014)
−1.20668
(0.6571)
−4.509760 a
(0.0014)
−1.102064−4.347852 a
LOGINEN−2.617508
(0.1019)
−3.853967 a
(0.0069)
−1.91245
(0.3221)
−3.692408 b
(0.0102)
−2.669683−3.840676 a
LOGRE−1.866552
(0.3416)
−4.775972 a
(0.0009)
−2.38168
(0.1566)
−4.775228 a
(0.0009)
−0.913565−4.584708 a
LOGNR−1.420919
(0.5577)
−4.239001 a
(0.0027)
−1.60146
(0.4686)
−4.182572 a
(0.0031)
−1.447202−3.746157 a
Note: a Shows the level of rejection at 1% level of significance. b Shows the level of rejection at 5% level of significance.
Table 3. Results of bound testing approach. (Data used: 1990–2018).
Bound Testing ValueDiagnostic Test
Selected ModelLag OrderF-StatisticDecisionRamsey ResetARCH-Testχ2-LM Test
LOGCO2 = f(LOGFD, LOGINEQ, LOGNR, LOGRE)(3, 2, 3, 3,2)3.234916 cconclusive0.052787
[0.8296]
0.421453
[0.5236]
14.75224
[0.1926]
LOGRE = LOGCO2 LOGFD LOGINEQ LOGNR(1, 2, 1, 2, 2)7.787994 aonclusive0.05815
[0.8213]
1.770333
[0.1983]
4.158443
[0.1365]
LOGNR = LOGRE LOGCO2 LOGFD LOGINEQ(3, 3, 1, 2, 3)13.37142 aconclusive0.029547
[0.9776]
0.314633
[0.5811]
2.202445
[0.3358]
LOGINEQ = LOGNR LOGRE LOGCO2 LOGFD(2, 3, 3, 3, 1)5.983404 aconclusive0.425103
[0.6884]
0.839593
[0.3704]
1.061990
[0.4266]
LOGGI = f(LOGINEQ, LOGNR, LOGRE, LOGCO2)(1, 2, 3, 2, 3)3.157947 cconclusive1.583510
[0.2368]
0.067796
[0.7971]
0.004102
[0.9502]
Note: For critical region, please see [111]. a Shows the level of rejection at 1% level of significance. c Shows the level of rejection at 10% level of significance.
Table 4. Results of Johnson’s co-integration. (Data used: 1990–2018).
Hypothesized No. of CE(s)EigenvalueTrace Statistic0.05 Critical ValueProb. **
None *0.974078171.981969.818890.0000
At most 1 *0.91992387.9707447.856130.0000
At most 2 *0.55741329.9011029.797070.0486
At most 30.36613611.1533815.494710.2023
At most 40.0285920.6672043.8414660.4140
Hypothesized No. of CE(s)EigenvalueMax-Eigen Statistic0.05 Critical ValueProb.**
None *0.97407884.0111133.876870.0000
At most 1 *0.91992358.0696427.584340.0000
At most 20.55741318.7477221.131620.1044
At most 30.36613610.4861814.264600.1819
At most 40.0285920.6672043.8414660.4140
* Indicates rejection of the hypothesis at 0.05%.
Table 5. ARDL long run form and short run. (Data used: 1990–2018).
Long run Dynamics
VariableCoefficientStd. Errort-StatisticProb.
LOGFD−0.0574410.022305−2.5752200.0497
LOGINEQ−2.2948000.175140−13.1026880.0000
LOGRE−2.8733680.121564−23.6366990.0000
LOGNR0.0568120.00492511.5356900.0001
C6.3736430.27569723.1182610.0000
Short Run dynamics
D(LOGFD)−0.3321350.095304−3.4850120.0176
D(LOGINEQ)−2.0783010.482073−4.3111790.0076
D(LOGNR)−0.1774730.029742−5.9671610.0019
D(LOGRE)−3.4114230.435520−7.8329800.0005
CointEq(−1)−4.3826820.703425−6.2304890.0016
Diagnostic test
R-squared0.993085
F-statistic42.23997
Prob(F-statistic)0.000298
Durbin-Watson stat2.989733
Sensitivity analysis
Ramsey Reset0.052787 [0.8296]
χ2-LM14.75224 [0.1926]
χ2-ARCH0.421453 [0.5236]
Table 6. Results of VECM Granger causality. (Data used: 1990–2018).
χ2-Statistic Short Run Causalityχ2-Statistics Long Run Causality
VariablesLOGCO2LOGINENLOGFDLOGRELOGNREcm(t−1)
LOGCO2---1.451222
[0.2424]
6.122717
[0.0224]
0.573262
[0.4578]
2.885858
[0.1049]
0.011258
[0.1049]
LOGINEN0.262153
[0.6143]
---0.412097
[0.5282]
0.065439
[0.8007]
1.183803
[0.2895]
0.006655
[0.2895]
LOGFD1.318063
[0.2645]
1.526119
[0.2310]
---1.225580
[0.2814]
4.609063 b
[0.0442]
−0.011762
[0.0442]
LOGRE6.302885
[0.0213]
0.382729
[0.5435]
0.873706
[0.3617]
---2.766892
[0.0126]
−0.086378 b
0.0126
LOGNR0.828182
[0.3736]
0.083562
[0.7755]
1.896026
[0.1837]
0.223462
[0.6415]
--−0.065421
[0.1765]
Note: b shows the level of significance at 5% level of significance.
Publisher’s Note: MDPI stays neutral with regard to jurisdictional claims in published maps and institutional affiliations.

