
Sustainability of Regional Agroecological Economic System Based on Emergy Theory: A Case Study of Anhui Province, China


Abstract
:1. Introduction
2. Methodology
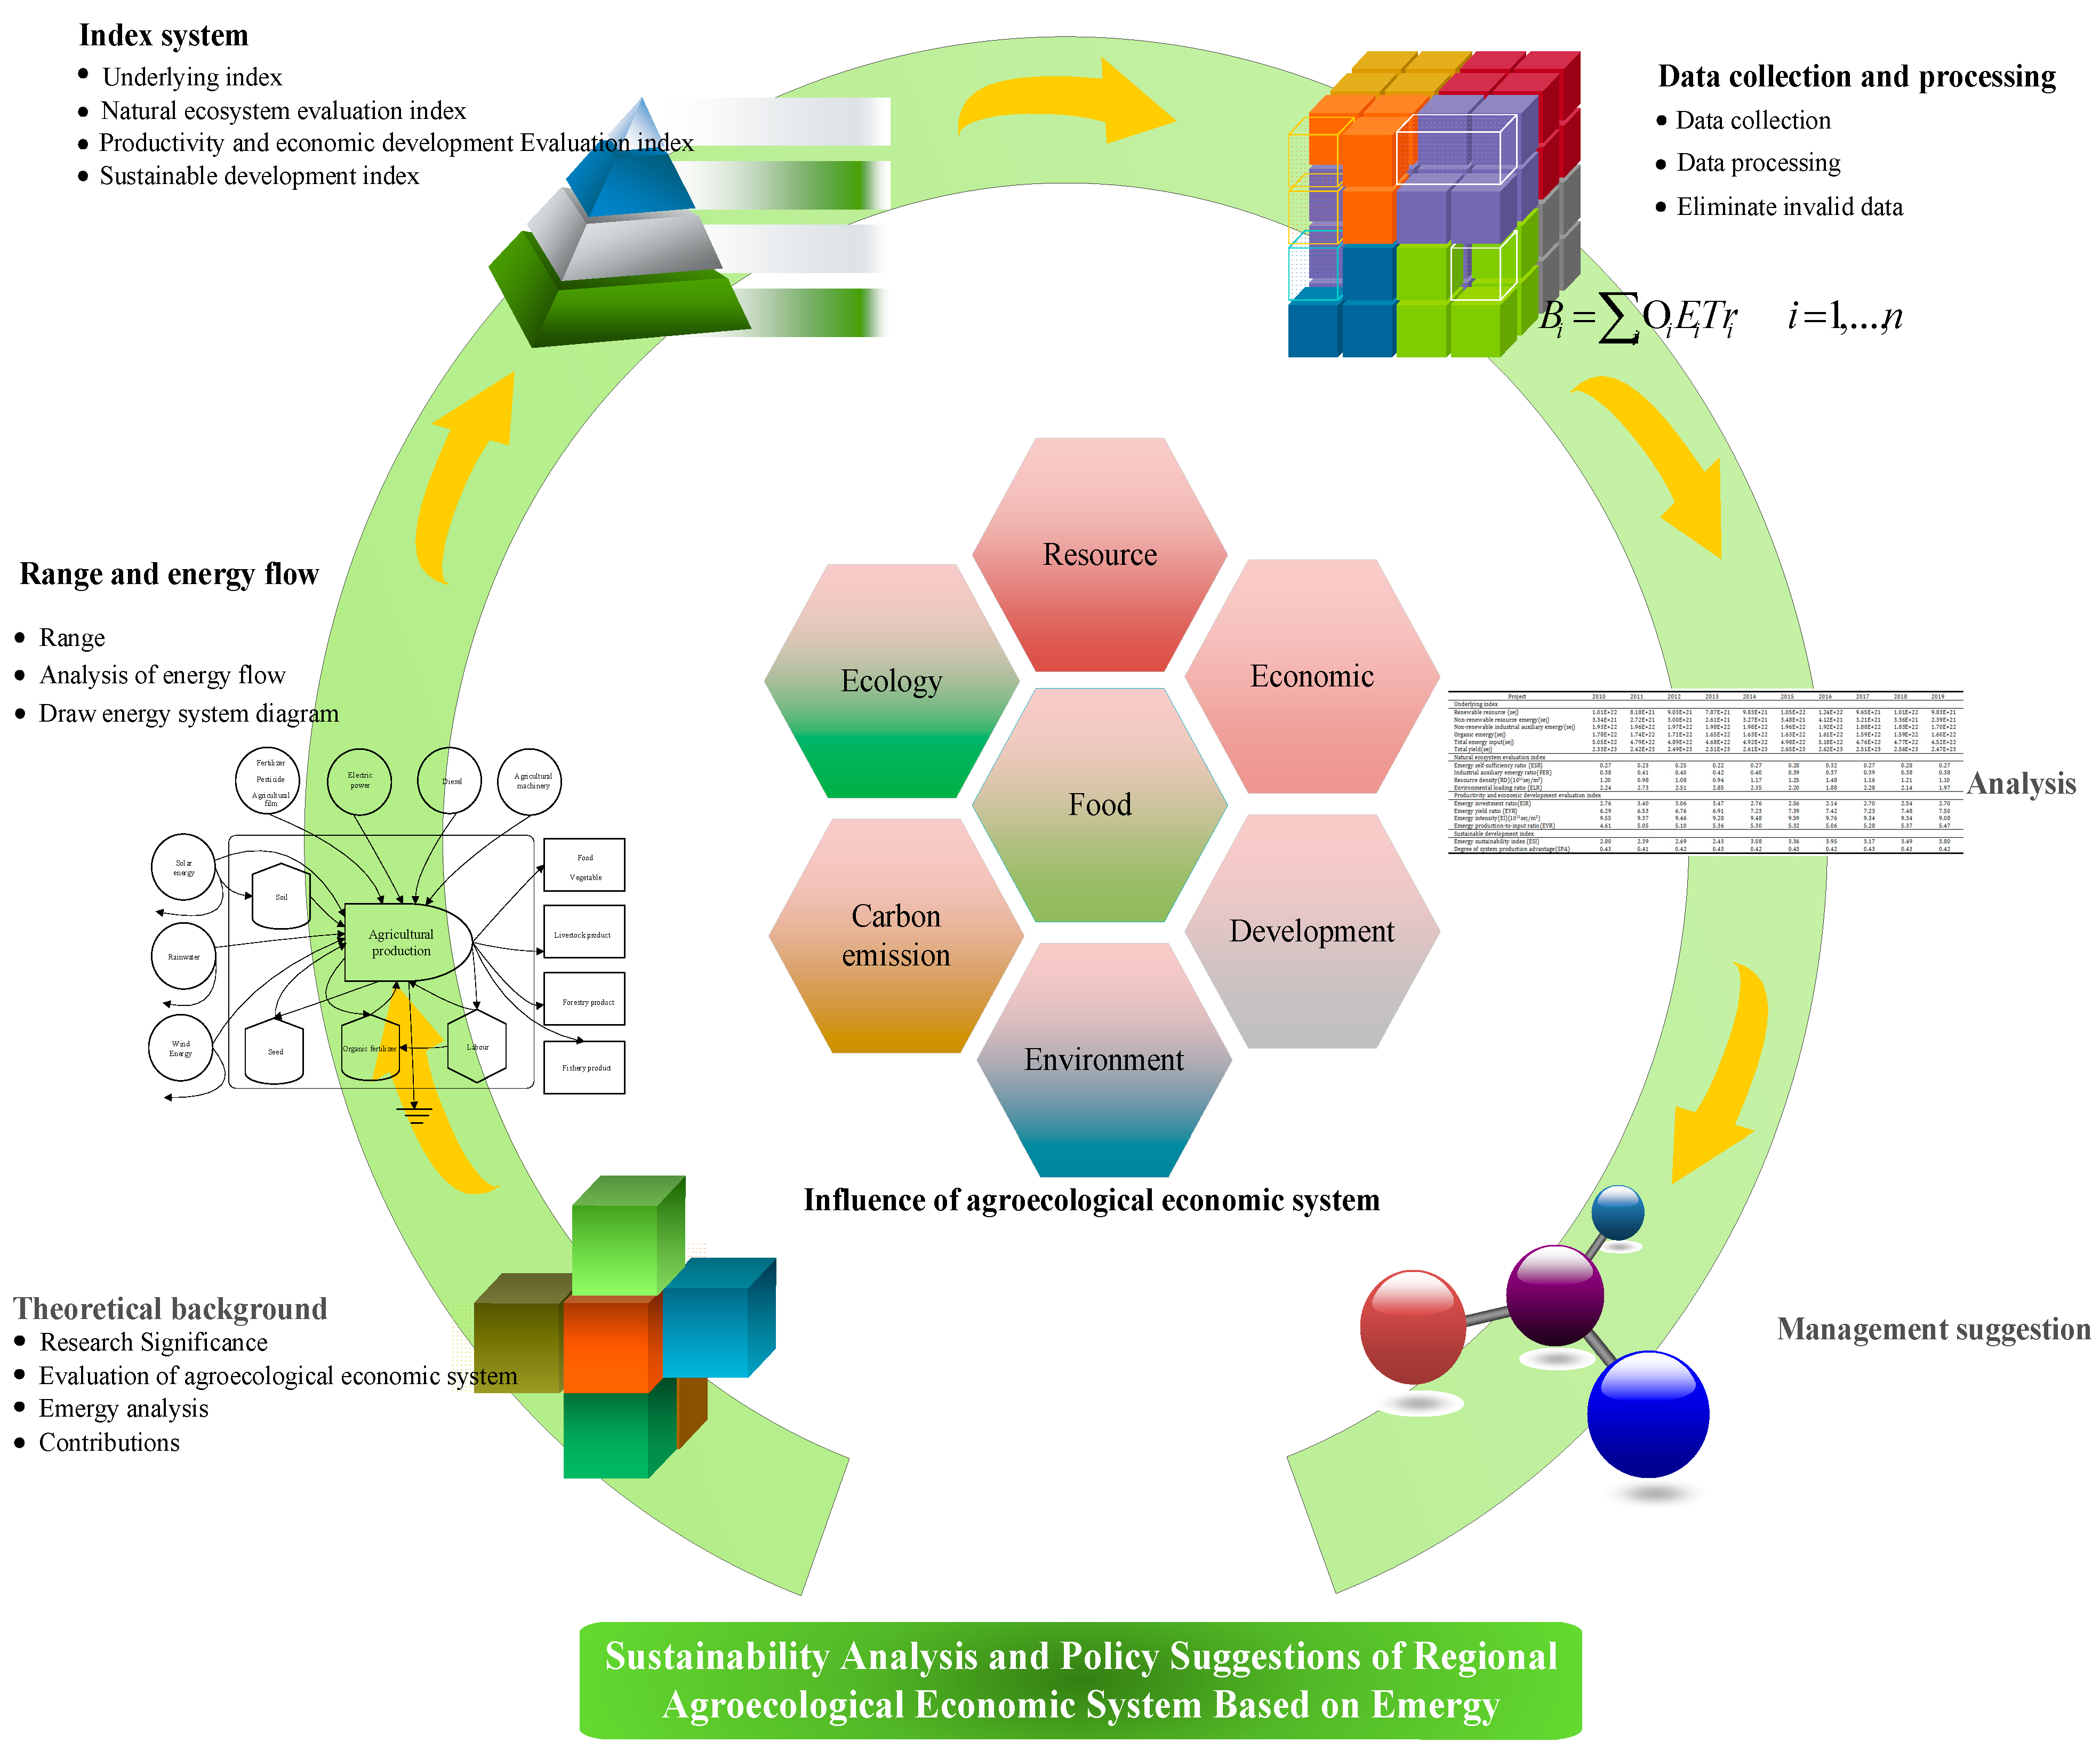
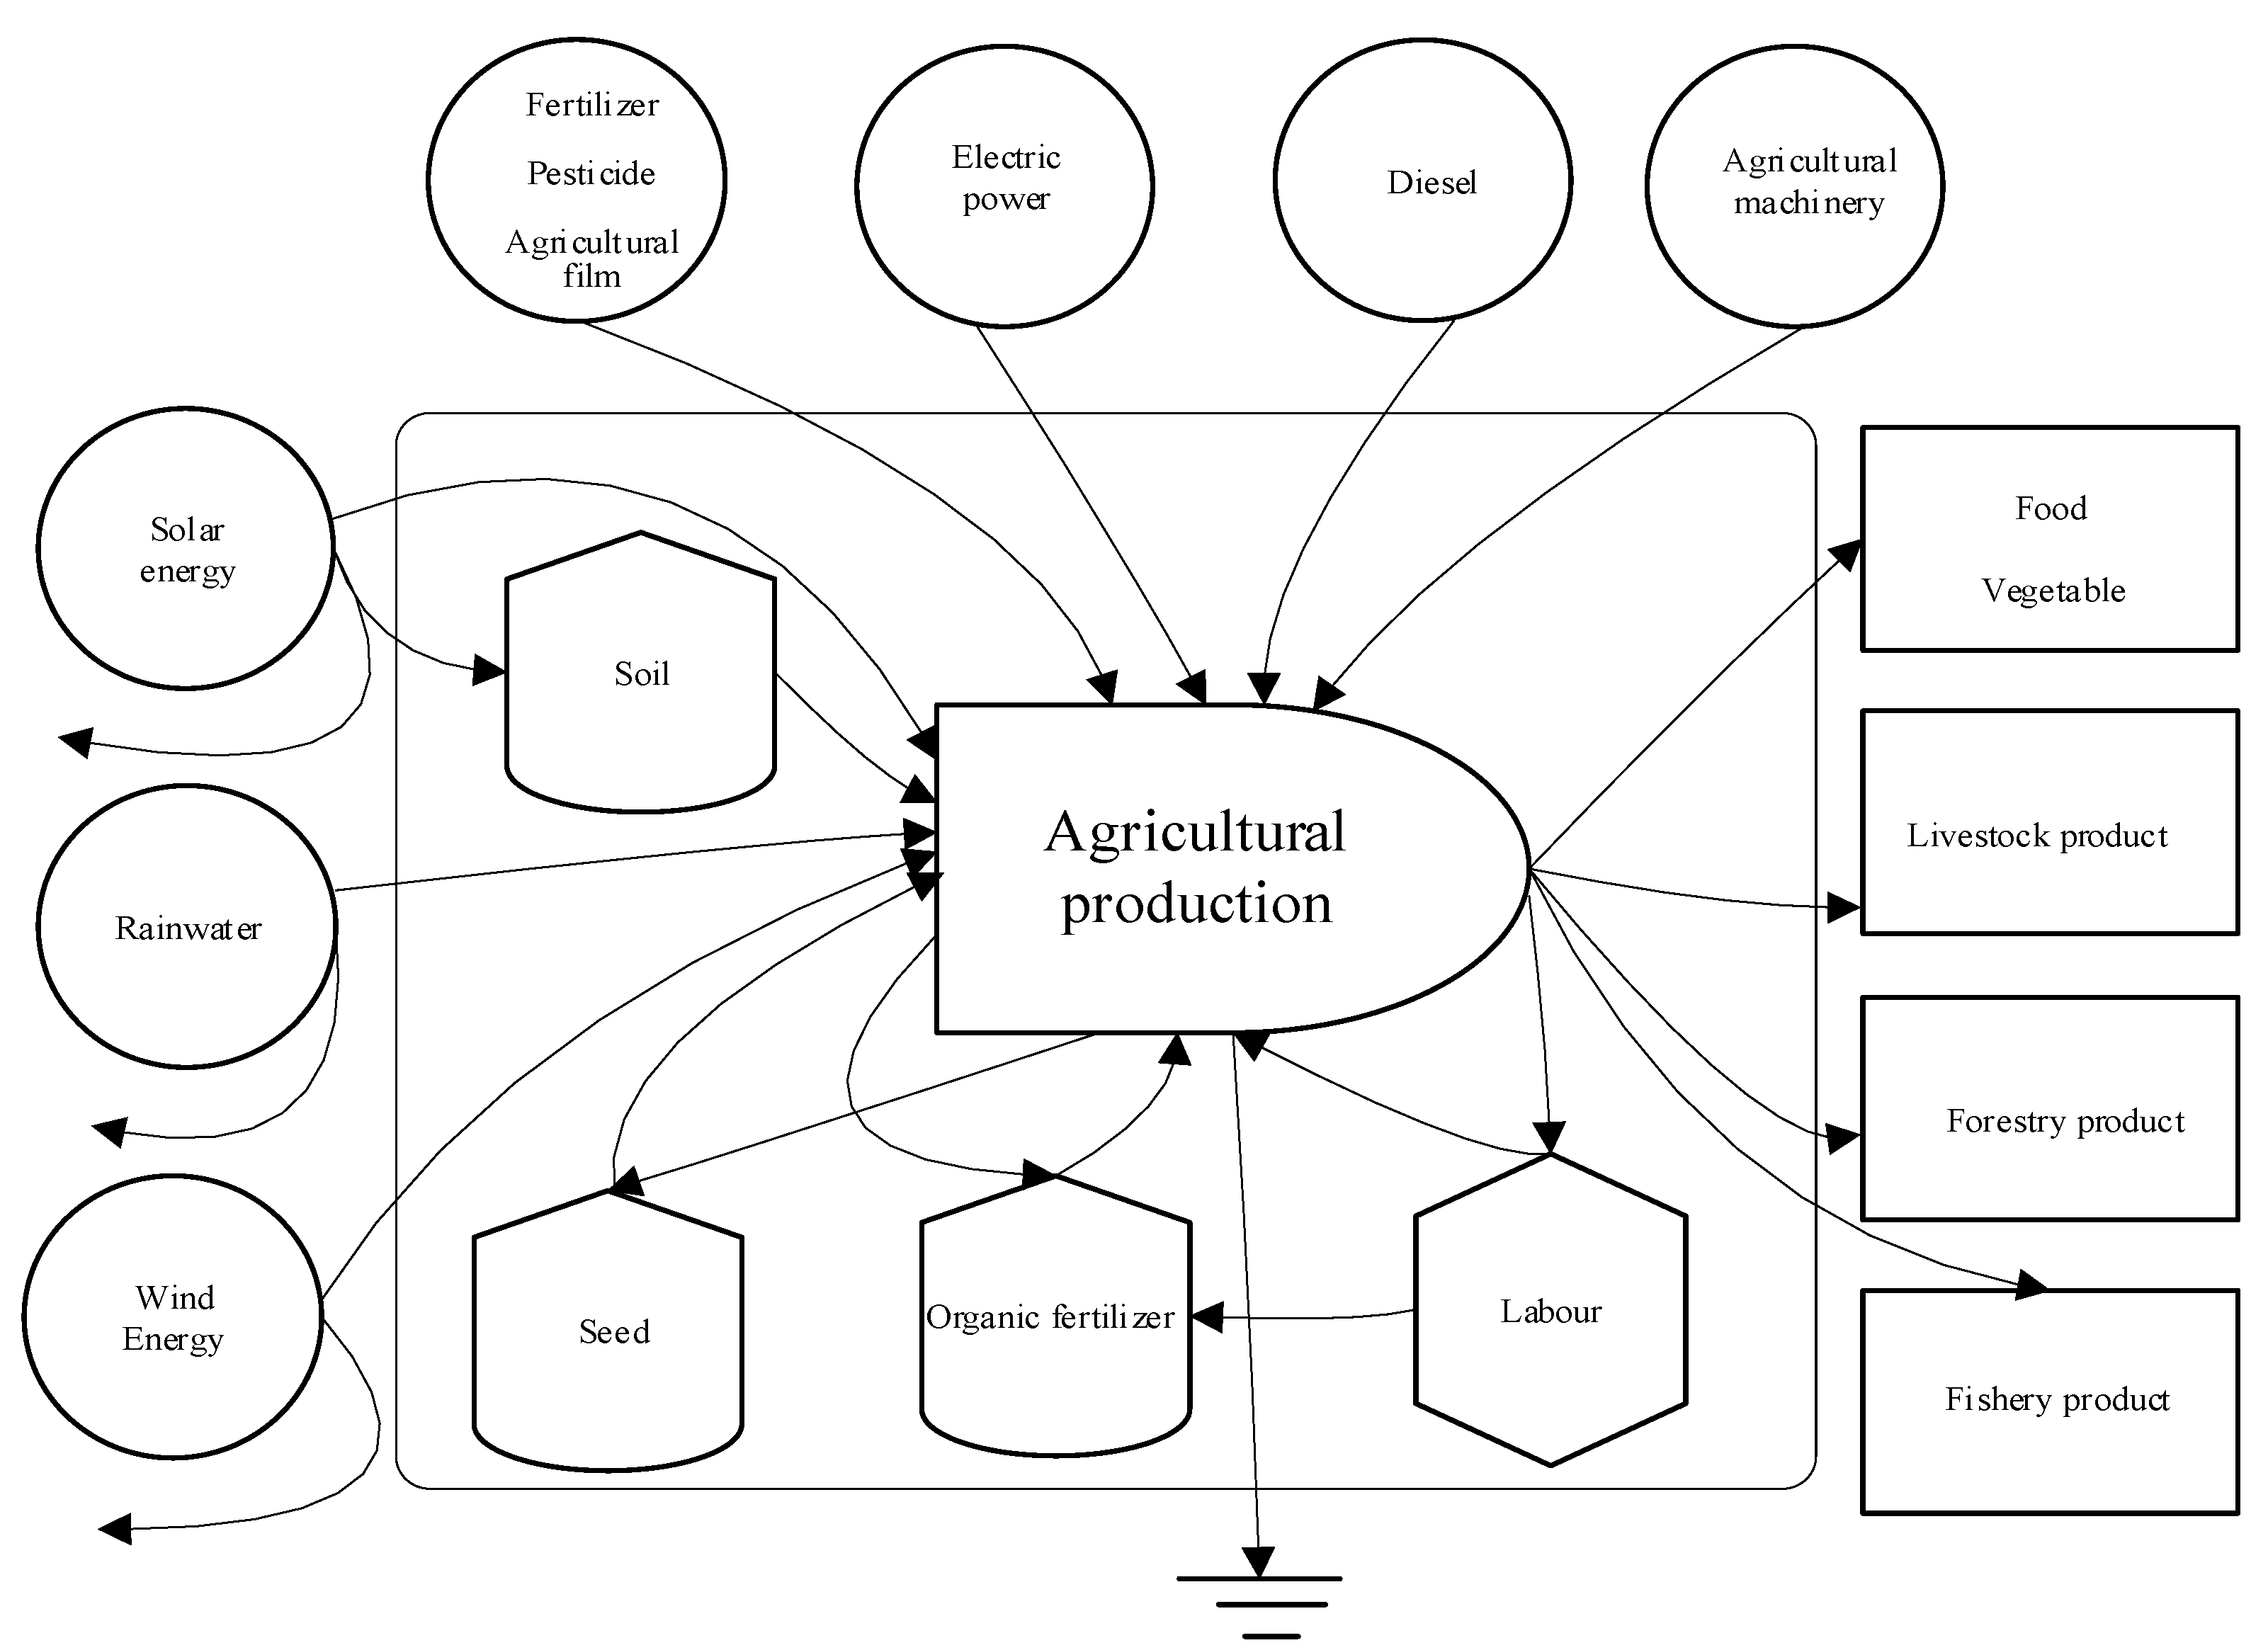
2.1. Research Methodology
2.2. Indicators
3. Evaluation of the Sustainability of the Agroecological Economic System in Anhui Province
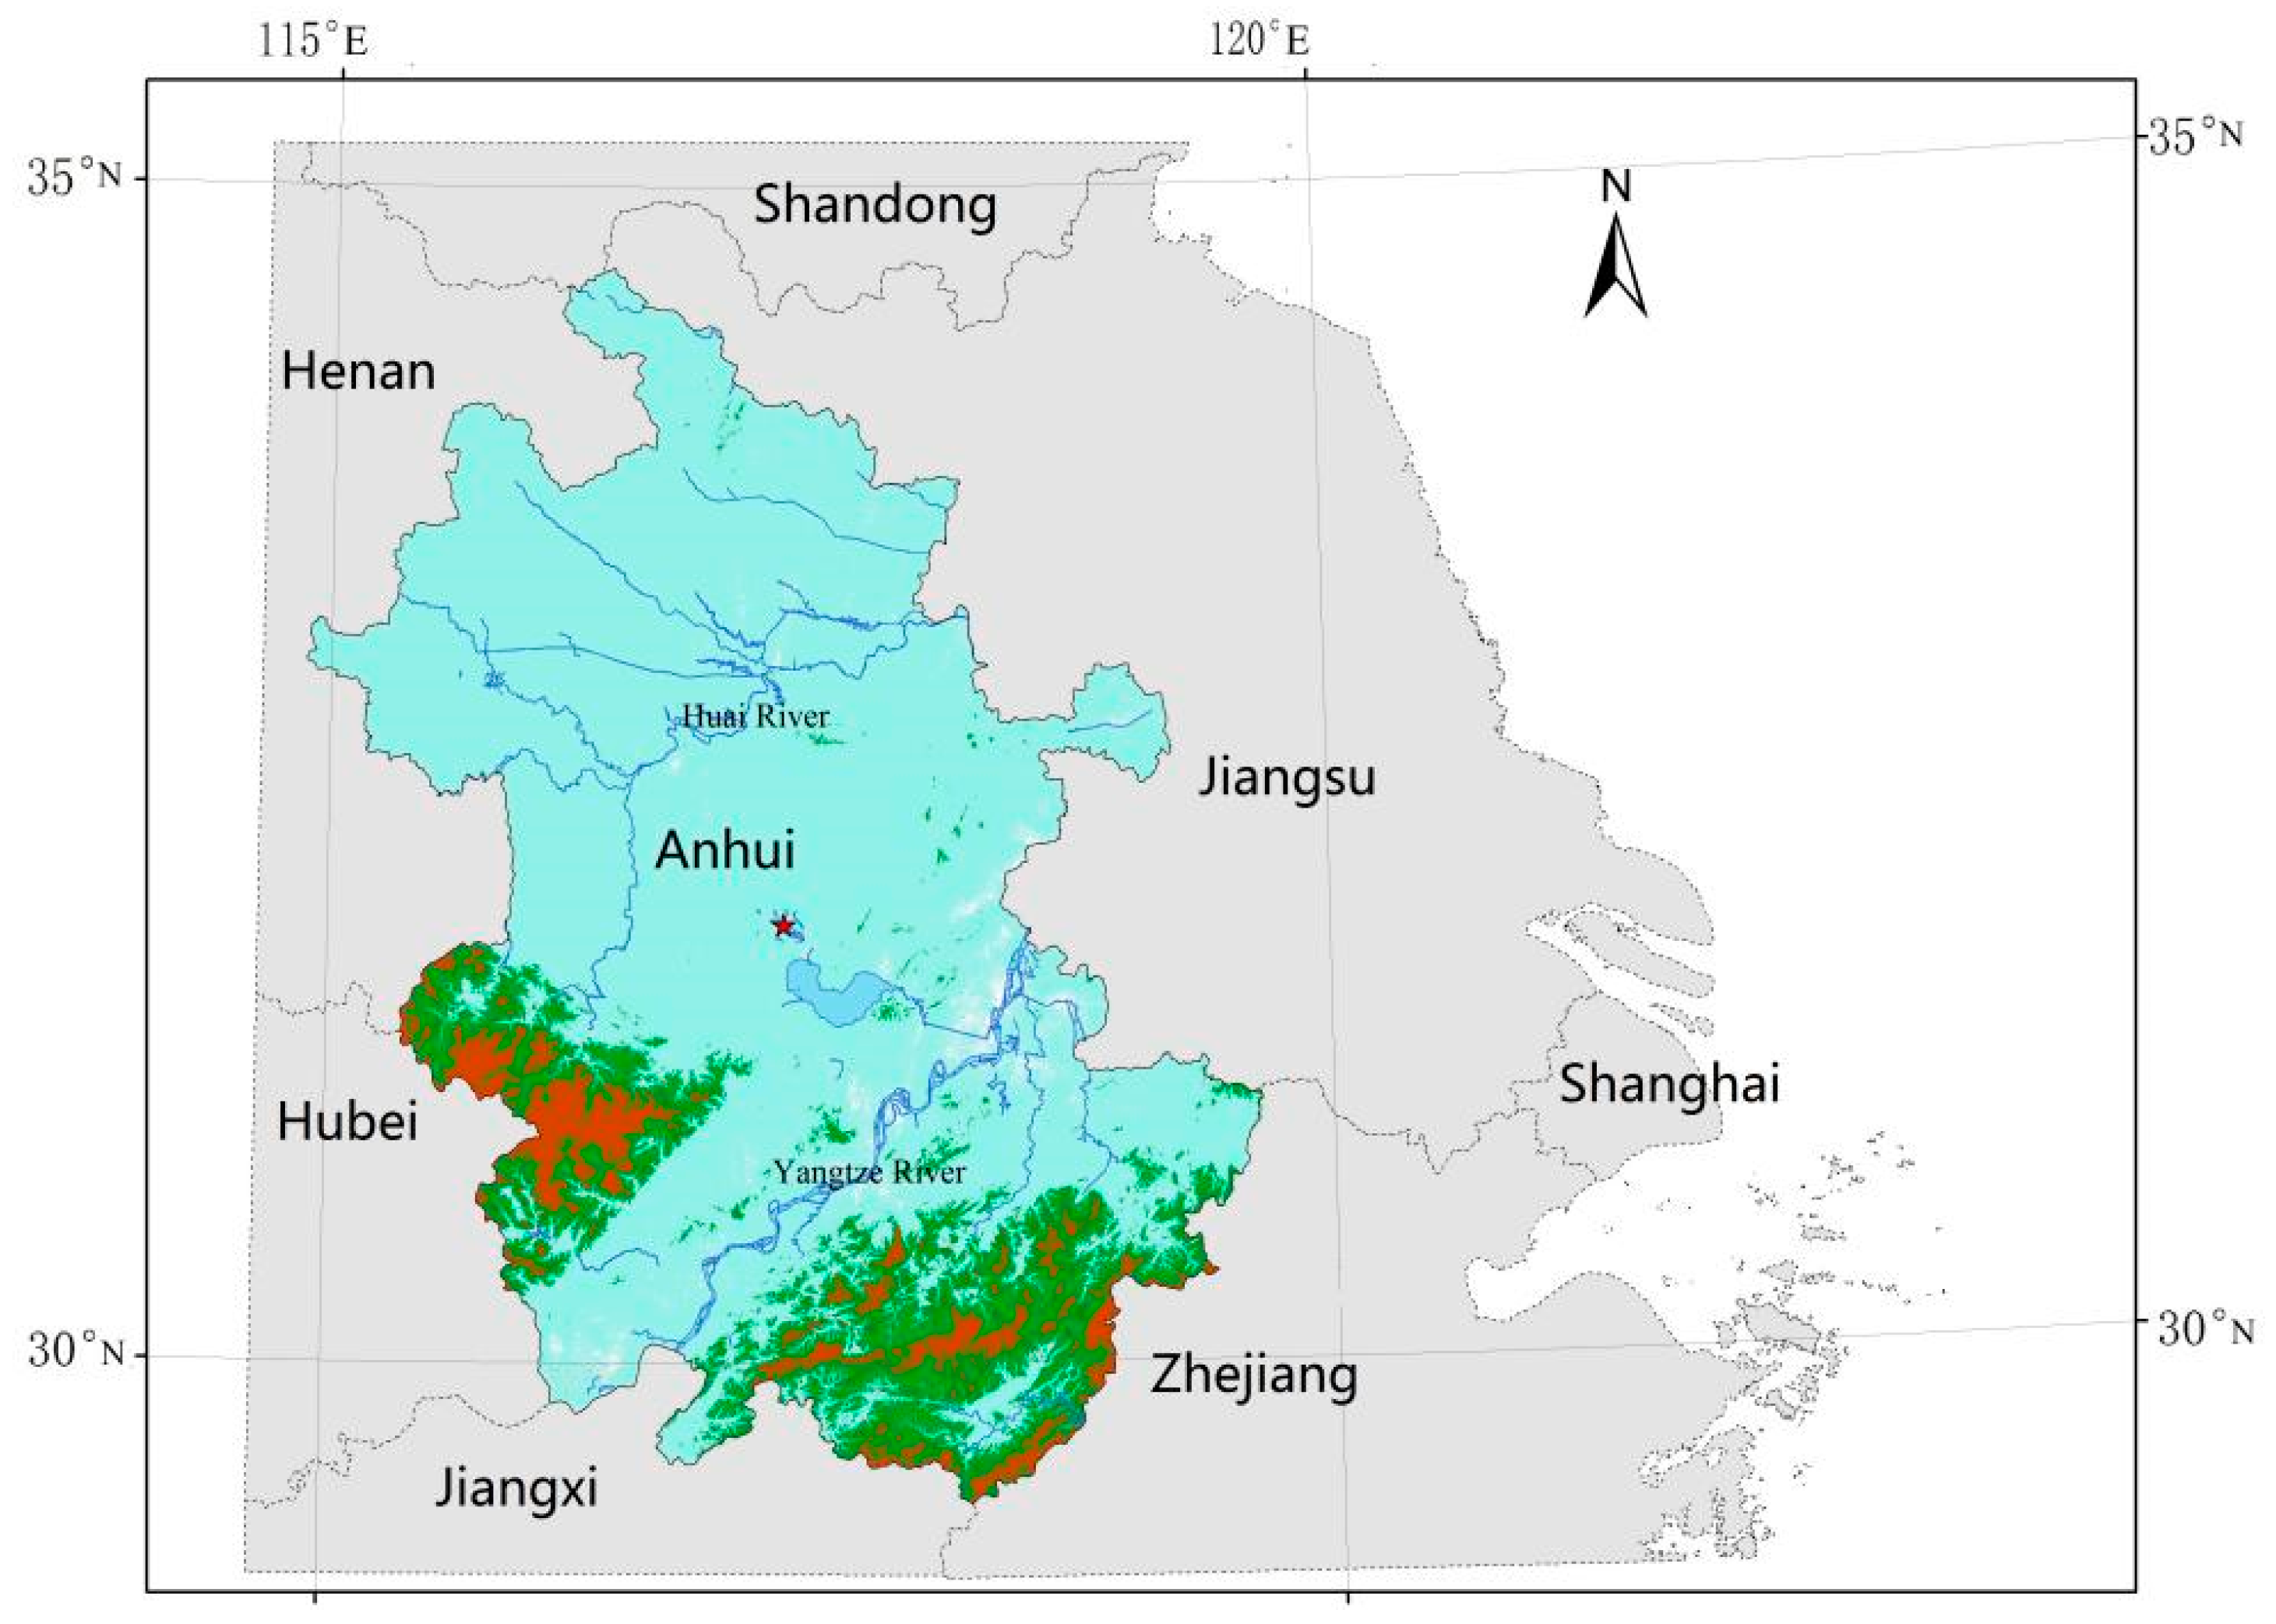
3.1. Background
3.2. Results
3.2.1. Analysis of Underlying Index
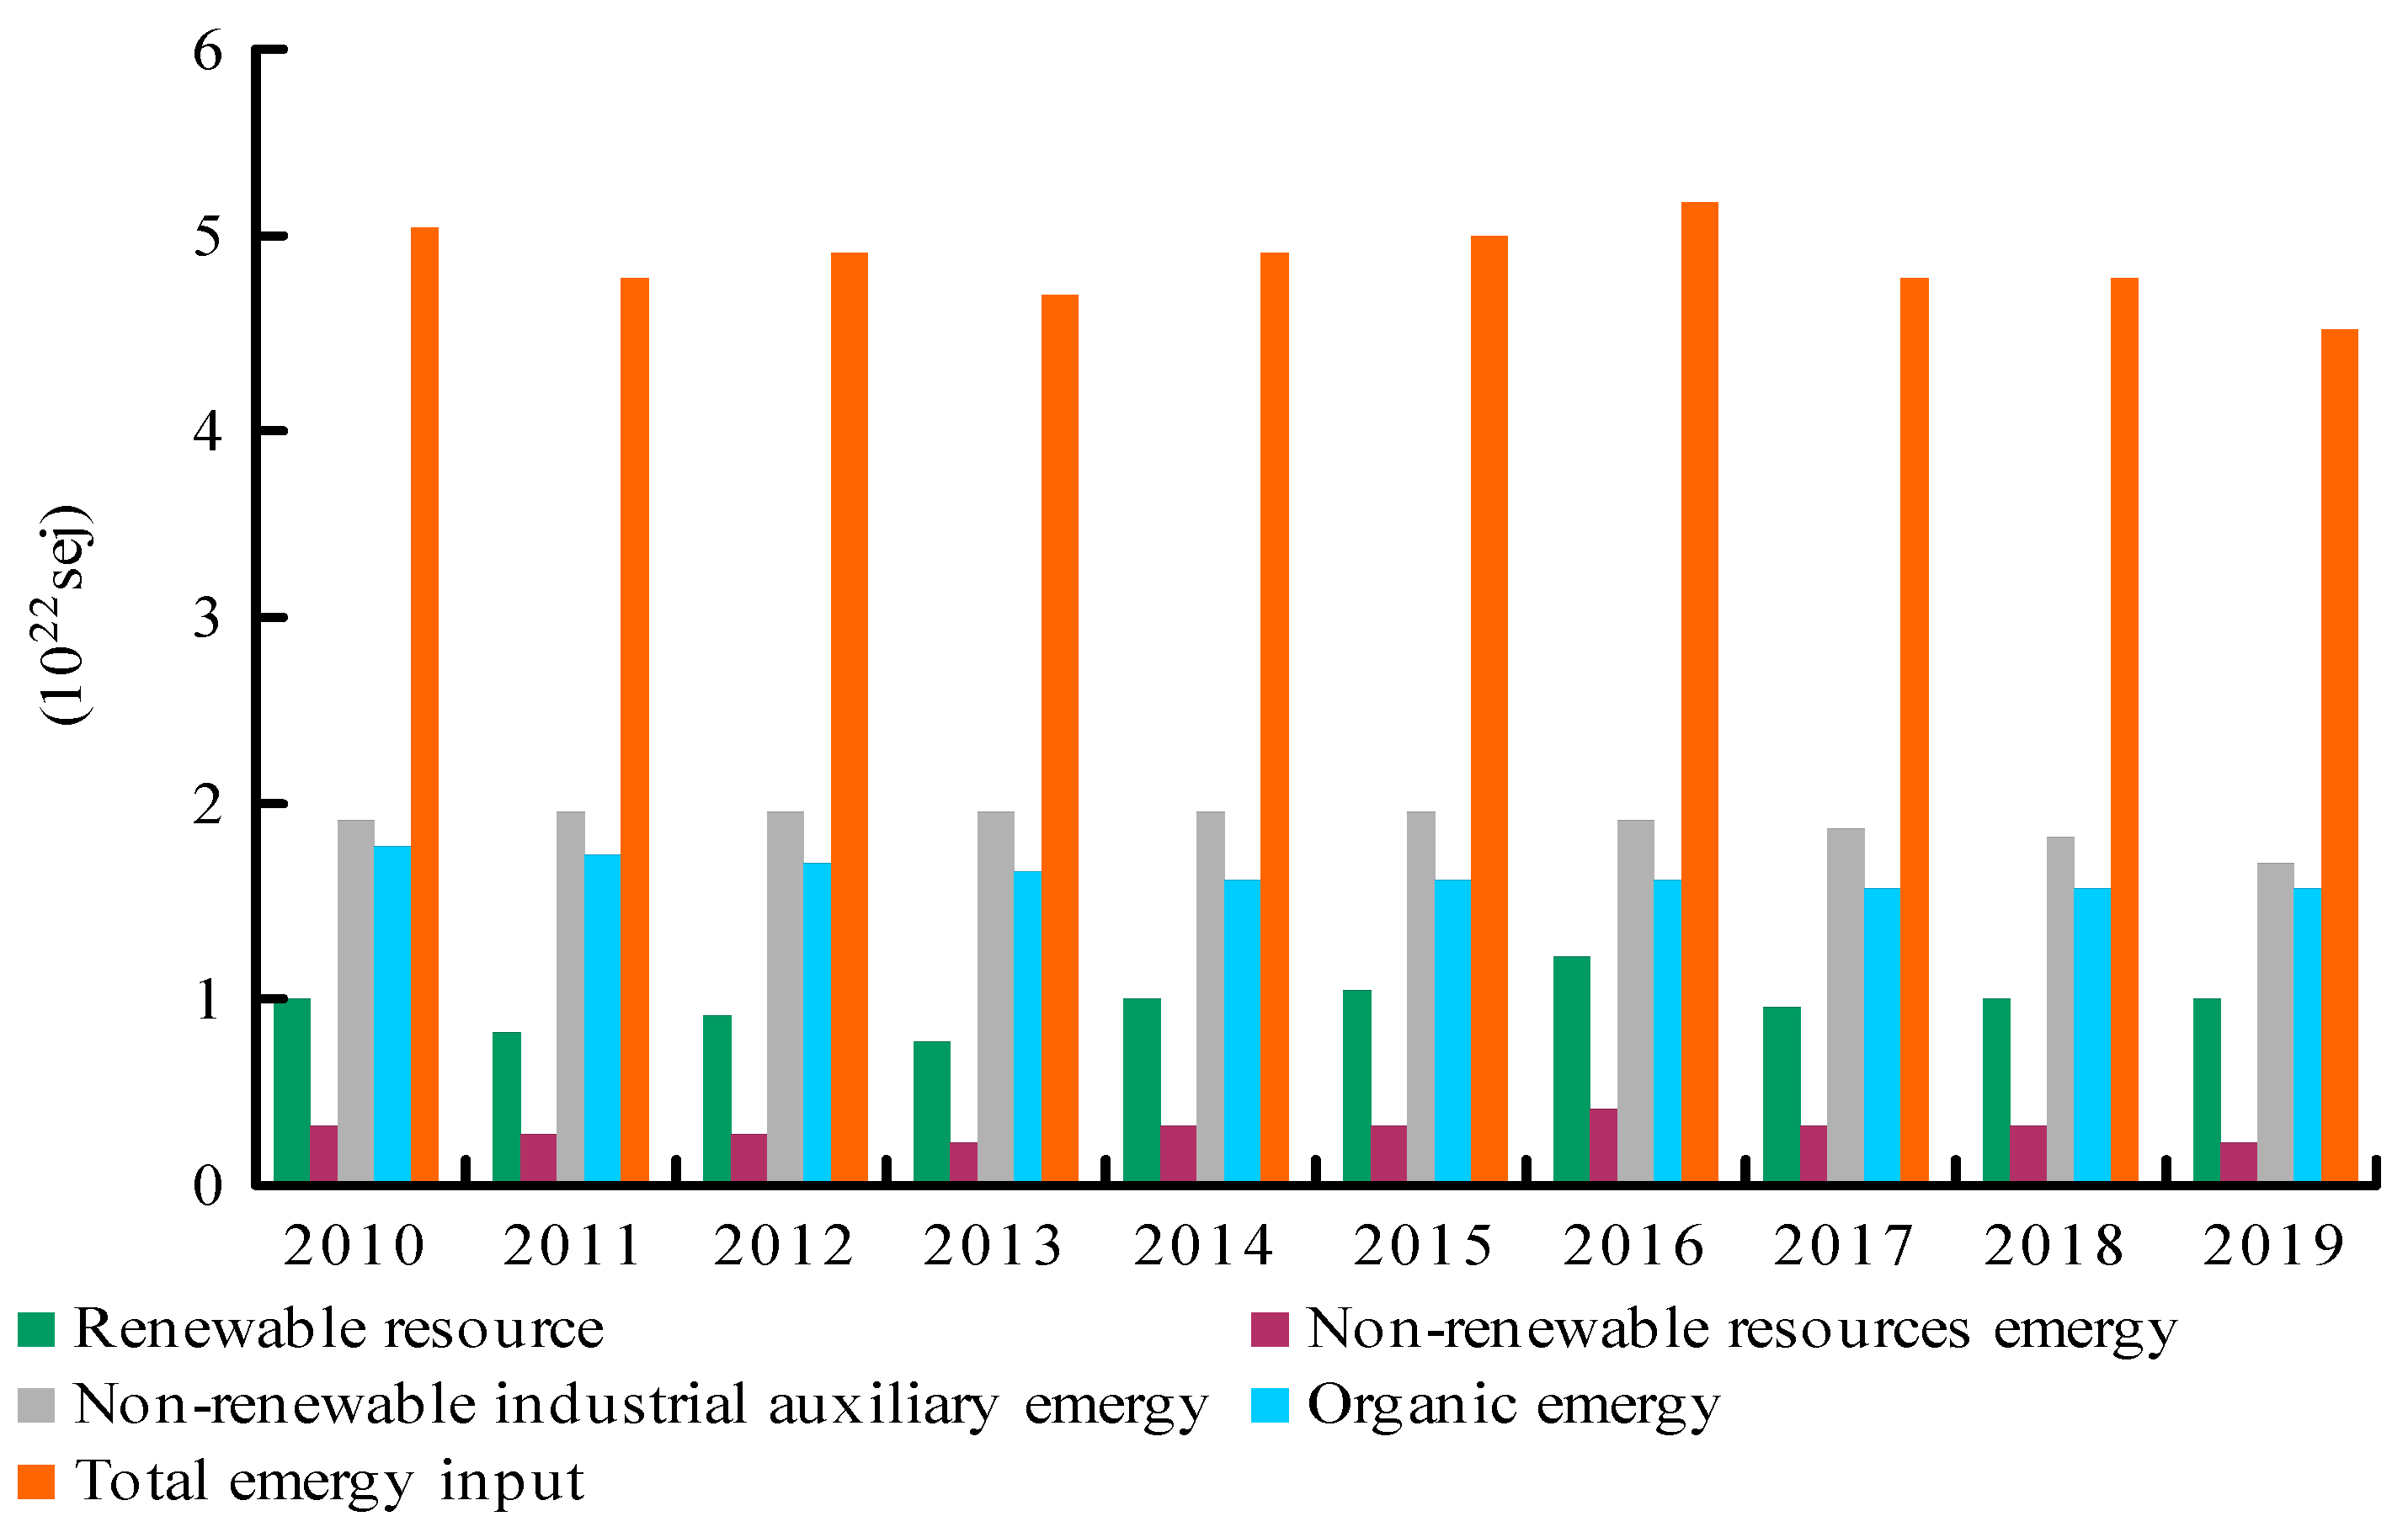
Emergy Analysis of System Input
Emergy Analysis of System Output
3.2.2. Analysis of Sustainability Index
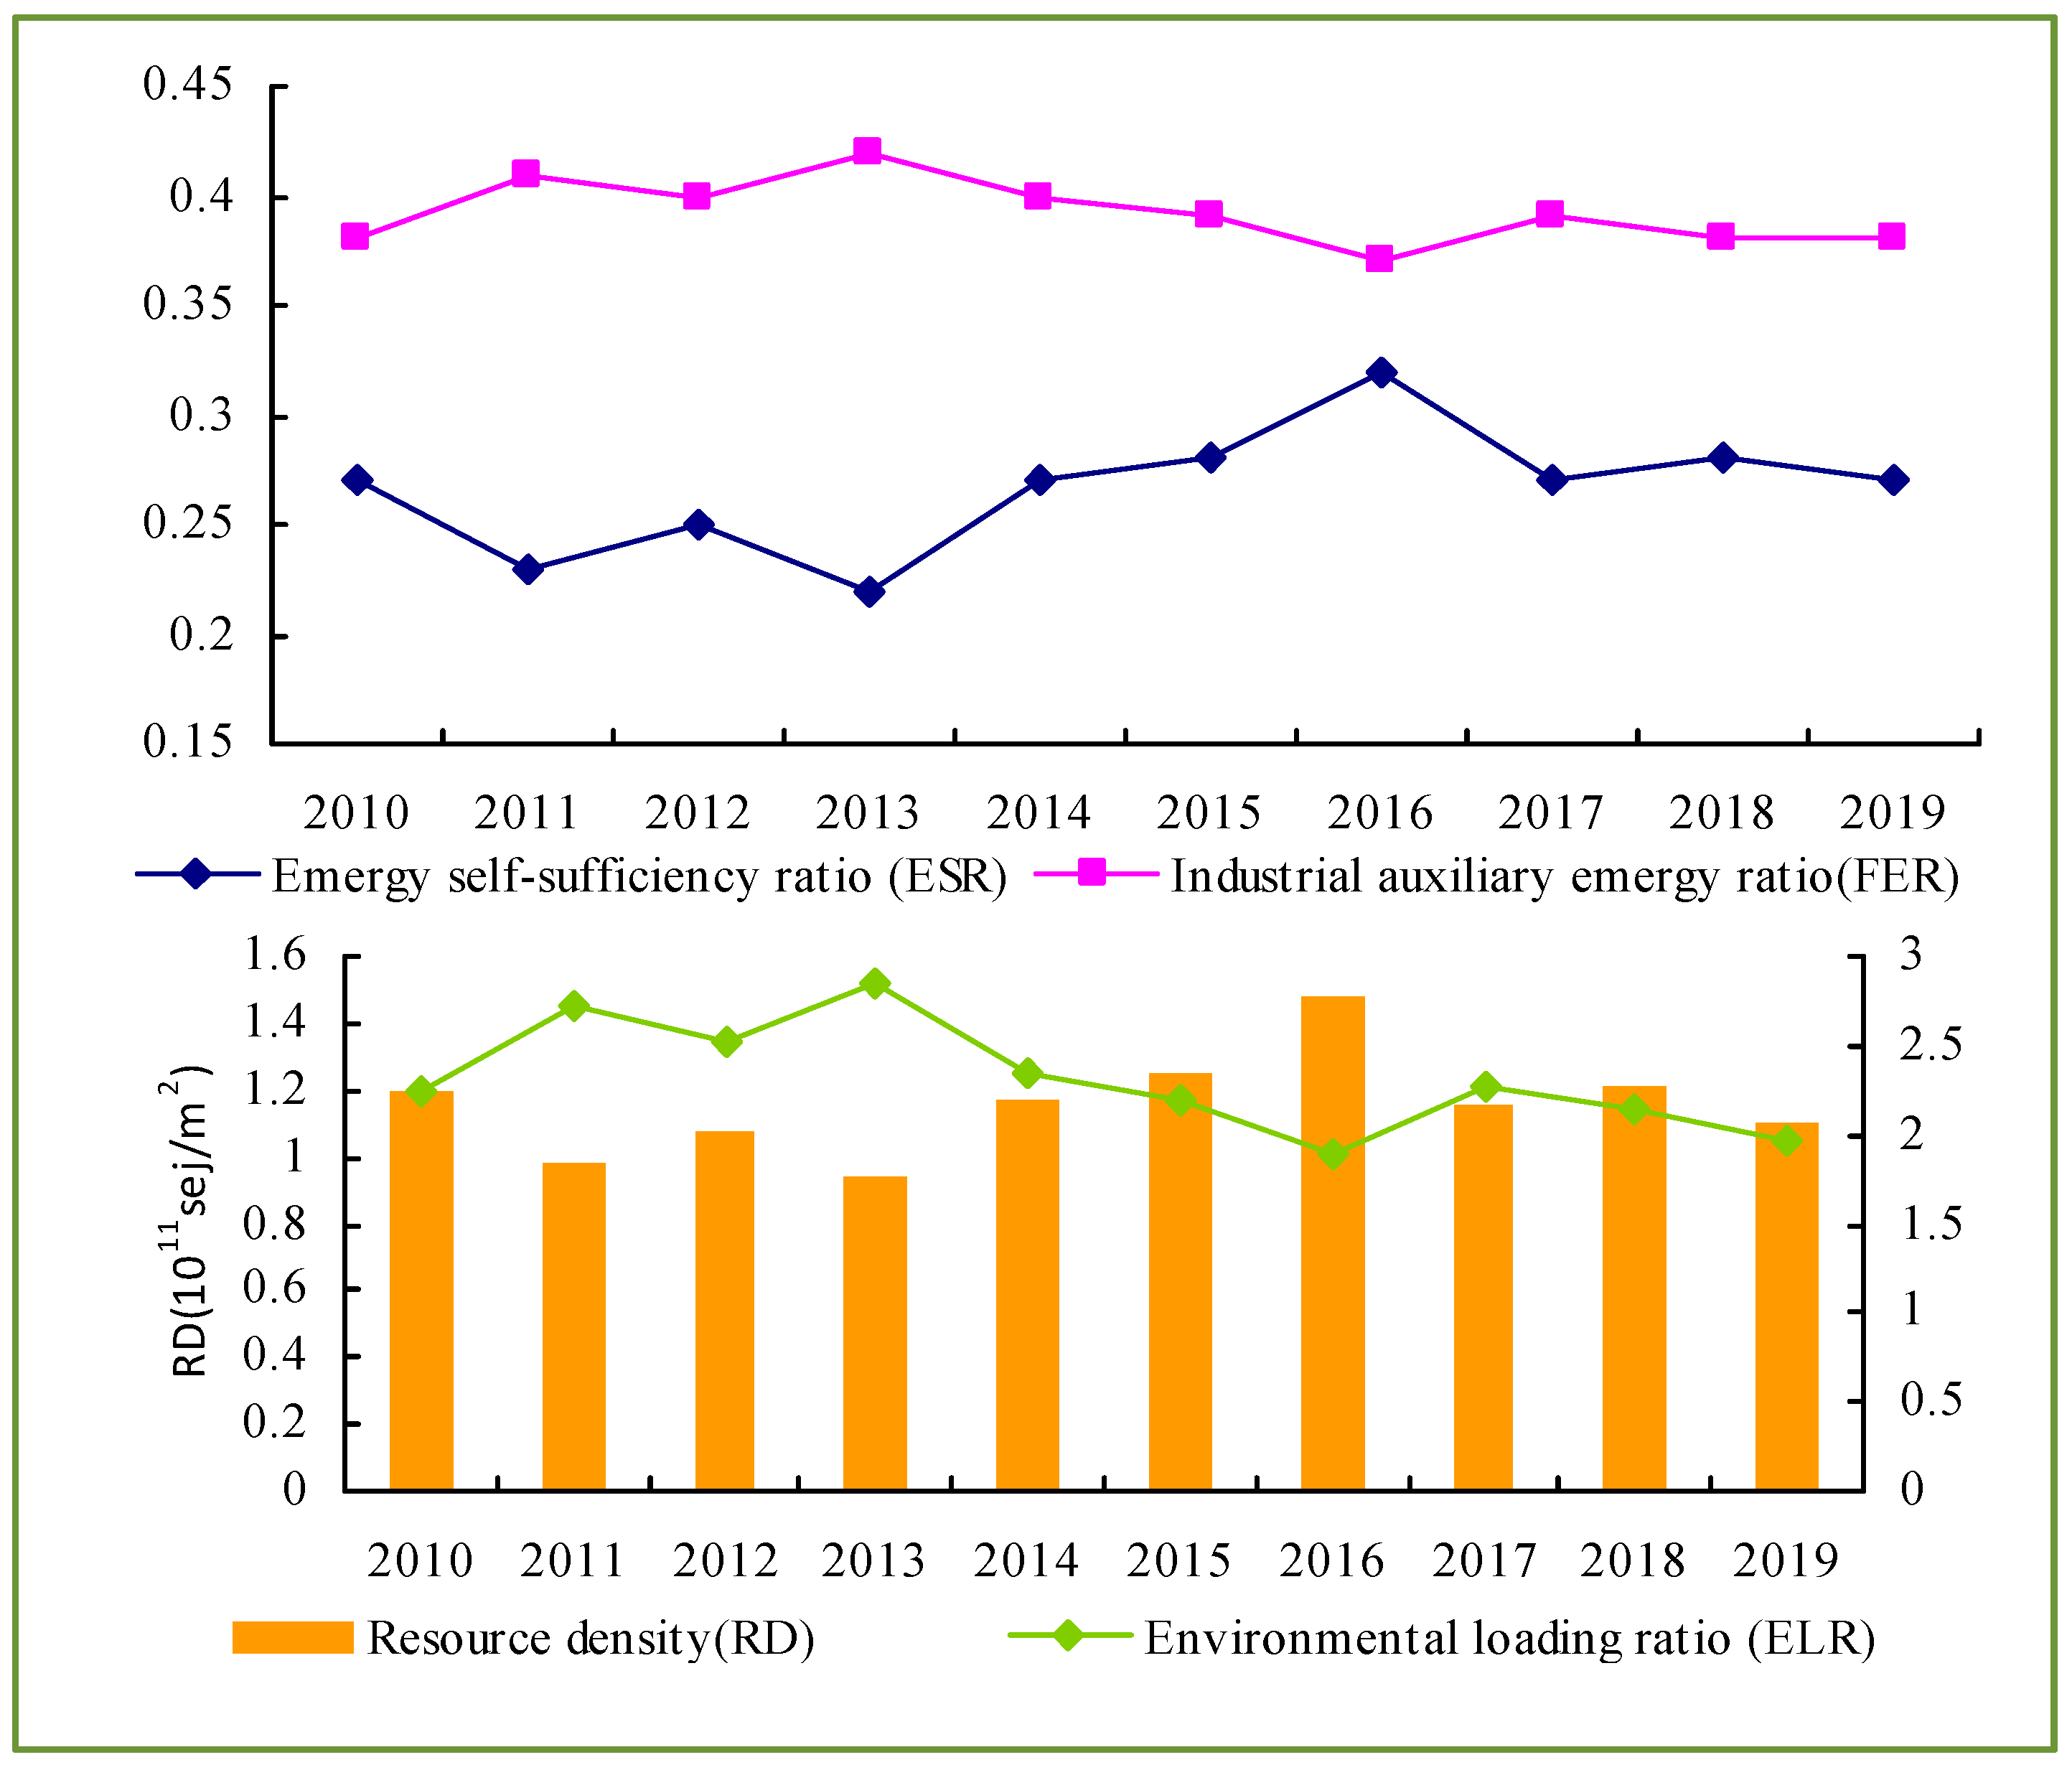
Agricultural Natural Ecosystem Evaluation Index
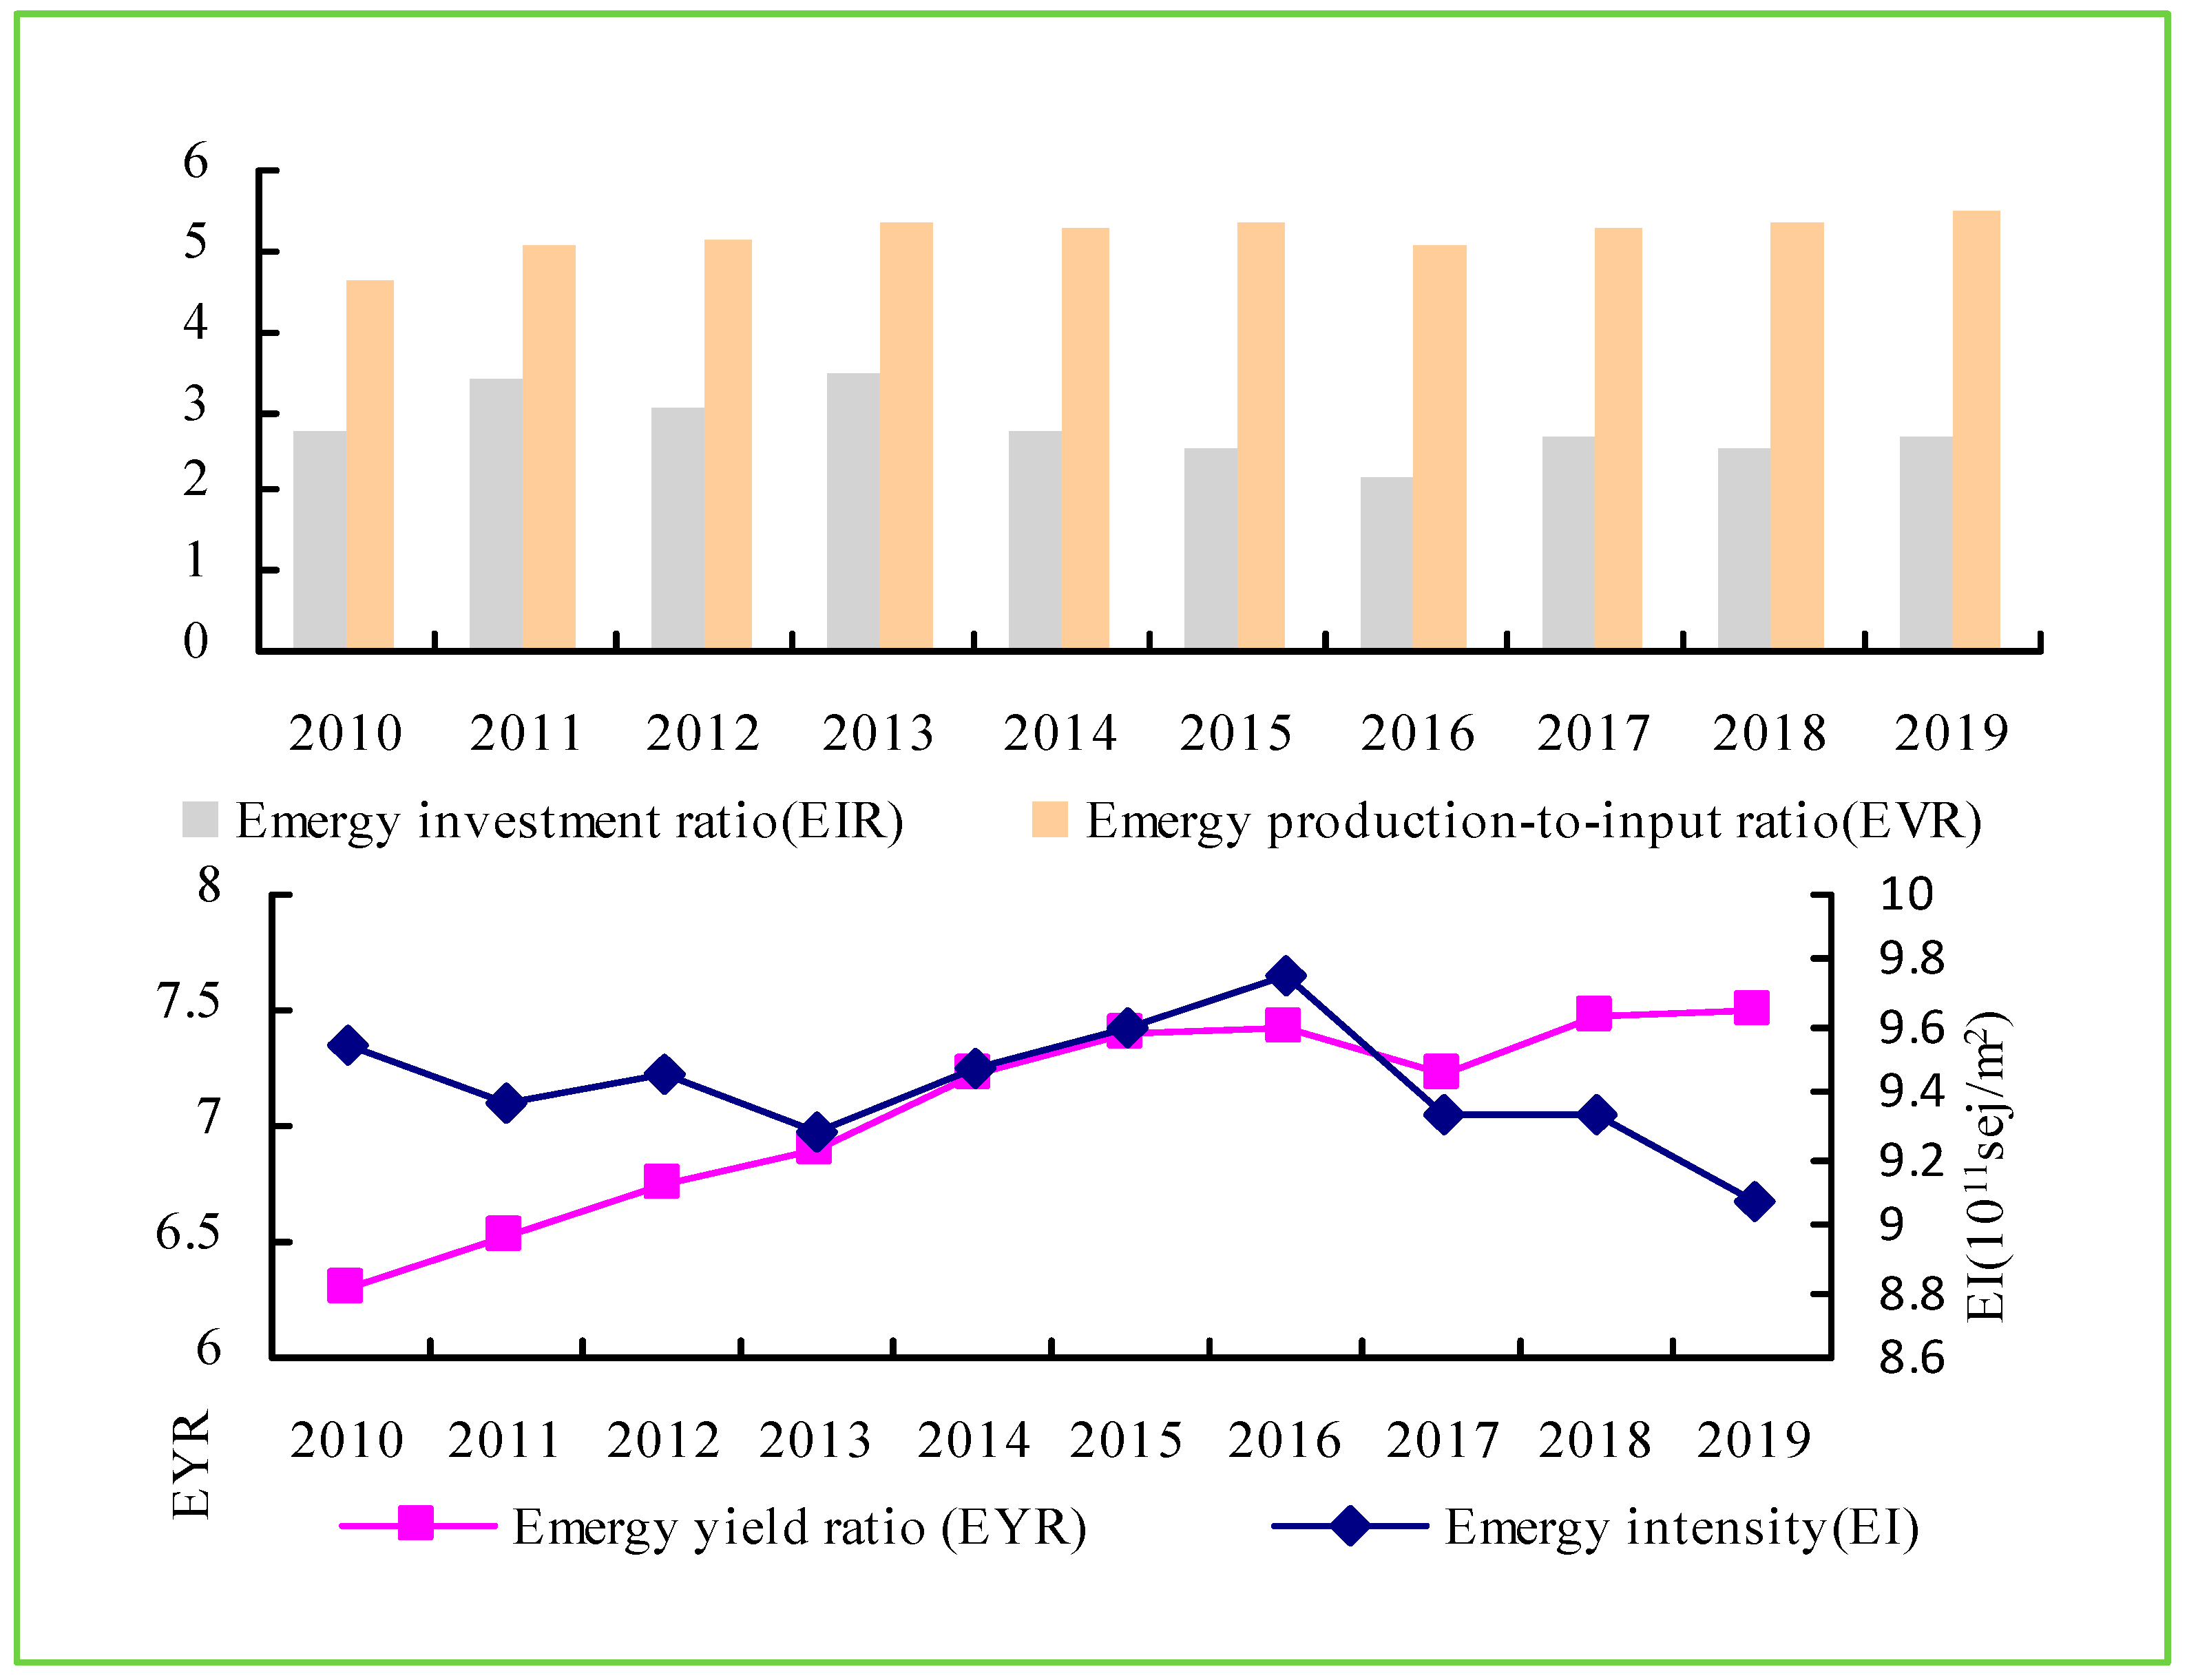
Agricultural Productivity and Economic Development Evaluation Indicators
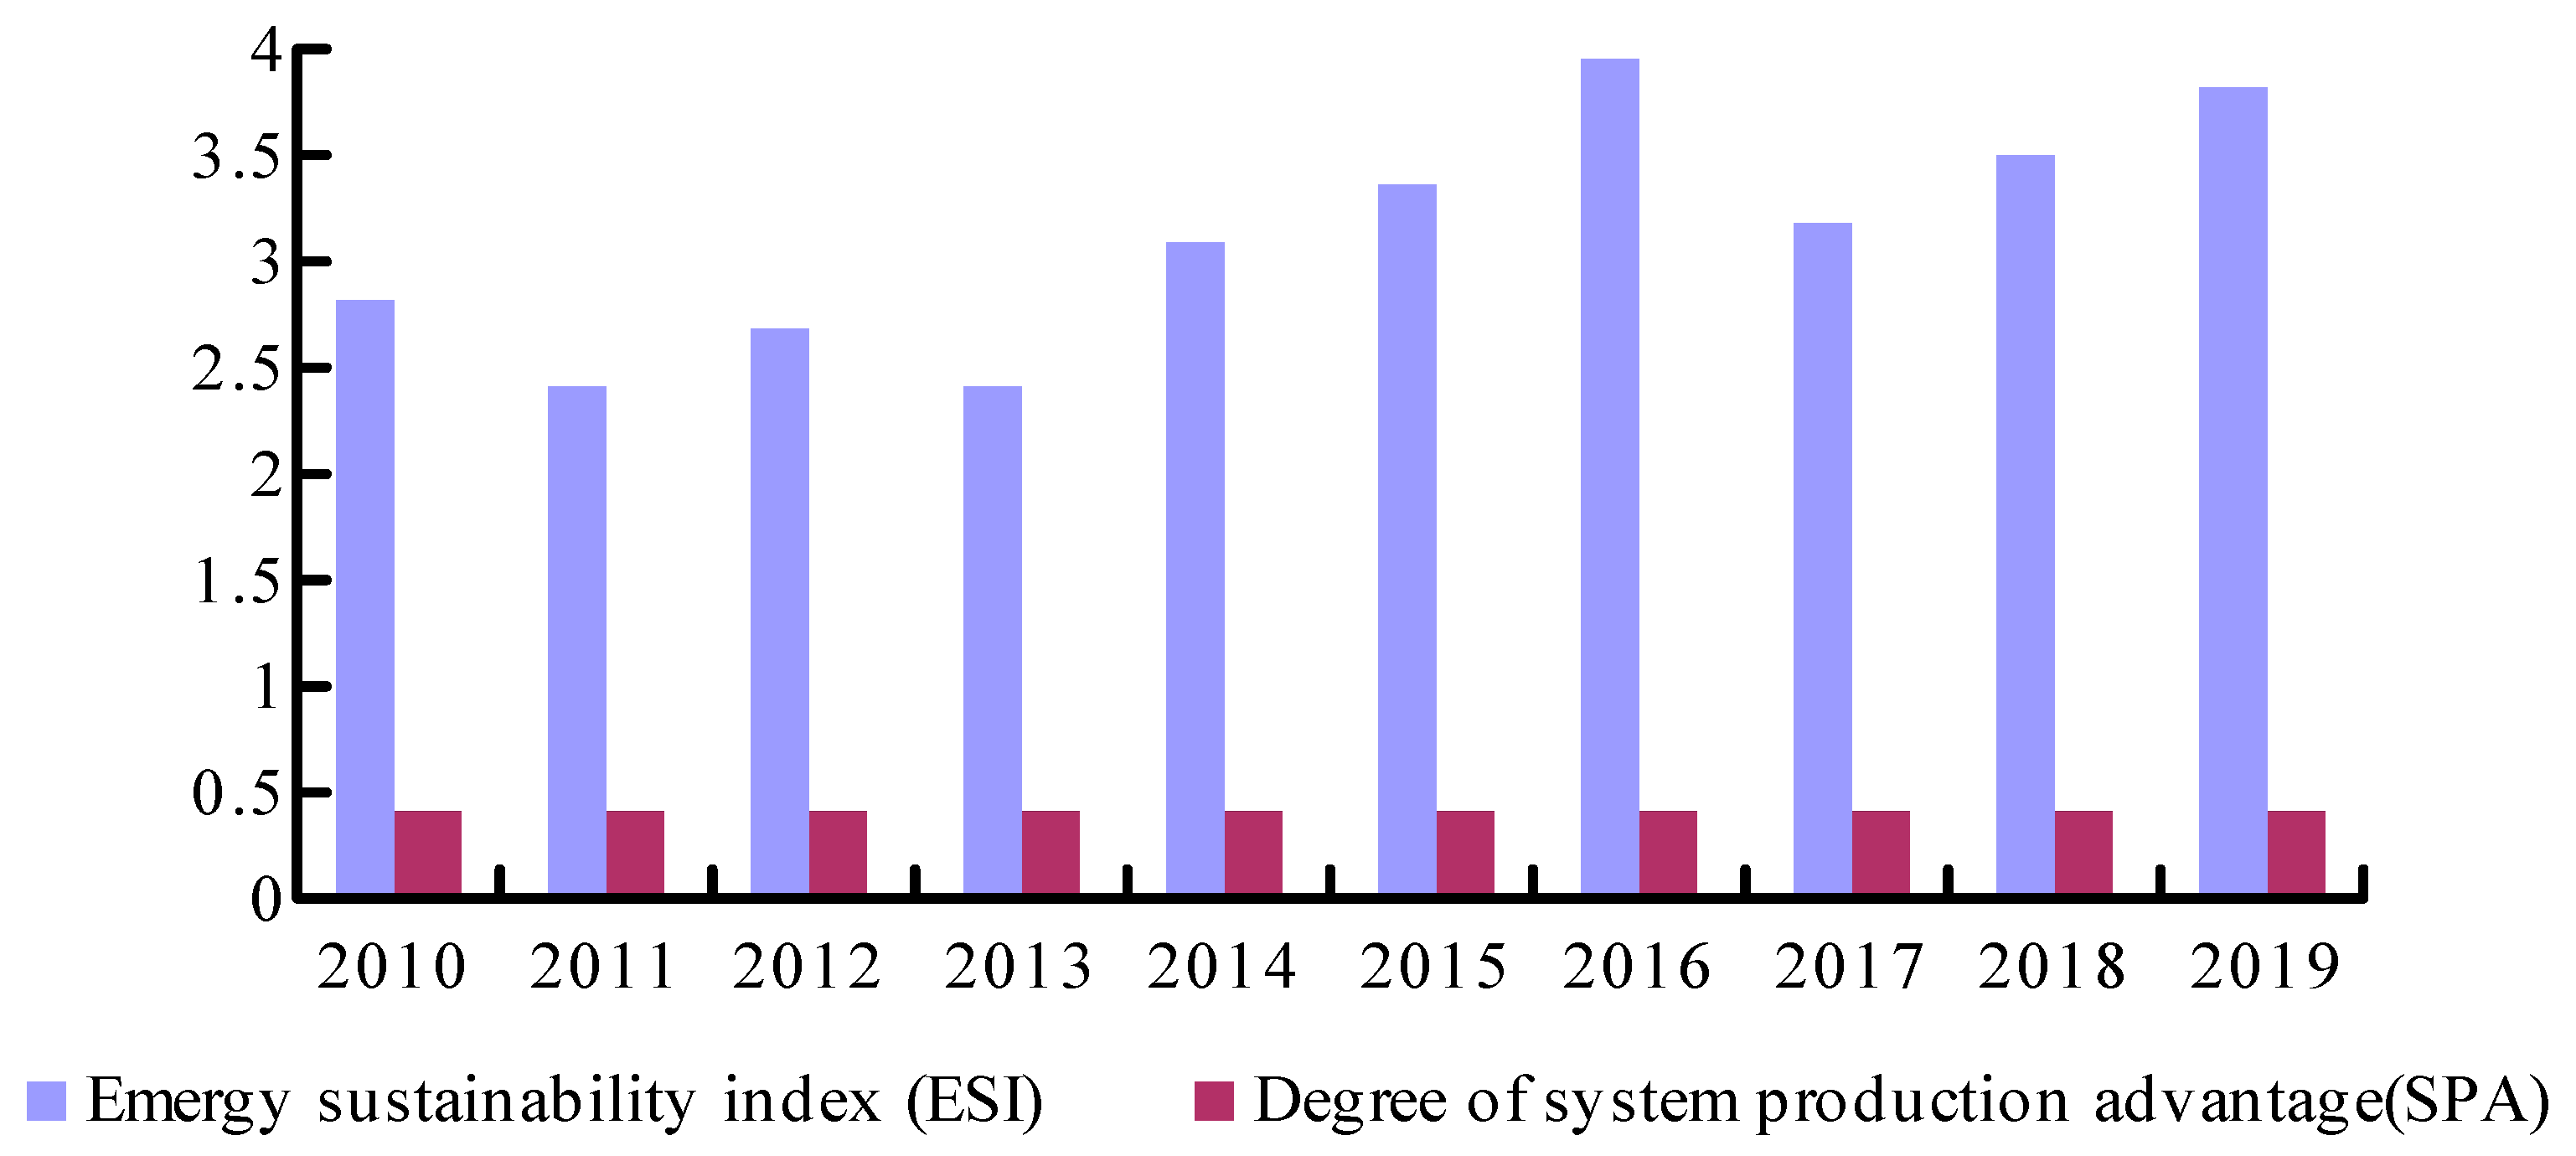
Comprehensive Index of Sustainable Development
3.3. Policy Recommendations
3.3.1. Reduce Non-Renewable Resource Inputs
3.3.2. Improve the Utilization Efficiency of Non-Renewable Industrial Auxiliary Emergy Resources
3.3.3. Develop Ecological Agriculture
3.3.4. Formulate a Reasonable Circular Economy Model according to Local Conditions
3.4. Management Suggestions
4. Conclusions
Author Contributions
Funding
Data Availability Statement
Conflicts of Interest
References
- Liu, C.; Cai, W.; Zhai, M.; Zhu, G.; Zhang, C.; Jiang, Z. Decoupling of wastewater eco-environmental damage and China’s economic development. Sci. Total Environ. 2021, 789, 147980. [Google Scholar] [CrossRef]
- Xu, L.; Wang, C.; Zhao, J. Decision and coordination in the dual-channel supply chain considering cap-and-trade regulation. J. Clean. Prod. 2018, 197, 551–561. [Google Scholar] [CrossRef]
- Peng, Q.; Wang, C.; Xu, L. Emission abatement and procurement strategies in a low-carbon supply chain with option contracts under stochastic demand. Comput. Ind. Eng. 2020, 144, 106502. [Google Scholar] [CrossRef]
- Liu, D.; Zhu, X.; Wang, Y. China’s agricultural green total factor productivity based on carbon emission: An analysis of evolution trend and influencing factors. J. Clean. Prod. 2020, 278, 123692. [Google Scholar] [CrossRef]
- Fu, L.; Liu, H.; Guo, S. Analysis of China’s Agricultural Non-Point Source Pollution and Green Total Factor Productivity. In Proceedings of the 6th International Conference on Economics, Management, Law and Education (EMLE 2020), Dubai, UAE, 4–6 February 2019. [Google Scholar]
- Inumula, K.M.; Singh, S.; Solanki, S. Energy consumption and agricultural economic growth nexus: Evidence from india. Int. J. Energy Econ. Policy 2020, 10, 545. [Google Scholar] [CrossRef]
- United Nations. Available online: https://www.un.org/sustainabledevelopment/hunger/ (accessed on 3 March 2016).
- Zahm, F.; Ugaglia, A.A.; Barbier, J.M.; Boureau, H.; Del’homme, B.; Gafsi, M.; Gasselin, P.; Girard, S.; Guichard, L.; Loyce, C.; et al. Assessing the sustainability of farms. The IDEA v4 method, a conceptual framework based on the dimensions and properties of sustainability. Cah. Agric. 2019, 28, 5. [Google Scholar] [CrossRef] [Green Version]
- Heylen, C.; Meunier, F.; Peeters, A.; Ek, S.; Neang, M.; Hean, S.; Peanh, S. Multidimensional benefits of sustainable agriculture practices of cambodian smallholder farmers. Sustain. Agric. Res. 2020, 9, 10–25. [Google Scholar] [CrossRef]
- Manap, N.B.; Voulvoulis, N.; Zulkifli, N.B. The application of driving force-pressure-state-impact-response (dpsir) in malaysia’s dredging industry. J. Food Agric. Environ. 2012, 10, 1031–1038. [Google Scholar]
- Sambasivam, V.P.; Thiyagarajan, G.; Kabir, G.; Ali, S.M.; Khan, S.; Zhang, Y. Selection of winter season crop pattern for environmental-friendly agricultural practices in india. Sustainability 2020, 12, 4562. [Google Scholar] [CrossRef]
- Javanmardi, E.; Liu, S.; Xie, N. Exploring grey systems theory-based methods and applications in sustainability studies: A systematic review approach. Sustainability 2020, 12, 4437. [Google Scholar] [CrossRef]
- Fonseca, E.; Caldeira, E.; Filho, H.; Oliveira, L.; Pereira, A.; Vilela, P.S. Agro 4.0: A Green Information System for Sustainable Agroecosystem Management. arXiv 2019, arXiv:1907.07762. [Google Scholar]
- Odum, H.T. Self-organization, transformity, and information. Science 1988, 242, 1132–1139. [Google Scholar] [CrossRef] [Green Version]
- Falahi, M.; Avami, A. Optimization of the municipal solid waste management system using a hybrid life cycle assessment-emergy approach in Tehran. J. Mater. Cycles Waste Manag. 2020, 22, 133–149. [Google Scholar] [CrossRef]
- Wei, Y.; Li, Y.; Liu, X.; Wu, M. Sustainable development and green gross domestic product assessments in megacities based on the emergy analysis method-A case study of Wuhan. Sustain. Dev. 2020, 28, 294–307. [Google Scholar] [CrossRef]
- Peng, W.; Wang, X.; Li, X.; He, C. Sustainability evaluation based on the emergy ecological footprint method: A case study of Qingdao, China, from 2004 to 2014. Ecol. Indic. 2018, 85, 1249–1261. [Google Scholar] [CrossRef]
- Wang, Z.; Junjie, M.A.; Pengfei, L.I.; Zhao, D.; Teng, T.; Yang, Y. Study on sustainability of three developed core districts in Xi’an based on emergy analysis. J. Earth Environ. 2018, 9, 210–222. [Google Scholar]
- Yazdani, S.; Deymi-Dashtebayaz, M.; Salimipour, E. Comprehensive comparison on the ecological performance and environmental sustainability of three energy storage systems employed for a wind farm by using an emergy analysis. Energy Convers. Manag. 2019, 191, 1–11. [Google Scholar] [CrossRef]
- Pan, H.; Geng, Y.; Tian, X.; Wilson, J.; Chen, W.; Zhong, S.; Song, X. Emergy-based environmental accounting of one mining system. Environ. Sci. Pollut. Res. 2019, 26, 14598–14615. [Google Scholar] [CrossRef]
- Liu, C.; Gao, M.; Zhu, G.; Zhang, C.; Cai, W. Data driven eco-efficiency evaluation and optimization in industrial production. Energy 2021, 224, 120170. [Google Scholar] [CrossRef]
- Zhao, H.; Zhai, X.; Guo, L.; Yang, Y.; Li, J.; Ren, C.; Wang, K.; Liu, X.; Zhan, R.; Wang, K. Comparing protected cucumber and field cucumber production systems in China based on emergy analysis. J. Clean. Prod. 2019, 236, 117648.1–117648.10. [Google Scholar] [CrossRef]
- Za, A.; Mra, A.; Dec, B.; Mas, C. Comparison of the sustainability of mechanized and traditional rapeseed production systems using an emergy-based production function: A case study in Lorestan Province, Iran. J. Clean. Prod. 2020, 258, 120891. [Google Scholar]
- Gu, X.; Lai, Q.; Liu, M.; He, Z.; Zhang, Q.; Min, Q. Sustainability Assessment of a Qingyuan Mushroom Culture System Based on Emergy. Sustainability 2019, 11, 4863. [Google Scholar] [CrossRef] [Green Version]
- Xie, H.; Huang, Y.; Choi, Y.; Shi, J. Evaluating the sustainable intensification of cultivated land use based on emergy analysis. Technol. Forecast. Soc. Chang. 2020, 165, 120449. [Google Scholar] [CrossRef]
- Asgharipour, M.R.; Amiri, Z.; Campbell, D.E.; Fath, B.D. Evaluation of the sustainability of four greenhouse vegetable production ecosystems based on an analysis of emergy and social characteristics. Ecol. Model. 2020, 424, 109021. [Google Scholar] [CrossRef]
- Ghisellini, P.; Zucaro, A.; Viglia, S.; Ulgiati, S. Monitoring and evaluating the sustainability of Italian agricultural system. An emergy decomposition analysis. Ecol. Model. 2014, 271, 132–148. [Google Scholar] [CrossRef]
- He, Z.; Jiang, L.; Wang, Z.; Zeng, R.; Liu, J. The emergy analysis of southern China agro-ecosystem and its relation with its regional sustainable development. Glob. Ecol. Conserv. 2019, 20, e00721. [Google Scholar] [CrossRef]
- Zhang, L.; Song, B.; Chen, B. Emergy-based analysis of four farming systems: Insight into agricultural diversification in rural China. J. Clean. Prod. 2012, 28, 33–44. [Google Scholar] [CrossRef]
- Zhang, L.; Ulgiati, S.; Yang, Z.; Chen, B. Emergy evaluation and economic analysis of three wetland fish farming systems in Nansi Lake area, China. J. Environ. Manag. 2011, 92, 683–694. [Google Scholar] [CrossRef] [PubMed]
- Ulgiati, S.; Brown, M.T. Monitoring Pattems of Sustainabnability in Natural and Man-made Ecosystems. Ecol. Model. 1998, 108, 23–36. [Google Scholar] [CrossRef]
- Odum, H.T. Environmental Accounting: Emergy and Environ-Mental Decision Making; Wiley: Hoboken, NJ, USA, 1996. [Google Scholar]
- Pulselli, R.M.; Rustici, M.; Marchettini, N. An Integrated Framework for Regional Studies: Emergy Based Spatial Analysis of the Province of Cagliari. Environ. Monit. Assess 2007, 133, 1–13. [Google Scholar] [CrossRef] [PubMed]
- Cheng, H.; Chen, C.; Wu, S.; Mirza, Z.A.; Liu, Z. Emergy evaluation of cropping, poultry rearing, and fish raising systems in thedrawdown zone of Three Gorges Reservoir of China. J. Clean. Prod. 2017, 144, 559–571. [Google Scholar] [CrossRef]
- Wang, X.; Li, Z.; Long, L.; Yan, L.; Gao, W.; Chen, Y.; Sui, P. Sustainability evaluation of recycling in agricultural systems by emergy accounting. Resour. Conserv. Recycl. 2017, 117, 114–124. [Google Scholar] [CrossRef]
- Cao, Z.; Hao, J.; Liang, L. Emergy Analysis of Agroecosystem in Huang-huai-hai Region. Res. Agric. Mod. 2009, 30, 466–470. [Google Scholar]
- Lan, S.; Odum, H.T.; Liu, X. Energy flow and emergy analysis of the agroecosystem of China. Ecol. Sci. 1998, 17, 32–39. [Google Scholar]
- Brandt-Williams, S.L. Folio 4: Emergy of Florida agriculture (2nd printing). In Handbook of Emergy Evaluation. Center for Environmental Policy; Environmental Engineering Science, University of Florida: Gainesville, FL, USA, 2002. [Google Scholar]
- González-Mejía, A.M.; Ma, X. The Emergy Perspective of Sustainable Trends in Puerto Rico From 1960 to 2013. Ecol. Econ. 2017, 133, 11–22. [Google Scholar] [CrossRef] [PubMed]
- Seta, A.K.; Blevins, R.L.; Frye, W.W.; Barfield, B.J. Reducing soil erosion and agricultural chemical losses with conservation tillage. J. Environ. Qual. 1993, 22, 661–665. [Google Scholar] [CrossRef]
- Lyons, S.E.; Osmond, D.L.; Slaton, N.A.; Spargo, J.T.; Mcgrath, J.M. Frst: A national soil testing database to improve fertility recommendations. Agric. Environ. Lett. 2020, 5, e20008. [Google Scholar] [CrossRef] [Green Version]
- Tiwari, R.; Tiwari, P.S.; Singh, A. Nutrient status of wheat growing soils in Meerut district of Uttar Pradesh. Asian J. Soil Sci. 2020, 15, 65–67. [Google Scholar] [CrossRef]
- Ma, S.; Kan, Z.; Qi, J.; Zhang, H. Effects of straw return mode on soil aggregates and associated carbon in the north china plain. Agronomy 2020, 10, 61. [Google Scholar] [CrossRef] [Green Version]
- Wyckhuys, K.; Lu, Y.; Zhou, W.; Cock, M.; Furlong, M.J. Ecological pest control fortifies agricultural growth in asia–pacific economies. Nat. Ecol. Evol. 2020, 4, 1522–1530. [Google Scholar] [CrossRef]


| Emergy Index | Expression | Remark |
|---|---|---|
| Underlying index | ||
| Renewable resource | R | Renewable emergy from nature, such as solar, wind, and rain energy |
| Non-renewable resource emergy | N | All kinds of non-renewable emergy from nature, such as coal, oil, and natural gas |
| Non-renewable industrial auxiliary emergy | F | The fraction of the emergy of imported resources that is considered to be of non-renewable origin |
| Organic emergy | T | Organic energy input into the system, including labor, seeds, organic fertilizers, etc. |
| Total emergy input | E = R + N + F + T | The total emergy flows needed to support a production system |
| Total yield | Y | The total emergy produced by the agroecological economic system |
| Natural ecosystem evaluation index | ||
| Emergy self-sufficiency ratio (ESR) | ESR = (R + N)/E | The supporting capacity of the natural environment |
| Industrial auxiliary emergy ratio (FER) | FER = F/E | Measures economic and environmental stress of agroecological economic system |
| Resource density (RD) | RD = (R + N)/A | Reflects the abundance of natural resources |
| Environmental loading ratio (ELR) | ELR = (F + N)/R | Evaluates the impact of activities on the environment |
| Productivity and economic development evaluation index | ||
| Emergy investment ratio (EIR) | EIR = (F + T)/(R + N) | Measures the degree of economic development and environmental load |
| Emergy yield ratio (EYR) | EYR = Y/(F + T) | Measures the contribution of system output to the economy |
| Emergy intensity (EI) | EI = E/A | Reflects the land-use efficiency |
| Emergy production-to-input ratio (EVR) | EVR = Y/E | Reflects the economic benefits of the system |
| Sustainable development index | ||
| Emergy sustainability index (ESI) | ESI = EYR/ELR | Measures the status and level of sustainable development |
| Degree of system production advantage (SPA) | The production unit equilibrium that reflects the overall system structure | |
| Input | Unit | Transformity (Sej/Unit) | References | Output | Unit | Transformity (Sej/Unit) | References | ||
|---|---|---|---|---|---|---|---|---|---|
| 1 | Solar energy | J | 1 | Odum (1996) | 1 | Wheat | J | 1.14 × 10⁵ | Lan et al. (1998) |
| 2 | Wind energy | J | 6.63 × 10² | Odum (1996) | 2 | Rice | J | 6.03 × 10⁴ | Lan et al. (1998) |
| 3 | Chemical energy of rainwater | J | 1.54 × 10⁴ | Odum (1996) | 3 | Maize | J | 2.70 × 10⁴ | Chao et al. (2009) |
| 4 | Potential energy of rainwater | J | 8.89 × 10³ | Odum (1996) | 4 | Beans | J | 8.30 × 10⁴ | Ulgiati et al. (1993) |
| 5 | Soil Loss | J | 1.24 × 10⁵ | Wang et al. (2017) | 5 | Peanut | J | 8.60 × 10⁴ | Ulgiati et al. (1993) |
| 6 | N fertilizer | g | 4.83 × 10⁹ | Odum (1996) | 6 | Rapeseed | J | 8.60 × 10⁴ | Ulgiati et al. (1993) |
| 7 | P fertilizer | g | 4.95 × 10⁹ | Odum (1996) | 7 | Cotton | J | 1.36 × 10⁴ | Brandt-Williams (2002) |
| 8 | K fertilizer | g | 1.40 × 10⁹ | Odum (1996) | 8 | Vegetable | J | 4.54 × 10⁴ | Lan et al. (1998) |
| 9 | Compound fertilizer | g | 3.56 × 10¹⁰ | Odum (1996) | 9 | Amphisarca | g | 6.87 × 10⁹ | González-Mejía (2017) |
| 10 | Pesticide | g | 4.81 × 10⁹ | Cheng et al. (2017) | 10 | Pork | J | 1.70 × 10⁶ | Chao et al. (2009) |
| 11 | Agricultural film | g | 3.80 × 10⁸ | Chao et al. (2009) | 11 | Beef | J | 4.00 × 10⁶ | Chao et al. (2009) |
| 12 | Agricultural machinery | J | 7.50 × 10⁷ | Chao et al. (2009) | 12 | Mutton | J | 2.00 × 10⁶ | Chao et al. (2009) |
| 13 | Electric power | J | 2.00 × 10⁴ | Cheng et al. (2017) | 13 | Egg | J | 1.71 × 10⁶ | Chao et al. (2009) |
| 14 | Diesel | J | 2.00 × 10⁴ | Cheng et al. (2017) | 14 | Milk | J | 1.71 × 10⁶ | Chao et al. (2009) |
| 15 | Organic fertilizer | g | 1.35 × 10¹⁰ | Odum (1996) | 15 | Other meat | J | 2.00 × 10⁶ | Chao et al. (2009) |
| 16 | Labor | J | 1.26 × 10⁸ | Cheng et al. (2017) | 16 | Forestry product | J | 1.54 × 10¹⁰ | Pulselli et al. (2007) |
| 17 | Seed | g | 3.36 × 10⁵ | Lan et al. (1998) | 17 | Fishery product | J | 3.30 × 10¹⁰ | Cheng et al. (2017) |
| Project | 2010 | 2011 | 2012 | 2013 | 2014 | 2015 | 2016 | 2017 | 2018 | 2019 | |
|---|---|---|---|---|---|---|---|---|---|---|---|
| Renewable Resources (R) | 1.01 × 10²² | 8.18 × 10²¹ | 9.03 × 10²¹ | 7.87 × 10²¹ | 9.83 × 10²¹ | 1.05 × 10²² | 1.24 × 10²² | 9.65 × 10²¹ | 1.01 × 10²² | 9.83 × 10²¹ | |
| 1 | Solar energy | 3.78 × 10¹⁹ | 3.71 × 10¹⁹ | 3.74 × 10¹⁹ | 3.88 × 10¹⁹ | 3.79 × 10¹⁹ | 3.76 × 10¹⁹ | 3.86 × 10¹⁹ | 3.90 × 10¹⁹ | 3.88 × 10¹⁹ | 5.31 × 10¹⁹ |
| 2 | Wind energy | 5.65 × 10²⁰ | 5.65 × 10²⁰ | 5.65 × 10²⁰ | 5.65 × 10²⁰ | 5.65 × 10²⁰ | 5.65 × 10²⁰ | 5.65 × 10²⁰ | 5.65 × 10²⁰ | 5.65 × 10²⁰ | 7.72 × 10²⁰ |
| 3 | Chemical energy of rainwater | 1.01 × 10²² | 8.18 × 10²¹ | 9.03 × 10²¹ | 7.87 × 10²¹ | 9.83 × 10²¹ | 1.05 × 10²² | 1.24 × 10²² | 9.65 × 10²¹ | 1.01 × 10²² | 9.83 × 10²¹ |
| 4 | Potential energy of rainwater | 1.52 × 10²¹ | 1.23 × 10²¹ | 1.36 × 10²¹ | 1.19 × 10²¹ | 1.48 × 10²¹ | 1.58 × 10²¹ | 1.87 × 10²¹ | 1.46 × 10²¹ | 1.52 × 10²¹ | 1.48 × 10²¹ |
| Non-Renewable Resources (N) | 3.34 × 10²¹ | 2.72 × 10²¹ | 3.00 × 10²¹ | 2.61 × 10²¹ | 3.27 × 10²¹ | 3.48 × 10²¹ | 4.12 × 10²¹ | 3.21 × 10²¹ | 3.36 × 10²¹ | 2.39 × 10²¹ | |
| 5 | Soil Loss | 3.34 × 10²¹ | 2.72 × 10²¹ | 3.00 × 10²¹ | 2.61 × 10²¹ | 3.27 × 10²¹ | 3.48 × 10²¹ | 4.12 × 10²¹ | 3.21 × 10²¹ | 3.36 × 10²¹ | 2.39 × 10²¹ |
| Non-renewable industrial auxiliary emergy (F) | 1.93 × 10²² | 1.96 × 10²² | 1.97 × 10²² | 1.98 × 10²² | 1.98 × 10²² | 1.96 × 10²² | 1.92 × 10²² | 1.88 × 10²² | 1.83 × 10²² | 1.70 × 10²² | |
| 6 | N fertilizer | 4.92 × 10²¹ | 5.02 × 10²¹ | 5.01 × 10²¹ | 4.98 × 10²¹ | 4.90 × 10²¹ | 4.72 × 10²¹ | 4.60 × 10²¹ | 4.42 × 10²¹ | 4.20 × 10²¹ | 3.86 × 10²¹ |
| 7 | P fertilizer | 3.65 × 10²¹ | 3.67 × 10²¹ | 3.71 × 10²¹ | 3.61 × 10²¹ | 3.63 × 10²¹ | 3.46 × 10²¹ | 3.26 × 10²¹ | 3.29 × 10²¹ | 2.87 × 10²¹ | 2.66 × 10²¹ |
| 8 | K fertilizer | 8.24 × 10²⁰ | 8.50 × 10²⁰ | 8.42 × 10²⁰ | 8.13 × 10²⁰ | 8.43 × 10²⁰ | 8.31 × 10²⁰ | 7.96 × 10²⁰ | 7.70 × 10²⁰ | 7.22 × 10²⁰ | 6.96 × 10²⁰ |
| 9 | Compound fertilizer | 2.22 × 10²¹ | 2.33 × 10²¹ | 2.39 × 10²¹ | 2.51 × 10²¹ | 2.57 × 10²¹ | 2.62 × 10²¹ | 2.53 × 10²¹ | 2.48 × 10²¹ | 2.54 × 10²¹ | 2.49 × 10²¹ |
| 10 | Pesticide | 1.89 × 10²⁰ | 1.90 × 10²⁰ | 1.89 × 10²⁰ | 1.91 × 10²⁰ | 1.84 × 10²⁰ | 1.80 × 10²⁰ | 1.71 × 10²⁰ | 1.61 × 10²⁰ | 1.52 × 10²⁰ | 1.43 × 10²⁰ |
| 11 | Agricultural film | 2.35 × 10¹⁵ | 2.50 × 10¹⁵ | 2.65 × 10¹⁵ | 2.76 × 10¹⁵ | 2.80 × 10¹⁵ | 2.85 × 10¹⁵ | 2.82 × 10¹⁵ | 2.84 × 10¹⁵ | 2.85 × 10¹⁵ | 3.02 × 10¹⁵ |
| 12 | Agricultural machinery | 7.46 × 10²¹ | 7.52 × 10²¹ | 7.59 × 10²¹ | 7.65 × 10²¹ | 7.71 × 10²¹ | 7.77 × 10²¹ | 7.85 × 10²¹ | 7.70 × 10²¹ | 7.76 × 10²¹ | 7.13 × 10²¹ |
| 13 | Electric power | 6.15 × 10¹⁸ | 6.71 × 10¹⁸ | 7.37 × 10¹⁸ | 7.92 × 10¹⁸ | 8.44 × 10¹⁸ | 8.97 × 10¹⁸ | 9.25 × 10¹⁸ | 9.80 × 10¹⁸ | 1.03 × 10¹⁹ | 1.08 × 10¹⁹ |
| 14 | Diesel | 4.49 × 10¹⁶ | 4.64 × 10¹⁶ | 4.75 × 10¹⁶ | 4.84 × 10¹⁶ | 4.84 × 10¹⁶ | 4.99 × 10¹⁶ | 4.99 × 10¹⁶ | 4.98 × 10¹⁶ | 4.98 × 10¹⁶ | 4.92 × 10¹⁶ |
| Organic energy (T) | 1.78 × 10²² | 1.74 × 10²² | 1.71 × 10²² | 1.65 × 10²² | 1.63 × 10²² | 1.63 × 10²² | 1.61 × 10²² | 1.59 × 10²² | 1.59 × 10²² | 1.60 × 10²² | |
| 15 | Organic fertilizer | 2.67 × 10²⁰ | 2.68 × 10²⁰ | 2.68 × 10²⁰ | 2.67 × 10²⁰ | 2.66 × 10²⁰ | 2.69 × 10²⁰ | 2.67 × 10²⁰ | 2.68 × 10²⁰ | 2.68 × 10²⁰ | 2.68 × 10²⁰ |
| 16 | Labor | 1.75 × 10²² | 1.72 × 10²² | 1.69 × 10²² | 1.63 × 10²² | 1.60 × 10²² | 1.60 × 10²² | 1.58 × 10²² | 1.56 × 10²² | 1.57 × 10²² | 1.57 × 10²² |
| 17 | Seed | 6.44 × 10¹⁷ | 6.55 × 10¹⁷ | 6.87 × 10¹⁷ | 6.85 × 10¹⁷ | 7.14 × 10¹⁷ | 7.39 × 10¹⁷ | 7.14 × 10¹⁷ | 7.26 × 10¹⁷ | 8.37 × 10¹⁷ | 8.47 × 10¹⁷ |
| Total emergy input (E) | 5.05 × 10²² | 4.79 × 10²² | 4.89 × 10²² | 4.68 × 10²² | 4.92 × 10²² | 4.98 × 10²² | 5.18 × 10²² | 4.76 × 10²² | 4.77 × 10²² | 4.52 × 10²² |
| Project | 2010 | 2011 | 2012 | 2013 | 2014 | 2015 | 2016 | 2017 | 2018 | 2019 | |
|---|---|---|---|---|---|---|---|---|---|---|---|
| Crop farming | 6.15 × 10²² | 6.78 × 10²² | 6.50 × 10²² | 6.28 × 10²² | 6.55 × 10²² | 6.51 × 10²² | 6.21 × 10²² | 6.05 × 10²² | 6.00 × 10²² | 5.92 × 10²² | |
| 1 | Wheat | 1.38 × 10²² | 1.35 × 10²² | 1.43 × 10²² | 1.48 × 10²² | 1.54 × 10²² | 1.84 × 10²² | 1.54 × 10²² | 1.54 × 10²² | 1.78 × 10²² | 1.84 × 10²² |
| 2 | Rice | 1.81 × 10²² | 1.74 × 10²² | 1.75 × 10²² | 1.71 × 10²² | 1.75 × 10²² | 2.03 × 10²² | 1.76 × 10²² | 1.84 × 10²² | 2.11 × 10²² | 2.04 × 10²² |
| 3 | Maize | 1.56 × 10²¹ | 1.60 × 10²¹ | 1.88 × 10²¹ | 1.87 × 10²¹ | 2.05 × 10²¹ | 2.99 × 10²¹ | 2.05 × 10²¹ | 1.96 × 10²¹ | 2.62 × 10²¹ | 2.83 × 10²¹ |
| 4 | Beans | 1.49 × 10²¹ | 1.59 × 10²¹ | 1.67 × 10²¹ | 1.58 × 10²¹ | 1.70 × 10²¹ | 1.33 × 10²¹ | 1.82 × 10²¹ | 1.89 × 10²¹ | 1.43 × 10²¹ | 1.40 × 10²¹ |
| 5 | Peanut | 9.77 × 10²⁰ | 1.21 × 10²¹ | 1.25 × 10²¹ | 1.27 × 10²¹ | 1.36 × 10²¹ | 1.01 × 10²¹ | 1.30 × 10²¹ | 1.30 × 10²¹ | 1.02 × 10²¹ | 1.01 × 10²¹ |
| 6 | Rapeseed | 1.45 × 10²¹ | 1.76 × 10²¹ | 1.93 × 10²¹ | 1.87 × 10²¹ | 1.83 × 10²¹ | 1.39 × 10²¹ | 1.68 × 10²¹ | 1.59 × 10²¹ | 1.21 × 10²¹ | 1.25 × 10²¹ |
| 7 | Cotton | 1.47 × 10²² | 2.14 × 10²² | 1.68 × 10²² | 1.43 × 10²² | 1.50 × 10²² | 8.41 × 10²¹ | 1.05 × 10²² | 8.13 × 10²¹ | 5.04 × 10²¹ | 3.16 × 10²¹ |
| 8 | Vegetable | 1.37 × 10²¹ | 1.49 × 10²¹ | 1.57 × 10²¹ | 1.63 × 10²¹ | 1.72 × 10²¹ | 1.83 × 10²¹ | 1.95 × 10²¹ | 1.95 × 10²¹ | 1.43 × 10²¹ | 1.49 × 10²¹ |
| 9 | Amphisarca | 8.15 × 10²¹ | 7.89 × 10²¹ | 8.14 × 10²¹ | 8.46 × 10²¹ | 8.88 × 10²¹ | 9.52 × 10²¹ | 9.84 × 10²¹ | 9.84 × 10²¹ | 8.39 × 10²¹ | 9.21 × 10²¹ |
| Animal husbandry | 1.35 × 10²³ | 1.35 × 10²³ | 1.43 × 10²³ | 1.46 × 10²³ | 1.51 × 10²³ | 1.55 × 10²³ | 1.53 × 10²³ | 1.47 × 10²³ | 1.52 × 10²³ | 1.43 × 10²³ | |
| 10 | Pork | 8.12 × 10²² | 7.92 × 10²² | 8.49 × 10²² | 8.62 × 10²² | 9.00 × 10²² | 8.81 × 10²² | 8.33 × 10²² | 8.25 × 10²² | 8.29 × 10²² | 6.73 × 10²² |
| 11 | Beef | 6.95 × 10²¹ | 6.42 × 10²¹ | 6.53 × 10²¹ | 6.53 × 10²¹ | 6.44 × 10²¹ | 5.83 × 10²¹ | 5.94 × 10²¹ | 2.91 × 10²¹ | 3.13 × 10²¹ | 3.42 × 10²¹ |
| 12 | Mutton | 3.64 × 10²¹ | 3.63 × 10²¹ | 3.74 × 10²¹ | 3.84 × 10²¹ | 3.97 × 10²¹ | 4.24 × 10²¹ | 4.44 × 10²¹ | 4.23 × 10²¹ | 4.39 × 10²¹ | 4.82 × 10²¹ |
| 13 | Egg | 1.81 × 10²² | 1.85 × 10²² | 1.92 × 10²² | 1.98 × 10²² | 1.98 × 10²² | 2.21 × 10²² | 2.33 × 10²² | 2.21 × 10²² | 2.26 × 10²² | 2.41 × 10²² |
| 14 | Milk | 1.51 × 10²² | 1.65 × 10²² | 1.77 × 10²² | 1.86 × 10²² | 2.05 × 10²² | 2.25 × 10²² | 2.40 × 10²² | 2.35 × 10²² | 2.42 × 10²² | 2.66 × 10²² |
| 15 | Other meat | 1.01 × 10²² | 1.02 × 10²² | 1.06 × 10²² | 1.08 × 10²² | 1.06 × 10²² | 1.19 × 10²² | 1.25 × 10²² | 1.17 × 10²² | 1.43 × 10²² | 1.66 × 10²² |
| Forestry | 3.37 × 10²¹ | 3.64 × 10²¹ | 3.65 × 10²¹ | 3.51 × 10²¹ | 4.25 × 10²¹ | 4.17 × 10²¹ | 4.11 × 10²¹ | 4.09 × 10²¹ | 4.04 × 10²¹ | 3.75 × 10²¹ | |
| 16 | Forestry product | 3.37 × 10²¹ | 3.64 × 10²¹ | 3.65 × 10²¹ | 3.51 × 10²¹ | 4.25 × 10²¹ | 4.17 × 10²¹ | 4.11 × 10²¹ | 4.09 × 10²¹ | 4.04 × 10²¹ | 3.75 × 10²¹ |
| Fishery | 3.30 × 10²² | 3.59 × 10²² | 3.73 × 10²² | 3.88 × 10²² | 4.03 × 10²² | 4.15 × 10²² | 4.24 × 10²² | 3.92 × 10²² | 4.05 × 10²² | 4.17 × 10²² | |
| 17 | Fishery product | 3.30 × 10²² | 3.59 × 10²² | 3.73 × 10²² | 3.88 × 10²² | 4.03 × 10²² | 4.15 × 10²² | 4.24 × 10²² | 3.92 × 10²² | 4.05 × 10²² | 4.17 × 10²² |
| Total yield | 2.33 × 10²³ | 2.42 × 10²³ | 2.49 × 10²³ | 2.51 × 10²³ | 2.61 × 10²³ | 2.65 × 10²³ | 2.62 × 10²³ | 2.51 × 10²³ | 2.56 × 10²³ | 2.47 × 10²³ |
| Project | 2010 | 2011 | 2012 | 2013 | 2014 | 2015 | 2016 | 2017 | 2018 | 2019 |
|---|---|---|---|---|---|---|---|---|---|---|
| Underlying index | ||||||||||
| Renewable resource (sej) | 1.01 × 10²² | 8.18 × 10²¹ | 9.03 × 10²¹ | 7.87 × 10²¹ | 9.83 × 10²¹ | 1.05 × 10²¹ | 1.24 × 10²² | 9.65 × 10²¹ | 1.01 × 10²² | 9.83 × 10²¹ |
| Non-renewable resource emergy (sej) | 3.34 × 10²¹ | 2.72 × 10²¹ | 3.00 × 10²¹ | 2.61 × 10²¹ | 3.27 × 10²¹ | 3.48 × 10²¹ | 4.12 × 10²¹ | 3.21 × 10²¹ | 3.36 × 10²¹ | 2.39 × 10²¹ |
| Non-renewable industrial auxiliary emergy (sej) | 1.93 × 10²² | 1.96 × 10²² | 1.97 × 10²² | 1.98 × 10²² | 1.98 × 10²² | 1.96 × 10²² | 1.92 × 10²² | 1.88 × 10²² | 1.83 × 10²² | 1.70 × 10²² |
| Organic emergy (sej) | 1.78 × 10²² | 1.74 × 10²² | 1.71 × 10²² | 1.65 × 10²² | 1.63 × 10²² | 1.63 × 10²² | 1.61 × 10²² | 1.59 × 10²² | 1.59 × 10²² | 1.60 × 10²² |
| Total emergy input (sej) | 5.05 × 10²² | 4.79 × 10²² | 4.89 × 10²² | 4.68 × 10²² | 4.92 × 10²² | 4.98 × 10²² | 5.18 × 10²² | 4.76 × 10²² | 4.77 × 10²² | 4.52 × 10²² |
| Total yield (sej) | 2.33 × 10²³ | 2.42 × 10²³ | 2.49 × 10²³ | 2.51 × 10²³ | 2.61 × 10²³ | 2.65 × 10²³ | 2.62 × 10²³ | 2.51 × 10²³ | 2.56 × 10²³ | 2.47 × 10²³ |
| Natural ecosystem evaluation index | ||||||||||
| Emergy self-sufficiency ratio (ESR) | 0.27 | 0.23 | 0.25 | 0.22 | 0.27 | 0.28 | 0.32 | 0.27 | 0.28 | 0.27 |
| Industrial auxiliary emergy ratio (FER) | 0.38 | 0.41 | 0.40 | 0.42 | 0.40 | 0.39 | 0.37 | 0.39 | 0.38 | 0.38 |
| Resource density (RD) (1011 sej/m2) | 1.20 | 0.98 | 1.08 | 0.94 | 1.17 | 1.25 | 1.48 | 1.16 | 1.21 | 1.10 |
| Environmental loading ratio (ELR) | 2.24 | 2.73 | 2.51 | 2.85 | 2.35 | 2.20 | 1.88 | 2.28 | 2.14 | 1.97 |
| Productivity and economic development evaluation index | ||||||||||
| Emergy investment ratio (EIR) | 2.76 | 3.40 | 3.06 | 3.47 | 2.76 | 2.56 | 2.14 | 2.70 | 2.54 | 2.70 |
| Emergy yield ratio (EYR) | 6.29 | 6.53 | 6.76 | 6.91 | 7.23 | 7.39 | 7.42 | 7.23 | 7.48 | 7.50 |
| Emergy intensity (EI) (1011 sej/m2) | 9.55 | 9.37 | 9.46 | 9.28 | 9.48 | 9.59 | 9.76 | 9.34 | 9.34 | 9.08 |
| Emergy production-to-input ratio (EVR) | 4.61 | 5.05 | 5.10 | 5.36 | 5.30 | 5.32 | 5.06 | 5.28 | 5.37 | 5.47 |
| Sustainable development index | ||||||||||
| Emergy sustainability index (ESI) | 2.80 | 2.39 | 2.69 | 2.43 | 3.08 | 3.36 | 3.95 | 3.17 | 3.49 | 3.80 |
| Degree of system production advantage (SPA) | 0.43 | 0.41 | 0.42 | 0.43 | 0.42 | 0.43 | 0.42 | 0.43 | 0.43 | 0.42 |
Publisher’s Note: MDPI stays neutral with regard to jurisdictional claims in published maps and institutional affiliations. |
© 2021 by the authors. Licensee MDPI, Basel, Switzerland. This article is an open access article distributed under the terms and conditions of the Creative Commons Attribution (CC BY) license (https://creativecommons.org/licenses/by/4.0/).
Share and Cite
Wu, X.; Yang, Y.; Liu, C.; Xu, G.; Guo, Y.; Liu, F.; Wang, Y. Sustainability of Regional Agroecological Economic System Based on Emergy Theory: A Case Study of Anhui Province, China. Sustainability 2021, 13, 8317. https://doi.org/10.3390/su13158317
Wu X, Yang Y, Liu C, Xu G, Guo Y, Liu F, Wang Y. Sustainability of Regional Agroecological Economic System Based on Emergy Theory: A Case Study of Anhui Province, China. Sustainability. 2021; 13(15):8317. https://doi.org/10.3390/su13158317
Chicago/Turabian StyleWu, Xue, Yaliu Yang, Conghu Liu, Guowei Xu, Yuxia Guo, Fan Liu, and Yuan Wang. 2021. "Sustainability of Regional Agroecological Economic System Based on Emergy Theory: A Case Study of Anhui Province, China" Sustainability 13, no. 15: 8317. https://doi.org/10.3390/su13158317
APA StyleWu, X., Yang, Y., Liu, C., Xu, G., Guo, Y., Liu, F., & Wang, Y. (2021). Sustainability of Regional Agroecological Economic System Based on Emergy Theory: A Case Study of Anhui Province, China. Sustainability, 13(15), 8317. https://doi.org/10.3390/su13158317