
Incentivizing Innovation: The Causal Role of Government Subsidies on Lithium-Ion Battery Research and Development


Abstract
:1. Introduction
2. Literature Review
3. Data and Methodology
3.1. Description of the Chinese Lithium-Ion Battery Market
3.2. Regression Analysis, Fixed and Random Effects Models and the Hausman Test
3.3. Information Flow
4. Results
4.1. Hausman Test, Fixed and Random Effect Model Results
4.2. Information Flow
5. Conclusions
Author Contributions
Funding
Institutional Review Board Statement
Informed Consent Statement
Data Availability Statement
Acknowledgments
Conflicts of Interest
References
- Sahu, B.K. A study on global solar PV energy developments and policies with special focus on the top ten solar PV power producing countries. Renew. Sustain. Energy Rev. 2015, 43, 621–634. [Google Scholar] [CrossRef]
- Padiyar, K.R.; Kulami, A.M. Solar Power Generation and Energy Storage. In Dynamics and Control of Electric Transmission and Microgrids; Wiley-IEEE Press: Hoboken, NJ, USA, 2019; pp. 391–414. [Google Scholar] [CrossRef]
- Oakleaf, J.R.; Kennedy, C.M.; Baruch-Mordo, S.; Gerber, J.S.; West, P.C.; Johnson, J.A.; Kiesecker, J. Mapping global development potential for renewable energy, fossil fuels, mining and agriculture sectors. Sci. Data 2019, 6, 101. [Google Scholar] [CrossRef]
- Bórawski, P.; Beldycka-Bórawski, A.; Jankowski, K.Z.; Dubis, B.; Dunn, J.W. Development of wind energy market in the European Union. Renew. Energy 2020, 262, 691–700. [Google Scholar] [CrossRef]
- Guerra, O.J.; Zhang, J.; Eichman, J.; Denholm, P.; Kurtz, J.; Hodge, B. The value of seasonal energy storage technologies for the integration of wind and solar power. Energy Environ. Sci. 2020, 13, 1909–1922. [Google Scholar] [CrossRef]
- Boretti, A. Integration of solar thermal and photovoltaic, wind, and battery energy storage through AI in NEOM city. Energy AI 2021, 3, 100038. [Google Scholar] [CrossRef]
- Tong, F.; Yuan, M.; Lewis, N.S.; Davis, S.J.; Caldeira, K. Effects of Deep Reductions in Energy Storage Costs on Highly Reliable Wind and Solar Electricity Systems. iScience 2020, 23, 101484. [Google Scholar] [CrossRef]
- Diouf, B.; Pode, R. Potential of lithium-ion batteries in renewable energy. Renew. Energy 2015, 76, 375–380. [Google Scholar] [CrossRef]
- Trahey, L.; Brushett, F.R.; Balsara, N.P.; Ceder, B.; Cheng, L.; Chiang, Y.; Hahn, N.T. Energy storage emerging: A perspective from the Joint Center for Energy Storage Research. Proc. Natl. Acad. Sci. USA 2020, 117, 12550–12557. [Google Scholar] [CrossRef]
- Chen, T.; Jin, Y.; Lv, H.; Yang, A.; Liu, M.; Chen, B.; Xie, Y.; Chen, Q. Applications of Lithium-Ion Batteries in Grid-Scale Energy Storage Systems. Trans. Tianjin Univ. 2020, 26, 208–217. [Google Scholar] [CrossRef] [Green Version]
- Martin, J.; Miles, J. A techno-economic assessment of battery business models in the UK electricity market. Energy Policy 2021, 148, 111938. [Google Scholar] [CrossRef]
- Goop, J.; Nyholm, E.; Odenberger, M.; Johnsson, F. Impact of electricity market feedback on investments in solar photovoltaic and battery systems in Swedish single-family dwellings. Renew. Energy 2021, 163, 1078–1091. [Google Scholar] [CrossRef]
- Gong, S.; Ardeshiri, A.; Rashidi, T.H. Impact of government incentives on the market penetration of electric vehicles in Australia. Transp. Res. D Transp. Environ. 2020, 83, 102353. [Google Scholar] [CrossRef]
- Zhang, Q.; Li, C.; Wu, Y. Analysis of Research and Development Trend of the Battery Technology in Electric Vehicle with the Perspective of Patent. Energy Procedia 2017, 105, 4274–4280. [Google Scholar] [CrossRef]
- Johnson, W.H.A.; Medcof, J.W. Motivating proactive subsidiary innovation: Agent-based theory and socialization models in global R&D. J. Int. Manag. 2007, 13, 472–487. [Google Scholar]
- D’Andria, D.; Savin, I. A Win-Win-Win? Motivating innovation in a knowledge economy with tax incentives. Technol. Forecast Soc. Chang. 2018, 127, 38–56. [Google Scholar] [CrossRef]
- Zhao, X.M.; Bai, X.L. How to motivate the producers’ green innovation in WEEE recycling in China?—An analysis based on evolutionary game theory. Waste Manag. 2021, 122, 26–35. [Google Scholar] [CrossRef]
- Few, S.; Schmidt, O.; Offer, G.J.; Brandon, N.; Nelson, J.; Gambhir, A. Prospective improvements in cost and cycle life of off-grid lithium-ion battery packs: An analysis informed by expert elicitations. Energy Policy 2018, 114, 578–590. [Google Scholar] [CrossRef]
- Penisa, X.N.; Castro, M.T.; Pascasio, J.D.A.; Esparcia, E.A., Jr.; Schmidt, O.; Ocon, J.D. Projecting the Price of Lithium-Ion NMC Battery Packs Using a Multifactor Learning Curve Model. Energies 2020, 13, 5276. [Google Scholar] [CrossRef]
- Wu, F.; Maier, J.; Yu, Y. Guidelines and trends for next-generation rechargeable lithium and lithium-ion batteries. Chem Soc. Rev. 2020, 49, 1569–1614. [Google Scholar] [CrossRef]
- Wang, W.; Yang, T.; Li, S.; Lu, J.; Zhao, X.; Fan, W.; Fan, C.; Zuo, X.; Tie, S.; Nan, J. 1,4-Phenylene diisocyanate (PPDI)-containing low H2O/HF and multi-functional electrolyte for LiNi0·6Co0·2Mn0·2O2/graphite batteries with enhanced performances. J. Power Sources 2021, 483, 229172. [Google Scholar] [CrossRef]
- Ballinger, B.; Stringer, M.; Schmeda-Lopez, D.R.; Kefford, B.; Parkinson, B.; Greig, C.; Smart, S. The vulnerability of electric vehicle deployment to critical mineral supply. Appl. Energy 2019, 255, 113844. [Google Scholar] [CrossRef]
- Beaudet, A.; Larouche, F.; Amouzegar, K.; Brouchard, P.; Zaghib, K. Key Challenges and Opportunities for Recycling Electric Vehicle Battery Materials. Sustainability 2020, 12, 5837. [Google Scholar] [CrossRef]
- World Bank Group. Reuse and Recycling: Environmental Sustainability of Lithium-Ion Battery Energy Storage Systems; Energy Sector Management Assistance Program (ESMAP): Washington, DC, USA, 2020; Available online: http://documents.worldbank.org/curated/en/593961599738208006/Reuse-and-Recycling-Environmental-Sustainability-of-Lithium-Ion-Battery-Energy-Storage-Systems (accessed on 19 April 2021).
- Yang, X.L.; He, L.Y.; Xia, Y.F.; Chen, Y.F. Effect of government subsidies on renewable energy investments: The threshold effect. Energy Policy 2019, 132, 156–166. [Google Scholar] [CrossRef]
- Lin, B.; Luan, R. Are government subsidies effective in improving innovation efficiency? Based on the research of China’s wind power industry. Sci. Total Environ. 2020, 710, 136369. [Google Scholar] [CrossRef]
- Luo, G.L.; Liu, Y.X.; Zhang, L.P.; Xu, X.; Guo, Y.W. Do government subsidies improve the financial performance of China’s new energy power generation enterprises? Energy 2021, 227, 120432. [Google Scholar] [CrossRef]
- Wang, X.L.; Li, Z.Q.; Shaikh, R.; Ranjha, A.R.; Batala, L.K. Do government subsidies promote financial performance? Fresh evidence from China’s new energy vehicle industry. Sustain. Prod. Consum. 2021, 28, 142–153. [Google Scholar] [CrossRef]
- Yu, F.F.; Wang, L.T.; Li, X.T. The effects of government subsidies on new energy vehicle enterprises: The moderating role of intelligent transformation. Energy Policy 2020, 141, 111463. [Google Scholar] [CrossRef]
- Lee, M.H.; Yun, J.H.J.; Pyka, A.; Won, D.K.; Kodama, F.; Schiuma, G.; Park, H.S.; Jeon, J.; Park, K.B.; Jung, K.H.; et al. How to Respond to the Fourth Industrial Revolution, or the Second Information Technology Revolution? Dynamic New Combinations between Technology, Market, and Society through Open Innovation. J. Open Innov. Technol. Mark Complex 2018, 4, 21. [Google Scholar] [CrossRef] [Green Version]
- Tayal, A.; Kalsi, N.S.; Gupta, M.K.; Pimenov, D.Y.; Sarikaya, M.; Pruncu, C.I. Effectiveness Improvement in Manufacturing Industry; Trilogy Study and Open Innovation Dynamics. J. Open Innov. Technol. Mark Complex 2021, 7, 7. [Google Scholar] [CrossRef]
- Liu, D.Y.; Chen, T.; Liu, X.Y.; Yu, Y.Z. Do more subsidies promote greater innovation? Evidence from the Chinese electronic manufacturing industry. Econ. Model. 2019, 80, 441–452. [Google Scholar] [CrossRef]
- Liu, Z. The impact of Government Policy on Macro Dynamic Innovation of the Creative Industry: Studies of the UK’s and China’s Animation Sectors. J. Open Innov. Technol. Mark Complex 2021, 7, 168. [Google Scholar] [CrossRef]
- Li, J.; Ku, Y.; Liu, C.; Zhou, Y. Dual credit policy: Promoting new energy vehicles with battery recycling in a competitive environment? J. Clean Prod. 2020, 243, 118456. [Google Scholar] [CrossRef]
- Lin, B.; Luan, R. Do government subsidies promote efficiency in technological innovation of China’s photovoltaic enterprises? J. Clean Prod. 2020, 254, 120108. [Google Scholar] [CrossRef]
- Lim, C.Y.; Wang, J.W.; Zeng, C. China’s “Mercantilist” Government Subsidies, the Cost of Debt and Firm Performance. J. Bank Financ. 2018, 86, 37–52. [Google Scholar] [CrossRef] [Green Version]
- Zhu, Z.S.; Liao, H. Do subsidies improve the financial performance of renewable energy companies? Evidence from China. Nat. Hazards 2019, 95, 241–256. [Google Scholar] [CrossRef]
- Chen, K.; Zhao, F.; Hao, H.; Liu, Z. Selection of Lithium-ion Battery Technologies for Electric Vehicles under China’s New Energy Vehicle Credit Regulation. Energy Procedia 2019, 158, 3038–3044. [Google Scholar] [CrossRef]
- Zhang, L.; Liu, Y.; Pang, B.; Sun, B.; Kokko, A. Second Use Value of China’s New Energy Vehicle Battery: A View Based on Multi-Scenario Simulation. Sustainability 2020, 12, 341. [Google Scholar] [CrossRef] [Green Version]
- Moreno-Brieva, F.; Merino-Moreno, C. Technology generation of lithium batteries in leading countries. Environ. Sci. Pollut. Res. 2021, 8, 28367–28380. [Google Scholar] [CrossRef]
- Wu, R.; Liu, Z.; Ma, C.; Chen, X. Effect of government RD subsidies on firms’ innovation in China. Asian J. Technol. Innov. 2019, 28, 1–18. [Google Scholar]
- Yu, F.; Guo, Y.; Le-Nguyen, K.; Barnes, S.J.; Zhang, W. The impact of government subsidies and enterprises’ RD investment: A panel data study from renewable energy in China. Energy Policy 2016, 89, 106–113. [Google Scholar] [CrossRef] [Green Version]
- Otomo, P. The Impact of Patents on Research & Development Expenditure as a Percentage of Gross Domestic Products: A Case in the U.S. and EU Economies. Bachelor’s Thesis, Skidmore College, Saratoga Springs, NY, USA, 2017. [Google Scholar]
- Altuzarra, A. RD and patents: Is it a two-way street? Econ. Innov. New Technol. 2019, 28, 180–196. [Google Scholar] [CrossRef]
- Das, R.C. Interplays among RD spending, patent and income growth: New empirical evidence from the panel of countries and groups. J. Innov. Entrep. 2020, 9, 1–22. [Google Scholar] [CrossRef]
- Liang, X.S. Unraveling the cause-effect relation between time series. Phys. Rev. E 2014, 90, 052150. [Google Scholar] [CrossRef] [Green Version]
- Stips, A.; Macias, D.; Coughlan, C.; Garcia-Gorriz, E.; Liang, X.S. On the causal structure between CO2 and global temperature. Sci. Rep. 2016, 6, 21691. [Google Scholar] [CrossRef] [PubMed] [Green Version]
- Li, M.; Liu, K. Probabilistic Prediction of Significant Wave Height Using Dynamic Bayesian Network and Information Flow. Water 2020, 12, 2075. [Google Scholar] [CrossRef]
- Jiang, S.; Hu, H.; Zhang, N.; Lei, L.; Bai, H. Multi-source forcing effects analysis using Liang-Kleeman information flow method and the community atmosphere model (CAM4.0). Clim. Dyn. 2019, 53, 6035–6053. [Google Scholar] [CrossRef] [Green Version]
- Hagan, D.F.T.; Wang, G.; San Liang, X.; Dolman, H.A.J. A Time-Varying Causality Formalism Based on the Liang-Kleeman Information Flow for Analyzing Directed Interactions in Nonstationary Climate Systems. J. Clim. 2019, 32, 7521–7537. [Google Scholar] [CrossRef]
- Yao, C.Z. Information Flow Analysis between EPU and Other Financial Time Series. Entropy 2020, 22, 683. [Google Scholar] [CrossRef] [PubMed]
- Nie, C. Dynamics of the price-volume information flow based on surrogate time series. Chaos 2021, 31, 013106. [Google Scholar] [CrossRef]
- Nyasha, S.; Odhiambo, N.M. Government Size and Economic Growth: A Review of International Literature. SAGE Open 2019, 9, 215824401987720. [Google Scholar] [CrossRef]
- Lawal, A.S.; Nenlat, R.; Jacob, H.U. The Granger Cauaslity Tests on the Impact of Government Expenditure on Economic Growth in Nigeria. Int. J. Res. Sci. Technol. 2020, 5, 2454. [Google Scholar]
- BloombergNEF. China Dominates the Lithium-ion Battery Supply Chain, but Europe is on the Rise. 2020. Available online: https://about.bnef.com/blog/china-dominates-the-lithium-ion-battery-supply-chain-but-europe-is-on-the-rise/ (accessed on 16 April 2021).
- RAM (Research and Markets). Battery–Global Market Trajectory & Analytics. 2021. Available online: www.researchandmarkets.com (accessed on 17 April 2021).
- Slowik, P.; Lutsey, N.; Hsu, C. How Technology, Recycling, and Policy Can Mitigate Supply Risks to Long-Term Transition to Zero-Emission Vehicles. The International Council on Clean Transportation; 8 December 2020. Available online: https://theicct.org/publications/mitigating-zev-supply-risks-dec2020 (accessed on 19 April 2021).
- Jin, L.; He, H.; Cui, H.; Lutsey, N.; Wu, C.; Chu, Y.; Zhu, J.; Xiong, Y.; Liu, X. Driving a Green Future–A Retrospective Review of China’s Electric Vehicle Development and Outlook for the Future. 2021. Available online: https://theicct.org/sites/default/files/publications/China-green-future-ev-jan2021.pdf (accessed on 17 April 2021).
- Climate Cooperation. New Energy Vehicle Industry Development Plan (2021–2013). 2021. Available online: https://climatecooperation.cn/climate/new-energy-vehicle-industry-development-plan-2021-2035/#:~:text=The%20New%20Energy%20Vehicle%20Industry,part%20of%20the%20comprehensive%20roadmap (accessed on 19 April 2021.).
- Barrett, E. Government Subsidies Fueled China’s Electric Vehicle Boom. Now They’re Facing Intense Scrutiny. Fortune; 6 September 2019. Available online: https://fortune.com/2019/09/06/governmentsubsidies-china-electric-vehicle-boom/ (accessed on 16 April 2021).
- Moss, T. The Key to Electric Cars Is Batteries. One Chinese Firm Dominates the Industry. The Wall Street Journal; 3 November 2019. Available online: www.wsj.com/articles/how-china-positioneditself-to-dominate-the-future-of-electric-cars11572804489?mod=searchresults&page=1&pos=15 (accessed on 19 April 2021).
- ITS. China BAK Receives Government Subsidy for its Battery Module Project. 2015. Available online: www.itsinternational.com/news/china-bak-receives-government-subsidy-its-battery-module-project (accessed on 19 April 2021).
- Scott, S.; Ireland, R. Lithium-Ion Battery Materials for Electric Vehicles and their Global Value Chains. Office of Industries Working Paper ID-068. 2020. Available online: www.usitc.gov/publications/332/working_papers/gvc_overview_scott_ireland_508_final_061120.pdf (accessed on 19 April 2021).
- Masiero, G.; Ogasavara, M.H.; Jussani, A.C.; Risso, M.L. Electric vehicles in China: BYD strategies and government subsidies. RAI Rev. Adm. Inov. 2016, 13, 3. [Google Scholar] [CrossRef] [Green Version]
- Mai, H.J. To Compete in the Global Battery Arms Race, the US Must Spur its Domestic Market, Analysts Say. 2019. Available online: www.utilitydive.com/news/creating-a-domestic-market-is-paramount-for-us-battery-industry-to-close-th/557339/ (accessed on 19 April 2021).
- Bell, A.; Fairbrother, M.; Jones, K. Fixed and random effects models: Making an informed choice. Qual. Quant. 2019, 53, 1051–1074. [Google Scholar] [CrossRef] [Green Version]
- Li, Q.; Wang, M.; Xiangli, L. Do government subsidies promote new-energy firms’ innovation? Evidence from dynamic and threshold models. J. Clean Prod. 2020, 286, 124992. [Google Scholar] [CrossRef]
- Bronzini, R.; Piselli, P. The impact of R&D subsidy on firm innovation. Res. Policy 2016, 45, 442–457. [Google Scholar]
- Wu, A. The signal effect of Government R&D Subsidies in China: Does ownership matters? Technol. Forecast. Soc. Chang. 2017, 117, 339–345. [Google Scholar]
- Hausman, J.A. Specification Tests in Econometrics. Econometrica 1978, 46, 1251–1271. [Google Scholar] [CrossRef] [Green Version]
- Patent Information Service Platform Network. Available online: http://pss-system.cnipa.gov.cn/sipopublicsearch/ (accessed on 20 January 2021).
- China Stock Market & Accounting Research Database. Available online: https://www.gtarsc.com/ (accessed on 23 January 2021).
- Liang, S.X. Normalizing the causality between time series. Phys. Rev. E 2015, 92, 022126. [Google Scholar] [CrossRef] [Green Version]
- Rossi, F.; Cebula, R.J. Ownership Structure and RD: An Empirical Analysis of Italian listed companies. PSL Q Rev. 2015, 68, 297–325. [Google Scholar]
- Cherensky, S.S. Shareholders, Managers, and Corporate RD Spending: An Agency Cost Model. St. Clara High Technol. Law J. 1994, 10, 299–346. [Google Scholar]
- Hong, J.; Hong, S.; Wang, L.; Xu, Y.; Zhao, D. Government grants, private RD funding and innovation efficiency in transition economy. Technol. Anal. Strateg. Manag. 2015, 27, 1068–1096. [Google Scholar] [CrossRef]
- Jiang, C.; Zhang, Y.; Bu, M.; Liu, W. The Effectiveness of Government Subsidies on Manufacturing Innovation: Evidence from the New Energy Vehicle Industry in China. Sustainability 2018, 10, 1692. [Google Scholar] [CrossRef] [Green Version]
- Peng, H.; Liu, Y. How government subsidies promote the growth of entrepreneurial companies in clean energy industry: An empirical study in China. J. Clean Prod. 2018, 188, 508–520. [Google Scholar] [CrossRef]
- Xu, J.; Wang, X.; Liu, F. Government subsidies, RD investment and innovation performance: Analysis from pharmaceutical sector in China. Technol. Anal. Strateg. Manag. 2020, 33, 535–553. [Google Scholar] [CrossRef]
- Dang, J.W.; Motohashi, K. Patent statistics: A good indicator for innovation in China? Patent subsidy program impacts on patent quality. China Econ. Rev. 2015, 35, 137–155. [Google Scholar] [CrossRef]
- Giarratana, M.S.; Mariani, M.; Weller, I. Rewards for Patents and Inventor Behaviours in Industrial Research and Development. Acad. Manag. J. 2017, 61, 264–292. [Google Scholar] [CrossRef]
- Gosens, J.; Lu, Y. From lagging to leading? Technological innovation systems in emerging economies and the case of Chinese wind power. Energy Policy 2013, 60, 234–250. [Google Scholar] [CrossRef]
- Sun, X.; Yu, R.; Wang, Y.; Colombage, S.R.N. Do government subsidies stimulate firms’ RD efforts? Empirical evidence from China. Asian J. Technol Innov. 2020, 28, 1–18. [Google Scholar] [CrossRef]
- Lam, L.T.; Branstetter, L.; Azevedo, I.M.L. China’s wind industry: Leading in development, lagging in innovation. Energy Policy 2017, 106, 588–599. [Google Scholar] [CrossRef]
- Zhu, Z.; Zhu, Z.; Xu, P.; Xue, D. Exploring the impact of government subsidy and RD investment on financial competitiveness of China’s new energy listed companies: An empirical study. Energy Rep. 2019, 5, 919–925. [Google Scholar] [CrossRef]
- Li, X. Behind the recent surge of Chinese patenting: An institutional view. Res. Policy 2012, 41, 236–249. [Google Scholar] [CrossRef]
- Lei, Z.; Sun, Z.; Wright, B. Patent Subsidy and Patent Filing in China; University of California: Berkeley, CA, USA, 2013. [Google Scholar]
- Almeida, A.; Teixeira, A.A.C. Does Patenting Negatively Impact on R&D Investment? An International Panel Data Assessment; FEP Working Papers 255; Universidade do Porto, Faculdade de Economia do Porto: Porto, Portugal, 2007. [Google Scholar]
- Jeong, H.J.; Ko, Y. Configuring an alliance portfolio for eco-friendly innovation in the car industry: Hyundai and Toyota. J. Open Innov. Technol. Mark Complex 2016, 2, 1–16. [Google Scholar] [CrossRef] [Green Version]
- Kranzeeva, E.; Golovatsky, E.; Orlova, A.; Nyatina, N.; Burmakina, A. Assessing the effectiveness of Social and Political Innovations in the Development of Interaction between the Authorities and the Population during COVID-19: The Implication of Open Innovation. J. Open Innov. Technol. Mark Complex 2021, 7, 172. [Google Scholar] [CrossRef]

| Type of Vehicles | Technical Specifications | Incentives | |
|---|---|---|---|
| RMB | US | ||
| BEV | 80 km ≤ Autonomy < 150 km | 31.5 | 5 |
| 150 km ≤ Autonomy < 250 km | 45 | 7.2 | |
| Autonomy ≥ 250 km | 54 | 8.6 | |
| PHEV | Autonomy ≥ 50 km | 31 | 5 |
| Fuel Cell Car | - | 180 | 28.8 |
| Plug-in Hybrid Bus | Length ≥ 10 m | 250 | 40 |
| Fuel Cell Commercial Vehicle | - | 420 | 72.1 |
| Super-capacitor/lithium Titanate Bus | - | 150 | 24 |
| Variables | Symbol | Variable Definition and Unit |
|---|---|---|
| RD investment | RD | Enterprise RD investment (Million Yuan) |
| Patent Output | PO | Number of enterprise invention patent applications |
| Government Subsidies | GS | Government subsidies in non-operating income (million yuan) |
| Main Business Income | MBI | Income from the company’s main business (million yuan) |
| Asset-liability Ratio | LEV | Proportion of total liabilities to total assets (%) |
| Investment Ratio | DS | Proportion of RD investment in operating income (%) |
| Largest Shareholder Ratio | LSR | The ratio of the number of shares held by the shareholder with the most shares to the total number of shares (%) |
| Top Ten Shareholders Ratio | TTSR | The shareholding ratio of the top ten major shareholder (%) |
| Net Profit | NP | The amount of accounting profit a company has left over after paying off all its expenses (million yuan) |
| Variables | Max. | Min. | Average | Median |
|---|---|---|---|---|
| RD | 8535.9 | 0.04 | 309.5 | 99.2 |
| PO | 2856 | 1 | 146 | 38 |
| GS | 1248.5 | 0.005 | 41.9 | 11.5 |
| MBI | 100,492 | 0 | 5699.7 | 1172 |
| LEV | 0.77 | 0.1 | 0.48 | 0.49 |
| DS | 8.16 | 0 | 0.38 | 0.05 |
| LSR | 67.14 | 3 | 29.2 | 28.34 |
| TTSR | 94.33 | 9.15 | 50.97 | 51.7 |
| NP | 26,379 | 0 | 612.2 | 147.7 |
| Variable | Fixed Effects | Random Effects | ||
|---|---|---|---|---|
| Coefficient | p | Coefficient | p | |
| GS | 0.182 | 0.000 | 0.163 | 0.001 |
| MBI | 0.205 | 0.000 | 0.207 | 0.000 |
| LEV | 0.022 | 0.232 | 0.030 | 0.105 |
| LSR | 0.358 | 0.000 | 0.370 | 0.000 |
| Cons | −0.057 | 0.000 | −0.062 | 0.000 |
| F/W Values | 52.51 (F-value) | 210.36 (W-value) | ||
| Variable | Fixed Effects | Random Effects | ||
|---|---|---|---|---|
| Coefficient | p | Coefficient | p | |
| GS | 0.174 | 0.000 | 0.153 | 0.002 |
| DS | 0.124 | 0.003 | 0.119 | 0.004 |
| TTSR | 0.034 | 0.116 | 0.021 | 0.206 |
| LSR | 0.502 | 0.000 | 0.521 | 0.000 |
| Cons | −0.089 | 0.000 | −0.087 | 0.000 |
| F/W Values | 41.05 (F-value) | 158.32 (W-value) | ||
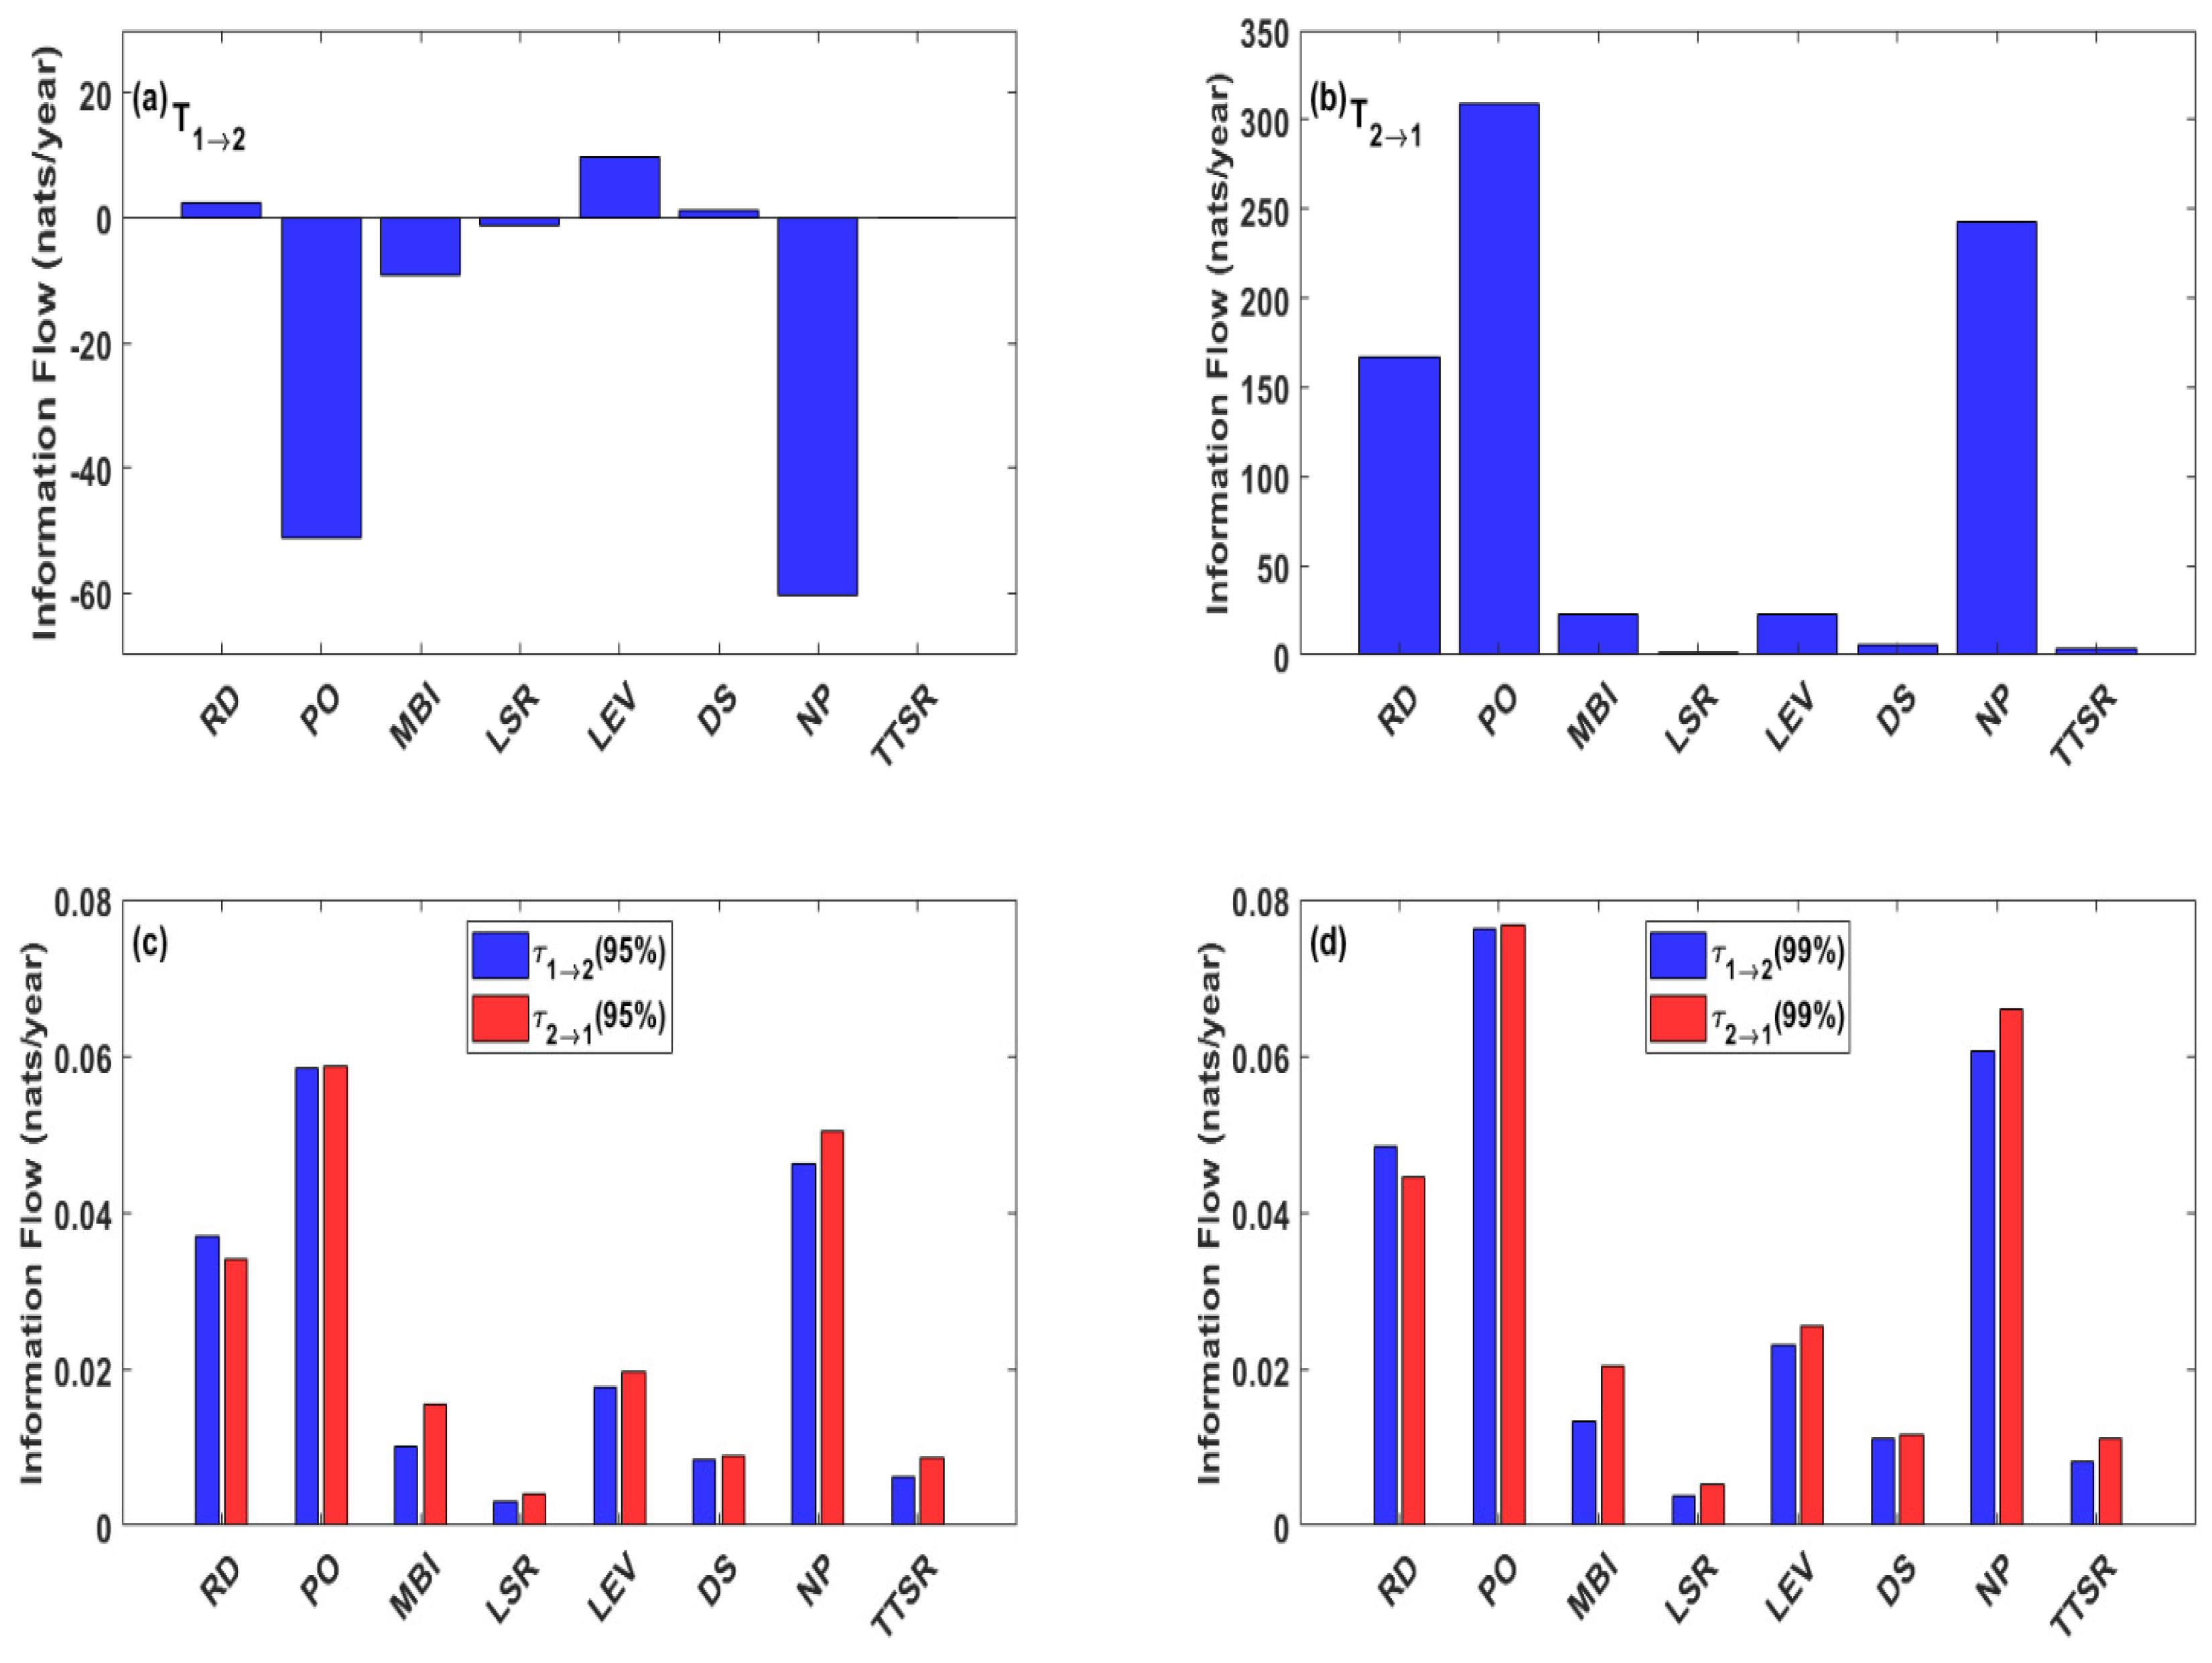
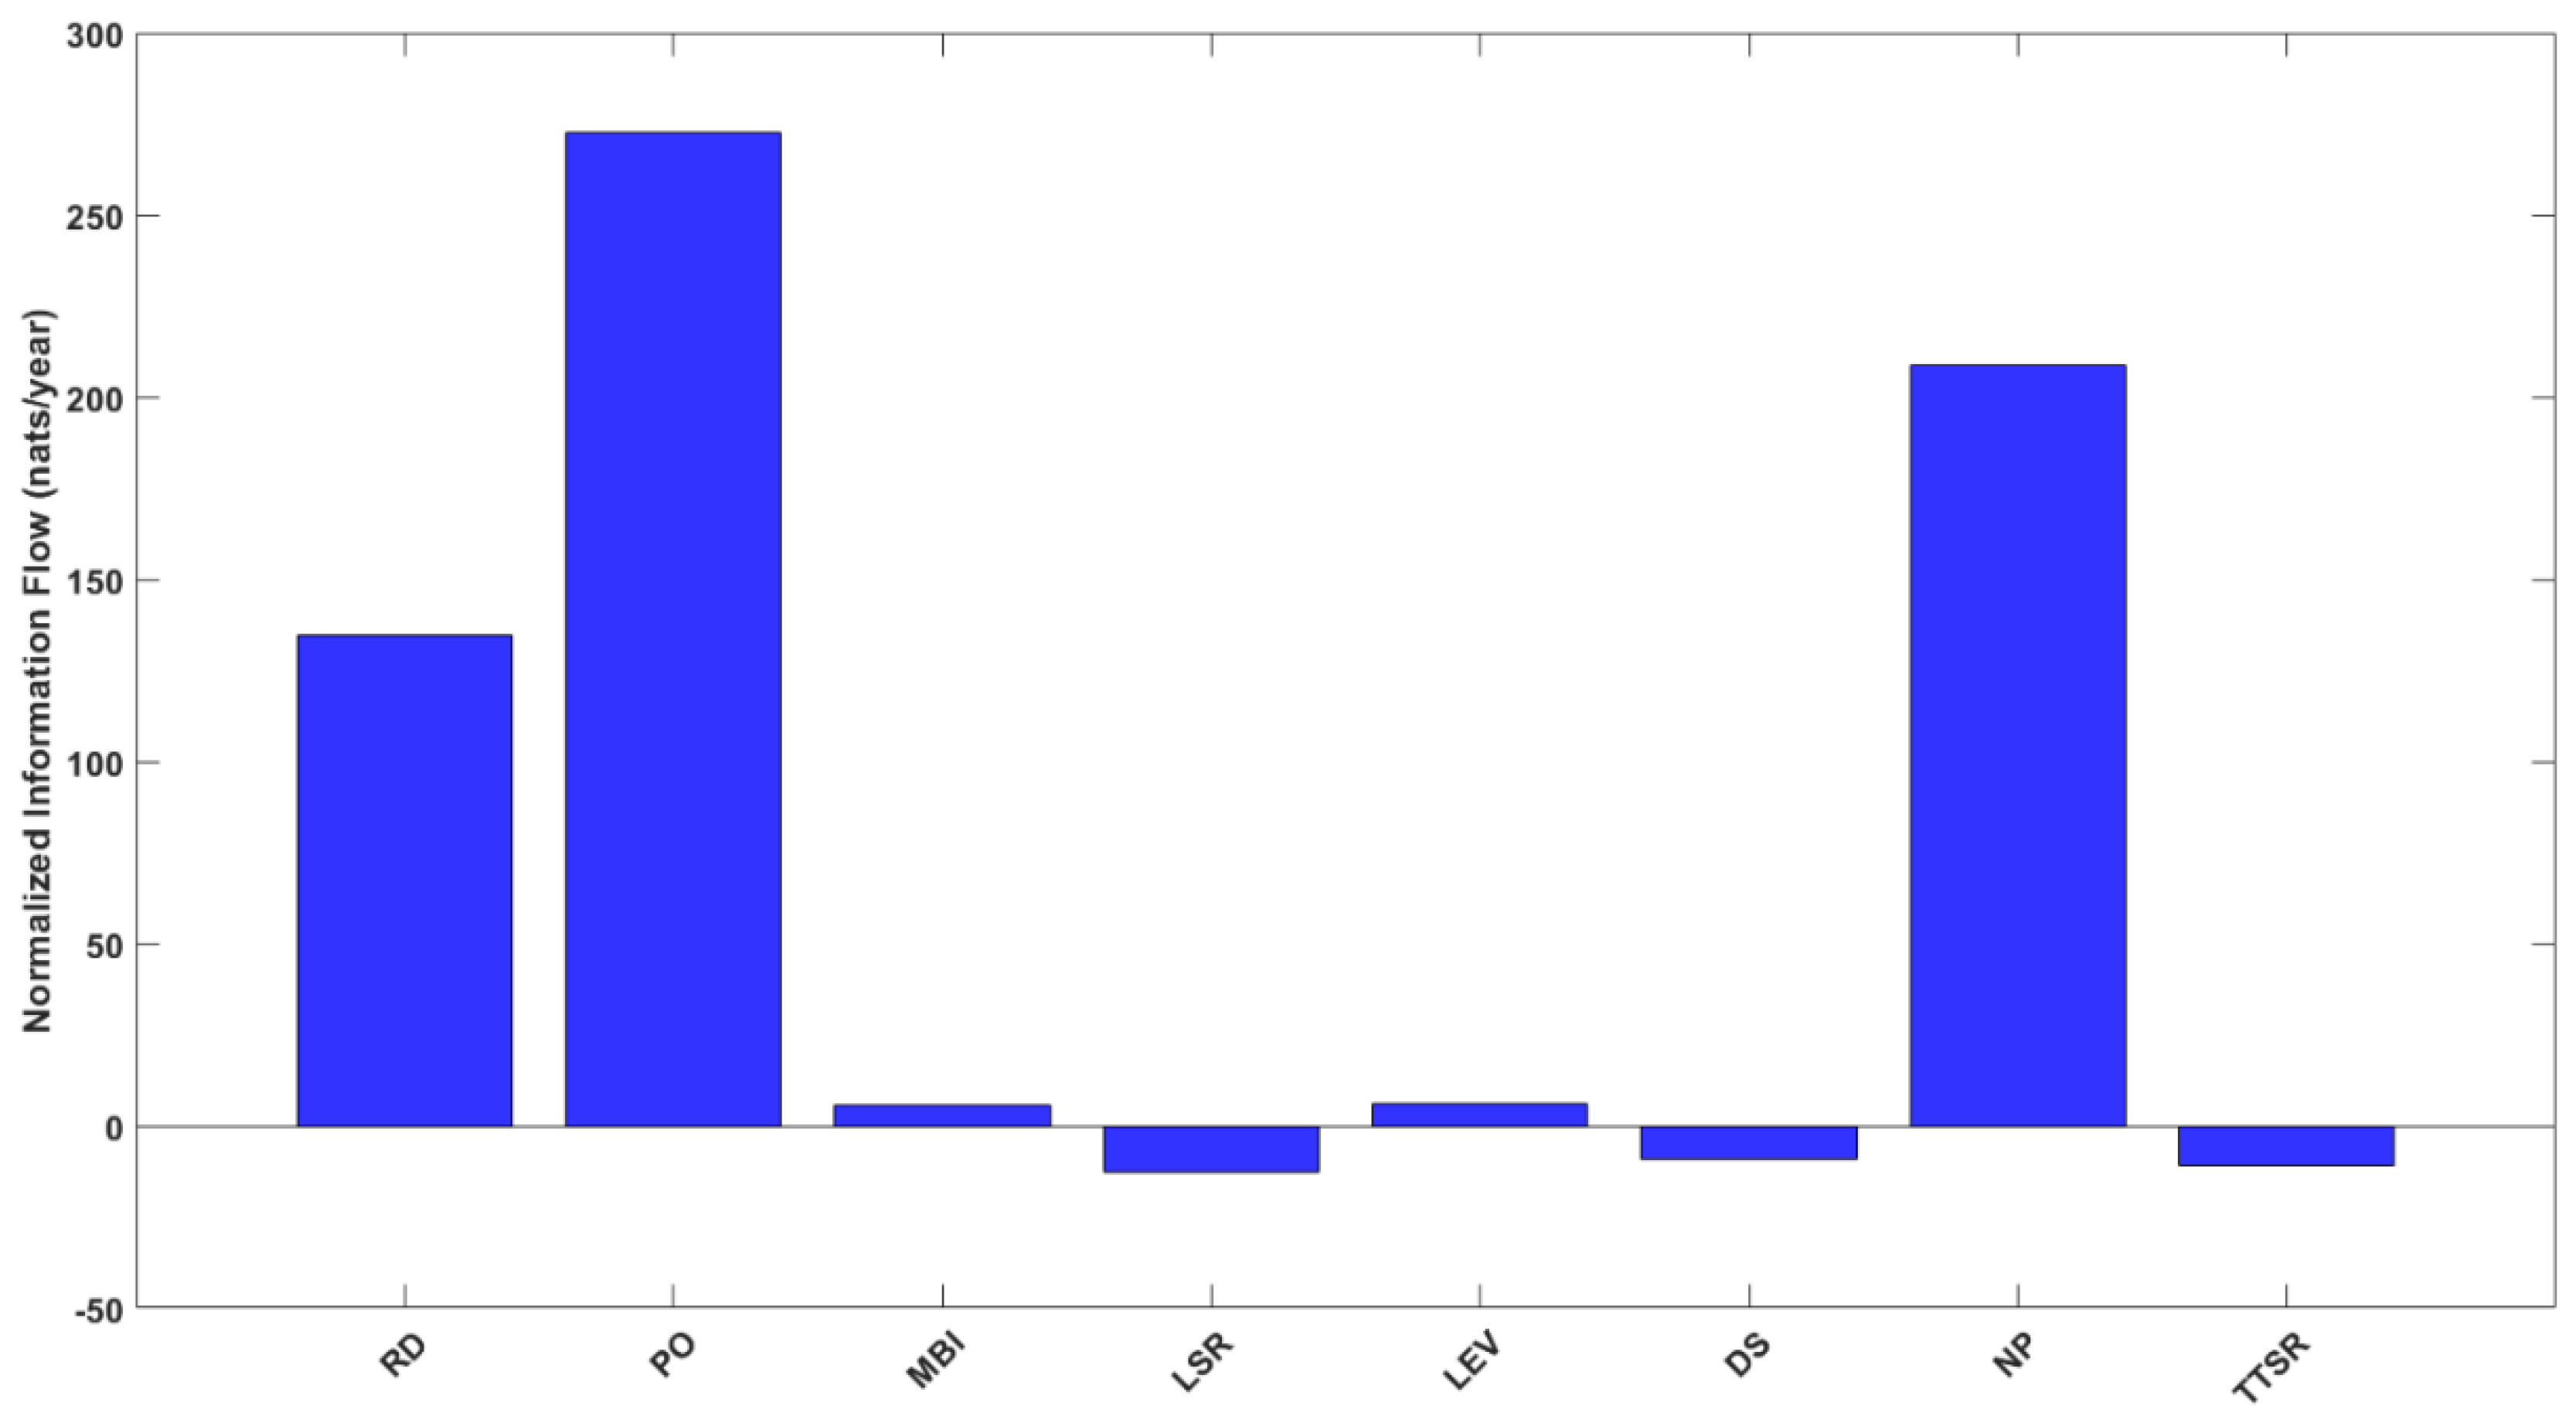
| Variable | ||||||
|---|---|---|---|---|---|---|
| RD | 2.2951 | 166.8535 | 0.0370 | 0.0341 | 0.0483 | 0.0446 |
| PO | −51.1643 | 309.4262 | 0.0583 | 0.0587 | 0.0761 | 0.0767 |
| MBI | −9.2132 | 22.6042 | 0.0101 | 0.0155 | 0.0132 | 0.0203 |
| LSR | −1.1905 | 1.9735 | 0.0030 | 0.0040 | 0.0039 | 0.0052 |
| LEV | 9.8400 | 23.0154 | 0.0176 | 0.0196 | 0.0230 | 0.0256 |
| DS | 1.3364 | 5.8220 | 0.0085 | 0.0090 | 0.0111 | 0.0117 |
| NP | −60.4489 | 242.9157 | 0.0463 | 0.0504 | 0.0605 | 0.0659 |
| TTSR | −0.0720 | 3.7063 | 0.0063 | 0.0086 | 0.0082 | 0.0112 |
Publisher’s Note: MDPI stays neutral with regard to jurisdictional claims in published maps and institutional affiliations. |
© 2021 by the authors. Licensee MDPI, Basel, Switzerland. This article is an open access article distributed under the terms and conditions of the Creative Commons Attribution (CC BY) license (https://creativecommons.org/licenses/by/4.0/).
Share and Cite
Buravleva, Y.; Tang, D.; Bethel, B.J. Incentivizing Innovation: The Causal Role of Government Subsidies on Lithium-Ion Battery Research and Development. Sustainability 2021, 13, 8309. https://doi.org/10.3390/su13158309
Buravleva Y, Tang D, Bethel BJ. Incentivizing Innovation: The Causal Role of Government Subsidies on Lithium-Ion Battery Research and Development. Sustainability. 2021; 13(15):8309. https://doi.org/10.3390/su13158309
Chicago/Turabian StyleBuravleva, Yana, Decai Tang, and Brandon J. Bethel. 2021. "Incentivizing Innovation: The Causal Role of Government Subsidies on Lithium-Ion Battery Research and Development" Sustainability 13, no. 15: 8309. https://doi.org/10.3390/su13158309
APA StyleBuravleva, Y., Tang, D., & Bethel, B. J. (2021). Incentivizing Innovation: The Causal Role of Government Subsidies on Lithium-Ion Battery Research and Development. Sustainability, 13(15), 8309. https://doi.org/10.3390/su13158309