Abstract
Due to their small size and low energy demand, light electric vehicles (LEVs), such as electric moped scooters, are considered as a space efficient and eco-friendly alternative for mobility in cities. However, the growth of electric moped scooter sharing services raises the question of how environmentally friendly this business model is, considering the entire lifecycle. Due to the dynamic market and insufficient availability of public data on the business processes of sharing services only a few studies on the impact of shared electric mopeds are available. Especially there is a lack of research on the impacts of key operational logistic parameters of the sharing system. This paper aims to fill this gap by conducting a life cycle assessment using the example of an electric moped scooter manufactured and used in sharing services in Germany, based on different operating scenarios. The results show that e-moped sharing has a similar environmental impact on global warming potential, in terms of passenger kilometers, as public transport, especially if long product lifetimes as well as efficient operation logistics are realized.
1. Introduction
According to the International Energy Agency (IEA) transportation is responsible for 24% of global greenhouse gas (GHG) emissions due to fuel combustion, causing 8.2 Gt CO2-eq. in the year 2018. Passenger road vehicles (cars, buses, two-wheelers) account for 44% of those emissions, which continue to rise slightly, despite efficiency gains in vehicle technology, due to rising traffic volumes. Another reason is the increasing number of larger vehicles sold, which not only have a high energy demand per passenger transported, but additionally occupy a lot of space in already crowded cities [1]. Light electric vehicles (LEV), as a part of micromobility, offer numerous advantages for urban mobility over conventional vehicles with internal combustion engines. For example, LEVs require less energy for production and operation as well as less space than cars [2]. Thus, micromobility and new ownership models such as sharing services with LEVs are emerging in cities worldwide [3,4].
Due to the dynamic market development for micromobility, the corresponding terms, its business models and associated transport modes have not yet been clearly defined. The following terms are used in this paper: shared mobility describes “the shared use of a vehicle [...] that enables users to have short-term access to transportation modes on an ‘as-needed’ basis [5]”.
Micromobility is defined as the use of low speed, small, lightweight vehicles with a mass of less than 350 kg and a design speed up to 45 km/h [6]. The vehicles are typically electric powered [7]. They require battery capacities from 0.4 kWh to 10 kWh, resulting in drive ranges of 20–160 km [8]. LEV is often used synonymously, covering different types of vehicles in the field of micromobility, such as electric stand-up scooters, driven in a standing position; electric bicycles; electric moped scooters; or light four wheeled vehicles [2].
Electric moped scooters (e-moped) are, according to the respective guidelines of the European Union, two-wheeled motor vehicles with design-related top speed of up to 45 km/h and displacement up to 50 cm3 or up to 4 kW for electric motors [9]. Since its inception in 2012, the e-moped sharing market has been growing year by year. The number of shared e-mopeds available worldwide increased by 164% in 2019 compared to 2018 [10] and by 58% in 2020 compared to 2019 [11]. In this study, e-moped sharing is defined as the shared use of electric moped scooters, where operators enable customers to rent scooters for short term directly through a smartphone application. Within these sharing services, providers ensure the e-mopeds are maintained and repaired as well as that their batteries are swapped and charged.
In a short time, new business models have developed on the basis of LEV, such as the e-moped, according to their mobility as a service approach. The dynamic development of the market led to questions about the environmental impact of e- moped sharing. In particular, the operational logistics of moped sharing services, such as the use of diesel vans to deliver batteries for swapping the e-moped batteries, remains highly questionable. In order to identify effective options against climate change, however, CO2 emissions from different modes of transport must be assessed in conjunction with usage scenarios considering the whole service and not only the vehicle itself. However, there is a lack of current and well-founded data on the CO2 emissions of e-mopeds that include reliable data on the product and operating concepts of shared mobility. In addition, the concepts of use may differ in the outcome.
Existing research focuses on life cycle assessments (LCA) of e-mopeds as a product by comparing it to alternative electric two wheelers [8] or to other transport modes [12]. Two existing LCA on e-mopeds focus on regional analysis on the effects of the private use of e-mopeds in Austria [13] and Switzerland [14].
Considering e-mobility in general, LCA studies on electric vehicles and their batteries on a product level are well established. Current studies provide a review of LCA studies of electric vehicles [15] as well as electric vehicles and their batteries [16] whereas other studies compare the impact of internal combustion engines and battery electric vehicles [17]. LCA studies on lithium-ion vehicle batteries are available [18,19] as well as LCA evaluating the effect of energy density on the impact of lithium-ion and lithium-sulfur batteries [20]. Life cycle assessments studying whole sharing services are more rare and focus on the energy use and greenhouse gas emissions of car sharing services in general [21] or on case studies of car sharing in specific cities [22]. Considering micromobility services, the LCA of shared stand-up scooters is well established. Existing studies evaluate the environmental impact of sharing services with stand-up scooters using case studies in the U.S. [23] and Berlin [24] or compare the use of shared stand-up scooters to private use and substituted transport modes [25]. Other LCA studies consider further techno-economical aspects [26] or the reliability of stand-up scooters [27] next to their environmental impact. A further study, of Gebhardt et al., analyzes the impact of shared stand-up scooters on the whole transport system [28] whereas the German Energy Agency evaluated scenarios regarding the future development of stand-up scooter sharing [29].
The environmental impact of e-mopeds in shared use has so far been considered only rudimentarily. Wortmann et al. analyzed e-moped sharing in Berlin based on a multi-agent transport simulation framework. However, indirect emissions of the sharing services, such as emissions caused by vehicles used for battery swapping were not considered [30]. De Bortoli recently conducted an LCA of shared micromobility and personal alternatives, including e-moped sharing. This study includes indirect emissions from the sharing service, but uses existing LCA models of e-mopeds from databases, so no distinct LCA of the e-moped product is implemented [31]. Overall, there is a gap in research regarding the LCA of e-moped sharing services based on a realistic use case of the production and use phase. Furthermore, there is a need to further research different usage and operation scenarios of e-moped sharing considering potential future developments.
In order to realistically model the impact of e-mopeds in sharing services, empirical data on the usage patterns are required. Current literature [32] suggests some usage patterns of micromobility modes like e-bike and stand-up scooter sharing are relatively well understood. There are studies analyzing usage patterns of free floating bike sharing in Singapore based on data generated from GPS sensors [33,34], in Shanghai, China based on data mining [35], or based on data scraping from public available API of sharing software in Nanchang, China [36]. Other studies focus on the usage patterns of shared stand-up scooters based on data sets of sharing providers, e.g., in Indianapolis, U.S. [37] as well as in Washington D.C. and in Austin, U.S. [38], whereas the analysis of stand-up scooter sharing in Taiwan, of Eccarius and Lu, is based on a survey [39]. Moreover, there are two studies comparing usage patterns of stand-up scooters and bike sharing in Washington D.C. based on data scraping [40,41]. However, there is a lack of empirical usage data for newer additions to the mobility sharing portfolio, such as e-moped sharing. Existing research concentrates mainly on the private use of mopeds, e.g., in the city of Munich, Germany [42] and in Australia [43]. Analyses of e-moped sharing are based on user surveys for data acquisition [44] or state market research as a data source [10,45].
Results of these analyses are needed, as most countries must achieve significant CO2 savings in the transport sector. Germany, for example, has recently set a target to reduce CO2 emissions in the transport sector from 146 million tons of CO2 in 2020 to 85 million tons of CO2 in 2030 [46]. The addition of e-mopeds to micromobility services could contribute to those goals both cost effectively and rapidly.
This study examines whether e-moped sharing is eco-friendly compared to alternative transport modes and how the environmental impact can be further reduced. The paper aims to obtain the most accurate data possible that covers the entire usage concept, including product specifications. On the one hand, concrete data on the product is used based on the manufacturer’s bill of material and, on the other hand, data from a sharing provider on the use phase, offering a holistic view.
This paper uses the LCA methodology to quantify the impact of e-scooter sharing on the impact category global warming potential (GWP 100), as well as additional impact categories that we present in the Appendix A. The paper not only conducts a product LCA but considers the usage patterns and operation logistics of sharing services. Therefore, we develop five different usage scenarios of e-moped sharing services for the use case of a German city based on the data set of a sharing provider as well as a literature review. The results help to implement a hot spot analysis, meaning the identification of the main triggers for negative environmental impacts, and to make recommendations for local authorities, manufacturers and sharing providers to reduce these impacts. Finally, we consider the results in the context of the entire transport system by comparing them with the environmental impact of alternative transport modes. The results offer governments a better assessment of the CO2 saving potentials of e-moped sharing systems and at the same time allow to decide on measures to better exploit the potentials. A schematic representation of the paper structure can be found in Figure 1.
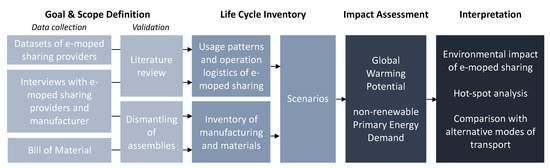
Figure 1.
Schematic representation of the structure of the paper.
2. Materials and Methods
LCA is an instrument for quantifying the environmental impact of technical systems (e.g., product systems) or services throughout their entire life cycle. Hence, it considers all life phases, from raw material extraction (cradle), production, transport, and use to end of life (grave), as shown in Figure 2. Regarding LCA of transport modes, this encompasses, particularly [47]:
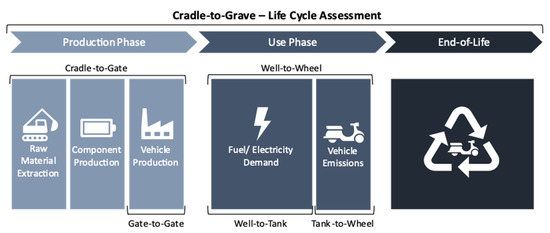
Figure 2.
Phases of a cradle to grave Life Cycle Assessment of vehicles. Own representation based on [10].
- the manufacture of the vehicle, raw materials and components (cradle to gate), including the manufacture of the vehicle itself (gate to gate),
- the use phase of the vehicle (well-to-wheel), including the generation provision of the drive energy (well-to-tank) and the conversion into kinetic energy to operate of the vehicle (tank-to-wheel),
- and the treatment or recycling of the vehicle and its components to recover raw materials (end-of-life).
In accordance with the ISO standards 14040/44, the present LCA consists of four phases: goal and scope definition, life cycle inventory, impact assessment, and interpretation [48,49].
2.1. Goal and Scope Definition
The goal of this study is to examine the life cycle environmental impact of e-moped sharing. The study analyzes the e-moped model Kumpan 1954 i of the manufacturer e-bility GmbH as a case study, which is shown in Figure 3.
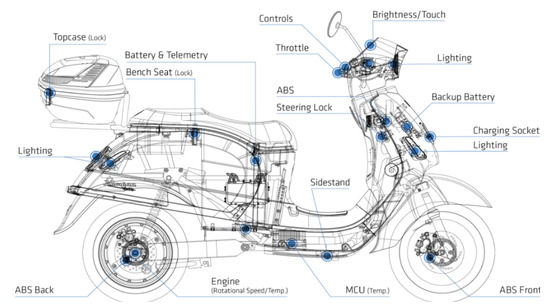
Figure 3.
Technical drawing of the e-moped Kumpan 1954 i provided by e-bility GmbH.
The main technical characteristics of the analyzed e-moped are shown in Table 1. The characteristics are compared with market values derived from a comprehensive dataset by Weiss et al. 2020 [50] as well as values used within other LCA studies on e-moped sharing [30,31].

Table 1.
Technical specifications of different e-mopeds.
Weiss et al., 2020 analyze the technical characteristics of 428 different electric vehicles. None of the vehicle categories defined by the authors correspond to the specific characteristics of electric mopeds. Therefore, we used the provided dataset to identify e-mopeds with a power of 0.8–4.0 kW and a mass of 62–130 kg (without driver) and calculated subset median values for the different technical characteristics. The technical characteristics of the analyzed scooters can be found in Table A1 of Appendix A. Regarding the values for real world range and energy consumption, it should be noted that Weiss et al., 2020 only collected data on one e-moped model.
The system boundaries of the study are shown in Figure 4. It includes impacts caused by production of primary and secondary materials, component production, materials transport, use and end of life. The functional unit is one passenger-kilometer (pkm) travelled. We use the CML method in the version of 2016 as method of impact assessment [52].
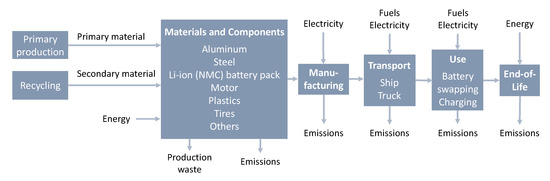
Figure 4.
System boundary diagram for the Life Cycle Assessment on shared electric moped scooters.
2.2. Inventory Data for the Manufacturing and Transport of the e-Moped
A bill of materials (BoM) provided by the OEM e-bility GmbH served as a data base for the inventory analysis of the production of the e-moped Kumpan 1954 i (cradle to gate). By dismantling individual components of the e-moped we were able to validate the BoM, and characterize and inventory all components. In detail, the following components were dismantled: battery housing, bodywork, brake discs, electric motor, electronics (e.g., cables, control unit, charger, rear and front light), footboards, frame, seat and tires. The battery cells and battery management system could not be dismantled.
We, hence, listed all the e-moped components and identified the components’ materials (see Table A2 of the Appendix A). Each material was then matched with a dataset within the GaBi software of Sphera Solutions GmbH [53,54]. The major materials and components of the e-moped include steel, aluminum, a battery pack, an electric motor, and plastic, which in total account for 93 % of the total moped mass of 102 kg, as shown in Figure 5.
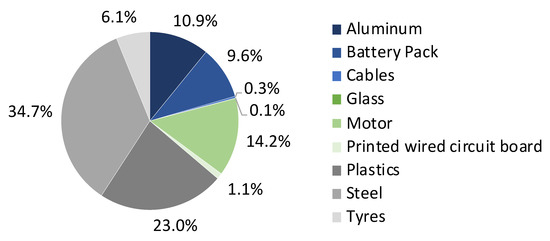
Figure 5.
Share by weight of materials/components of the Kumpan 1954 i.
The components of the e-moped are produced in different countries. For the modelling of the production, the average electricity grid mix of the respective country is used. The analyzed battery has a cathode material LiNiMnCoO2 (NMC). A GaBi dataset is used for its impact assessment [55]. The battery cells are produced in South Korea (electricity mix: 0.627 kg CO2-eq./kWh) [53,54]. To evaluate the impact of the location of battery cell production, an additional scenario was modelled using the Swedish (0.042 kg CO2-eq./kWh) electricity mix [53,54]. We choose Sweden for a comparison scenario because there is a particularly large difference in terms of the emission factor of the electricity mix and because the company Northvolt is currently building production capacity for battery cells in Sweden [56]. The battery pack and e-moped are assembled in Germany. The energy consumption for assembling is assumed to be 3.9 kWh based on calculations of e-bility GmbH.
Most components are produced in China, Germany, South Korea, Spain, and Slovenia. It is assumed that the components are transported from South Korea and China to Germany by container ship (utilization: 70%, 5000 to 200,000 dwt payload capacity) and that all other transport journeys are made by road transport (Euro 4 truck, more than 32 t gross weight, 24.7 t payload capacity, utilization: 61%).
2.3. Inventory Data for the Use Phase and End-of-Life
For the use phase we need to consider not only the usage of the e-mopeds itself and its energy demand but also service trips to recharge them. Typically, these service trips are completed by service employees collecting the discharged batteries in the business area of the sharing service using vans, recharging them centrally, and then redistributing the charged batteries. For the use phase (well-to-wheel) data were collected from three different sources. First, we analyze usage data for a specific German city provided by an e-moped sharing provider to examine the average daily driven distance per e-moped and the average number of rentals per e-moped and day provider, as visualized in Figure 6 and Figure 7. Second, we conduct a literature review to validate the results of analysis of the data set provided by the sharing provider. Third, we obtain additional data regarding:
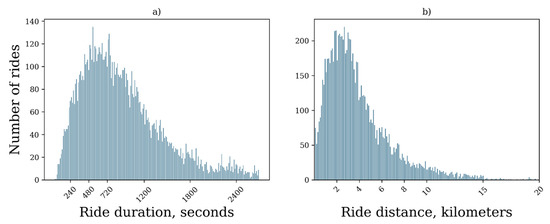
Figure 6.
Distributions of ride duration and distance, shown in subfigures (a,b), respectively, based on a data set provided by a German e-moped sharing provider.
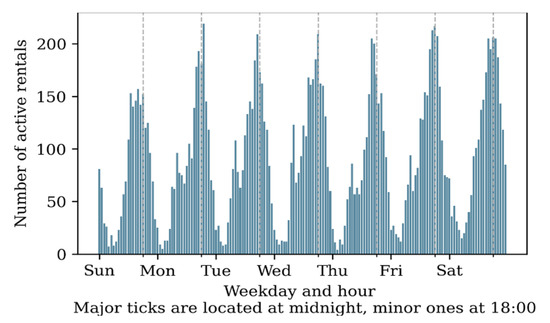
Figure 7.
Number of active rentals by hour of day and weekday. Major ticks are located at midnight, minor at 18:00.
- the lifetime of battery, vehicle, and tires;
- the utilization rate;
- the electricity grid mix used for charging of the e-moped;
- the energy demand and the range of the e-moped;
- the type of service vehicles used for battery swapping;
- and the frequency of battery swapping.
According to the dataset provided by the e-moped sharing provider, we calculate an average distance of 18.1 km per day based on an average distance per ride of 4.9 km and an average number of trips per day, per e-moped. We determine an average ride time per trip of 16.7 min. The literature review (cf. Table 2) shows average distances of 4.0–5.0 km per ride [45] and average ride times of 10–20 min per trip [10,44,45] for e-mopeds in shared use, which corresponds well to the values we have determined. However, the values determined by Howe et al. regarding the frequency of rentals differ significantly, with 6 rentals per day, resulting in an average distance of 24.0–30.0 km per day and e-moped [45]. The data determined by Hardt et al. are unsuitable for a comparison, as they consider the private use of e-mopeds.
Table 2.
Usage data of e-moped sharing.
Overall, the current empirical research on usage patterns of e-moped sharing services is very limited. Due to the lack of data and because we are considering a specific e-moped model in our LCA, we use the calculated data for the use case of a specific German city based on the dataset of the sharing provider in the further analysis. Moreover, the analyzed e-moped model is used in this city, which means we achieve a consistent data basis overall.
Our assumptions on the lifetime of the vehicle and battery were based on the manufacturer’s specification. According to this, the moped has a lifetime of 50,000 km, while the battery has a service life of 40,000 km. Within the sharing service, discharged batteries are collected for charging and swapped for charged batteries. Doubtless, more batteries than vehicles are in use in real operations, because batteries are charged (centrally) at the same time and other batteries need to be used in the vehicle. However, in our analysis, we consider the whole lifecycle. The interviewed sharing provider states that the batteries are not used specifically for one vehicle, but by several vehicles in the sharing fleet. Since batteries can be used in other vehicles of the fleet after the end of the vehicle’s life, the battery life is independent of the vehicle life. This would mean that 1.25 batteries would be needed over the lifetime of a scooter. To validate this assumption, we compared it with the results of other LCA studies on e-mopeds in private and shared use. The results can be found in Table 3.
Table 3.
Literature review on lifetime of battery and e-mopeds.
It is evident that in the literature, similar assumptions were made for the vehicle lifetime ranging between 48,000 km and 61,826 km [14,30,31]. Only the assumption of the Austrian Energy Agency deviates strongly, with 10,000 km [13]. Regarding battery life, the assumptions diverge further. The Austrian Energy Agency assumes a battery life of only 5000 km [13], de Bortoli, 2021, of 24,000 km [31]. However, the assumptions of Wortmann et al., 2021 [30] and Hofmann et al. 2013 [14] (1500 charging cycles, respectively; 50,000 km per battery) clearly exceed our assumptions. If the battery of the Kumpan, 1954 Ri is charged every two days (based on the assumption of a daily distance of 18.1 km per moped and a range of 43 km per battery), this would correspond to a battery lifetime of 54,300 km. Overall, our assumption of a battery lifetime of 40,000 km seems reasonable, even when taking possible battery degradation due to freezing temperatures in winter into account.
An overview of our basic assumptions for the use phase are shown in Table 4.
Table 4.
Basic assumptions for the usage phase.
For end-of-life the e-moped is shredded. No credits are accounted. The energy consumption for this is 15 kWh [53,54].
2.4. Scenarios for the Use Phase
E-moped sharing is a relatively new business. Therefore, limited reliable usage and operational data for e-moped sharing services are available, as outlined in Section 1 and Section 2.3. To take these uncertainties into account, five scenarios for the use phase were created. The five scenarios differ in terms of the total distance travelled over the lifetime, the emission factor of the electricity grid mix used for charging the e-moped, the vehicle used for swapping the batteries, the range of the e-moped and, depending on this, the energy demand as well as the frequency of battery swapping, as shown in Table 5.
Table 5.
Parameter specification of the scenario analysis.
2.4.1. Scenario 1: Base Case
The manufacturer of the analyzed e-moped estimates a kilometrage of 5000 km over the e-moped’s lifetime. Based on a battery lifetime of 40,000 km, 1.25 batteries are required over the e-moped lifetime. This assumes that the batteries will be used for other vehicles in the fleet after the end of the moped’s lifetime. Furthermore, we expect four sets of tires are needed. Using one battery with a capacity of 1.47 kWh, the analyzed e-moped has a realistic range of 43 km, resulting in an energy demand of 0.034 kWh per km. The environmental impacts for charging are modelled according to the emission factor of the German electricity grid mix of 2019 (0.452 kg CO2-eq./kWh) [53,54]. It is assumed the batteries are swapped with diesel vans (Euro 4, 3.5 t). The van has a GWP of 386 g CO2-eq./km considering its entire lifecycle [53,54]. With an e-moped range of 43 km and average daily distance of 18.1 km, the batteries need to be swapped every other day. It is assumed a van travels 75 km daily to supply 50 e-mopeds. Hence the daily distance of the service vehicle is 1.5 km per e-moped.
2.4.2. Scenario 2: Shorter Lifetime (−40% Kilometrage)
The manufacturer of the analyzed e-moped states it has a lifetime of 50,000 km. However, since there are other models with a shorter lifetime and since, especially in sharing services, accidents by inexperienced users and vandalism must be considered, we tested a scenario with a lifetime of 30,000 km. As a result, only 0.75 batteries and two sets of tires are required over the lifetime of a e-moped.
2.4.3. Scenario 3: Longer Range (−66% Battery Swapping Frequency)
The analyzed e-moped can be equipped with up to three batteries. In order to consider the effects of a different number of batteries, we analyze the use of three batteries in this scenario, extending its range to 125 km. Considering one battery’s capacity of 1.47 kWh, this results in an energy demand of 0.035 kWh per km. The longer range affects the battery swapping process: it is assumed the batteries only need to be swapped every six days (−66% battery swapping frequency), thereby reducing the distance of the vans per e-moped and day to 0.5 km. The use of two batteries is implemented in practice as well and would have a corresponding effect on the number of service trips (−33% battery swapping frequency).
2.4.4. Scenario 4: Solar Power for Charging
To evaluate the impact of the electricity mix used to charge the e-mopeds, it is assumed the e-mopeds are charged with solar power in this scenario. The environmental impact is modelled according to the country-specific conditions of German electricity from solar. The GWP is 0.067 kg CO2-eq./kWh.
2.4.5. Scenario 5: Battery Swapping with E-Vans (incl. Solar Power)
It is assumed batteries are swapped with an electric van. The production and the transport of the van were modelled [53,54,57] and included in the assessment, considering a lifetime of the van of 150,000 km [58]. The analyzed e-van has a range of 160 km and a battery capacity of 56 kWh [59] resulting in an energy demand of 0.35 kWh per km. The impact of the electricity demand of the e-van is modelled according to the German electricity from solar [53,54], resulting in a GWP of 55 g CO2-eq. per kilometer travelled considering the van’s entire lifecycle.
3. Results
Figure 8 shows the life cycle environmental impacts of e-mopeds in shared use related to one passenger-kilometer travelled for each scenario. Numerical data for Figure 7 are given in the Table A3 and Table A4 of Appendix A. Numerical data for additional impact categories for scenario 1 can be found in Table A5 of Appendix A. In the base case, the average GWP is 51 g CO2-eq./pkm, with 28% from production, <1% from transport and 71% from use phase. In the use phase, 32% of the GWP is caused by the emissions resulting from the electricity produced to fulfill the energy demand of the e-mopeds. A total of 68% of the emissions within the use phase are caused by the direct and emissions of the battery swapping vehicles. End-of-life accounts for only <1% of the GWP. If the lifetime is reduced by 40% to 30.000 km (scenario 2), the GWP increases by 14%. The share of the production phase in the GWP increases to 37%. This is due to the fact that the emissions of the production phase are distributed over a lower kilometrage, thus increasing the emissions per passenger-kilometer.
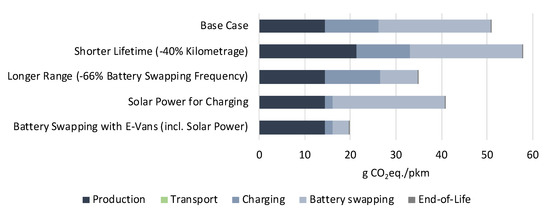
Figure 8.
Life cycle environmental impacts for electric moped scooters in shared use under alternative scenarios for global warming potential.
Within scenario 3, the GWP decreases by 32% compared to scenario 1. The share of the use phase drops to 59%. The assumed usage of three batteries results in a longer range of the e-moped. Due to the longer range, the batteries need to be swapped less frequently. It is assumed that only one third of the service vehicle’s trips are required to swap the battery, so that the service vehicle’s emissions are also lower per passenger-kilometer of the e-moped. In addition, this improvement outweighs the slightly increased energy demand of the e-moped when using three batteries.
By using solar power for charging (scenario 4), the GWP is reduced by 20%. The total share of the use phase drops to 64%. The GWP of the energy demand decreases to 2 g CO2-eq./pkm. This reduction is achieved because solar energy has a much lower emission factor (0.067 g CO2-eq/kWh) than the electricity grid (0.452 g CO2-eq./kWh) mix assumed in scenario 1–3. If, in addition, electric vans are used for battery swapping trips and these vans are charged with solar power, as assumed in scenario 5, the GWP drops by 61% to 20 g CO2-eq./pkm compared to scenario 1. The reduction can be achieved because the emission factor of the electric service vehicle (55 g CO2-eq./km) is significantly lower than the emission factor of diesel vans (386 g CO2-eq./km).
Figure 9 shows the GWP of the production of one e-moped. Numerical data regarding the production of the e-moped with one battery is given in Table A6 of Appendix A. Including the production of one battery pack, the GWP is 801 kg CO2-eq. The production of aluminum components accounts for 25%, steel for 12%, the battery pack for 18%, the motor for 24%, plastic components for 10% and the assembly for less than1%. The share of aluminum in the GWP is particularly high, considering its share in the e-moped’s weight of only 11%. The high emissions of aluminum components are attributable to the high energy intensity of aluminum production. Considering the production of three battery packs—corresponding to a fully equipped e-moped—the GWP increases by 36%. This indicates the battery pack should be used over its full kilometrage, beyond the lifetime of the e-moped.
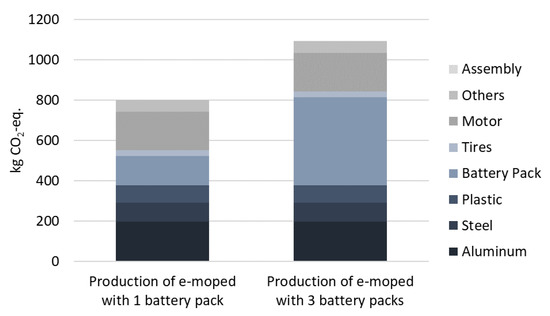
Figure 9.
Global warming potential of the production of one e-moped scooter with one battery pack compared to three battery packs.
Figure 10 focuses on the GWP of the production of one battery pack of the Kumpan 1954 Ri. As the figure shows, battery cells account for the largest share (73%) of the GWP of the battery pack. For our analysis, we assumed the battery cells are produced in South Korea with the South Korean electricity mix, as it is the case for the Kumpan 1954 Ri battery. By using the Swedish electricity mix with its lower GWP of 0.042 kg CO2-eq./kWh, the GWP of battery cell production could decrease by 17%. Numerical data for Figure 10 are given in Table A7 of Appendix A.
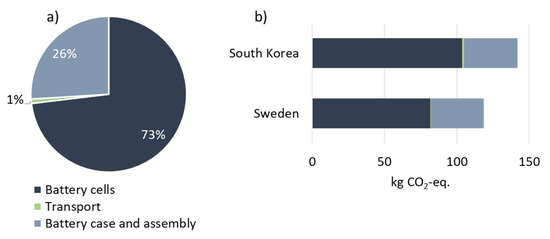
Figure 10.
(a) Share of components in the global warming potential of battery production and (b) global warming potential of battery pack production using different electricity grid mixes.
To put the environmental impact of e-moped sharing into perspective, it is necessary to compare it with alternative transport modes. Therefore, we compared the results of our study with previous studies of the LCA global warming potential of different transport modes As shown in Figure 11, e-moped sharing has lower global warming potential than private ICE mopeds, as calculated by Weiss et al. [8], as well as ICE cars and public transport buses, as calculated by the German Environmental Agency [60], even in the worst case.
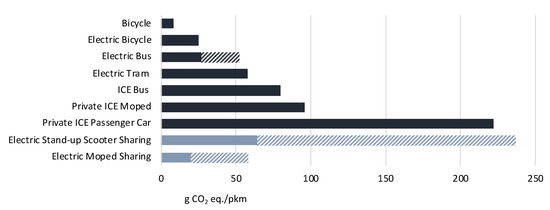
Figure 11.
Comparison of the Global Warming Potential of electric moped scooters in shared use to alternative modes of transport based on passenger-kilometer. Data for private bicycle, electric bicycle and mopeds with internal combustion engine (ICE) are based on [8], bus (ICE), tram and private car (ICE) are based on [60], electric bus are based on [61], data for stand-up electric scooter sharing are based on [24].
Our analysis of e-moped sharing shows results in a similar range of emissions per passenger kilometer (20–58 g CO2-eq./pkm) to electric buses (27–52 g CO2-eq./pkm), as calculated by Helmers et al., 2020 [61]. This comparison is particularly relevant when considering that sharing systems compete, in particular, with public transport and that the share of electrified buses in public transport is likely to increase in the future due to local regulations.
Shared e-mopeds also have a lower GWP than shared stand-up scooters, which were analyzed in a previous study [24]. The study on shared stand-up scooters also analyzed different scenarios regarding lifetime, battery swapping and charging. The best case assumes a lifetime of 24 months and the use of cargo bikes for battery swapping However, unlike our current study, it assumes the scooter are charged using the German electricity mix. This results in a higher GWP than in our worst case, even in the best case of [24].
The environmental impact of e-moped sharing should also be evaluated considering substitution rates: according to a study by Hofmann et al. [14], e-mopeds substitute mostly, namely, in 81% of cases, trips that would previously have been covered by private cars, conventional scooters or public transport. That means e-scooter sharing is most likely to substitute transport modes with a similar or higher GWP in relation to passenger-kilometers.
4. Conclusions
In this study, we determined that the GWP of shared e-mopeds is 20 g CO2-eq./pkm in the best case, when the e-mopeds are charged with solar power and the batteries are swapped with an electric van. Our worst case, i.e., assuming a 40% shorter e-moped lifetime, battery swapping with diesel vans, and charging with the German electricity mix, results in a GWP of 58 g CO2-eq./pkm. In the base case, the GWP is dominated by the use phase, especially by the electricity mix to charge the e-mopeds, the frequency of battery swapping and the type of vehicle used for swapping. In addition to the use phase, the production of the e-mopeds, especially of the aluminum parts and the battery pack, is an important influencing factor.
Previous studies on private e-scooters determined a GWP of 32.0 g CO2-eq./pkm [14], 59.6 g CO2-eq./pkm [13] and 74.0 g CO2-eq./pkm [8] for e-mopeds in private use, which correlates quite well with the worst case of this study, assuming a shorter lifetime (58 g CO2-eq./pkm), but also our base case (51 g CO2-eq./pkm) and scenario 3 (35 g CO2-eq./pkm). Wortmann et al. determined quite low values, of 18.7–36.7 g CO2-eq./pkm, in their LCA on e-moped sharing [30] compared to our results. These differences occur because the authors did not consider indirect emissions from service vehicles in their study. De Bortoli estimated a slightly higher GWP for shared e-mopeds within the pessimistic scenario of around 70 g CO2-eq./pkm [31]. However, this is also based on a lower vehicle lifetime compared to our worst case (scenario 2) of 20,000 km. The base case of the study is quite similar to our scenario 3, resulting in a GWP of around 35 g CO2-eq./pkm. Whereas de Bortoli assumed a lifetime of 48,000 km and a servicing distance of 20 m per passenger-kilometer of the e-moped, we assumed a lifetime of 50,000 km and a servicing distance of 26 m per passenger-kilometer of the e-moped.
Overall, our paper shows e-mopeds not only offer an effective solution to the urban challenge of space constraints; they can also reduce the GWP of the overall transport system, as e-mopeds are likely to substitute transport modes with a higher GWP, as shown by Hofmann et al. [14]. The stated high substitution rate of passenger cars by e-mopeds—especially compared to substitution rates of stand-up scooters—seems realistic, since in European countries the license required to drive e-mopeds (driving license class AM) is already included in the license required to drive passenger cars (driving license class B). Comparing the sharing of motor and stand-up e-mopeds, the question arises why the GWP of stand-up e-scooters is significantly higher even though both use similar business models. The results of this study and our previous study [24] show that the significantly shorter lifetime of stand-up scooters is an important driver for their higher environmental impact. Furthermore, unlike stand-up scooters, e-mopeds can be used by more than one person, further reducing the environmental impact per passenger-kilometer.
To further decrease the GWP of e-mopeds, it is recommended to reduce the impact of aluminum as it accounts for a disproportionately high share of the emissions of production (25%) compared to its weight share (11%). This could be achieved by substituting aluminum with alternative materials, by using secondary aluminum, or by using renewable energies in the production. Additionally, we suggest using renewable energy sources to power the battery cell production. Furthermore, manufacturers should adapt production materials and e-moped design to improve its lifetime. Sharing providers should use batteries beyond the e-moped’s lifetime or develop second life use cases for batteries to reduce the share of battery production in the e-moped’s GWP. Furthermore, sharing providers should use renewable energy for e-moped charging, reduce the frequency of battery swapping, and swap batteries with electric vehicles. An effective measure for local authorities to ensure that e-moped sharing is integrated into urban transport in an environmentally friendly way could be a directive not to use diesel vehicles for battery swapping, as GWP could be reduced by 61% if diesel vans are substituted by electric vans charged with solar energy.
Overall, e-moped sharing is an environmentally friendly transport mode compared with alternative transport modes, such as cars or public transport, if a long lifetime, efficient battery swapping and charging with renewable energies are achieved. Local authorities, sharing providers and manufacturers can use this study to the explore life cycle impacts of e-moped sharing. Through additional research on usage patterns and operating systems in sharing services, it could be possible to make even more precise statements on the impact of the use phase. However, it should be noted that the results are specific to the moped models analyzed and the use case of a German city. This requires the autonomous collection of further empirical data on usage patterns in e-moped sharing services, independently from sharing providers. A suitable method for this is, e.g., data scraping, as it has already been used in some studies on shared stand-up scooters [40]. Additionally, further research could examine the different impacts of private and shared use of e-moped in greater detail.
Since the focus of our work is on the environmental impact, other sustainability criteria, such as road safeties, were not considered. So far, there are no studies available on the road safety of electric moped sharing services, but since an increased visibility of traffic accident reports for free float sharing systems with electric stand-up scooters has been recorded [62], the situation should be investigated with regards to the road safety of e-moped sharing services in future research. However, there are significant differences in hazard assessment due to the difference in the two modes of transportation.
Finally, it is also necessary to further analyze the influence of e-moped sharing on the urban transportation in further studies by analyzing substitution rates, e.g., by conducting observations and interviews.
Author Contributions
Conceptualization, S.S. and S.F.; methodology, S.F. and N.S.; software, J.S., O.B. and N.S.; validation, S.F. and M.M.; formal analysis, J.S., O.B. and N.S.; resources, M.M.; data curation, J.S. and O.B.; writing—original draft preparation, N.S.; writing—review and editing, S.F., S.S. and O.B.; visualization, N.S. and O.B.; supervision, S.S.; project management, S.S.; project administration, S.F. and N.S.; funding acquisition, S.S. and N.S. All authors have read and agreed to the published version of the manuscript.
Funding
This research was funded by the German Federal Ministry of Education and Research, grant number 13FH0E33IA.
Data Availability Statement
The LCA data presented in this study are available in the Appendix A. The usage data presented in this study are available on request from the corresponding author. The data are not publicly available due to privacy restrictions.
Acknowledgments
We thank Silke Scharnberg as well as Robin Reinhardt for assistance with the life cycle assessment of the battery pack and the electric motor, and Hayden Forrister for comments that greatly improved the manuscript.
Conflicts of Interest
The authors declare no conflict of interest. The funders had no role in the design of the study; in the collection, analyses, or interpretation of data; in the writing of the manuscript; or in the decision to publish the results.
Appendix A
Table A1.
Technical characteristics of different e-moped models according to [50].
Table A1.
Technical characteristics of different e-moped models according to [50].
| Brand, Model | Mass, Excluding Driver | Rated Power | Certified Energy Consumption | Real World Energy Consumption | Battery Capacity | Drive Range, Certified | Drive Range, Real World |
|---|---|---|---|---|---|---|---|
| Unit | kg | kW | kWh/100 km | kWh/100 km | kWh | km | km |
| Avan Motors, Trend E | 62 | 0.8 | 2.09 | n.a. | 2.3 | 110.2 | n.a. |
| Avan Motors, Xero+ | 62 | 0.8 | 2.09 | n.a. | 2.3 | 110.2 | n.a. |
| NIU, N1S | 95 | 2.4 | 2.13 | n.a. | 1.7 | 80.0 | n.a. |
| NIU, NGT | 99 | 3 | 2.10 | n.a. | 2.1 | 100.0 | n.a. |
| Nova Motors, eRetro Star | 75 | 2 | 4.00 | n.a. | 1.2 | 30.0 | n.a. |
| Nova Motors, Motorroller Bendi | 111 | 0.8 | 4.00 | n.a. | 1.2 | 30.0 | n.a. |
| Okinawa, Ridge | 96 | 0.8 | 1.56 | n.a. | 1.4 | 92.6 | n.a. |
| Piaggio, Vespa Elettrica | 130 | 4 | 4.20 | 6 | 4.2 | 100.0 | 70 |
| Trinity, E-Roller | 90 | 3 | 3.20 | n.a. | 1.3 | 40.6 | n.a. |
| Trinity, E-Roller | 105 | 4 | 4.50 | n.a. | 2 | 44.4 | n.a. |
| Median value | 95.5 | 2.2 | 2.66 | 6 | 1.9 | 86.3 | 70 |
Table A2.
List of the e−scooter materials.
Table A2.
List of the e−scooter materials.
| Materials/Assemblies | Quantity | Unit |
|---|---|---|
| Acrylonitrile butadiene styrene [ABS] | 1.01 × 101 | kg |
| Aluminum | 1.85 × 101 | kg |
| Cast iron | 2.30 × 10⁻² | kg |
| Chrome | 3.84 × 10⁻³ | kg |
| Copper cable 1-wire | 9.38 × 10⁻¹ | kg |
| Copper cable 3-wire | 2.12 × 10⁻¹ | kg |
| Copper cable 5-wire | 4.10 × 10⁻² | kg |
| Float flat glass | 9.00 × 10⁻² | kg |
| Glass lamp bulbs (soda-lime) | 2.20 × 10⁻² | kg |
| Knit te × tile fabric | 2.69 × 10⁻¹ | kg |
| NMC-battery Cell | 6.44 × 100 | kg |
| Polycarbonate [PC] | 2.10 × 10⁻¹ | kg |
| Polyethylene foam [PE] | 8.65 × 10⁻¹ | kg |
| Polymethylmethacrylate [PMMA] | 1.46 × 10⁻¹ | kg |
| Polypropylene [PP] | 1.23 × 101 | kg |
| Polytetrafluoroethylene [PTFE] | 3.19 × 10⁻¹ | kg |
| Printed wiring board HASL 2-layer | 4.29 × 10⁻¹ | sqm |
| Styrene-butadiene-rubber [SBR] | 8.95 × 100 | kg |
| Stainless steel | 1.76 × 100 | kg |
| Steel | 4.08 × 101 | kg |
| Zinc | 1.47 × 10⁻² | kg |
Table A3.
Evaluation of the contribution of the life cycle phases for the different prolonged lifetime scenarios on the global warming potential impact category per passenger-kilometer. Unit: g CO2-eq./pkm. The emission factors of electricity for charging with the German grid mix and solar power are 4.52 × 10² respectively 6.72 × 101 gCO2-eq./kWh.
| Scenario | Production | Transport | Charging | Battery Swapping | End-of-Life |
|---|---|---|---|---|---|
| Base Case | 1.44 × 101 | 1.39 × 10⁻⁴ | 1.18 × 101 | 2.46 × 101 | 7.41 × 10⁻⁵ |
| Shorter Lifetime (−40% Kilometrage) | 2.13 × 101 | 2.31 × 10⁻⁴ | 1.18 × 101 | 2.46 × 101 | 1.24 × 10⁻⁴ |
| Longer Range (−66% Battery Swapping Frequency) | 1.44 × 101 | 1.39 × 10⁻⁴ | 1.22 × 101 | 8.20 × 100 | 7.41 × 10⁻⁵ |
| Solar Power for Charging | 1.44 × 101 | 1.39 × 10⁻⁴ | 1.74 × 100 | 2.46 × 101 | 7.41 × 10⁻⁵ |
| Battery Swapping with E-Vans (incl. Solar Power) | 1.44 × 101 | 1.39 × 10⁻⁴ | 1.74 × 100 | 3.51 × 100 | 7.41 × 10⁻⁵ |
Table A4.
Evaluation of the contribution of the life cycle phases for the different prolonged lifetime scenarios on the primary energy demand impact category per passenger-kilometer. Unit: MJ/pkm. The primary energy demand of electricity for charging with the German grid mix and solar power are 6.53 × 100 respectively 9.36 × 10⁻¹ MJ/kWh.
| Scenario | Production | Transport | Charging | Battery Swapping | End-of-Life |
|---|---|---|---|---|---|
| Base Case | 2.25 × 10⁻¹ | 1.97 × 10⁻³ | 1.71 × 10⁻¹ | 3.56 × 10⁻¹ | 1.38 × 10⁻⁸ |
| Shorter Lifetime (−40% Kilometrage) | 3.00 × 10⁻¹ | 3.29 × 10⁻³ | 1.71 × 10⁻¹ | 3.56 × 10⁻¹ | 2.30 × 10⁻⁸ |
| Longer Range (−66% Battery Swapping Frequency) | 2.25 × 10⁻¹ | 1.97 × 10⁻³ | 1.76 × 10⁻¹ | 1.19 × 10⁻¹ | 1.38 × 10⁻⁸ |
| Solar Power for Charging | 2.25 × 10⁻¹ | 1.97 × 10⁻³ | 2.45 × 10⁻² | 5.89 × 10⁻² | 1.38 × 10⁻⁸ |
| Battery Swapping with E-Vans (incl. Solar Power) | 2.25 × 10⁻¹ | 1.97 × 10⁻³ | 2.45 × 10⁻² | 5.89 × 10⁻² | 1.38 × 10⁻⁸ |
Table A5.
Impact assessment results for the electric moped scooter sharing in scenario 1 “Base Case” for five impact categories per passenger-kilometer.
Table A5.
Impact assessment results for the electric moped scooter sharing in scenario 1 “Base Case” for five impact categories per passenger-kilometer.
| Impact Category | Unit | Production | Transport | Charging | Battery Swapping | End-of-Life |
|---|---|---|---|---|---|---|
| Acidification Potential | g SO2-eq./pkm | 6.59 × 10⁻² | 3.41 × 10⁻³ | 2.28 × 10⁻² | 2.46 × 10⁻² | 7.82 × 10⁻¹ |
| Eutrophication Potential | g Phosphate-eq./pkm | 4.33 × 10⁻³ | 3.97 × 10⁻⁴ | 3.63 × 10⁻³ | 4.26 × 10⁻³ | 5.74 × 10⁻² |
| Global Warming Potential | g CO2-eq./pkm | 1.42 × 101 | 1.39 × 10⁻¹ | 1.36 × 101 | 2.46 × 101 | 7.41 × 10⁻⁵ |
| Photochemical Ozone Creation Potential | g Ethene-eq./pkm | 5.10 × 10⁻³ | 1.31 × 10⁻⁴ | 1.75 × 10⁻³ | −1.64 × 10⁻³ | 5.26 × 10⁻⁶ |
| Primary Energy Demand (non-renewable) | MJ/pkm | 2.23 × 10⁻¹ | 1.97 × 10⁻³ | 1.75 × 10⁻³ | 3.56 × 10⁻¹ | 1.38 × 10⁻⁸ |
Table A6.
Impact assessment results for the material and manufacturing phase of one moped scooter with one battery for the analyzed materials and assemblies for five impact categories.
Table A6.
Impact assessment results for the material and manufacturing phase of one moped scooter with one battery for the analyzed materials and assemblies for five impact categories.
| Materials/Assemblies | Acidification Potential | Eutrophication Potential | Global Warming Potential | Photochemical Ozone Creation Potential | Primary Energy Demand (Non-Renewable) |
|---|---|---|---|---|---|
| Unit | kg SO2-eq. | kg Phosphat-eq. | kg CO2-eq. | kg Ethene-eq. | MJ |
| Motor | 1.12 × 100 | 6.241 × 0−2 | 1.91 × 10² | 8.67 × 10⁻² | 1.93 × 10³ |
| Battery | 1.09 × 100 | 5.48 × 10⁻² | 1.46 × 10² | 5.87 × 10⁻² | 2.16 × 10³ |
| Aluminum | 9.76× 10⁻¹ | 6.28 × 10⁻² | 1.98 × 10² | 7.45 × 10⁻² | 2.03 × 10³ |
| Tires | 3.35 × 10⁻² | 5.17 × 10⁻³ | 2.90 × 101 | 6.34 × 10⁻³ | 9.34 × 10² |
| Plastic | 1.60 × 10⁻¹ | 2.31 × 10⁻² | 8.37 × 101 | 1.98 × 10⁻² | 2.38 × 10³ |
| Steel | 2.59 × 10⁻¹ | 2.16 × 10⁻² | 9.39 × 101 | 3.03 × 10⁻² | 9.86 × 10² |
| Other | 2.65 × 10⁻¹ | 2.18 × 10⁻² | 5.69 × 101 | 2.11 × 10⁻² | 7.19 × 10² |
| Assembly | 4.00 × 10⁻³ | 7.48 × 10⁻⁴ | 2.85 × 100 | 2.81 × 10⁻⁴ | 4.12 × 101 |
Table A7.
Global warming potential of battery pack production using different electricity grid mixes. Unit: kg CO2-eq.
Table A7.
Global warming potential of battery pack production using different electricity grid mixes. Unit: kg CO2-eq.
| Assemblies/Life Phase | Sweden | Korea |
|---|---|---|
| Battery cells | 8.16 × 101 | 1.04 × 10² |
| Transport | 3.93 × 10⁻¹ | 1.30 × 100 |
| Battery Case | 3.66 × 101 | 3.69 × 101 |
References
- IEA Tracking Transport. 2020. Available online: https://www.iea.org/reports/tracking-transport-2020 (accessed on 23 June 2021).
- Ewert, A.; Brost, M.; Eisenmann, C.; Stieler, S. Small and Light Electric Vehicles: An Analysis of Feasible Transport Impacts and Opportunities for Improved Urban Land Use. Sustainability 2020, 12, 8098. [Google Scholar] [CrossRef]
- Hyvönen, K.; Repo, P.; Lammi, M. Light Electric Vehicles: Substitution and Future Uses. Transp. Res. Procedia 2016, 19, 258–268. [Google Scholar] [CrossRef]
- Heineke, K.; Kloss, B.; Scurlu, D.; Weig, F. Micromobility’s 15,000-Mile Checkup; McKinsey Co.: Chicago, IL, USA, 2019. [Google Scholar]
- Shaheen, S.; Chan, N.; Bansal, A.; Cohen, A. Shared Mobility: A Sustainability & Technologies Workshop: Definitions, Industry Developments, and Early Understanding 2015; TRB, Transportation Research Board: Washington, DC, USA, 2015. [Google Scholar]
- ITF Safe Micromobility. Report by the International Transport Forum OECD/ITF; OECD/ITF: Paris, France, 2020. [Google Scholar]
- Institute for Transportation and Development Policy. The Electric Assist: Leveraging E-Bikes and E-Scooters for More Livable Cities; ITDP: New York, NY, USA, 2019. [Google Scholar]
- Weiss, M.; Dekker, P.; Moro, A.; Scholz, H.; Patel, M.K. On the Electrification of Road Transportation—A Review of the Environmental, Economic, and Social Performance of Electric Two-Wheelers. Transp. Res. Part D Transp. Environ. 2015, 41, 348–366. [Google Scholar] [CrossRef]
- EUR-Lex. European Parliament and the Council Directive 2007/46/EC of the European Parliament and of the Council of 5 September 2007 Establishing a Framework for the Approval of Motor Vehicles and Their Trailers, and of Systems, Components and Separate Technical Units Intended for Such Vehicles. Off. J. Eur. Union 2007, 263, 1–160. [Google Scholar]
- Howe, E.; Jacobsen, F.J. Unu Global Scooter Sharing Market Report 2019; Unu GmbH: Berlin, Germany, 2019. [Google Scholar]
- Howe, E.; Jakobsen, F.J. Unu Global Moped Sharing Market Report 2020; Unu GmbH: Berlin, Germany, 2020. [Google Scholar]
- Brunner, H.; Hirz, M.; Hirschberg, W.; Fallast, K. Evaluation of Various Means of Transport for Urban Areas. Energy Sustain. Soc. 2018, 8, 9. [Google Scholar] [CrossRef] [Green Version]
- Österreichische Energieagentur—Austrian Energy Agency E-MOTO—Aktions- Und Motivationsplan Zur Etablierung Der E-Mobilität Bei Jungen ZweiradlenkerInnen. 2015. Available online: https://www.klimafonds.gv.at/wp-content/uploads/sites/16/Endbericht-E-Moto.pdf (accessed on 19 July 2021).
- Hofmann, H.; Kaufmann, R.; Tschopp, O.; Widmer, R.; Gauch, R.; Haefeli, U.; Schwegler, U. E-Scooter–Sozial-Und Naturwissenschaftliche Beiträge Zur Förderung Leichter Elektrofahrzeuge in Der Schweiz; IKAÖ: Bern, Switzerland, 2013. [Google Scholar]
- Dolganova, I.; Rödl, A.; Bach, V.; Kaltschmitt, M.; Finkbeiner, M. A Review of Life Cycle Assessment Studies of Electric Vehicles with a Focus on Resource Use. Resources 2020, 9, 32. [Google Scholar] [CrossRef] [Green Version]
- Temporelli, A.; Carvalho, M.L.; Girardi, P. Life Cycle Assessment of Electric Vehicle Batteries: An Overview of Recent Literature. Energies 2020, 13, 2864. [Google Scholar] [CrossRef]
- Kawamoto, R.; Mochizuki, H.; Moriguchi, Y.; Nakano, T.; Motohashi, M.; Sakai, Y.; Inaba, A. Estimation of CO2 Emissions of Internal Combustion Engine Vehicle and Battery Electric Vehicle Using LCA. Sustainability 2019, 11, 2690. [Google Scholar] [CrossRef] [Green Version]
- Dai, Q.; Kelly, J.C.; Gaines, L.; Wang, M. Life Cycle Analysis of Lithium-Ion Batteries for Automotive Applications. Batteries 2019, 5, 48. [Google Scholar] [CrossRef] [Green Version]
- Tolomeo, R.; De Feo, G.; Adami, R.; Sesti Osséo, L. Application of Life Cycle Assessment to Lithium Ion Batteries in the Automotive Sector. Sustainability 2020, 12, 4628. [Google Scholar] [CrossRef]
- Cerdas, F.; Titscher, P.; Bognar, N.; Schmuch, R.; Winter, M.; Kwade, A.; Herrmann, C. Exploring the Effect of Increased Energy Density on the Environmental Impacts of Traction Batteries: A Comparison of Energy Optimized Lithium-Ion and Lithium-Sulfur Batteries for Mobility Applications. Energies 2018, 11, 150. [Google Scholar] [CrossRef] [Green Version]
- Chen, T.D.; Kockelman, K.M. Carsharing’s Life-Cycle Impacts on Energy Use and Greenhouse Gas Emissions. Transp. Res. Part. Transp. Environ. 2016, 47, 276–284. [Google Scholar] [CrossRef]
- Baptista, P.; Melo, S.; Rolim, C. Energy, Environmental and Mobility Impacts of Car-Sharing Systems. Empirical Results from Lisbon, Portugal. Procedia Soc. Behav. Sci. 2014, 111, 28–37. [Google Scholar] [CrossRef] [Green Version]
- Hollingsworth, J.; Copeland, B.; Johnson, J.X. Are E-Scooters Polluters? The Environmental Impacts of Shared Dockless Electric Scooters. Environ. Res. Lett. 2019, 14, 084031. [Google Scholar] [CrossRef]
- Severengiz, S.; Finke, S.; Schelte, N.; Wendt, N. Life Cycle Assessment on the Mobility Service E-Scooter Sharing. In Proceedings of the 2020 IEEE European Technology and Engineering Management Summit (E-TEMS), Dortmund, Germany, 5–7 March 2020; pp. 1–6. [Google Scholar]
- Moreau, H.; de Jamblinne de Meux, L.; Zeller, V.; D’Ans, P.; Ruwet, C.; Achten, W.M.J. Dockless E-Scooter: A Green Solution for Mobility? Comparative Case Study between Dockless E-Scooters, Displaced Transport, and Personal E-Scooters. Sustainability 2020, 12, 1803. [Google Scholar] [CrossRef] [Green Version]
- Kazmaier, M.; Taefi, T.T.; Hettesheimer, T. Techno-Economical and Ecological Potential of Electric Scooters: A Life Cycle Analysis. Eur. J. Transp. Infrastruct. Res. 2020, 20, 233–251. [Google Scholar]
- Severengiz, S.; Schelte, N.; Bracke, S. Analysis of the Environmental Impact of E-Scooter Sharing Services Considering Product Reliability Characteristics and Durability. Procedia CIRP 2021, 96, 181–188. [Google Scholar] [CrossRef]
- Gebhardt, L.; Wolf, C.; Ehrenberger, S.; Seiffert, R.; Krajzewicz, D.; Cyganski, R. E-Scooter-Potentiale, Herausforderungen Und Implikationen Für Das Verkehrssystem: Abschlussbericht Kurzstudie E-Scooter; Arbeitsberichte zur Verkehrsforschung: Berlin, Germany, 2021. [Google Scholar]
- Deutsche Energie-Agentur GmbH-German Energy Agency (dena). Dena-STUDIE. E-Scooter-Sharing–Eine Ganzheitliche Bilanz; Deutsche Energie-Agentur GmbH (dena), German Energy Agency: Berlin, Germany, 2021. [Google Scholar]
- Wortmann, C.; Syré, A.M.; Grahle, A.; Göhlich, D. Analysis of Electric Moped Scooter Sharing in Berlin: A Technical, Economic and Environmental Perspective. World Electr. Veh. J. 2021, 12, 96. [Google Scholar] [CrossRef]
- de Bortoli, A. Environmental Performance of Shared Micromobility and Personal Alternatives Using Integrated Modal LCA. Transp. Res. Part D Transp. Environ. 2021, 93, 102743. [Google Scholar] [CrossRef]
- Reck, D.J.; Haitao, H.; Guidon, S.; Axhausen, K.W. Explaining Shared Micromobility Usage, Competition and Mode Choice by Modelling Empirical Data from Zurich, Switzerland. Transp. Res. Part C Emerg. Technol. 2021, 124, 102947. [Google Scholar] [CrossRef]
- Shen, Y.; Zhang, X.; Zhao, J. Understanding the Usage of Dockless Bike Sharing in Singapore. Int. J. Sustain. Transp. 2018, 12, 686–700. [Google Scholar] [CrossRef]
- Xu, Y.; Chen, D.; Zhang, X.; Tu, W.; Chen, Y.; Shen, Y.; Ratti, C. Unravel the Landscape and Pulses of Cycling Activities from a Dockless Bike-Sharing System. Comput. Environ. Urban Syst. 2019, 75, 184–203. [Google Scholar] [CrossRef]
- Du, Y.; Deng, F.; Liao, F. A Model Framework for Discovering the Spatio-Temporal Usage Patterns of Public Free-Floating Bike-Sharing System. Transp. Res. Part C Emerg. Technol. 2019, 103, 39–55. [Google Scholar] [CrossRef]
- Yang, Y.; Heppenstall, A.; Turner, A.; Comber, A. A Spatiotemporal and Graph-Based Analysis of Dockless Bike Sharing Patterns to Understand Urban Flows over the Last Mile. Comput. Environ. Urban Syst. 2019, 77, 101361. [Google Scholar] [CrossRef]
- Mathew, J.K.; Liu, M.; Seeder, S.; Li, H.; Bullock, D.M. Analysis of E-Scooter Trips and Their Temporal Usage Patterns. ITE J. 2019, 89, 44–49. [Google Scholar]
- Bai, S.; Jiao, J. Dockless E-Scooter Usage Patterns and Urban Built Environments: A Comparison Study of Austin, TX, and Minneapolis, MN. Travel Behav. Soc. 2020, 20, 264–272. [Google Scholar] [CrossRef]
- Eccarius, T.; Lu, C.-C. Adoption Intentions for Micro-Mobility–Insights from Electric Scooter Sharing in Taiwan. Transp. Res. Part D Transp. Environ. 2020, 84, 102327. [Google Scholar] [CrossRef]
- McKenzie, G. Spatiotemporal Comparative Analysis of Scooter-Share and Bike-Share Usage Patterns in Washington, D.C. J. Transp. Geogr. 2019, 78, 19–28. [Google Scholar] [CrossRef]
- Younes, H.; Zou, Z.; Wu, J.; Baiocchi, G. Comparing the Temporal Determinants of Dockless Scooter-Share and Station-Based Bike-Share in Washington, D.C. Transp. Res. Part A Policy Pract. 2020, 134, 308–320. [Google Scholar] [CrossRef]
- Hardt, C.; Bogenberger, K. Usage of E-Scooters in Urban Environments. Transp. Res. Procedia 2019, 37, 155–162. [Google Scholar] [CrossRef]
- Thompson, R.G.; Rose, G. Use of Powered Two-Wheelers in an Australian Capital City: Melbourne’s Central Business District. Transp. Res. Rec. J. Transp. Res. Board 2013, 2388, 54–60. [Google Scholar] [CrossRef]
- Aguilera-García, Á.; Gomez, J.; Sobrino, N. Exploring the Adoption of Moped Scooter-Sharing Systems in Spanish Urban Areas. Cities 2020, 96, 102424. [Google Scholar] [CrossRef]
- Howe, E. Global Scootersharing Market Report 2018; unu GmbH: Berlin, Germany, 2018. [Google Scholar]
- Bundesumweltministerium-German Federal Ministry for the Environment, Nature Conservation and Nuclear Safety. Novelle Des Klimaschutzgesetzes Beschreibt Verbindlichen Pfad Zur Klimaneutralität 2045; German Federal Ministry for the Environment, Nature Conservation and Nuclear Safety: Bonn, Germany, 2021.
- Brinkman, N.; Wang, M.; Weber, T.; Darlington, T. Well-to-Wheels Analysis of Advanced Fuel/Vehicle Systems: A North American Study of Energy Use, Greenhouse Gas Emissions, and Criteria Pollutant Emissions; EERE Publication and Product Library: Washington, DC, USA, 2005. [Google Scholar]
- ISO. International Organization for Standardization Environmental Management–Life Cycle Assessment–Principals and Framework; International Standard ISO 14040; ISO: Geneva, Switzerland, 2009. [Google Scholar]
- ISO. International Organization for Standardization Environmental Management–Life Cycle Assessment–Requirements and Guidelines; International Standard ISO 14044; ISO: Geneva, Switzerland, 2006. [Google Scholar]
- Weiss, M.; Cloos, K.C.; Helmers, E. Energy Efficiency Trade-Offs in Small to Large Electric Vehicles. Environ. Sci. Eur. 2020, 32, 46. [Google Scholar] [CrossRef] [Green Version]
- e-bility GmbH Model 54: Iconic. Available online: https://www.kumpan-electric.com/en/electricscooter/model-54-iconic/ (accessed on 19 July 2021).
- CML-Department of Industrial Ecology; Centrum voor Milieuwetenschappen Leiden. CML-IA Characterisation Factors; Universiteit Leiden: Leiden, The Netherlands, 2016. [Google Scholar]
- Sphera Solutions GmbH GaBi Software; Version 10.5.0.78; Software Zur Ganzheitlichen Bilanzierung; Sphera: Chicago, IL, USA, 2021.
- Sphera Solutions GmbH GaBi Professional Database 2021. Available online: https://gabi.sphera.com/support/gabi/gabi-database-2021-lci-documentation/professional-database-2021/ (accessed on 19 July 2021).
- Stoffregen, R.; Reuter, B. NMC Cell, Lithium-Ion-Battery Cell–NMC, LCO & Spinell, CN 2019. LCA data set.
- European Commission. European Backing for Northvolt’s Battery Gigafactory in Sweden; European Commission: Brussels, Belgium, 2020. [Google Scholar]
- Bausa, A.; Rudolf, M. LFP Cell, Lithium-Ion-Battery Cell–NCA & LiFEPO4, CN 2019. LCA data set.
- Ritthoff, M.; Schallaböck, K.O. Ökobilanzierung Der Elektromobilität; Wuppertal institute: Wuppertal, Germany, 2012. [Google Scholar]
- Busch, M.; Sakanoshita, Y. Maxus EV80. Available online: https://www.maske.de/fahrzeuge/leichte-nutzfahrzeuge/e-nutzfahrzeuge/maxus-ev80 (accessed on 23 June 2021).
- German Environmental Agency. Ökologische Bewertung von Verkehrsarten: Abschlussbericht; Umweltbundesamt: Dessau-Roßlau, Germany, 2020. [Google Scholar]
- Helmers, E.; Dietz, J.; Weiss, M. Sensitivity Analysis in the Life-Cycle Assessment of Electric vs. Combustion Engine Cars under Approximate Real-World Conditions. Sustainability 2020, 12, 1241. [Google Scholar] [CrossRef] [Green Version]
- Yang, H.; Ma, Q.; Wang, Z.; Cai, Q.; Xie, K.; Yang, D. Safety of Micro-Mobility: Analysis of E-Scooter Crashes by Mining News Reports. Accid. Anal. Prev. 2020, 143, 105608. [Google Scholar] [CrossRef]
Publisher’s Note: MDPI stays neutral with regard to jurisdictional claims in published maps and institutional affiliations. |
© 2021 by the authors. Licensee MDPI, Basel, Switzerland. This article is an open access article distributed under the terms and conditions of the Creative Commons Attribution (CC BY) license (https://creativecommons.org/licenses/by/4.0/).