Article

A Study on Indoor Particulate Matter Variation in Time Based on Count and Sizes and in Relation to Meteorological Conditions

Faculty of Engineering, Department of Materials and Environmental Engineering, “Dunarea de Jos” University of Galati, 47 Domneasca Street, 800008 Galati, Romania
Sustainability 2021, 13(15), 8263; https://doi.org/10.3390/su13158263
Submission received: 7 June 2021 / Revised: 9 July 2021 / Accepted: 19 July 2021 / Published: 23 July 2021

Abstract

:
An important aspect of air pollution analysis consists of the varied presence of particulate matter in analyzed air samples. In this respect, the present work aims to present a case study regarding the evolution in time of quantified particulate matter of different sizes. This study is based on data acquisitioned in an indoor location, already used in a former particulate matter-related article; thus, it can be considered as a continuation of that study, with the general aim to demonstrate the necessity to expand the existing network for pollution monitoring. Besides particle matter quantification, a correlation of the obtained results is also presented against meteorological data acquisitioned by the National Air Quality Monitoring Network. The transformation of quantified PM data in mass per volume and a comparison with other results are also addressed.

1. Introduction

Particulate matter (PM) is mentioned among the important pollutants that are necessary to be permanently monitored in highly populous cities in the European Union [1]. According to the mean diameter of the measured particulates, PM is classified in various categories, PM10 being one of the most researched and regulated [2]. Although already suspected to be dangerous, when present in great quantities in breathable air [3,4,5,6], PM of all kinds were even more so cataloged, in a new study, after using a physicochemical kinetic model [7] that proved the higher extent of the hazardous potential of these pollutants for human health. These later studies further emphasize the necessity to pinpoint the sources of particulate matter generators and to determine the variability in time and space of these pollutants in preparation towards measures to hinder their presence, at least in highly populated regions. Towards this purpose, an important factor to be considered is the relation of PM concentration to meteorological conditions, high amounts present in breathable air usually being in direct correlation with temperature, wind speed and precipitation [8,9].
The legislation currently in force [2] aims at the outdoor monitoring of PM, although a vast majority of the population carries out most of its activities indoors [10]. This is perhaps why, lately, a variety of studies have concentrated on indoor PM measurements [10,11,12,13,14,15]. Each mentioned study had in common the measurement of PM10, and the general conclusion is that the indoor PM concentration is obviously strictly related to the outdoor PM concentration; a possible measure in the case of registering high PM values could be represented by air purification filters, especially on premises where a large and young part of the population is situated, namely in schools [11]. As a provisionary measure, the amount of indoor particulate matter may be reduced, with moderate expense [16] and high efficiency [17], through utilization of air purifiers [16], although, as specified in [18], the effectiveness of this process is highly dependent on the resuspension factors that can vary from the surface and purpose of the indoor space, the number of people using that space, heating, cooling or ventilation means, etc. All these factors can be utilized in concordance with data related to meteorological conditions, and the possible utilization of purifiers might thus become more efficient.
The acquisition of different data related to air pollution and meteorological data is constantly underway in large cities in most countries, and in addition to these existing systems, some pilot projects [19,20,21,22], among which are independent ones such as [23,24], are already using relatively cheap sensors that can be integrated in a network able to provide real-time data on pollutant concentration and/or meteorological data. The valuable results of all this research lacks only the will of decision makers in order to create an efficient system that could autonomously activate, when necessary, any air purifiers in sensible indoor locations.
The present work was intended as a case study towards creating a clearer view on particulate matter circulation in a city that seems to lack an efficient air pollution monitoring system. This could represent an aid to solving the problems that air pollution can create for people’s health in agglomerated areas, and the present study can be of such aid through results regarding the variation of PM concentration in an indoor space during a specific time of the year. These data, correlated with meteorological conditions and compared with official results from the National Air Quality Monitoring Network, for the same area, exposed the limitations of the existing capabilities and the necessity to enhance their number and efficiency. Additionally, as a novelty of the present work, the architecture of the measuring campaign emphasized the difference in PM concentration relative to different positions of the same indoor location.

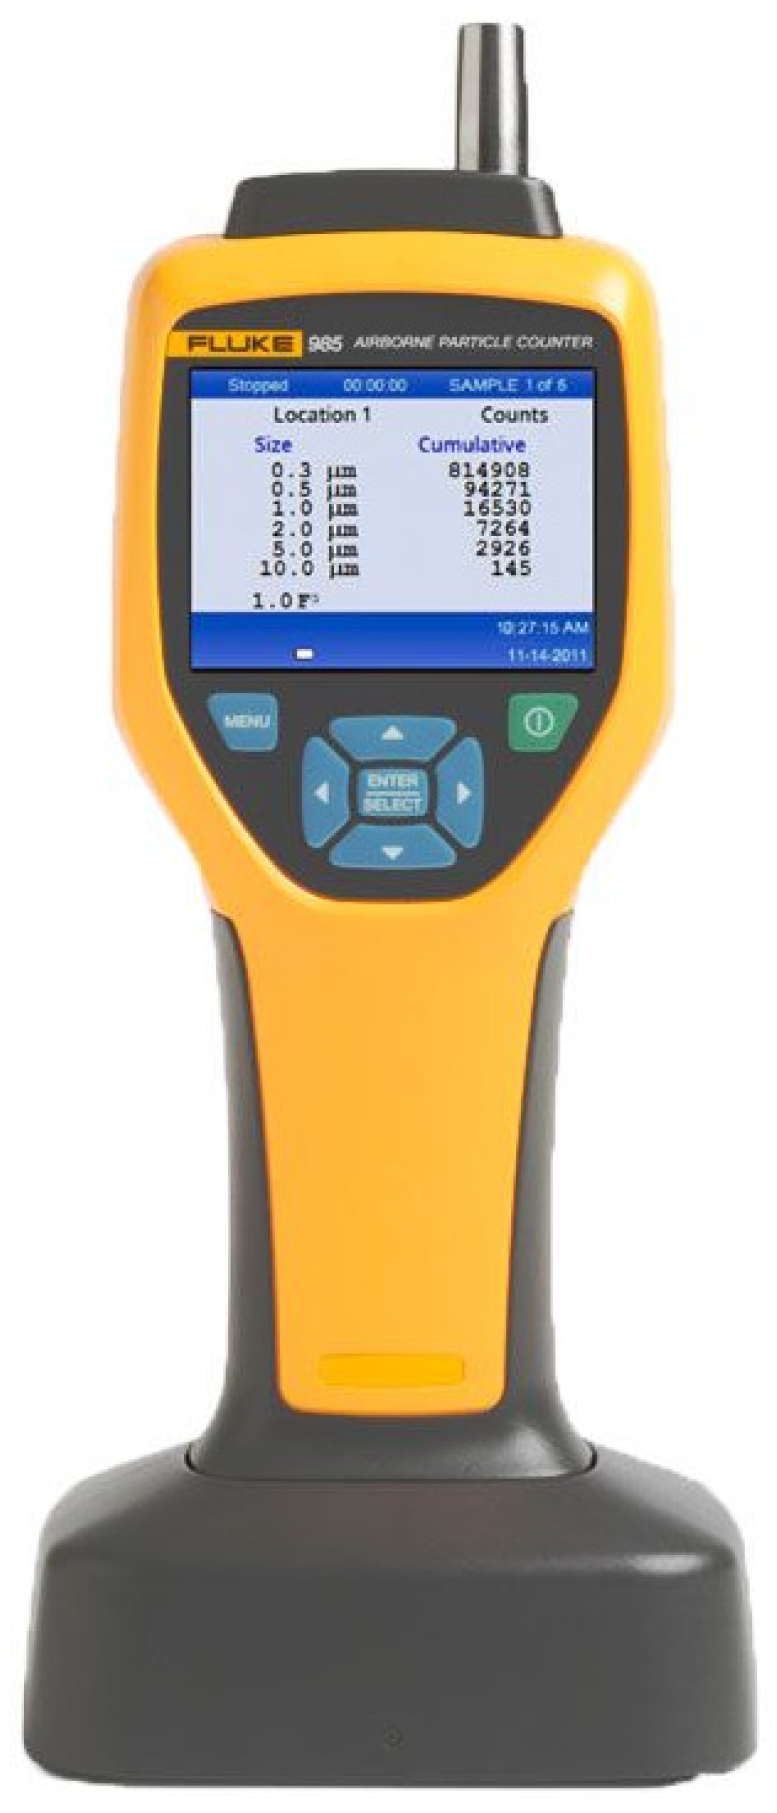
2. Materials and Methods

The location used in the present study is the same as that used in a previous study [25], and the timing was almost similar: namely, January, February and March months were used for the present study measurement campaign. These months are of greater interest, compared to the rest of the year, since the transition from the colder to warmer season offers the possibility to determine particle matter presence unhindered by the vegetation in its path. Additionally, similarities were encountered from the meteorological point of view between the two sampling campaigns, in both cases, little to no precipitation being registered.
An airborne particle counter apparatus, model Fluke 985 (Figure 1), was used to quantify the particulate matter by different types of dimensions. Some specifications are as follows: (i) 6 channels for measuring 0.3 µm, 0.5 µm, 1.0 µm, 2.0 µm, 5.0 µm and 10 µm sized airborne particles; (ii) flow rate: 2.83 L/min; (iii) light source: 775 nm to 795 nm, 90 mW class 3B laser. As a novelty for the indoor PM concentration measurement, the measuring apparatus used in this study was placed in three different spots of the same location, namely: S1—in the furthest point relative to the living room tilt-opened window; S2—near the living room tilt-opened window and S3—near the balcony’s tilt-opened window. At all times, both the balcony and the living room windows were tilt-opened, and the height of the sampler’s position was kept constant at 1200 mm. For each sampling spot, the same sampling program was used consisting of 168 sessions of airflow intake lasting 15 min each followed by a 45 min break and resulting in a 7-day period for each sampling spot. The architecture used for the measuring campaign was intended to emphasize the differences of PM concentration in three spots of the same location, starting from the furthest to the closest distance relative to the window that was seen as the major source of particulate matter.
The data related to meteorological conditions during sampling were collected from the official website of the Romanian National Air Quality Monitoring Network [27], the values being correlated with the exact timing of particle matter sampling, making the analysis of all data easier to compare.
Conversion of data related to counts of particle matter in mass per volume (as utilized in legislation regarding PM measurements) was done using a method that takes into account a mean of different densities that usually characterize these types of particles [28]. This method, although it presents a great deal of error margin, is nonetheless useful in the present study to demonstrate the indoor variation of particulate matter against time, the particulate matter dimension used for this purpose being 10 µm. This size allows for a better highlighting of PM evolution during an entire week, since the greater particulate mass also implies a more rapid deposition. Moreover, using the values for PM10, another novelty of the present study is the comparison of PM evolution data from the national monitoring network against data of the present study, during the same period of time and from the same area.

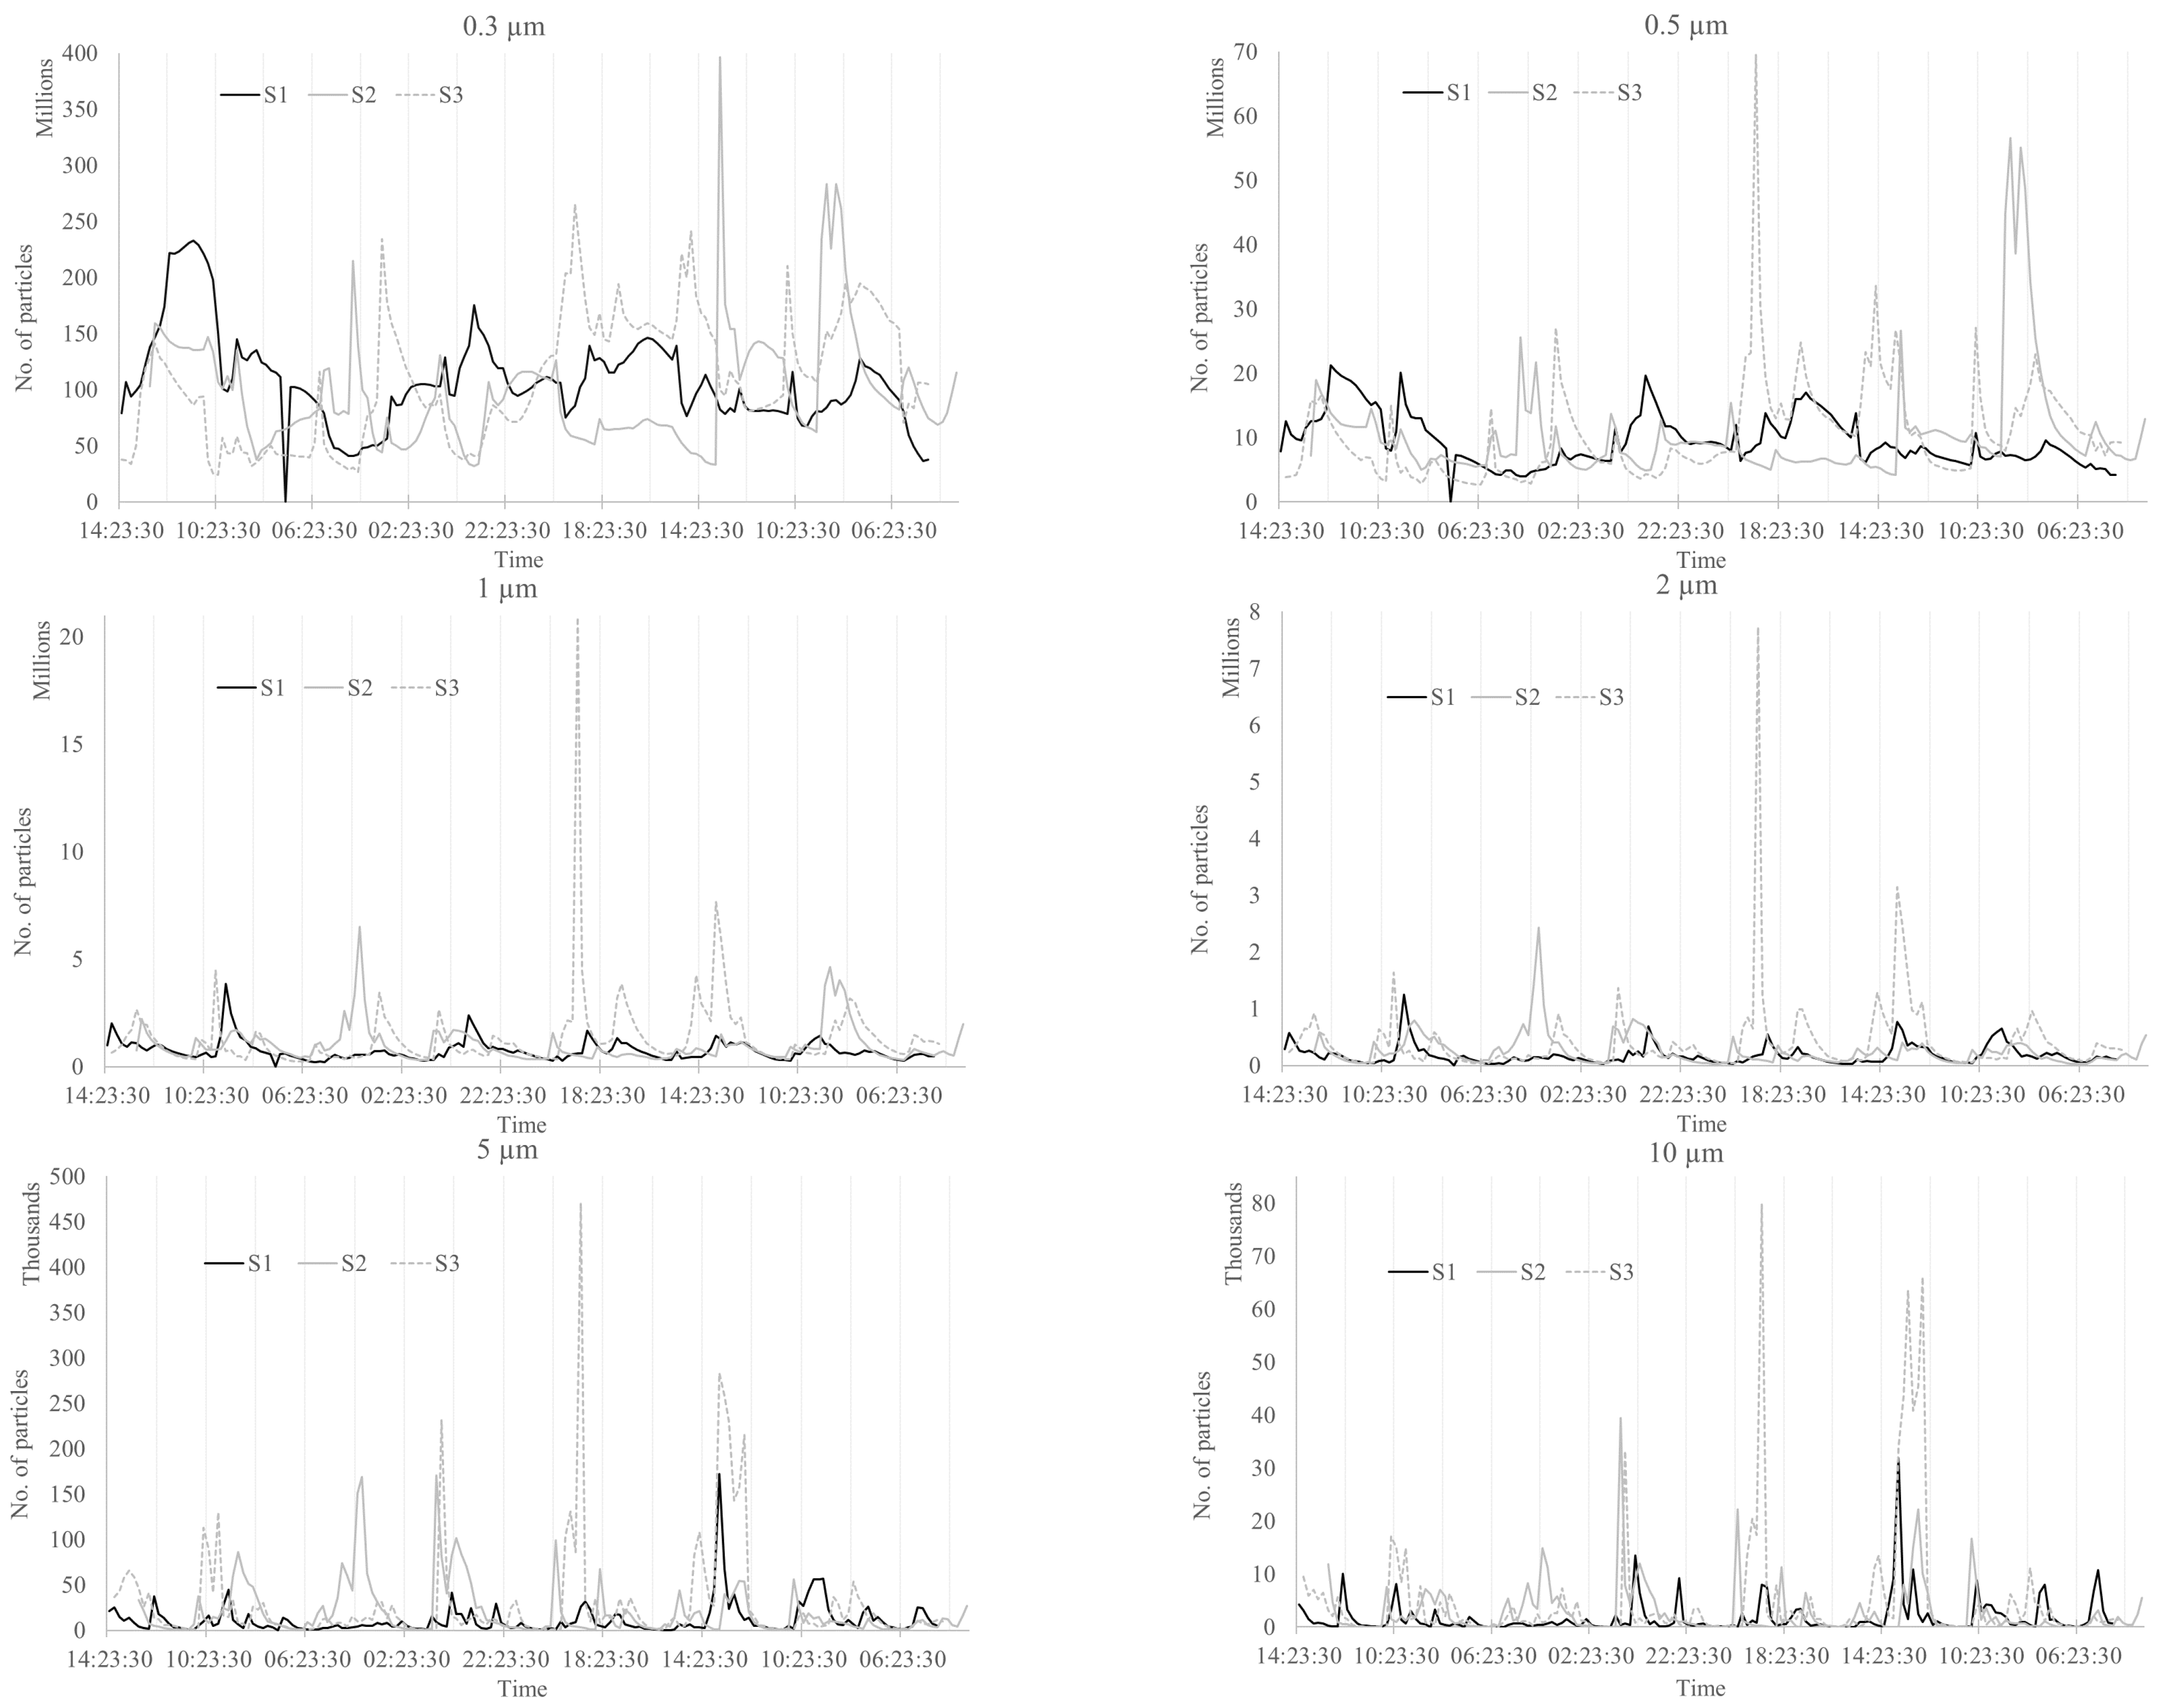
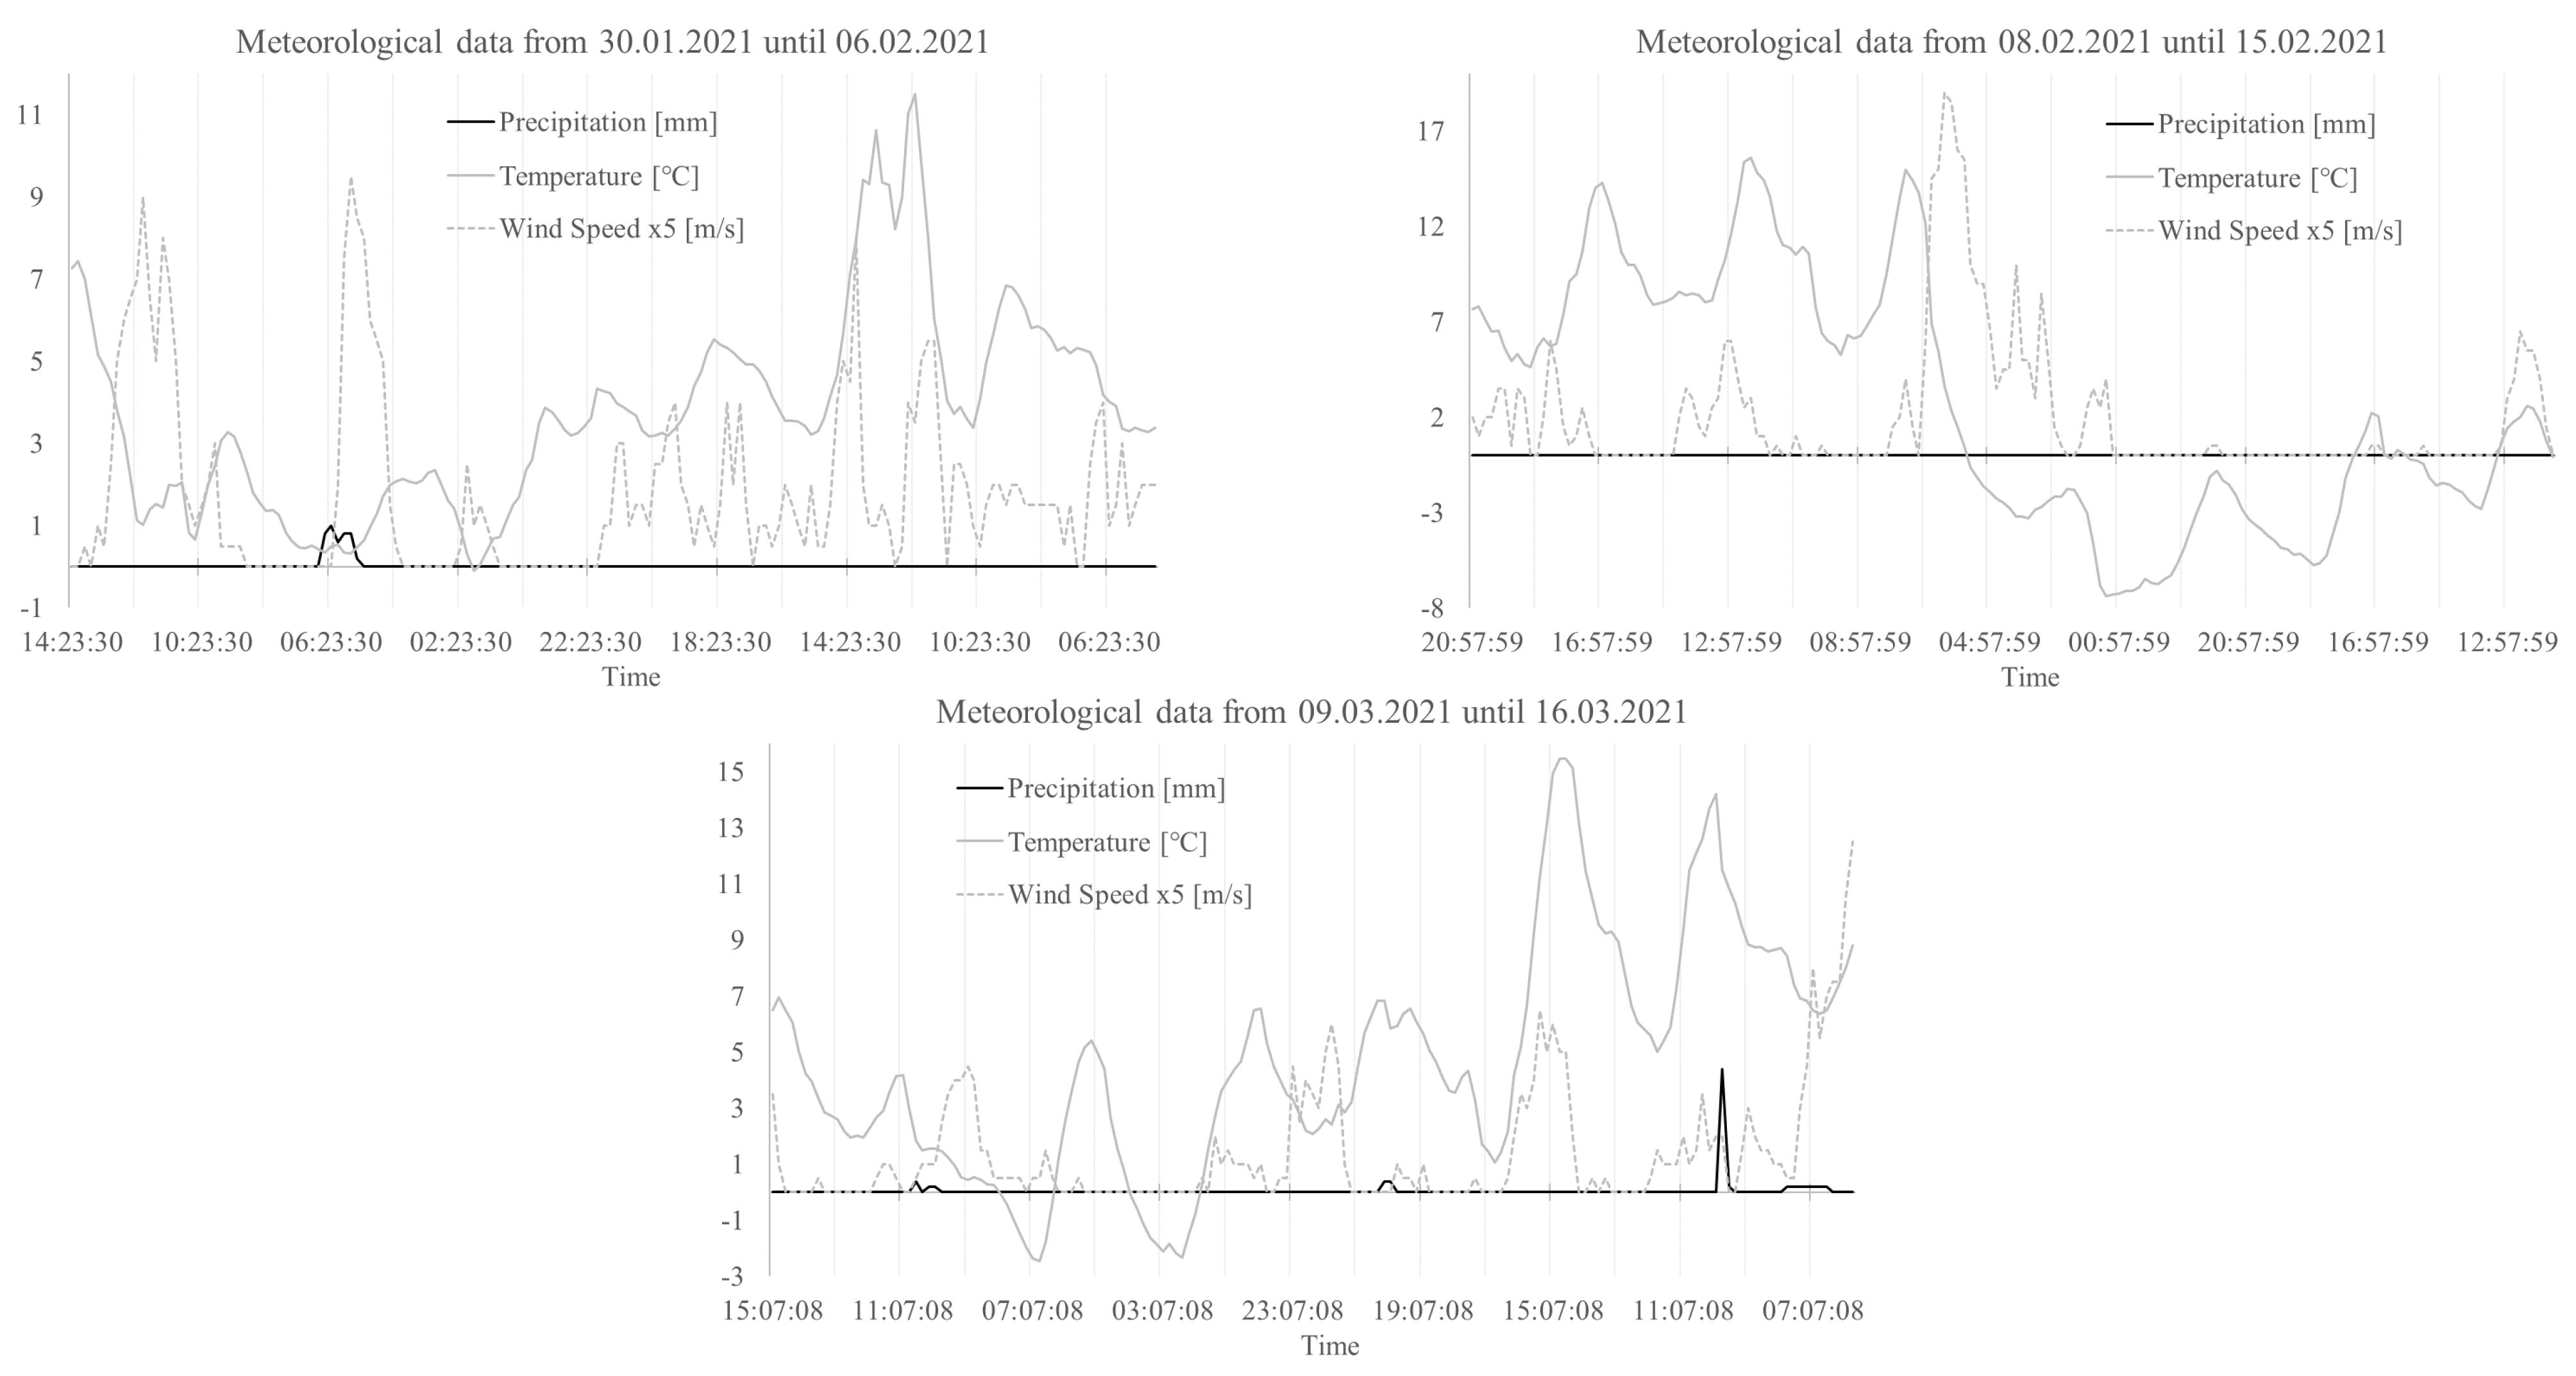
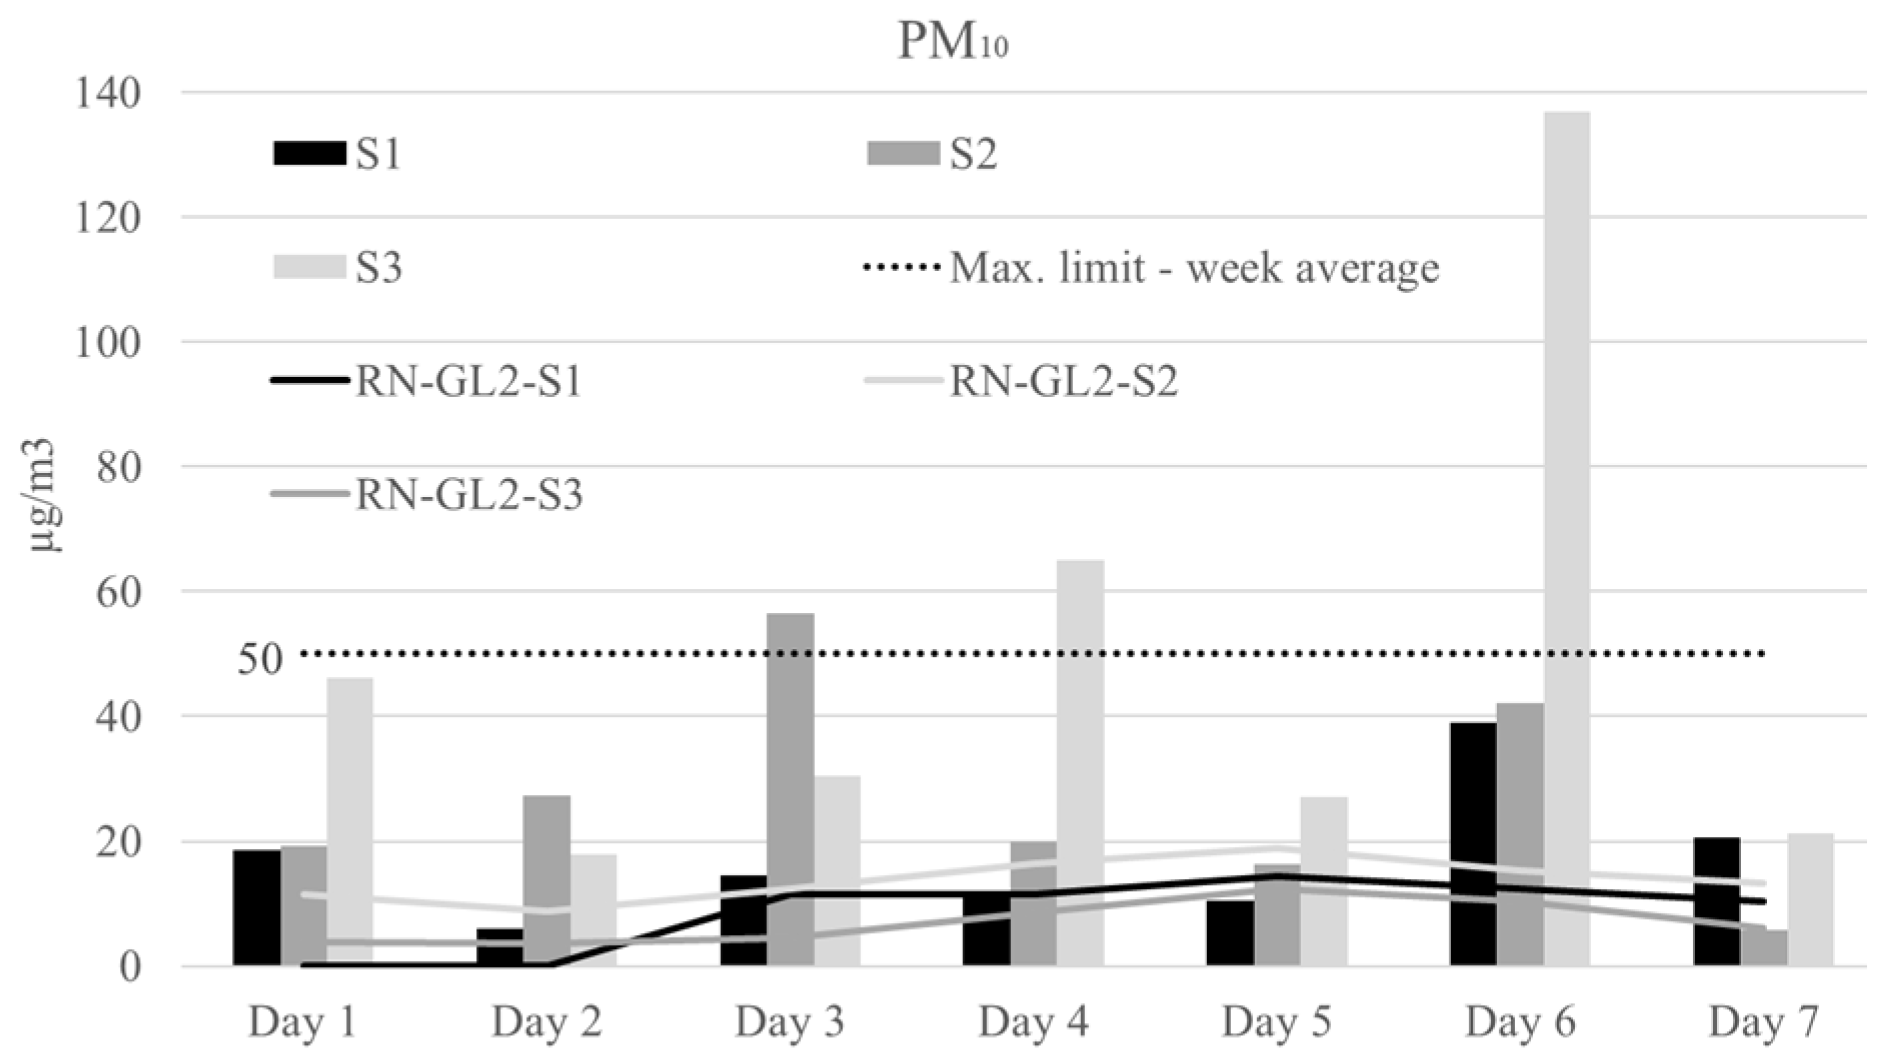
3. Results and Discussion

The measuring of the data obtained using the apparatus and procedure described in the previous section was organized so that a specific time was the same for each measuring spot. Thus, the starting time was 2 p.m., and a graphic was drawn for each particulate matter dimension, resulting in six graphical representations with three curve series (for each measuring spot: S1, S2 and S3) each, presented in Figure 2.
As expected, the amount of smaller particulate matter was the highest registered during measurements. Although no reference was found in the literature, another confirmation was obtained related to the expectation that in the furthest measuring spot relative to the windows, the number of airborne particulates was mostly lower than the other measuring spots. These higher PM values near the windows are not necessarily expected to be present in other indoor sites such as schools with numerous individuals, as referred to in other studies [11,12]. Additionally, some unusually high values were registered, most of them for the S3 measuring spot, the majority being confirmed for all particulate matter dimensions. Another characteristic of smaller particulates (being airborne for longer) is easily distinguishable from graphics depicting 0.3 and 0.5 µm PM count evolution, high values being registered throughout the measuring period for all three measuring spots. Different, clearer patterns begin to unveil for the data related to 1 µm PM count evolution, higher numbers of particulates being registered starting from 8 a.m. until, usually, 12 a.m., when these values fall towards zero. The same pattern is seen even clearer for heavier particulates, the data for 10 µm dimensions being the most representative in this respect, these reaching nil values for all measuring spots during the still time, a trend also similar and confirmed in other studies [11,17,29].
Regarding the meteorological data, these are presented in Figure 3, which contains three graphics corresponding to the measuring spot that was utilized continuously, each one for a week. The measuring campaign started from the measuring spot farthest away from the windows; thus, the first graphic (from 30 January 2021 to 6 February 2021) corresponds to S1, the second graphic (from 8 February 2021 to 15 February 2021) to S2 and the last graphic (from 9 March 2021 to 16 March 2021) to S3. During the entire measuring period, the temperature varied from −7 °C to 17 °C, a normal variation for this time of the year. Higher temperatures were registered during the day period, as expected, and one of the direct consequences was the increase in registered wind speeds due to promoting the convection of air [30]. These two meteorological factors each present a similar curve to those of the PM number variation in Figure 2, highlighting the direct contribution of high temperature and wind speeds to a higher amount of particulate matter in the air of the present study’s measuring spots (a pattern similar to some studies [31,32] and contrary to others [33,34]), confirming, as mentioned in [8], the spatial heterogeneity of concentration and meteorological factors. Opposite to this correlation, a higher value for precipitation was expected, as reported in [31], to decrease the number of airborne particulates. However, the lack of long timespans with precipitation deprived the present study of such confirmation. Two small precipitation periods were registered during measurements, and as mentioned, a clear result in PM number variation was not noticed, mostly since the measurements took place indoors, and a longer precipitation period would be needed to visibly affect the registered amount of airborne particulate matter.
Overall, the correlation of meteorological conditions with PM concentration is an important aspect to be considered concerning air quality prediction, although, as mentioned in [8], other factors should be taken into account, such as the sources and components of PM, the local climate and the terrain [8,35,36], which cause the influencing degree of different processes to vary by region. All these factors should be thoroughly monitored for each city or region that might implement any type of decision making based on scientific results.
In order to place the data of the present work in context with the national legislation limits, one batch of data was transformed using a relatively trustworthy method [28] into data expressed in mass per volume. This data translation was realized in order to ease a comparison with results from the National Air Quality Monitoring Network (data selected from the closest measuring station, named GL-2), and the data batch was for PM10 (particulate matter with diameter lower than 10 µm), since this is one of the air quality indices regulated by the national air quality law [37] and was also that presenting a clearer variation in number during the measuring period for the present study.
Figure 4 presents the data for PM10 expressed in µg/m3 against the maximum limit that, according to the national law, should not be exceeded 35 times throughout an entire year [37]. Considering that the transformation procedure from the PM10 number into the PM10 expressed in mass per volume is close to reality, the obtained data present a large number of maximum limit (50 µg/m3) overruns, at least 17 times, during the week taken into account. Although the transformation of data is not exact, since it is impossible to precisely appreciate the density of counted airborne particulates, the results presented in Figure 4 are believed to be not far from reality, especially since, in a previous work, higher than normal values of airborne particulates were registered in the same location [25], as was the case in another paper dealing with PM10 measurements in the same city of Galați [38]. Aside from the city on which the present work focuses, other studies also reported higher than the maximum admissible values in indoor places, such as 280.6 µg/m3 in Warsaw, Poland [11]; 578 µg/m3 in Beijing, China [39] and 322 µg/m3 in Castellón, Spain [12].
Using the same results of PM10 transformed into µg/m3, and in order to level out any extreme values, daily averages were calculated for each measuring spot and presented against the maximum regulated limit. All these and the averages of results gathered by the GL-2 measurement station of the National Air Quality Monitoring Network are presented in Figure 5. The results from the GL-2 station are represented as curves, each of them being calculated using the available data and corelated to the same time period as the measuring period of this study; thus, the abbreviation in the figure represents the Romanian National Air Quality Monitoring Network (RN) during the weeks when measurements took place in the three mentioned spots (S1, S2 and S3) for the present study.
The trends in Figure 5 are somewhat similar when comparing the results from the two different sources of data, yet higher values are still registered for data from the present study compared to data from the national measuring network. Similar situations are reported in [11,12], where some indoor measurements present higher PM values compared to outdoor PM concentrations, although these studies are focused on schools as indoor measuring sites, where the number of individuals might represent the main reason for these results. Additionally, in [40], some cases are presented where higher indoor values were registered in households with smoking individuals. On the contrary, in [10,41], the values for outdoor PM concentration measurements were always higher than the indoor ones; for that study, only households were used as indoor measuring sites. For the present work, this difference might mainly be the result of the positioning of the measuring sites. As already suggested in a previous work [25], some air quality monitoring locations are not representative for all situations that might occur in a vast and industrialized city such as Galați. Thus, a more realistic view on the variation in time of particulate matter could be obtained in the future by diversifying and increasing the number of measuring stations used by the National Air Quality Monitoring Network. A possibility in this respect might be represented by small, cheap and resilient measuring units that already exist on the open market throughout the world [23,42,43] and their potential integration into the existing hardware and software infrastructure.

4. Conclusions

The present study demonstrates the direct dependance of particulate matter amount on meteorological conditions, a clear correlation being emphasized for temperature and wind speed, of which high values also correspond to high number of airborne particulates for the indoor location used in this work. These data were also presented against the maximum allowable by legislation and the ones registered by the National Measurement Network. Aside from similar trends between the two PM related datasets, high values and numerous overruns of the maximum admissible were also registered for the indoor measurements from this study, while the values from the National Measurement Network were always well below this maximum. The validation of the methodology used in the present work is realized by a comparison with other studies in the literature, confirming the correlation between indoor PM concentration and meteorological conditions.
All this being said, it is clear that a more thorough monitoring of these pollutants in large cities might be useful for decision makers and for the general population, which might be affected. In this respect, broader research could be undertaken, focusing on an entire year in the same indoor location and also using a more precise and complete instrumentation. This method of data acquisition might offer some clarifications regarding the degree of inertia of meteorological conditions towards indoor PM quantity variation. Additionally, the intermittent utilization of an air purifier in the same indoor location could offer some valuable data about the utility of such an apparatus in terms of obtaining a cleaner breathable air.

Funding

This research received no external funding.

Institutional Review Board Statement

Not applicable.

Informed Consent Statement

Not applicable.

Data Availability Statement

Publicly available data, related to the National Air Quality Monitoring Network, used in this study for comparison reasons was obtained from the following web-site: https://www.calitateaer.ro/public/monitoring-page/reports-reports-page/?__locale=ro.

Conflicts of Interest

The author declares no conflict of interest.

References

  1. Directive 2008/50/EC of the European Parliament and of the Council of 21 May 2008 on Ambient Air Quality and Cleaner Air for Europe. 2008. Available online: https://eur-lex.europa.eu/legal-content/en/ALL/?uri=CELEX%3A32008L0050 (accessed on 5 July 2021).
  2. Normativ 02/07/2007, Portal Legislativ, Monitorul Oficial. 2007. Available online: http://legislatie.just.ro/Public/DetaliiDocumentAfis/83993 (accessed on 5 July 2021).
  3. Lelieveld, J.; Evans, J.S.; Fnais, M.; Giannadaki, D.; Pozzer, A. The contribution of outdoor air pollution sources to premature mortality on a global scale. Nat. Cell Biol. 2015, 525, 367–371. [Google Scholar] [CrossRef]
  4. Dockery, D.W.; Pope, C.A. Acute Respiratory Effects of Particulate Air Pollution. Annu. Rev. Public Health 1994, 15, 107–132. [Google Scholar] [CrossRef]
  5. Arangio, A.; Tong, H.; Socorro, J.; Pöschl, U.; Shiraiwa, M. Quantification of environmentally persistent free radicals and reactive oxygen species in atmospheric aerosol particles. Atmos. Chem. Phys. Discuss. 2016, 16, 13105–13119. [Google Scholar] [CrossRef] [Green Version]
  6. Shiraiwa, M.; Selzle, K.; Pöschl, U. Hazardous components and health effects of atmospheric aerosol particles: Reactive oxygen species, soot, polycyclic aromatic compounds and allergenic proteins. Free Radic. Res. 2012, 46, 927–939. [Google Scholar] [CrossRef]
  7. Alpert, P.A.; Dou, J.; Arroyo, P.C.; Schneider, F.; Xto, J.; Luo, B.; Peter, T.; Huthwelker, T.; Borca, C.N.; Henzler, K.D.; et al. Photolytic radical persistence due to anoxia in viscous aerosol particles. Nat. Commun. 2021, 12, 1769. [Google Scholar] [CrossRef]
  8. Yang, Q.; Yuan, Q.; Li, T.; Shen, H.; Zhang, L. The Relationships between PM2.5 and Meteorological Factors in China: Seasonal and Regional Variations. Int. J. Environ. Res. Public Health 2017, 14, 1510. [Google Scholar] [CrossRef] [Green Version]
  9. Paraschiv, S. Effects of wind speed, relative humidity, temperature and air pressure on PM10 concentration for an urban background area. IOP Conf. Ser. Mater. Sci. Eng. 2019, 595, 012059. [Google Scholar] [CrossRef]
  10. Jodeh, S.; Hasan, A.R.; Amarah, J.; Judeh, F.; Salghi, R.; Lgaz, H.; Jodeh, W. Indoor and outdoor air quality analysis for the city of Nablus in Palestine: Seasonal trends of PM10, PM5.0, PM2.5, and PM1.0 of residential homes. Air Qual. Atmos. Health 2017, 11, 229–237. [Google Scholar] [CrossRef]
  11. Rogulski, M. Indoor PM10 concentration measurements using low-cost monitors in selected locations in Warsaw. Energy Procedia 2018, 147, 137–144. [Google Scholar] [CrossRef]
  12. Pallarés, S.; Gómez, E.; Martínez, A.; Jordán, M.M. The relationship between indoor and outdoor levels of PM10 and its chemical composition at schools in a coastal region in Spain. Heliyon 2019, 5, e02270. [Google Scholar] [CrossRef] [Green Version]
  13. Nishihama, Y.; Jung, C.-R.; Nakayama, S.F.; Tamura, K.; Isobe, T.; Michikawa, T.; Iwai-Shimada, M.; Kobayashi, Y.; Sekiyama, M.; Taniguchi, Y.; et al. Indoor air quality of 5,000 households and its determinants. Part A: Particulate matter (PM2.5 and PM10–2.5) concentrations in the Japan Environment and Children’s Study. Environ. Res. 2021, 198, 111196. [Google Scholar] [CrossRef] [PubMed]
  14. Yoda, Y.; Tamura, K.; Shima, M. Airborne endotoxin concentrations in indoor and outdoor particulate matter and their predictors in an urban city. Indoor Air 2017, 27, 955–964. [Google Scholar] [CrossRef] [Green Version]
  15. Argunhan, Z.; Avci, A.S. Statistical Evaluation of Indoor Air Quality Parameters in Classrooms of a University. Adv. Meteorol. 2018, 2018, 4391579. [Google Scholar] [CrossRef]
  16. Liu, Y.; Zhou, B.; Wang, J.; Zhao, B. Health benefits and cost of using air purifiers to reduce exposure to ambient fine particulate pollution in China. J. Hazard. Mater. 2021, 414, 125540. [Google Scholar] [CrossRef]
  17. Fermo, P.; Artíñano, B.; De Gennaro, G.; Pantaleo, A.M.; Parente, A.; Battaglia, F.; Colicino, E.; Di Tanna, G.; Junior, A.G.D.S.; Pereira, I.G.; et al. Improving indoor air quality through an air purifier able to reduce aerosol particulate matter (PM) and volatile organic compounds (VOCs): Experimental results. Environ. Res. 2021, 197, 111131. [Google Scholar] [CrossRef]
  18. Kim, M.Y.; Jung, Y.G.; Park, J.C.; Yang, Y.K. The impact of airflow and air purification on the resuspension and removal of deposited particulate matter. J. Build. Eng. 2021, 41, 102367. [Google Scholar] [CrossRef]
  19. Penza, M.; Suriano, D.; Villani, M.G.; Spinelle, L.; Gerboles, M. Towards air quality indices in smart cities by calibrated low-cost sensors applied to networks. IEEE 2014, 2012–2017. [Google Scholar] [CrossRef]
  20. Castell, N.; Kobernus, M.; Liu, H.-Y.; Schneider, P.; Lahoz, W.; Berre, A.J.; Noll, J. Mobile technologies and services for environmental monitoring: The Citi-Sense-MOB approach. Urban. Clim. 2015, 14, 370–382. [Google Scholar] [CrossRef]
  21. Gulia, S.; Prasad, P.; Goyal, S.; Kumar, R. Sensor-based Wireless Air Quality Monitoring Network (SWAQMN)—A smart tool for urban air quality management. Atmos. Pollut. Res. 2020, 11, 1588–1597. [Google Scholar] [CrossRef]
  22. Lu, Y.; Giuliano, G.; Habre, R. Estimating hourly PM2.5 concentrations at the neighborhood scale using a low-cost air sensor network: A Los Angeles case study. Environ. Res. 2021, 195, 110653. [Google Scholar] [CrossRef]
  23. Global PM10 Map. Available online: https://www.uradmonitor.com/ (accessed on 30 May 2021).
  24. World’s Air Pollution: Real-Time Air Quality Index. Available online: https://waqi.info/ (accessed on 5 July 2021).
  25. Bodor, M.; de Jos, D. Indoor Concentration and Composition of Fine Particulate Matter (PM2.5) Near an Intense Circulated Road in an Industrial City. Ann. Dunarea Jos Univ. Galati. Fascicle IX Met. Mater. Sci. 2020, 43, 5–10. [Google Scholar] [CrossRef]
  26. Fluke 985 Particle Counter. Available online: https://test4less.co.uk/fluke-985-particle-counter.html (accessed on 2 April 2021).
  27. Available online: https://www.calitateaer.ro/public/monitoring-page/reports-reports-page/?__locale=en (accessed on 7 April 2021).
  28. Dust Collection Research–Dylos. Available online: https://billpentz.com/woodworking/cyclone/dylos.php (accessed on 14 May 2021).
  29. Lu, X.; Sha, Y.H.; Li, Z.; Huang, Y.; Chen, W.; Chen, D.; Shen, J.; Chen, Y.; Fung, J.C. Development and application of a hybrid long-short term memory–three dimensional variational technique for the improvement of PM2.5 forecasting. Sci. Total Environ. 2021, 770, 144221. [Google Scholar] [CrossRef] [PubMed]
  30. Luo, J.; Du, P.; Samat, A.; Xia, J.; Che, M.; Xue, Z. Spatiotemporal Pattern of PM2.5 Concentrations in Mainland China and Analysis of Its Influencing Factors using Geographically Weighted Regression. Sci. Rep. 2017, 7, 40607. [Google Scholar] [CrossRef] [PubMed]
  31. Chen, T.; He, J.; Lu, X.; She, J.; Guan, Z. Spatial and Temporal Variations of PM2.5 and Its Relation to Meteorological Factors in the Urban Area of Nanjing, China. Int. J. Environ. Res. Public Health 2016, 13, 921. [Google Scholar] [CrossRef] [PubMed]
  32. Li, J.J.; Wang, G.H.; Wang, X.; Cao, J.J.; Sun, T.; Cheng, C.L.; Meng, J.J.; Hu, T.F.; Liu, S.X. Abundance, composition and source of atmospheric PM2.5 at a remote site in the Tibetan Plateau, China. Tellus B Chem. Phys. Meteorol. 2013, 65. [Google Scholar] [CrossRef]
  33. Chen, Z.; Cai, J.; Gao, B.; Xu, B.; Dai, S.; He, B.; Xie, X. Detecting the causality influence of individual meteorological factors on local PM2.5 concentration in the Jing-Jin-Ji region. Sci. Rep. 2017, 7, 40735. [Google Scholar] [CrossRef] [Green Version]
  34. Zhang, H.; Wang, Y.; Hu, J.; Ying, Q.; Hu, X.-M. Relationships between meteorological parameters and criteria air pollutants in three megacities in China. Environ. Res. 2015, 140, 242–254. [Google Scholar] [CrossRef]
  35. Wang, Y.; Ying, Q.; Hu, J.; Zhang, H. Spatial and temporal variations of six criteria air pollutants in 31 provincial capital cities in China during 2013–2014. Environ. Int. 2014, 73, 413–422. [Google Scholar] [CrossRef]
  36. Daly, C.; Gibson, W.; Taylor, G.; Johnson, G.; Pasteris, P. A knowledge-based approach to the statistical mapping of climate. Clim. Res. 2002, 22, 99–113. [Google Scholar] [CrossRef] [Green Version]
  37. LEGE 104 15/06/2011-Portal Legislativ. Available online: http://legislatie.just.ro/Public/DetaliiDocument/129642 (accessed on 28 May 2021).
  38. Bodor, M.; Baltă, Ș; Pintilie, Ș.C.; Lazăr, A.L.; Buruiană, D. Studies regarding the distribution and composition of particulate matters in the air of an industrialized city. SGEM 2016, 2, 587–591. [Google Scholar] [CrossRef]
  39. Pan, S.; Du, S.; Wang, X.; Zhang, X.; Xia, L.; Liu, J.; Pei, F.; Wei, Y. Analysis and interpretation of the particulate matter (PM10 and PM2.5) concentrations at the subway stations in Beijing, China. Sustain. Cities Soc. 2019, 45, 366–377. [Google Scholar] [CrossRef]
  40. Stranger, M.; Potgieter-Vermaak, S.; Van Grieken, R. Comparative overview of indoor air quality in Antwerp, Belgium. Environ. Int. 2007, 33, 789–797. [Google Scholar] [CrossRef] [PubMed]
  41. Jeong, C.-H.; Salehi, S.; Wu, J.; North, M.L.; Kim, J.S.; Chow, C.-W.; Evans, G.J. Indoor measurements of air pollutants in residential houses in urban and suburban areas: Indoor versus ambient concentrations. Sci. Total Environ. 2019, 693, 133446. [Google Scholar] [CrossRef] [PubMed]
  42. Portable Particulate Monitor-Measure PM2.5/PM10. Available online: https://www.aeroqual.com/product/portable-particulate-monitor (accessed on 30 May 2021).
  43. Air Quality Meter|PCE Instruments. Available online: https://www.pce-instruments.com/english/measuring-instruments/test-meters/air-quality-meter-kat_150925.htm (accessed on 30 May 2021).
Figure 1. Fluke 985—the apparatus used to count the particle matter of different sizes [26].
Sustainability 13 08263 g001
Figure 2. Results regarding the number of particulate matter measured in three different spots (S1—in the furthest point relative to the living room tilt-opened window; S2—near the living room tilt-opened window and S3—near the balcony’s tilt-opened window) and for six different dimensions (0.3; 0.5; 1; 2; 5 and 10 μm).
Sustainability 13 08263 g002
Figure 3. Meteorological data from the Romanian National Air Quality Monitoring Network during the particulate matter sampling period.
Sustainability 13 08263 g003
Figure 4. Hourly mean values of PM10, expressed in µg/m3, registered in the three measurement spots (S1, S2 and S3), compared with the maximum admissible value according to the national legislation.
Sustainability 13 08263 g004
Figure 5. Daily mean values of PM10, expressed in µg/m3, registered in the three measurement spots (S1, S2 and S3), compared with the maximum admissible value according to the national legislation and the weekly mean values registered by the closest measuring station of the national measuring system (RN-GL2-S1, RN-GL2-S2 and RN-GL2-S3) during the same time as this study measurement period.
Sustainability 13 08263 g005
Publisher’s Note: MDPI stays neutral with regard to jurisdictional claims in published maps and institutional affiliations.

