
Sustainability Investigation of Vehicles’ CO2 Emission in Hungary


Abstract
:1. Introduction
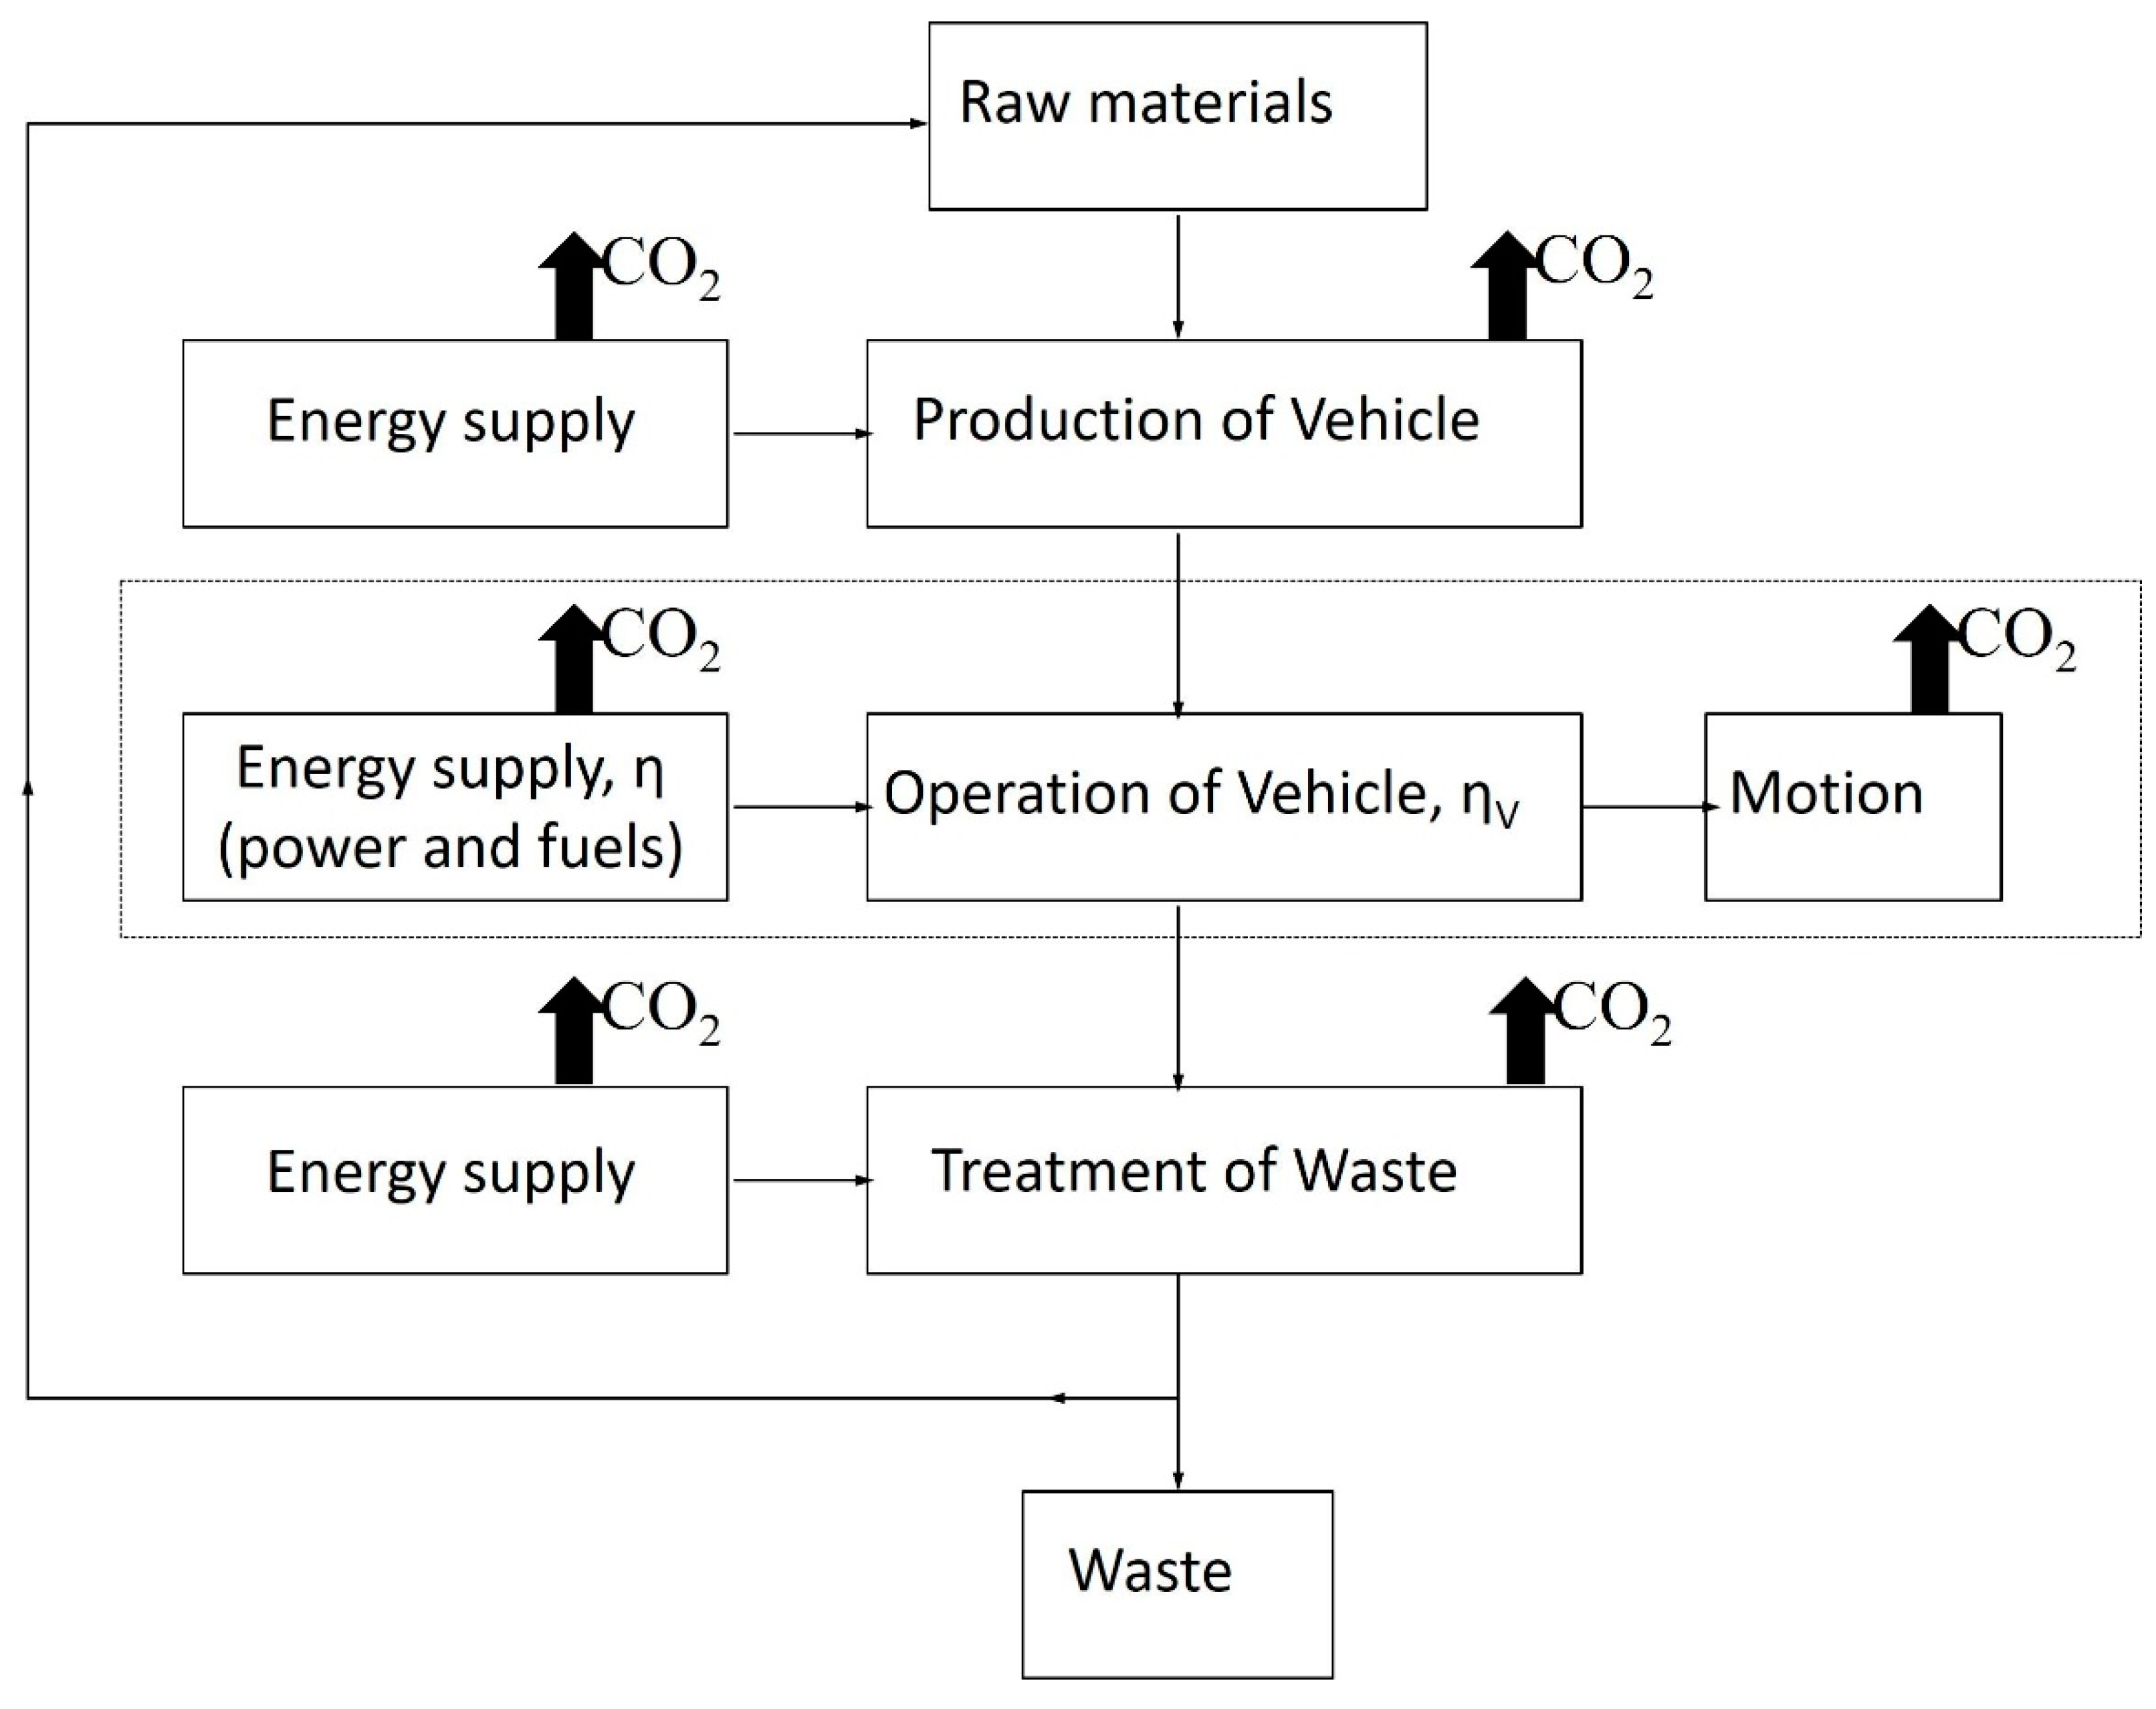
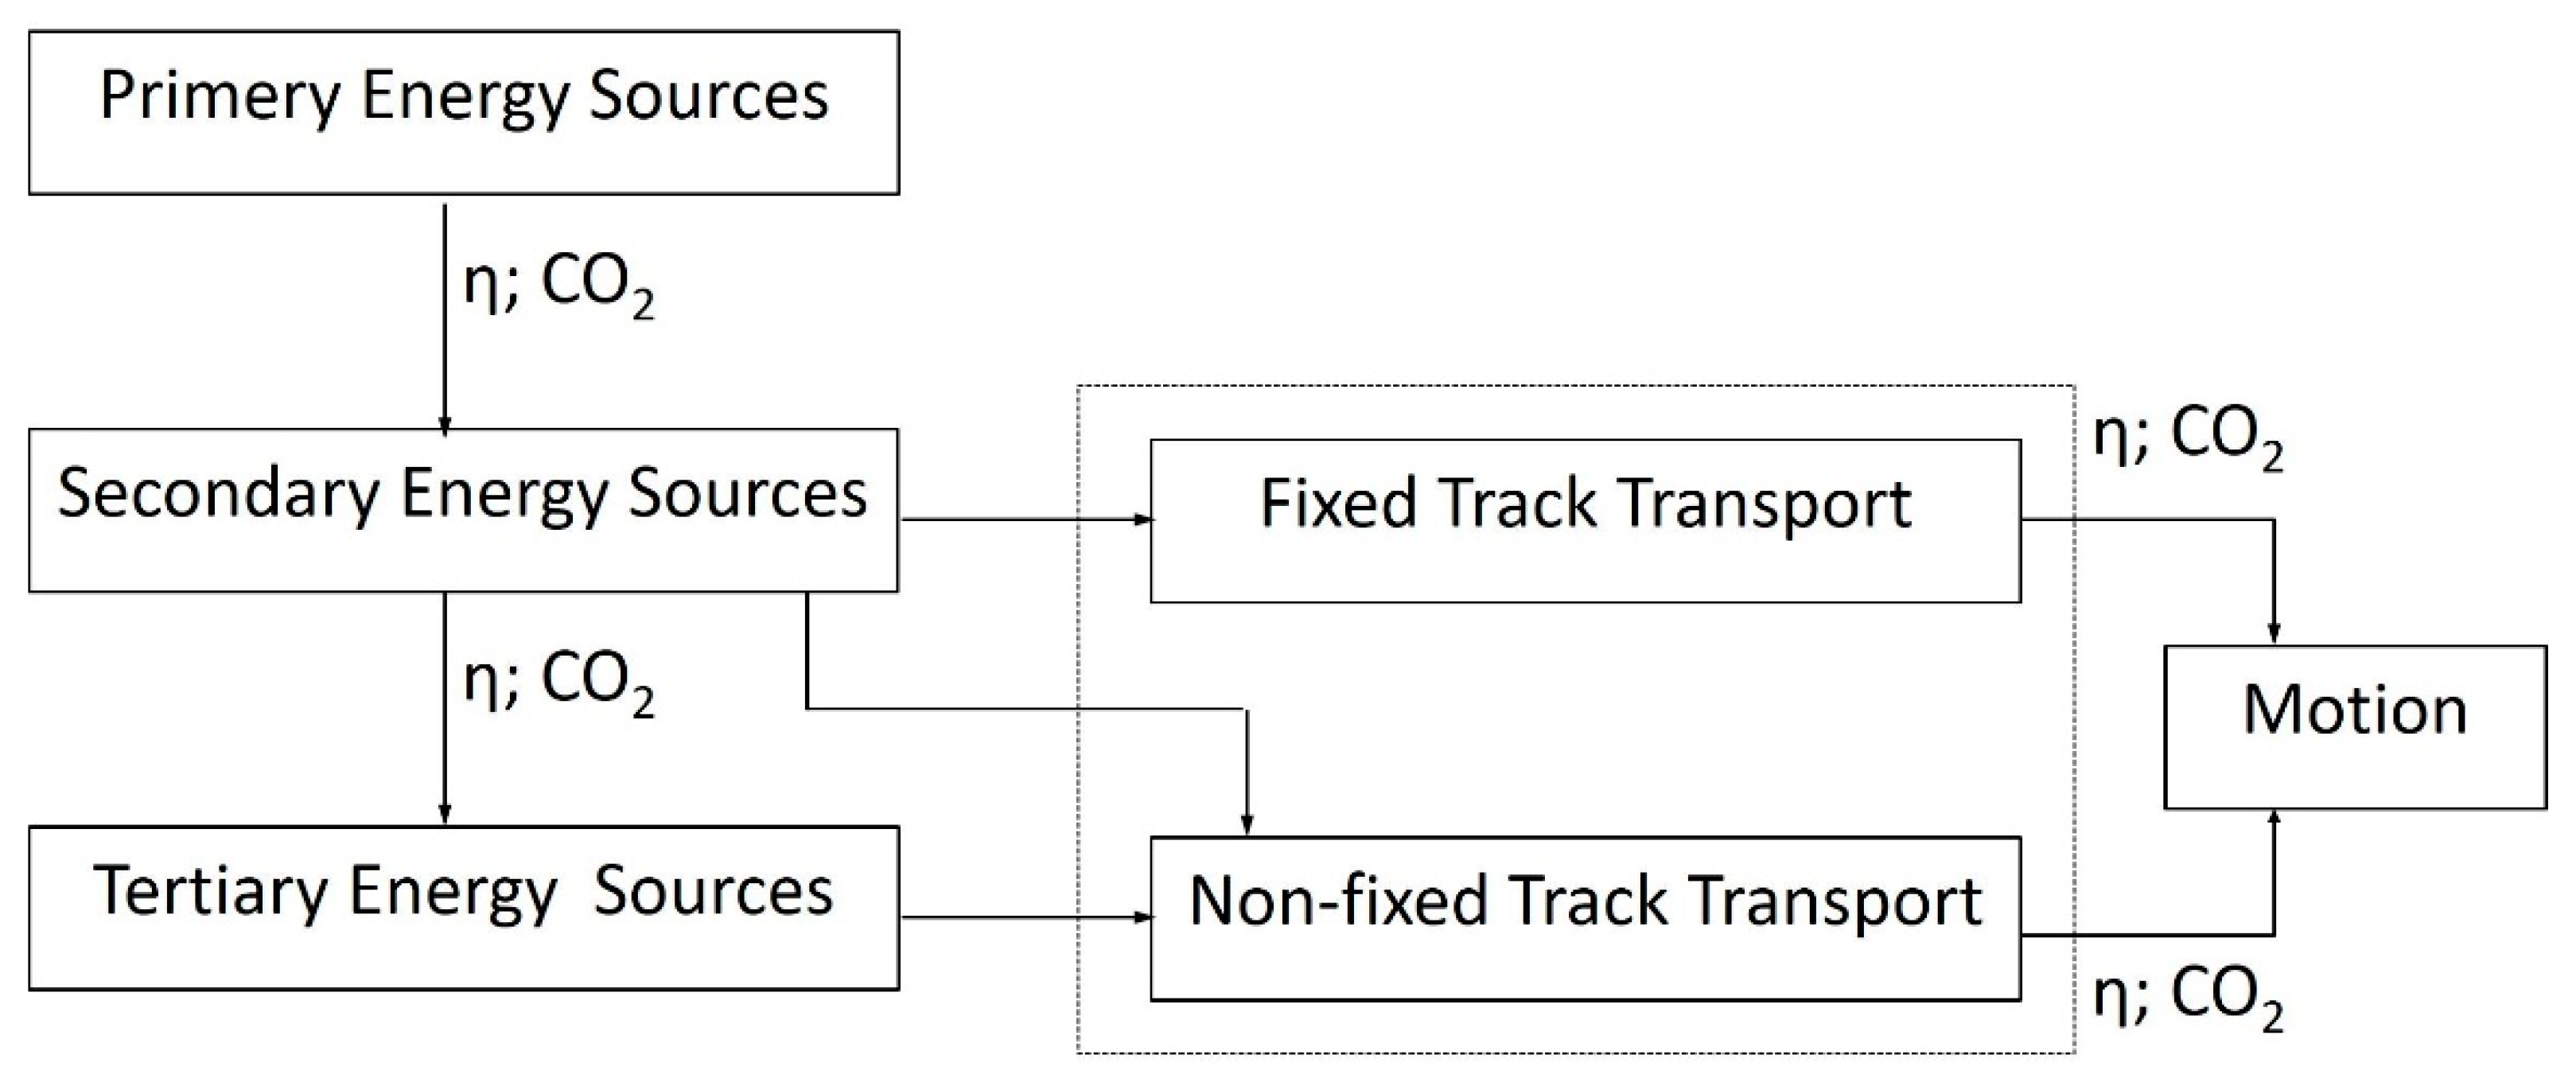
2. Methods
Energy Conversions and Their Efficiencies
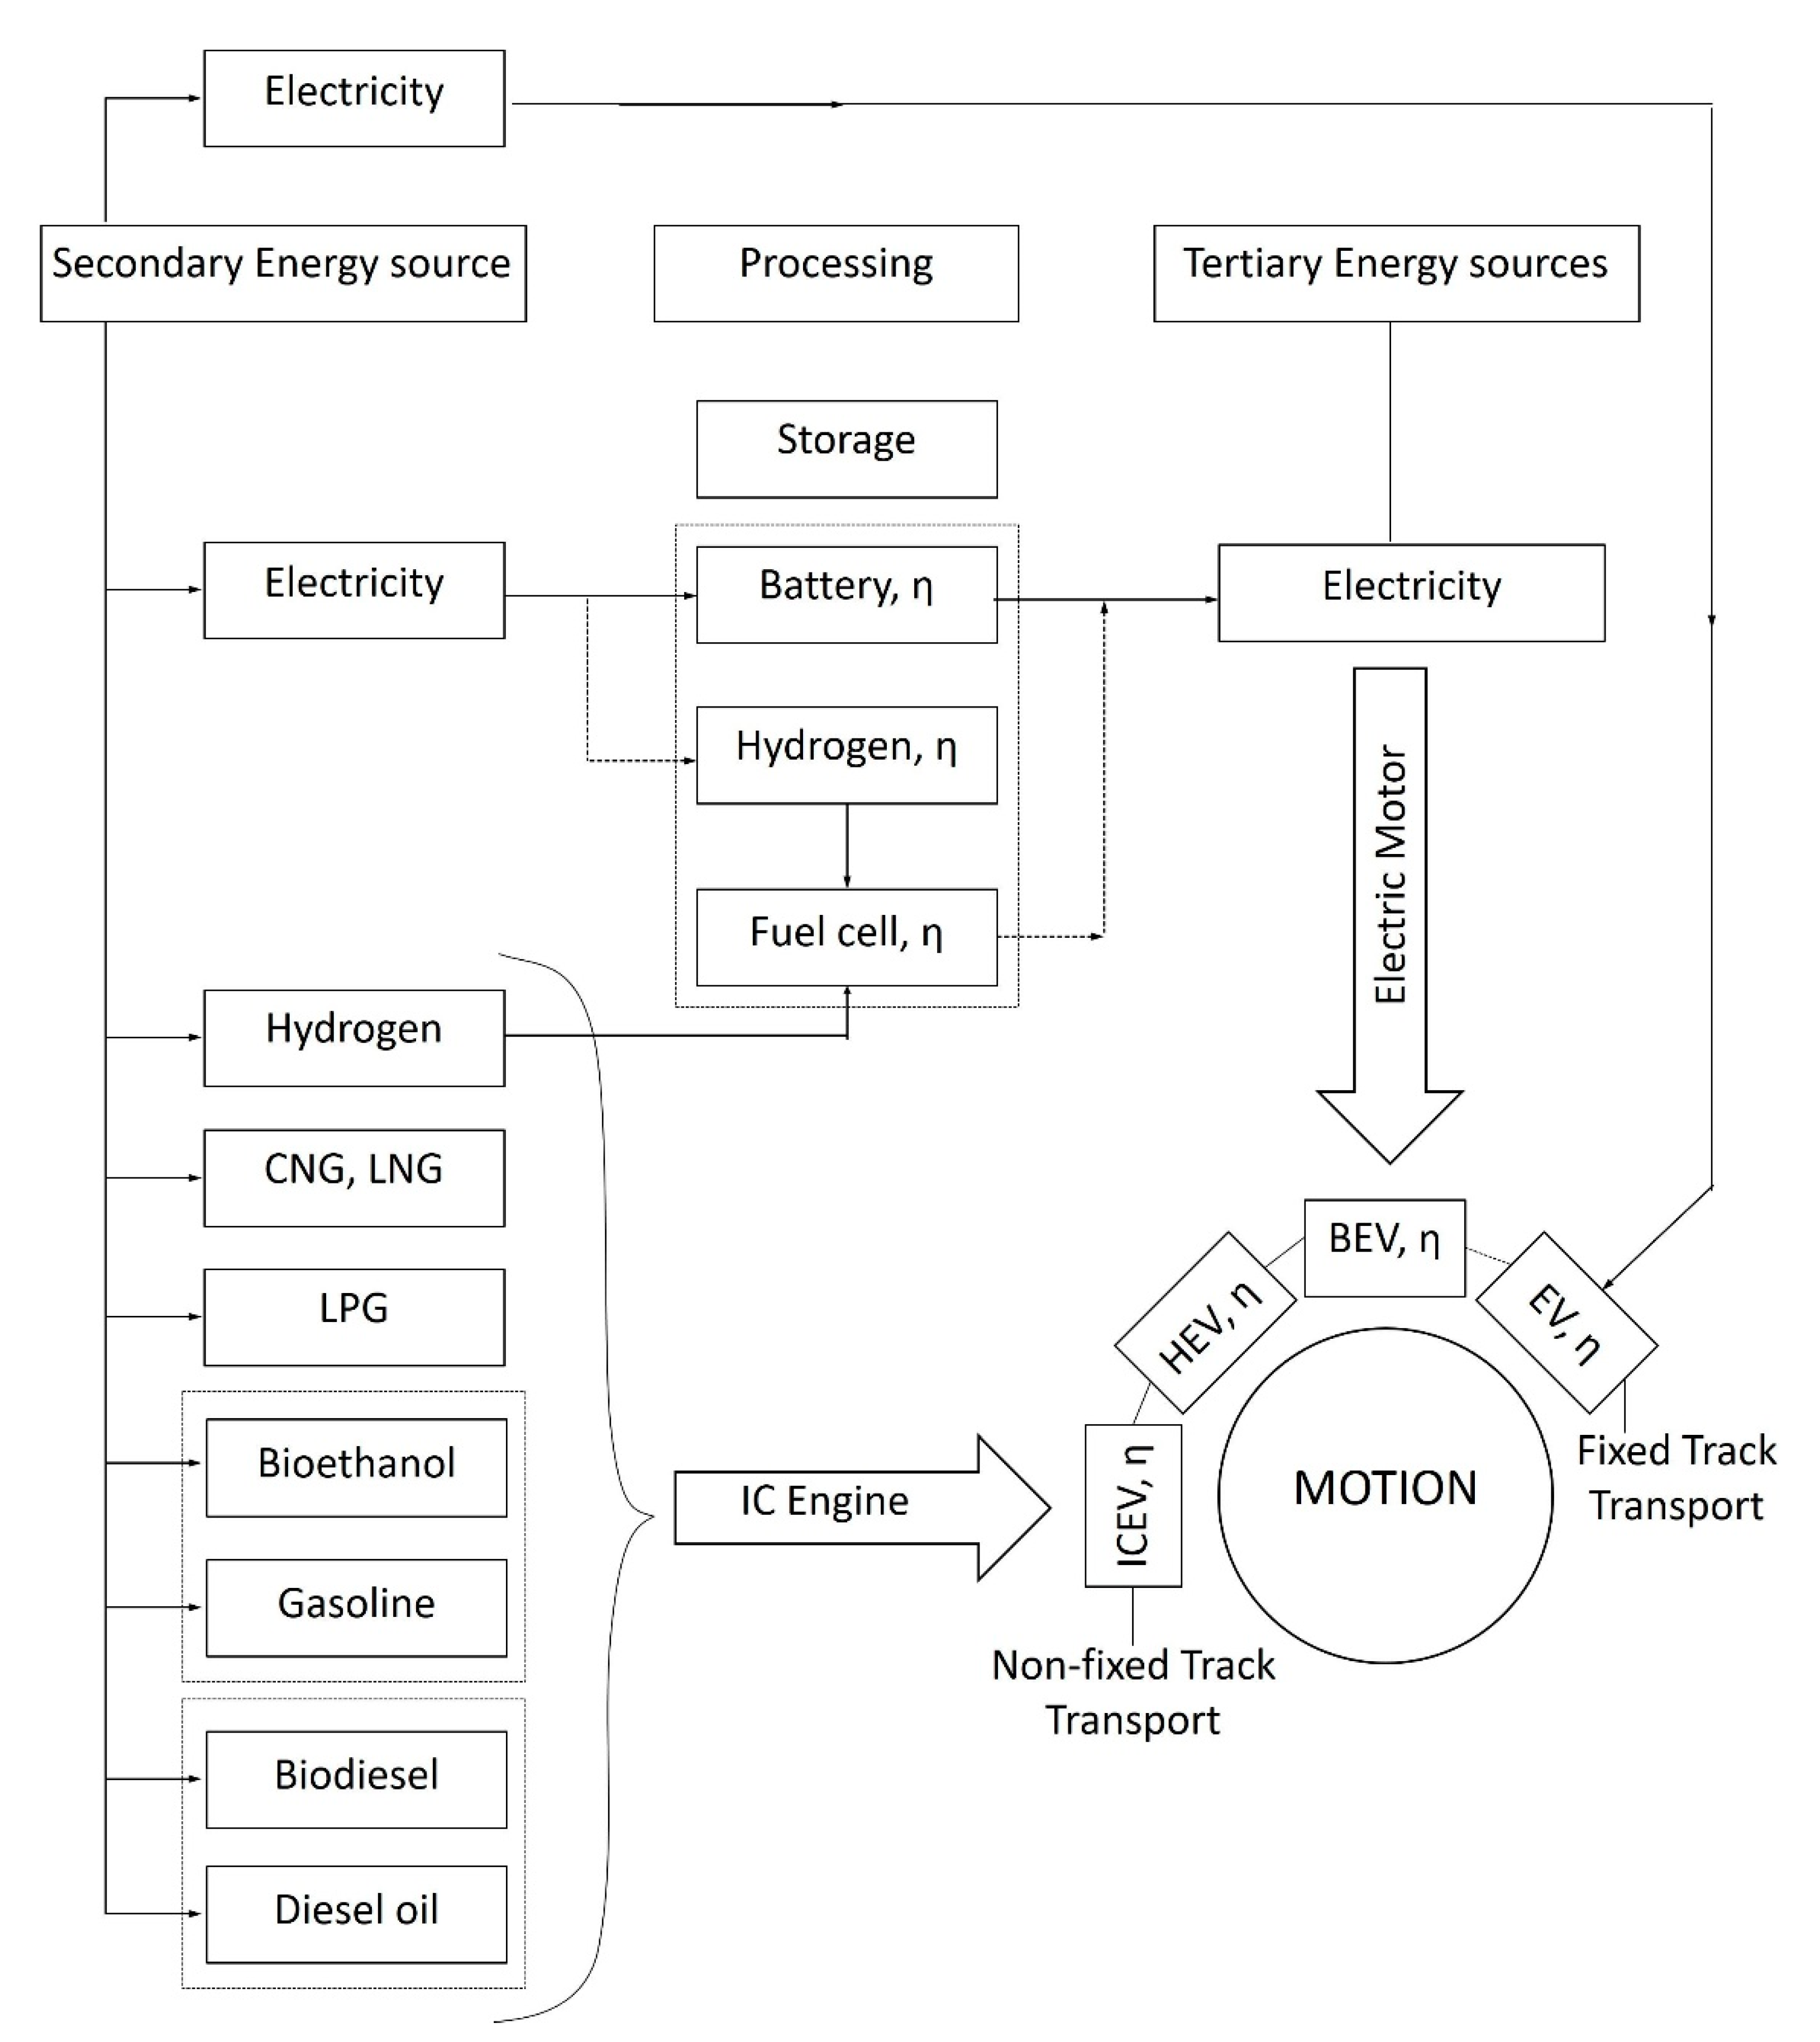
- It is evident that the direct use of electricity as a secondary energy source is only feasible with traffic on a fixed track (guided land transport). In such a case, complete CO2-free transport can also be accomplished if the electricity generated comes from a CO2-free source (renewable energy sources and nuclear power plants). Examples include rail, tram and trolleybus.
- Fuel cells and batteries are devices that convert secondary energy (electricity) to tertiary energy (electricity). During the process, energy storage also takes place. These devices allow electric vehicles to leave the fixed track. However, electrolysis is a very energy-intensive process; therefore, its widespread application is not expected in the near future. Thus, this article does not address fuel-cell electric vehicles.
- When hydrogen is produced from methane, it can no longer be considered clean energy in terms of carbon dioxide emissions.
- There are only two types of power-driven methods of vehicles. Vehicles use either internal combustion engines or electric motors. The hybrid electric vehicle (HEV) is merely an intermediate solution between the two basic types. These vehicles include both driving mechanisms. Similarly, the batteries in BEVs serve to store electric current, and afterwards, the vehicle can use this energy anywhere. Storage and energy conversion lead to energy loss as well.
- “Bioethanol” and “biodiesel” only decrease the CO2 emissions of the ICEV but, for example, the currently prescribed 10% “bioethanol” rate in gasoline has no significant effect on emissions. As a consequence, although both the low bioethanol and biodiesel contents reduce CO2 emissions, they do not entirely solve the emission problem of ICEV.
3. Results
3.1. The Efficiency of Energy Conversion
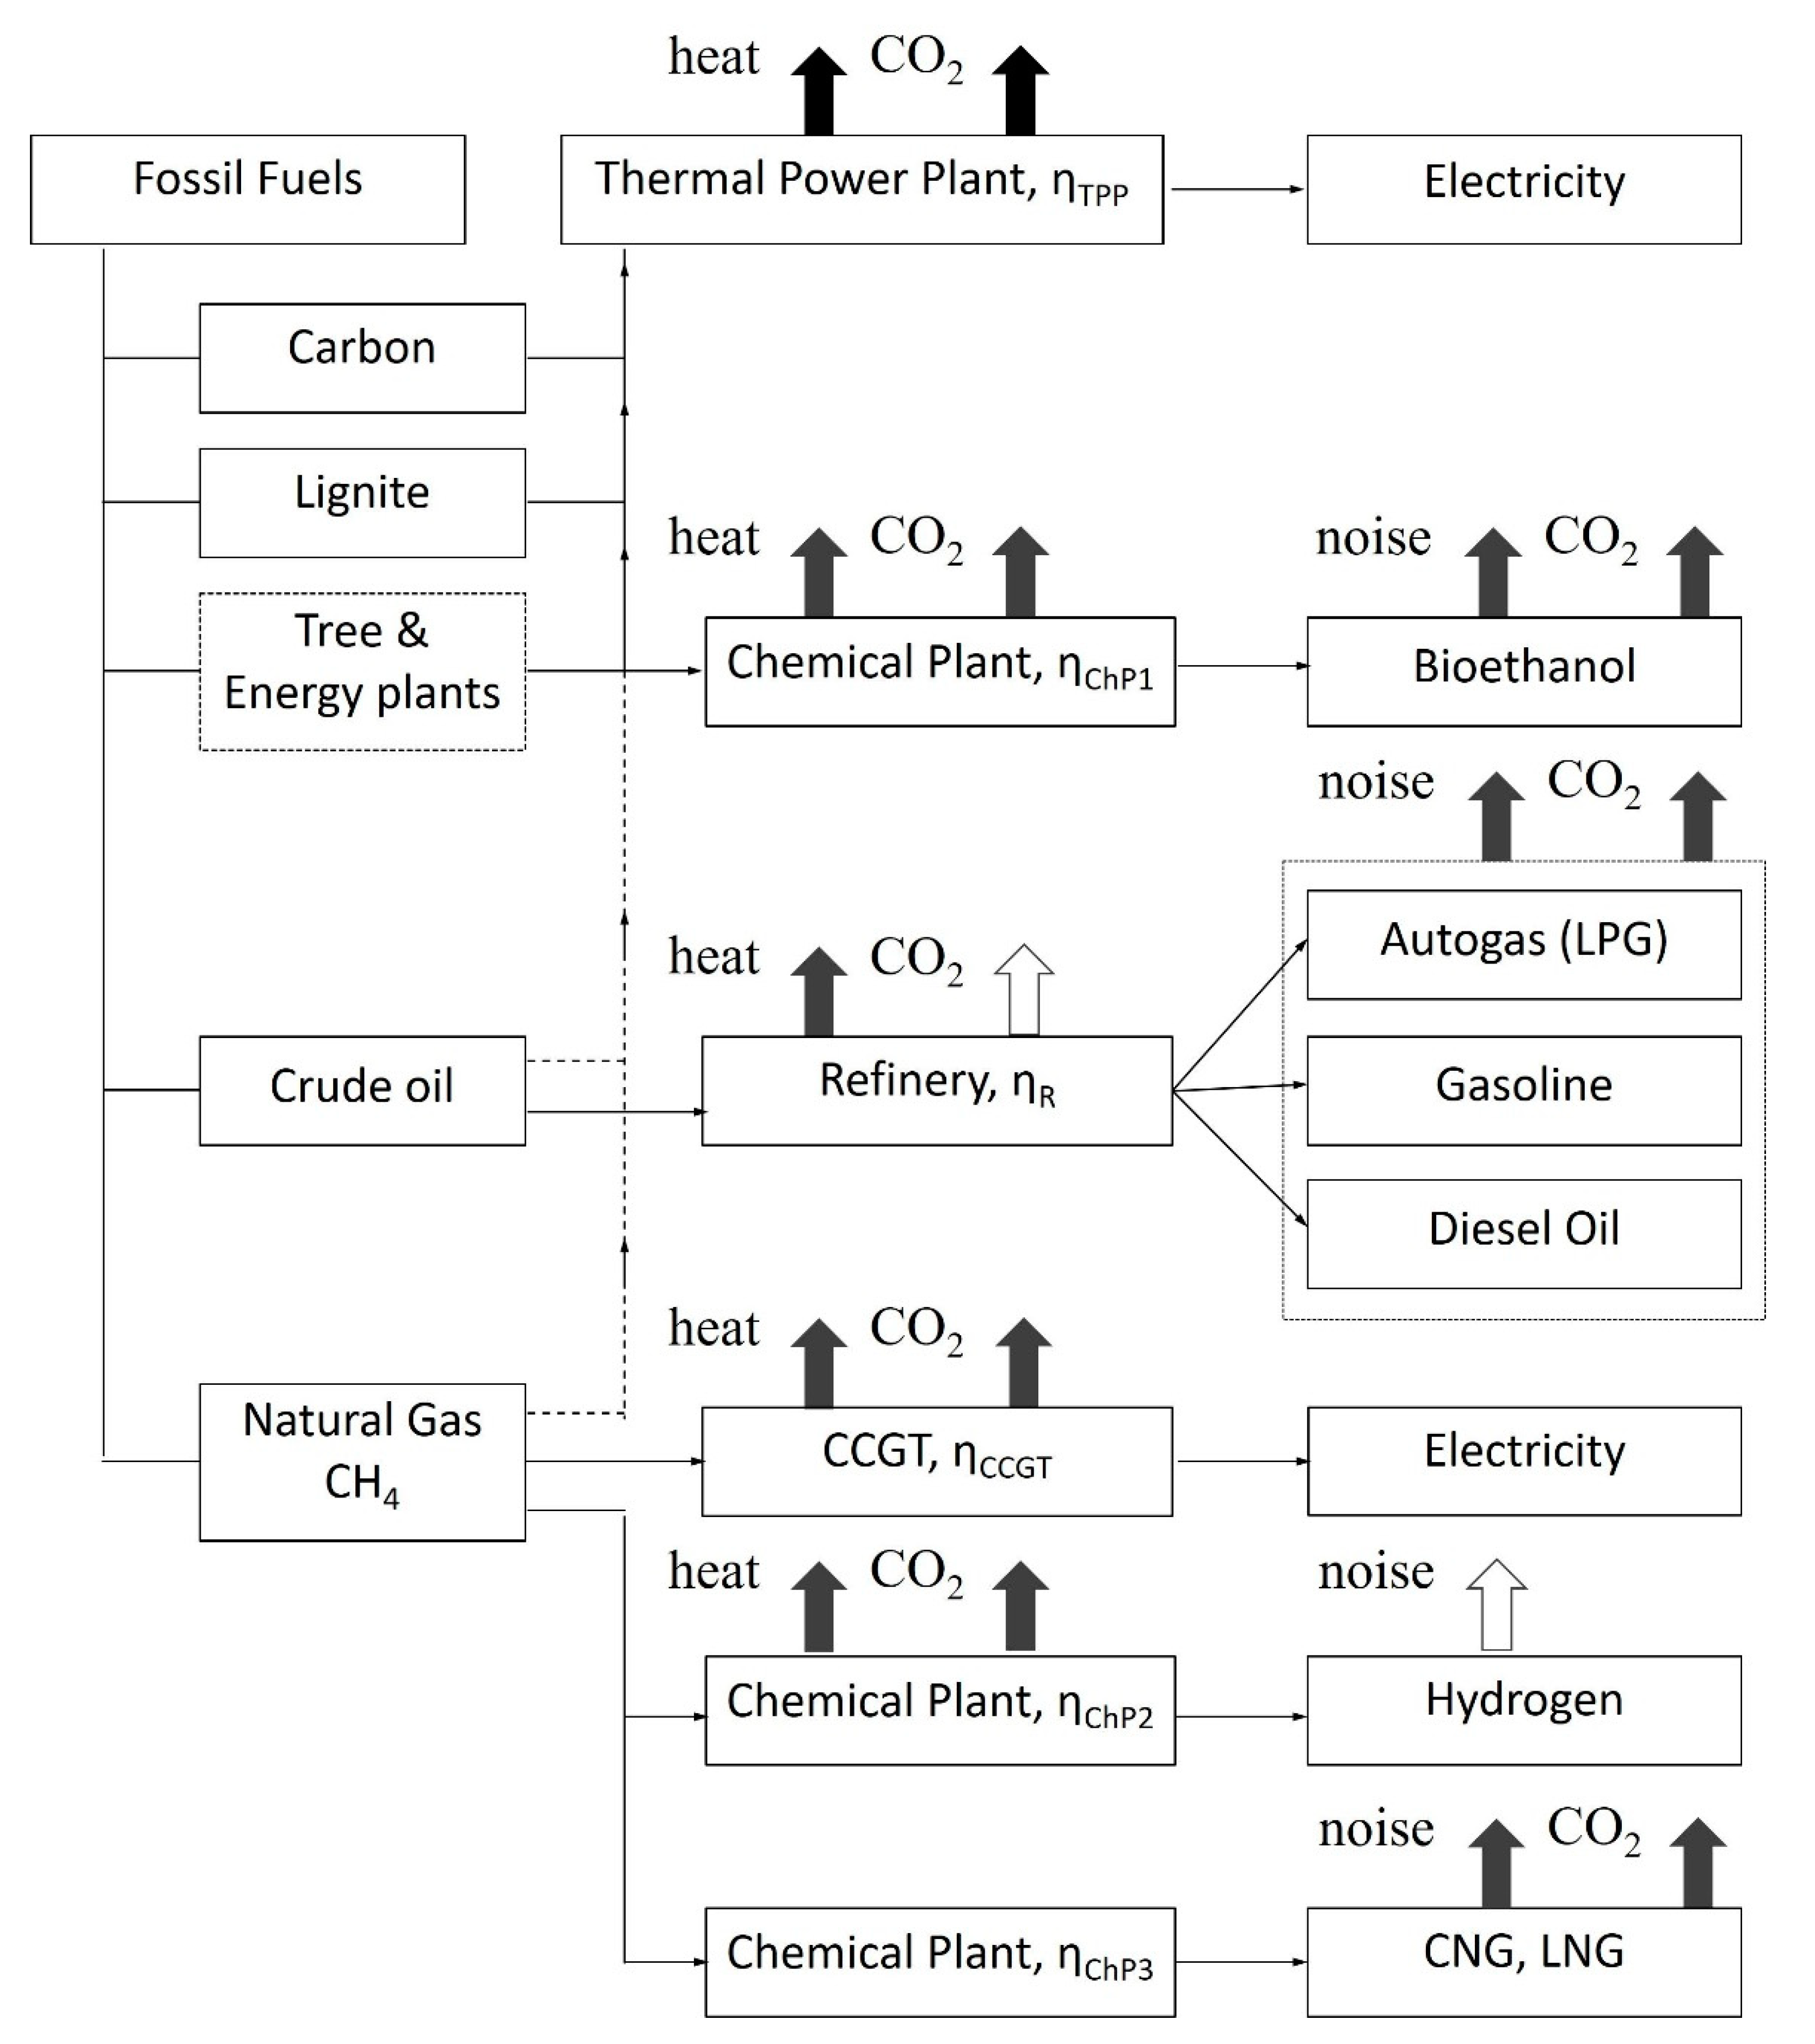
- Different primary energy sources → production of electricity (electrical energy mix) → electric vehicle (EV) on a fixed track.
- NPP (Nuclear power plant)
- TPP (Thermal Power Plant)
- CCGT (Combined Cycle Gas Turbine)
- Renewables and biofuels (R&B)
- EU import
- Electrical energy mix
- The magnitude of losses during electric power transmission is cc. 10% in Hungary; therefore,
- 2.
- Different primary energy sources → production of electricity (electrical energy mix) → Vehicle with battery and electrical motor (BEV, non-fixed track).
- 3.
- Crude oil → refinery → diesel oil → ICEV
- 4.
- Crude oil → refinery → gasoline or autogas (LPG (Liquefied Petroleum Gas), propane 40%-butane 60%) → ICEV
- 5.
- LNG and CNG are not discussed in this paper because no significant increase in LNG usage for vehicles in the world is expected, as natural gas can be more difficult to liquefy than propane and butane gases.
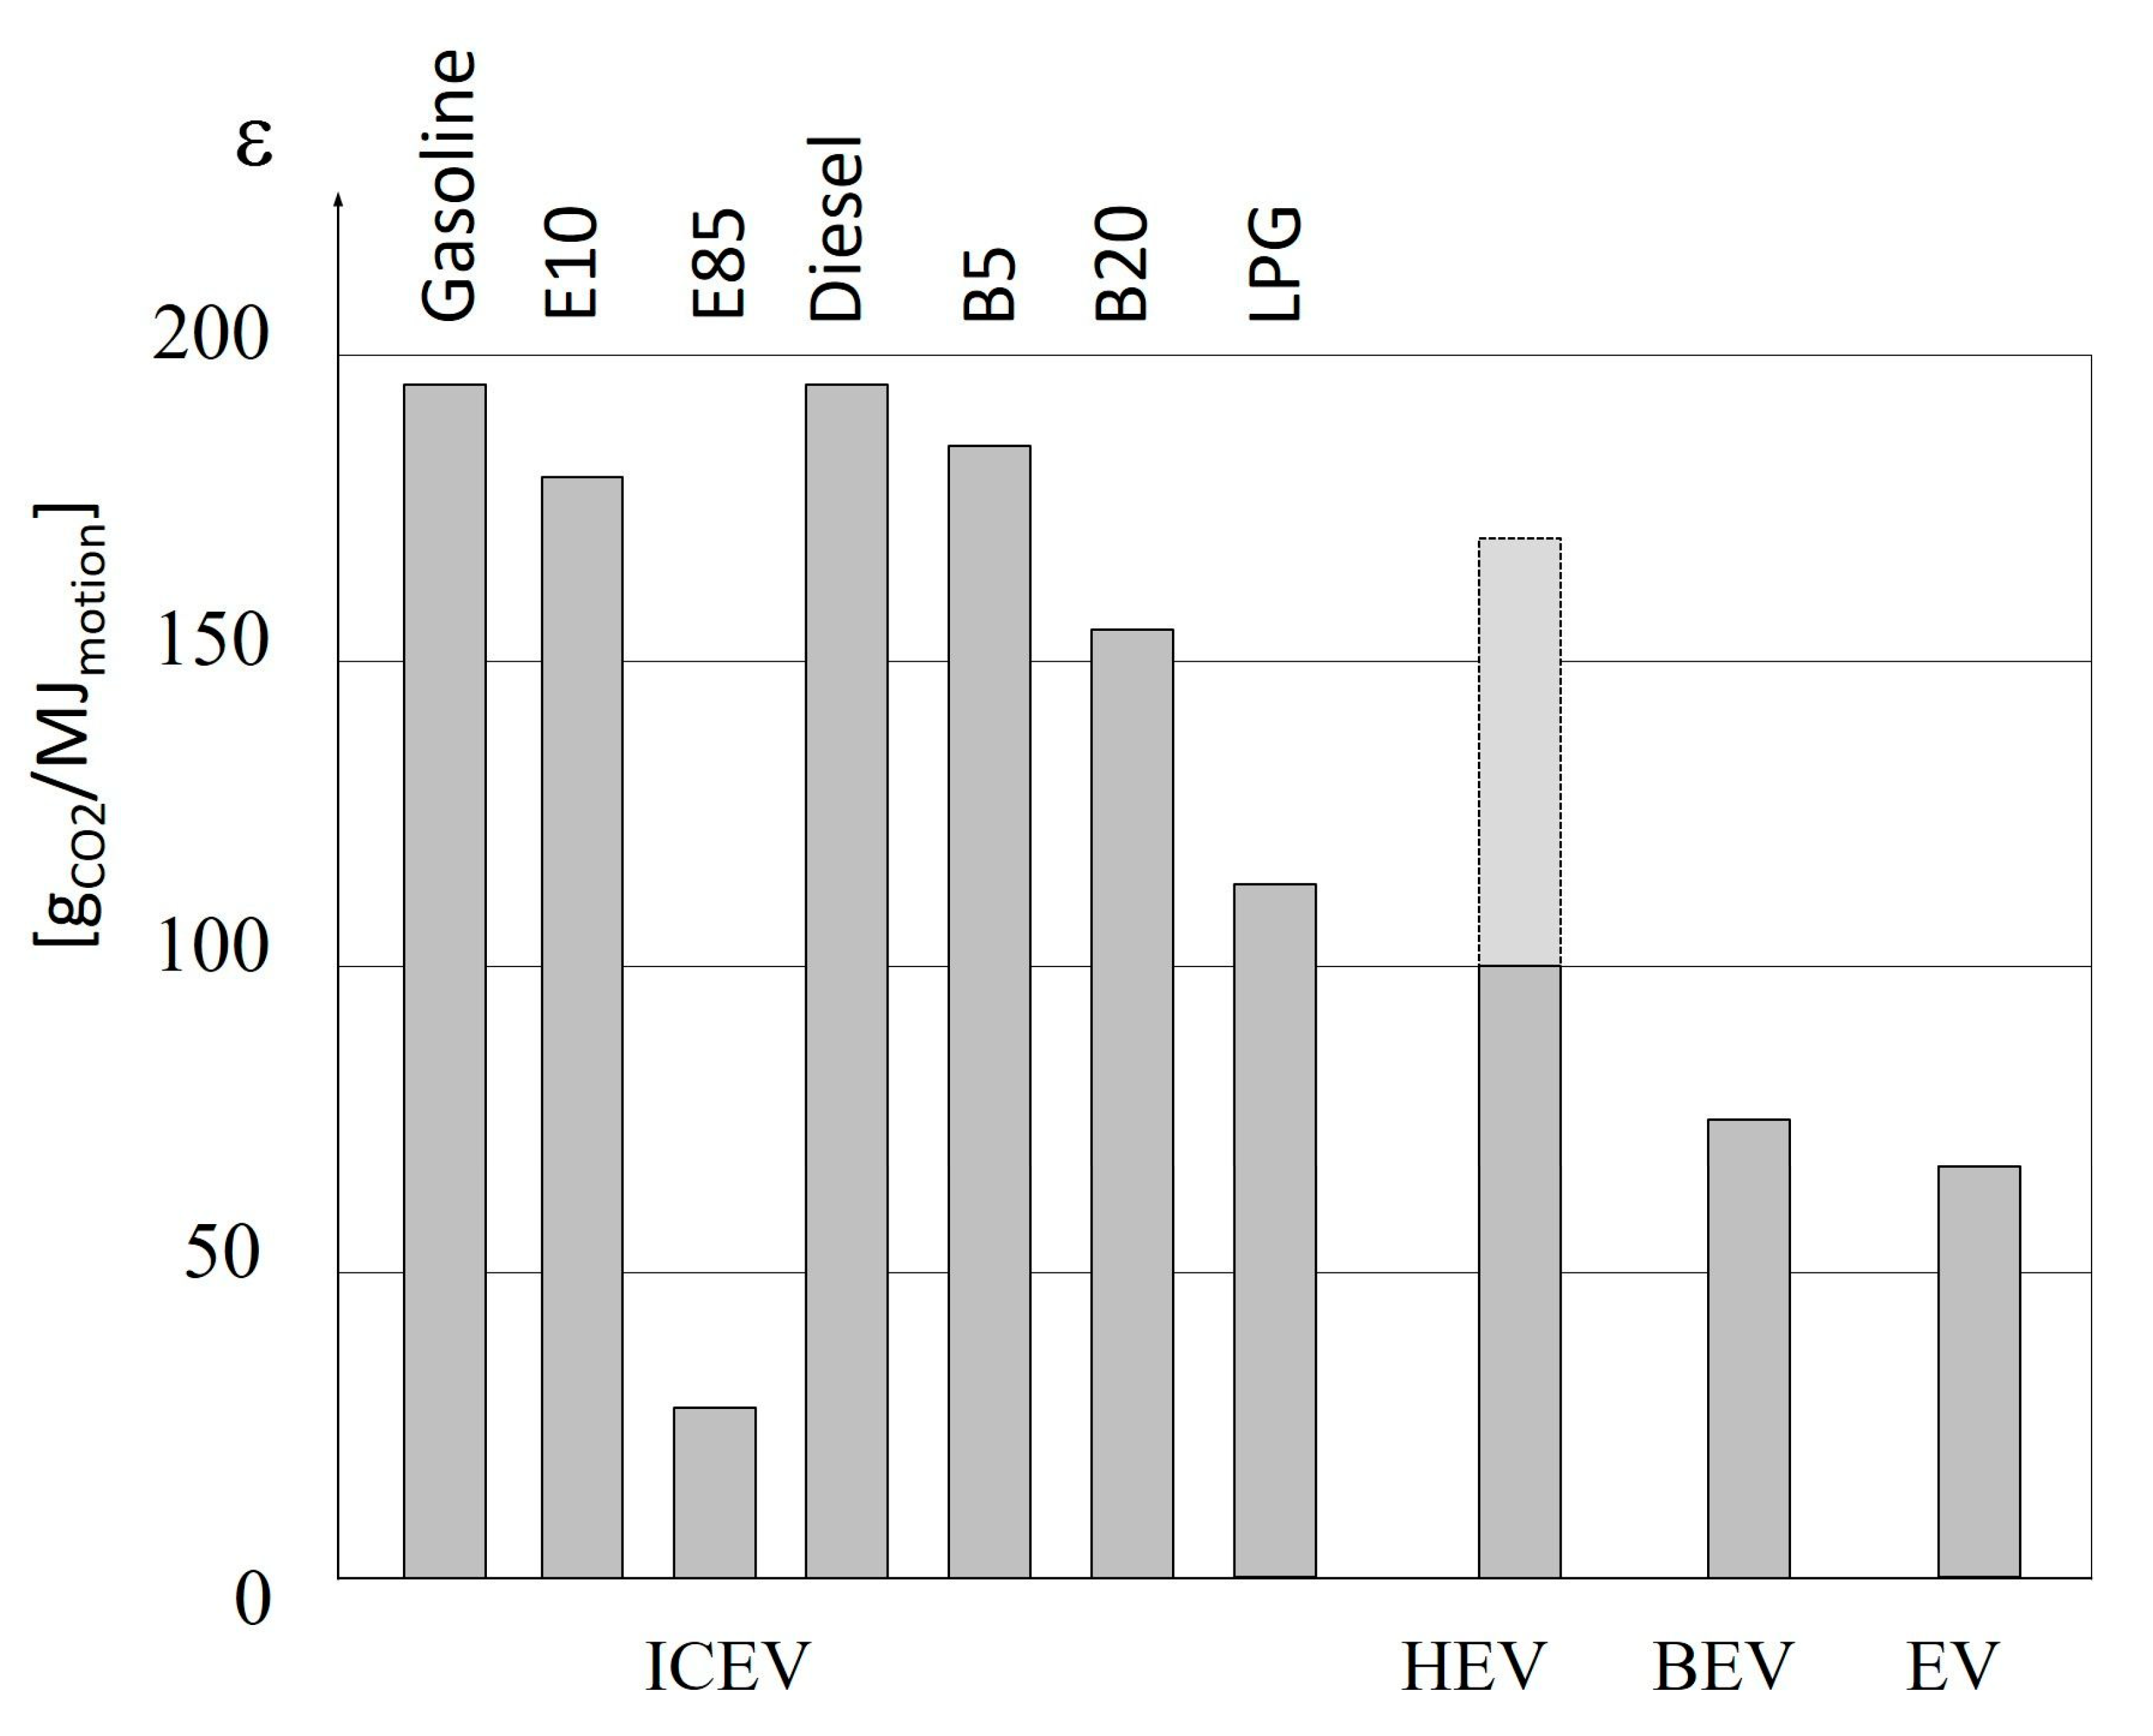
3.2. Energy-Specific CO2 Emission Parameter
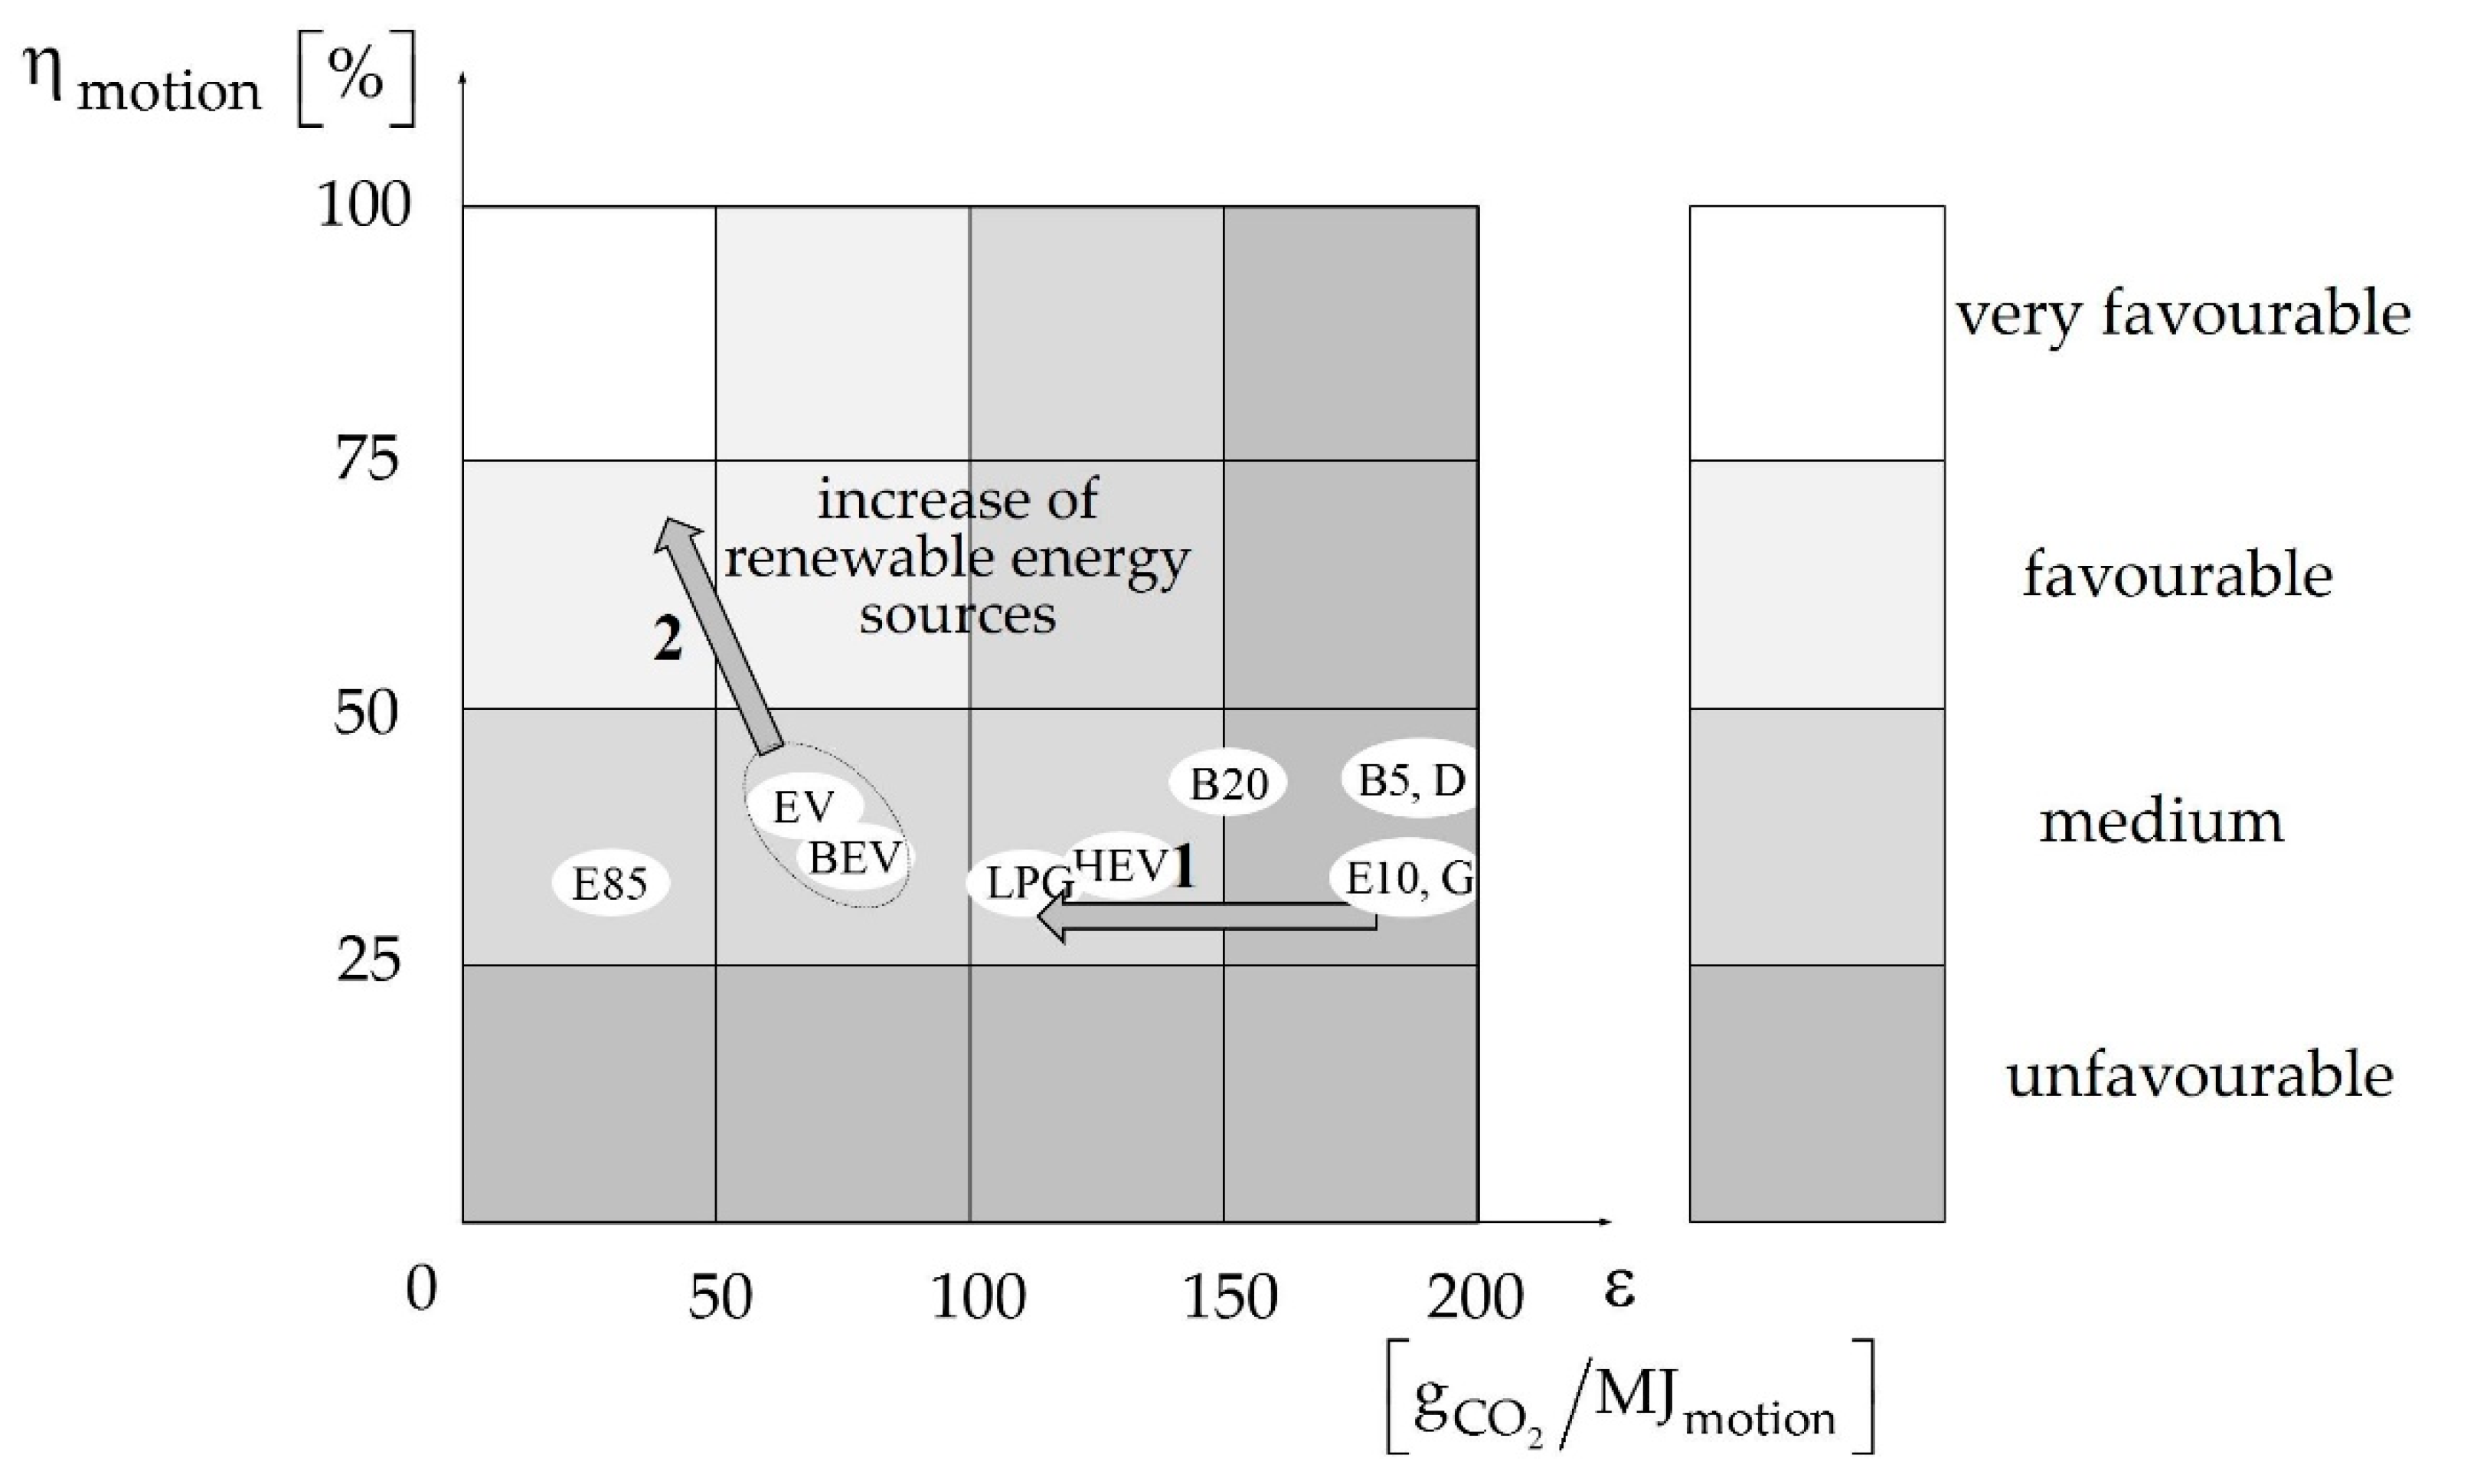
4. Discussion
5. Conclusions
Author Contributions
Funding
Data Availability Statement
Conflicts of Interest
Abbreviations
| BEV | Battery electric vehicle |
| CCGT | Combined cycle gas turbine |
| ChP | Chemical plant |
| CNG | Compressed natural gas |
| EV | Electric vehicle |
| FCEV | Fuel cell electric vehicles |
| GHG | Greenhouse gas |
| HEV | Hybrid electric vehicle |
| IC | Internal combustion |
| ICEV | Internal combustion engine vehicle |
| ICEVD | Internal combustion engine vehicle operating with diesel oil |
| ICEVG | Internal combustion engine vehicle operating with gasoline |
| ICEVNG | Internal combustion engine vehicle operating with LNG or CNG |
| LCA | Life cycle assessment |
| LIB | Lithium-ion battery |
| LNG | Liquefied natural gas |
| LPG | Liquefied petroleum gas (propane and butane) |
| NPP | Nuclear power plant |
| PV | photovoltaic |
| TPP | Traditional thermal power plant (solid fossil fuel/oil/gas) with a normal water-steam cycle |
| WLTP | Worldwide Harmonised Light Vehicle Test Procedure |
| WTW | Wheel-to-wheel |
References
- Cagle, L.E.; Tillery, D. Tweeting the Anthropocene: #400ppm as Networked Event. In Scientific Communication: Practices, Theories, and Pedagogies; Routledge: Abingdon, UK, 2017. [Google Scholar] [CrossRef] [Green Version]
- UNFCCC. Paris Climate Change Conference. In Proceedings of the Conference of the Parties (COP), Paris, France, 30 November–11 December 2015. [Google Scholar]
- European Commission. Clean Energy For All Europeans Communication. In COM(2016) 860 Final; European Commission: Luxembourg, 2016. [Google Scholar]
- Hungarian Ministry for Innovation and Technology. Hungary’s National Energy and Climate Plan; Hungarian Ministry for Innovation and Technology: Budapest, Hungary, 2020. [Google Scholar]
- Mitropoulos, L.K.; Prevedouros, P.D. Life Cycle Emissions and Cost Model for Urban Light Duty Vehicles. Transp. Res. Part D Transp. Environ. 2015, 41, 147–159. [Google Scholar] [CrossRef]
- Hurtig, O.; Leible, L.; Kälber, S.; Kappler, G.; Spicher, U. Alternative Fuels from Forest Residues for Passenger Cars—An Assessment under German Framework Conditions. Energy Sustain. Soc. 2014, 4, 12. [Google Scholar] [CrossRef] [Green Version]
- Wu, Z.; Wang, M.; Zheng, J.; Sun, X.; Zhao, M.; Wang, X. Life Cycle Greenhouse Gas Emission Reduction Potential of Battery Electric Vehicle. J. Clean. Prod. 2018, 190, 462–470. [Google Scholar] [CrossRef]
- Tong, F.; Jaramillo, P.; Azevedo, I.M.L. Comparison of Life Cycle Greenhouse Gases from Natural Gas Pathways for Medium and Heavy-Duty Vehicles. Environ. Sci. Technol. 2015, 49, 7123–7133. [Google Scholar] [CrossRef] [PubMed] [Green Version]
- Ke, W.; Zhang, S.; He, X.; Wu, Y.; Hao, J. Well-to-Wheels Energy Consumption and Emissions of Electric Vehicles: Mid-Term Implications from Real-World Features and Air Pollution Control Progress. Appl. Energy 2017, 188, 367–377. [Google Scholar] [CrossRef]
- Michalek, J.J.; Chester, M.; Jaramillo, P.; Samaras, C.; Shiau, C.S.N.; Lave, L.B. Valuation of Plug-in Vehicle Life-Cycle Air Emissions and Oil Displacement Benefits. Proc. Natl. Acad. Sci. USA 2011, 108, 16554–16558. [Google Scholar] [CrossRef] [Green Version]
- Goedecke, M.; Therdthianwong, S.; Gheewala, S.H. Life Cycle Cost Analysis of Alternative Vehicles and Fuels in Thailand. Energy Policy 2007, 35, 3236–3246. [Google Scholar] [CrossRef]
- Ou, X.; Yan, X.; Zhang, X.; Liu, Z. Life-Cycle Analysis on Energy Consumption and GHG Emission Intensities of Alternative Vehicle Fuels in China. Appl. Energy 2012, 90, 218–224. [Google Scholar] [CrossRef]
- Lajunen, A.; Lipman, T. Lifecycle Cost Assessment and Carbon Dioxide Emissions of Diesel, Natural Gas, Hybrid Electric, Fuel Cell Hybrid and Electric Transit Buses. Energy 2016, 106, 329–342. [Google Scholar] [CrossRef]
- Xiong, S.; Ji, J.; Ma, X. Comparative Life Cycle Energy and GHG Emission Analysis for BEVs and PHEVs: A Case Study in China. Energies 2019, 12, 834. [Google Scholar] [CrossRef] [Green Version]
- Marra, A.E.; Jensen, K.L.; Clark, C.D.; English, B.C.; Toliver, D.K. Greenhouse Gas Emission Reductions as a Motivator of E85 Purchases across Market Segments. Energy. Sustain. Soc. 2012, 2, 21. [Google Scholar] [CrossRef] [Green Version]
- Crossin, E.; Doherty, P.J.B. The Effect of Charging Time on the Comparative Environmental Performance of Different Vehicle Types. Appl. Energy 2016, 179, 716–726. [Google Scholar] [CrossRef]
- Brunner, H.; Hirz, M.; Hirschberg, W.; Fallast, K. Evaluation of Various Means of Transport for Urban Areas. Energy Sustain. Soc. 2018, 8, 9. [Google Scholar] [CrossRef] [Green Version]
- Demir, E.; Bektaş, T.; Laporte, G. A Comparative Analysis of Several Vehicle Emission Models for Road Freight Transportation. Transp. Res. Part D Transp. Environ. 2011, 16, 347–357. [Google Scholar] [CrossRef]
- Salimifard, K.; Raeesi, R. A Green Routing Problem: Optimising CO2 Emissions and Costs from a Bi-Fuel Vehicle Fleet. Int. J. Adv. Oper. Manag. 2014, 6, 27. [Google Scholar] [CrossRef]
- Buzási, A.; Csete, M. Sustainability Indicators in Assessing Urban Transport Systems. Period. Polytech. Transp. Eng. 2015, 43, 138–145. [Google Scholar] [CrossRef] [Green Version]
- Buzási, A.; Csete, M. Modified Scorecard Method for Evaluating Climate Aspects of Urban Transport Systems. Period. Polytech. Soc. Manag. Sci. 2016, 24, 65–73. [Google Scholar] [CrossRef] [Green Version]
- Ahmadi, M.E.; Ericsson, N.; Hansson, P.-A.; Nordberg, Å. Exploring the Potential for Biomethane Production by Willow Pyrolysis Using Life Cycle Assessment Methodology. Energy. Sustain. Soc. 2019, 9, 6. [Google Scholar] [CrossRef] [Green Version]
- Moosmann, D.; Majer, S.; Ugarte, S.; Ladu, L.; Wurster, S.; Thrän, D. Strengths and Gaps of the EU Frameworks for the Sustainability Assessment of Bio-Based Products and Bioenergy. Energy Sustain. Soc. 2020, 10, 22. [Google Scholar] [CrossRef]
- Moro, A.; Lonza, L. Electricity Carbon Intensity in European Member States: Impacts on GHG Emissions of Electric Vehicles. Transp. Res. Part D Transp. Environ. 2018, 64, 5–14. [Google Scholar] [CrossRef]
- Ugurlu, A.; Oztuna, S. How Liquid Hydrogen Production Methods Affect Emissions in Liquid Hydrogen Powered Vehicles? Int. J. Hydrogen Energy 2020, 45, 35269–35280. [Google Scholar] [CrossRef]
- Wang, Q.; Xue, M.; Lin, B.-L.; Lei, Z.; Zhang, Z. Well-to-Wheel Analysis of Energy Consumption, Greenhouse Gas and Air Pollutants Emissions of Hydrogen Fuel Cell Vehicle in China. J. Clean. Prod. 2020, 275, 123061. [Google Scholar] [CrossRef]
- Jhang, S.-R.; Lin, Y.-C.; Chen, K.-S.; Lin, S.-L.; Batterman, S. Evaluation of Fuel Consumption, Pollutant Emissions and Well-to-Wheel GHGs Assessment from a Vehicle Operation Fueled with Bioethanol, Gasoline and Hydrogen. Energy 2020, 209, 118436. [Google Scholar] [CrossRef]
- European Commission. Commission Regulation (EU) 2017/1151 of 1 June 2017 Supplementing Regulation (EC) No 715/2007 of the European Parliament and of the Council on Type-Approval of Motor Vehicles with Respect to Emissions from Light Passenger and Commercial Vehicles Euro 5 A. Off. J. Eur. Union 2017. Available online: https://eur-lex.europa.eu/legal-content/EN/TXT/PDF/?uri=CELEX:32017R1154 (accessed on 18 March 2020).
- European Commission. Regulation (EU) 2019/631 of the european parliament and of the council of 17 April 2019 Setting CO2 Emission Performance Standards for New Passenger Cars and for New Light Commercial Vehicles, and Repealing Regulations (EC) No 443/2009 and (EU) No 510/201. Off. J. Eur. Union 2019. Available online: https://eur-lex.europa.eu/legal-content/EN/TXT/PDF/?uri=CELEX:32019R0631 (accessed on 18 March 2020).
- European Commission. Regulation (EU) 2019/1242 of the european parliament and of the council of 20 June 2019 Setting CO2 Emission Performance Standards for New Heavy-Duty Vehicles and Amending Regulations (EC) No 595/2009 and (EU) 2018/956 of the European Parliament and of Th. Off. J. Eur. Union 2019. Available online: https://eur-lex.europa.eu/legal-content/EN/TXT/PDF/?uri=CELEX:32019R1242&rid=3 (accessed on 18 March 2020).
- Tucki, K.; Orynycz, O.; Swic, A.; Mitoraj-Wojtanek, M. The Development of Electromobility in Poland and EU States as a Tool for Management of CO2 Emissions. Energies 2019, 12, 2942. [Google Scholar] [CrossRef] [Green Version]
- Hungarian Independent Trans-mission Operator Company Ltd. Available online: https://mavir.hu/web/mavir/home (accessed on 18 March 2020).
- Efficiency of Conventional Thermal Electricity and Heat Production in Europe—European Environment Agency. Available online: https://www.eea.europa.eu/data-and-maps/indicators/efficiency-of-conventional-thermal-electricity-generation-4/assessment-2 (accessed on 18 March 2020).
- Overview of Electricity Production and Use in Europe—European Environment Agency. Available online: https://www.eea.europa.eu/data-and-maps/indicators/overview-of-the-electricity-production-2/assessment-4 (accessed on 18 March 2020).
- Bhatt, P.; Mehar, H.; Sahajwani, M. Electrical Motors for Electric Vehicle—A Comparative Study. SSRN Electron. J. 2019. [Google Scholar] [CrossRef]
- Eftekhari, A. Energy Efficiency: A Critically Important but Neglected Factor in Battery Research. Sustain. Energy Fuels 2017, 1, 2053–2060. [Google Scholar] [CrossRef]
- Diao, W.; Jiang, J.; Liang, H.; Zhang, C.; Jiang, Y.; Wang, L.; Mu, B. Flexible Grouping for Enhanced Energy Utilization Efficiency in Battery Energy Storage Systems. Energies 2016, 9, 498. [Google Scholar] [CrossRef] [Green Version]
- Chae, H.J.; Kim, W.Y.; Yun, S.Y.; Jeong, Y.S.; Lee, J.Y.; Moon, H.T. 3.3kW on Board Charger for Electric Vehicle. In Proceedings of the 8th International Conference on Power Electronics—ECCE Asia: “Green World with Power Electronics”, ICPE 2011-ECCE Asia, Jeju, Korea, 29 May–2 June 2011; pp. 2717–2719. [Google Scholar] [CrossRef]
- Palou-Rivera, I.; Han, J.; Wang, M. Updates to Petroleum Refining and Upstream Emissions; Center for Transportation Research Argonne National Laboratory: Lemont, IL, USA, 2011. [Google Scholar]
- van Basshuysen, R.; Schäfer, F. Handbuch Verbrennungsmotor Grundlagen, Komponenten, Systeme, Perspektiven; Springer: Wiesbaden, Germany, 2017. [Google Scholar]
- The Japan Society of Mechanical Engineers, Thermal Efficiency of Engines; Japan, 2016; Available online: https://www.jsme.or.jp/jsme/uploads/2016/08/No-7.pdf (accessed on 18 March 2020).
- Raznjevic, K. Handbook of Thermodynamic Tables and Charts; Hemisphere Publishing Corp: Washington, DC, USA, 1976. [Google Scholar]
- Eurostat. Electricity Generation Statistics—First Results—Statistics Explained. Available online: https://ec.europa.eu/eurostat/statistics-explained/index.php?title=Electricity_generation_statistics_–_first_results (accessed on 19 March 2020).
- Eurostat. File: Electricity Statistics, EU-28 and EA-19, 2016-2018 (GWh).png—Statistics Explained. Available online: https://ec.europa.eu/eurostat/statistics-explained/index.php?title=File:Electricity_Statistics,_EU-28_and_EA-19,_2016-2018_(GWh).png (accessed on 19 March 2020).
- Natural Resources Canada. Learn the Facts: Fuel Consumption and CO2. Available online: https://www.nrcan.gc.ca/sites/www.nrcan.gc.ca/files/oee/pdf/transportation/fuel-efficient-technologies/autosmart_factsheet_6_e.pdf (accessed on 18 March 2020).
- Australian Goverment Department of Sustainability, Environment, Water, Population, and Communities. Developing a B20 Fuel Quality Standard; Sydney, Australia, 2012. Available online: https://docplayer.net/28959916-Developing-a-b20-fuel-quality-standard.html (accessed on 18 March 2020).
- Heating Values of Hydrogen and Fuels. Available online: https://chemeng.queensu.ca/courses/CHEE332/files/ethanol_heating-values.pdf (accessed on 18 March 2020).
- Information Service for MPs (Infoservice). Distribution and authority supervision of LPG and its mixtures—What is LPG? (In Hungarian). Available online: https://www.parlament.hu/documents/10181/59569/Infojegyzet_2013_43_PB_gazok.pdf/e0be92ee-0d25-4b63-a75e-67ca7be09afd (accessed on 18 March 2020).
- EERE: Alternative Fuels Data Center Home Page. Available online: https://afdc.energy.gov/ (accessed on 18 March 2020).
- Geng, P.; Furey, R.; Konzack, A. Calculation of Heating Value for Gasoline. SAE Int. J. Fuels Lubr. 2010, 3, 229–237. [Google Scholar] [CrossRef]
- Al-Mashhadani, H.; Fernando, S. Properties, Performance, and Applications of Biofuel Blends: A Review. AIMS Energy 2017, 5, 735–767. [Google Scholar] [CrossRef]
- Neste. Neste Renewable Diesel Handbook; Neste Proprietary: Espoo, Finland, 2016. [Google Scholar]
- Zhang, H.; Xing, J.; Guo, C. Thermal Analysis of Diesel Engine Piston. J. Chem. Pharm. Res. 2013, 5, 388–393. [Google Scholar]
- Guo, M.; Song, W.; Buhain, J. Bioenergy and Biofuels: History, Status, and Perspective. Renew. Sustain. Energy Rev. 2015, 42, 712–725. [Google Scholar] [CrossRef]


| ηmotion,EV | ηmotion,BEV | ηmotion,HEV | ηmotion,ICEV,G | ηmotion,ICEV,LPG | ηmotion,ICEV,D |
|---|---|---|---|---|---|
| 0.35 | 0.31 | 0.27–0.31 | 0.27 | 0.27 | 0.36 |
| Primary Energy Sources | Heat Value [MJ/kg] | Carbon Content [w/w %] | kg CO2 Produced from 1 kg | Secondary Energy Produced [MJ/kg] | Secondary Energy-Specific CO2 Emission [g CO2/MJ] |
|---|---|---|---|---|---|
| Lignite (raw, air-dried) | 19.7 | 49.6 | 1.84 | electricity, TPP | εE,lignite = 186 |
| 9.85 | |||||
| Natural gas | 34 | 71 | 2.60 | electricity, CCGT | εE,CCGT = 139 |
| 18.7 | |||||
| Tree and energy plants | 14–20 ≈ 17 | 45–47 ≈ 46 | 1.69 | electricity, TPP | εE,t&ep = 0 |
| 8.5 | (εE,t&ep = 199) | ||||
| Renewables | εE,Rs = 0 | ||||
| NPP | εE,NPP = 0 |
| Contribution of the Sources to the Production in % | EU Import Electricity in PJ(=109 MJ) | Secondary Energy-Specific CO2 Emission [g CO2/MJ] | CO2 Emission in kt (=109 g) | ||
|---|---|---|---|---|---|
| EU energy mix in 2018 | NPP | ≈26% | 11.79 | εE,NPP = 0 | 0 |
| Conventional TPP | ≈46% | 20.87 | εE,TPP = 186 | 3882 | |
| Rs+t&ep | ≈28% | 12.70 | εE,Rs+t&ep = 0 | 0 | |
| Total | 100% | 45.36 | εE,EUtotal = 86 | 3882 |
| Output Electricity Produced in TWh (=109 kWh) | Output Electricity Produced in PJ (=109 MJ) | Secondary Energy-Specific CO2 Emission [g CO2/MJ] | CO2 Emission in kt (=109 g) | ||
|---|---|---|---|---|---|
| HU energy mix in 2019 | NPP | 16.3 | 58.68 | εE,NPP = 0 | 0 |
| TPP | 3.9 | 14.04 | εE,lignite = 186 | 2611 | |
| CCGT | 8.8 | 31.68 | εE,CCGT = 139 | 4404 | |
| Rs+t&ep | 4.1 | 14.76 | εE,Rs+t&ep = 0 | 0 | |
| EU import | 12.6 | 45.36 | εE,import = 86 | 3901 | |
| total | 45.7 | 164.52 | εE,HUmix = 66 | 10916 | |
| Secondary Energy | Lower Heat Value [MJ/kg] | Lower Heat Value [MJ/l] | Density at 15 °C [kg/l] | kg CO2 Produced from 1 kg | kg CO2 Produced from 1 l | Total Energy Efficiency of Vehicle η [-] | Motion Energy Specific Total CO2 Emissions [g CO2/MJmotion] |
|---|---|---|---|---|---|---|---|
| LPG | 45.5–46.5 | (23.5) | 1.82 | 0.35 | εICEV,LPG = 113 | ||
| (≈46) | |||||||
| Gasoline | 43.5–46.5 (≈45) | 34.7 | ≈0.74–0.75 | 3.07 | 2.29 | 0.35 | εICEV,Gasoline = 195 |
| Diesel oil | 42–46 | 38.3 (35.8) | 0.82–0.85 | 3.09 | 0.36 | εICEV,Diesel = 195 | |
| (≈44) | ≈0.835 | ||||||
| E10 10% bioethanol 90% gasoline | 41.3–43.9 | ≈31.5 (31.2–32.4) | 0.735–0.75 | 2.21 × 0.9 | 0.35 | εICEV,E10 = 180 | |
| E85 85% bioethanol 15% gasoline | 29.2–33.1 | ≈24.5 | ≈0.78–0.79 | 1.61 × 0.15 | 0.35 | εICEV,E85 = 28 | |
| B5 5% biodiesel 95% diesel oil | ≈44 × 0.997 | ≈37.8 | 0.86–0.89 | 2.65 × 0.95 | 0.36 | εICEV,B5 = 185 | |
| ≈43.9 | ≈0.86 | ||||||
| B20 20% biodiesel 80% diesel oil | ≈44 × 0.961 | ≈37.6 | 0.86–0.89 | 2.62 × 0.8 | 0.36 | εICEV,B20 = 155 | |
| ≈42.3 | ≈0.89 |
| ηmotion,EV | η motion,BEV | ηmotion,HEV | ηmotion,ICEV,LPG | ηmotion,ICEV,G |
|---|---|---|---|---|
| 0.35 | 0.31 | 0.27–0.31 | 0.27 | 0.27 |
| εEV | εBEV | εHEV | εICEV,LPG | εICEV,G |
| 67 | 75 | 100–170 | 113 | 195 |
| ηmotion,ICEV,E10 | ηmotion,ICEV,E85 | ηmotion,ICEV,D | ηmotion,ICEV,B5 | ηmotion,ICEV,B20 |
| 0.27 | 0.27 | 0.36 | 0.36 | 0.36 |
| εICEV,E10 | εICEV,E85 | εICEV,D | εICEV,B5 | εICEV,B20 |
| 180 | 28 | 195 | 185 | 155 |
Publisher’s Note: MDPI stays neutral with regard to jurisdictional claims in published maps and institutional affiliations. |
© 2021 by the authors. Licensee MDPI, Basel, Switzerland. This article is an open access article distributed under the terms and conditions of the Creative Commons Attribution (CC BY) license (https://creativecommons.org/licenses/by/4.0/).
Share and Cite
Árpád, I.; Kiss, J.T.; Bellér, G.; Kocsis, D. Sustainability Investigation of Vehicles’ CO2 Emission in Hungary. Sustainability 2021, 13, 8237. https://doi.org/10.3390/su13158237
Árpád I, Kiss JT, Bellér G, Kocsis D. Sustainability Investigation of Vehicles’ CO2 Emission in Hungary. Sustainability. 2021; 13(15):8237. https://doi.org/10.3390/su13158237
Chicago/Turabian StyleÁrpád, István, Judit T. Kiss, Gábor Bellér, and Dénes Kocsis. 2021. "Sustainability Investigation of Vehicles’ CO2 Emission in Hungary" Sustainability 13, no. 15: 8237. https://doi.org/10.3390/su13158237
APA StyleÁrpád, I., Kiss, J. T., Bellér, G., & Kocsis, D. (2021). Sustainability Investigation of Vehicles’ CO2 Emission in Hungary. Sustainability, 13(15), 8237. https://doi.org/10.3390/su13158237