
Influence of Housing Resettlement on the Subjective Well-Being of Disaster-Forced Migrants: An Empirical Study in Yancheng City


Abstract
1. Introduction
2. Data and Methodology
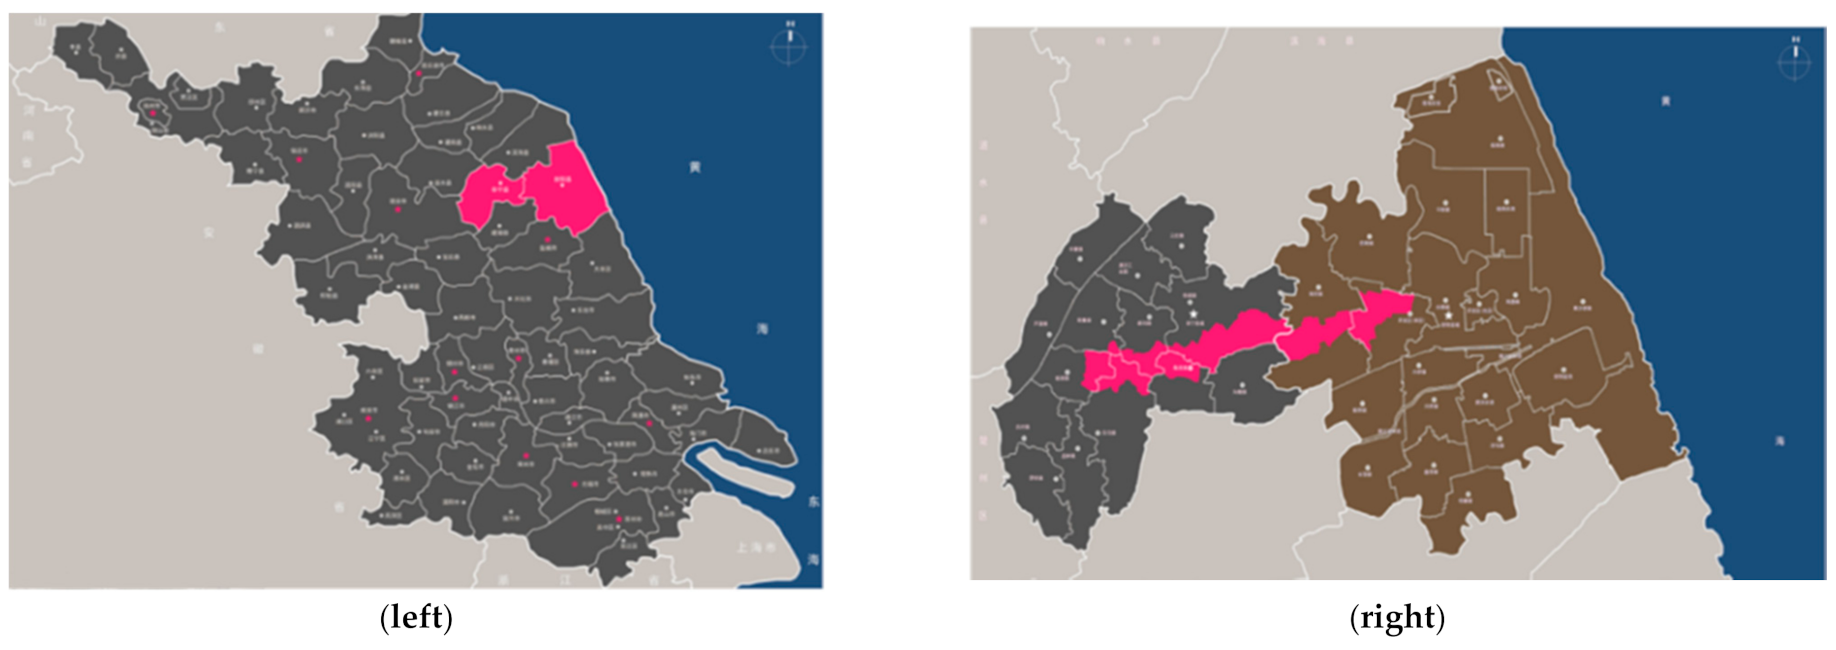
2.1. Case Background
2.2. Data Sources
2.3. Variable Selection and Propositions
- As mentioned earlier, the housing resettlement is allocated by drawing lots and in line with household population. The policy is intended to be open, fair and just, but after our fieldwork, the migrants’ evaluation of the housing allocation mode was mixed, which affects their SWB. In this study, this variable is represented by the evaluation of the housing allocation method by migrants in the resettlement community. Proposition 1: The housing allocation mode is significantly positively associated with the SWB of disaster-induced migrants.
- Generally speaking, housing expenditure affects family savings and thus has a negative effect on the SWB of disaster migrants. In this study, housing expenditure includes the purchase cost, renovation cost and house repair cost that migrants have to spend when they purchase the resettlement dwellings. Proposition 2: Housing expenditure is significantly negatively associated with the SWB of disaster-induced migrants.
- Housing quality affects the migrants’ living experience and thus their well-being, while housing for migrants still resettled in the affected areas must strictly follow disaster preparedness and resilience requirements, improve wind and storm resistance and ensure construction quality. In this study, this variable is mainly examined through the migrants’ rating of the construction quality of the houses. Proposition 3: Housing quality is significantly positively associated with the SWB of disaster-induced migrants.
- The increase in living space helps to improve the well-being of migrants. As mentioned earlier, six different floor areas are planned dedicated to different sizes of households according to hukou status. However, the actual per capita living space may vary significantly as some hukou-registered people may not actually stay in the place but migrated to other places for a living. Proposition 4: Per capita living space is significantly positively associated with the SWB of disaster-induced migrants.
- Community facilities are crucial because they can facilitate the life of migrants and improve their quality of life. The community facilities variables chosen for this paper are expressed in terms of the number of supermarkets, health rooms, kindergartens, primary schools, elderly activity rooms, fitness squares, chess and card rooms and bus stops within a 1 km walk of the community. Proposition 5: Community facilities are significantly positively associated with the SWB of disaster-induced migrants.
- Community hygiene is, on the one hand, the first impression that migrants have of the centralised resettlement community, and, on the other hand, it also has an impact on migrants’ living environment and a significant impact on their subjective sense of well-being, which is expressed in this study by the migrants’ self-assessment of community hygiene in terms of street hygiene, open space, buildings and rubbish collection. Proposition 6: Community hygiene is significantly positively associated with the SWB of disaster-induced migrants.
- Community participation reflects the construction of the social environment in resettlement communities and is an important way for migrants to obtain social support and neighbourhood interaction, which can significantly affect their subjective well-being. This paper uses the frequency of migrants’ participation in community square dance activities, fitness activities, recreational activities and community Weibo groups to indicate the level of community participation. Proposition 7: Community participation is significantly positively associated with the SWB of disaster-induced migrants.
- Analysis of the cadre–mass relationship can, on the one hand, reflect whether the current governance capacity of community cadres is satisfactory to migrants; on the other hand, it can also help to understand whether community cadres are meeting the needs of migrants when implementing the resettlement policy from above. In this study, the cadre–mass relationship variable is expressed in terms of migrants’ trust in community cadres. Proposition 8: The cadre–mass relationship is significantly positively associated with the SWB of disaster-induced migrants.
2.4. Study Methodology and Model Setting
3. Results
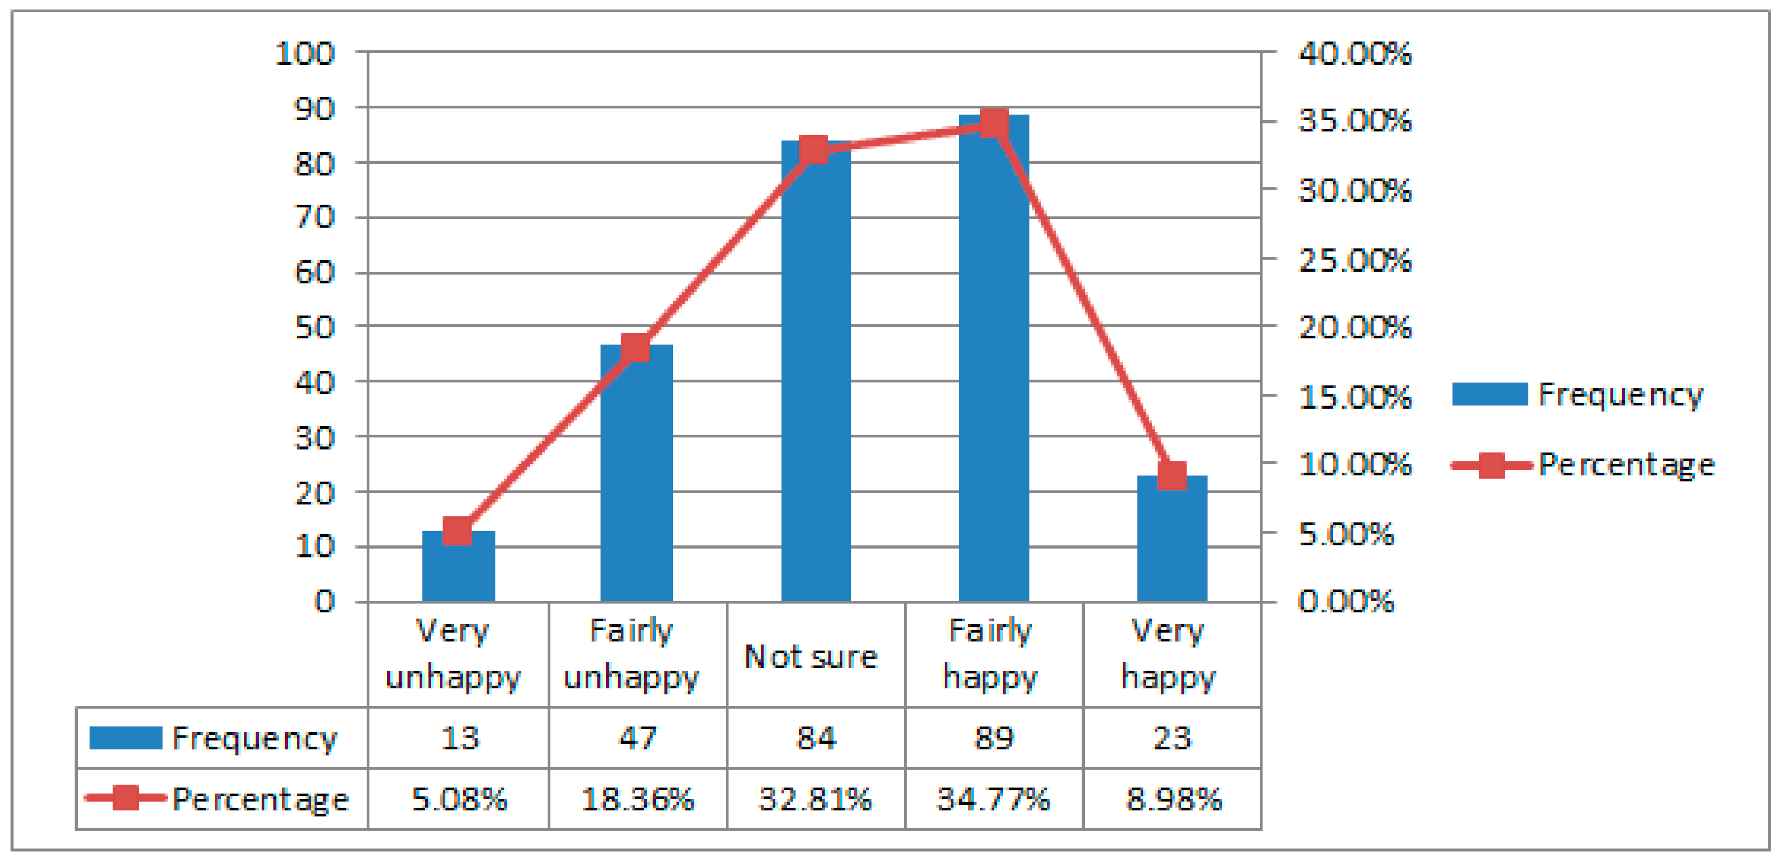
3.1. SWB of Disaster Migrants
3.2. Model Testing and Selection
3.3. Logistic Regression Analysis and Results
4. Conclusions and Discussion
- The original housing of disaster victims is mostly self-made and commonly lacks repairs, which poses a certain safety risk. In addition, their original village infrastructure is underdeveloped, causing inconvenience to their daily lives. After they move to centralised resettlement communities, their housing conditions and community environment tend to improve to some extent, and their SWB slightly increases. Overall, the SWB of disaster-induced migrants was good, and most self-evaluated SWB values were above average. The ordinal logistic regression model showed that housing resettlement has a significant influence on the SWB of disaster-induced migrants. The main finding concurs with existing studies which indicate that housing plays a significant role in the SWB of people [29,30,31,32,33].
- Regarding the resettlement housing conditions, SWB was significantly influenced by the housing allocation mode, housing expenditure, housing quality and living space. The SWB was negatively associated with housing expenditure and positively associated with the housing allocation mode, housing quality and living space. That is, the findings show that disaster migrants are likely to feel happier if they are satisfied with the housing allocation mode, housing quality and the living space, and the more housing expenditure related to the resettlement is, the less happy they tend to be. In this way, our study enriches the perceived association between housing and SWB. While the dominant studies show that the per capital living space tends to positively affect SWB [34,35,36], our finding further points out that the housing allocation mode can have a strong impact on SWB. This is especially relevant to resettlement, in which the process of replacement requires serious attention to housing allocation policy design. In China, it is the government which takes the lead, and it allocates the housing by drawing lots and in line with household population for fairness. However, from our finding, it shows that drawing lots and allocation in accordance with household size is too rigid to account for more diverse needs.
- Among the resettlement community environment, SWB was not significantly associated with community facilities or community participation, but it was significantly positively associated with community hygiene and the cadre–mass relationship. This is an interesting finding that is distinct from existing studies which suggest that the community environment and public facilities have a positive relationship with SWB [37]. This somehow reflects the social change of the resettled community, in which social interactions become less intense in the urban style housing and hence community facilities and community participation have little impact on the happiness of disaster migrants. In contrast, the cadre–mass relationship accounts for a big role in China, which vividly reflects the social structure of China. This is because Chinese society is more reliant upon the government than civic organisation to resolve daily affairs such as the concerns with housing quality and community hygiene.
Author Contributions
Funding
Institutional Review Board Statement
Informed Consent Statement
Conflicts of Interest
Appendix A

| A.Personal Information | |||||||||||||||||
| A01 Sex of the interviewee | [1] Male | ||||||||||||||||
| [2] Female | |||||||||||||||||
| A02 Name of the interviewee | |||||||||||||||||
| A03 Respondent’s phone number | |||||||||||||||||
| A04 Respondent’s age (weeks old) | |||||||||||||||||
| A05 Your education level is. | [1] Elementary school and below | ||||||||||||||||
| [2] Junior high school | |||||||||||||||||
| [3] High school | |||||||||||||||||
| [4] Secondary school | |||||||||||||||||
| [5] College and above | |||||||||||||||||
| A06 Your political affiliation is | [1] Communist Party member | ||||||||||||||||
| [2] Communist Party member | |||||||||||||||||
| [3] Democratic Party member | |||||||||||||||||
| [4] Non-party member | |||||||||||||||||
| [5] Masses | |||||||||||||||||
| A07 What is the nature of your current household registration? | [1] Non-agricultural | ||||||||||||||||
| [2] Agricultural | |||||||||||||||||
| A08 When did you move into your new community? (specific year and month) | |||||||||||||||||
| A09 Where did you move from? (including county, village) | |||||||||||||||||
| A10 How do you think your health is now? | [1] Very unhealthy | ||||||||||||||||
| [2] Less healthy | |||||||||||||||||
| [3] Not sure* | |||||||||||||||||
| [4] Healthier | |||||||||||||||||
| [5] Very healthy | |||||||||||||||||
| B Family Information | |||||||||||||||||
| B01 What is your marital status? | [1] Married | ||||||||||||||||
| [2] Unmarried | |||||||||||||||||
| B02 What is the type of your family? | [1] One person living alone | ||||||||||||||||
| [2] Couple (nuclear family) | |||||||||||||||||
| [3] Couple and unmarried children (nuclear family) | |||||||||||||||||
| [4] Father (mother) and married children living together (immediate family) | |||||||||||||||||
| [5] Married siblings living together (joint family) | |||||||||||||||||
| [6] Father (mother) and married children and married siblings living together (direct joint family) | |||||||||||||||||
| [7] Grandchildren living together (including grandchildren) | |||||||||||||||||
| [8] Family members living with non-relatives | |||||||||||||||||
| [9] Others (please specify): | |||||||||||||||||
| B03 How did the total annual income of your household change before and after the relocation? | [1] Increased | ||||||||||||||||
| [2] (Before relocation ____; After relocation ______) | [1] Less than 10,000 RMB | ||||||||||||||||
| [2] 1–2000 RMB | |||||||||||||||||
| [3] 20–30,000 RMB | |||||||||||||||||
| [4] 30–40,000 RMB | |||||||||||||||||
| [5] More than 40,000 RMB | |||||||||||||||||
| B04 What is the change in your family’s income source before and after relocation? | [1] Income from farmland mainly changed to non-farm income | ||||||||||||||||
| [2] Income from farmland mainly changed to government subsidies | |||||||||||||||||
| [3] Income from non-farm mainly changed to income from farmland workers | |||||||||||||||||
| [4] Income from non-farm mainly changed to government subsidies | |||||||||||||||||
| [5] No change before and after relocation, still mainly income from farmland | |||||||||||||||||
| [6] No change before and after relocation, still mainly income from non-farm | |||||||||||||||||
| B05 What is the change of your family’s cultivable land area before and after relocation? | [1] Increased | ||||||||||||||||
| [2] Decreased | |||||||||||||||||
| [3] No change | |||||||||||||||||
| B06 What is the change in your family’s total annual expenditure before and after relocation? | [1] Increased | ||||||||||||||||
| [2] Decreased | |||||||||||||||||
| [3] No change | |||||||||||||||||
| (Before relocation ______; After relocation ______) | [1] Less than 5000 | ||||||||||||||||
| [2] 5000–10,000 | |||||||||||||||||
| [3] 10–20,000 | |||||||||||||||||
| [4] 20–30,000 | |||||||||||||||||
| [5] More than 30,000 | |||||||||||||||||
| C Housing Information | |||||||||||||||||
| C01 What is the damage level of your house? | [1] Generally damaged | ||||||||||||||||
| [2] Generally repairable | |||||||||||||||||
| [3] Seriously repairable | |||||||||||||||||
| [4] Seriously unrepairable | |||||||||||||||||
| [5] Collapsed | |||||||||||||||||
| C02 Are you satisfied with the assessment result? | [1] Very dissatisfied | ||||||||||||||||
| [2] Dissatisfied | |||||||||||||||||
| [3] General | |||||||||||||||||
| [4] Satisfied | |||||||||||||||||
| [5] Very satisfied | |||||||||||||||||
| C03 How much was the subsidy for your house? | |||||||||||||||||
| C04 Are you satisfied with the result of this subsidy? | [1] Very dissatisfied | ||||||||||||||||
| [2] Unsatisfied | |||||||||||||||||
| [3] Generally | |||||||||||||||||
| [4] Satisfied | |||||||||||||||||
| [5] Very satisfied | |||||||||||||||||
| C05 How is the land acquired for this centralized resettlement site? | |||||||||||||||||
| C06 What is the site selection method of this centralized resettlement site? | [1] Occupy good land | ||||||||||||||||
| [2] Rebuild in situ on damaged houses | |||||||||||||||||
| [3] Other ways | |||||||||||||||||
| C07 Are you satisfied with the site selection method? | [1] Very unsatisfactory | ||||||||||||||||
| [2] Unsatisfactory | |||||||||||||||||
| [3] Not sure * | |||||||||||||||||
| [4] Satisfactory | |||||||||||||||||
| [5] Very satisfactory | |||||||||||||||||
| C08 What kind of land is this house of yours built on? | [1] State land | ||||||||||||||||
| [2] Collective land | |||||||||||||||||
| C09 Are you satisfied with the ownership of this land? | [1] Very unsatisfied | ||||||||||||||||
| [2] Unsatisfied | |||||||||||||||||
| [3] General | |||||||||||||||||
| [4] Satisfied | |||||||||||||||||
| [5] Very satisfied | |||||||||||||||||
| C10 Do you think this house belongs to you now? | [1] Belong | ||||||||||||||||
| [2] Do not belong | |||||||||||||||||
| C11 Are you satisfied with the ownership of this house? | [1] Very dissatisfied | ||||||||||||||||
| [2] Dissatisfied | |||||||||||||||||
| [3] General | |||||||||||||||||
| [4] Satisfied | |||||||||||||||||
| [5] Very satisfied | |||||||||||||||||
| C12 How was your new house built? | [1] Construction | ||||||||||||||||
| [2] Self-built | |||||||||||||||||
| [3] Other ways | |||||||||||||||||
| C13 Are you satisfied with this way of building your house? | [1] Very unsatisfactory | ||||||||||||||||
| [2] Unsatisfactory | |||||||||||||||||
| [3] Not sure * | |||||||||||||||||
| [4] Satisfactory | |||||||||||||||||
| [5] Very satisfactory | |||||||||||||||||
| C14 How is the house of centralized living divided? | |||||||||||||||||
| C15 Are you satisfied with this way of house sharing? | [1] Very dissatisfie | ||||||||||||||||
| [2] Dissatisfied | |||||||||||||||||
| [3] Not sure * | |||||||||||||||||
| [4] Satisfied | |||||||||||||||||
| [5] Very satisfied | |||||||||||||||||
| C16 In the process of relocation and resettlement, are you aware of the policy on resettlement compensation? | [1] Never heard of it | ||||||||||||||||
| [2] Don’t know | |||||||||||||||||
| [3] Know some | |||||||||||||||||
| [4] Know | |||||||||||||||||
| [5] Know very much | |||||||||||||||||
| C17 In the process of relocation and resettlement, has anyone surveyed or interviewed to get your opinion? | [1] Yes | ||||||||||||||||
| [2] No | |||||||||||||||||
| [3] Don’t know, not at that time | |||||||||||||||||
| C18 In the process of relocation and resettlement, did you reflect your opinion? | [1] Yes | ||||||||||||||||
| [2] No | |||||||||||||||||
| C19 Were your reflected opinions handled by anyone? | [1] Yes | ||||||||||||||||
| [2] No | |||||||||||||||||
| C20 Are you satisfied with the results of the treatment? | [1] Very dissatisfied | ||||||||||||||||
| [2] Dissatisfied | |||||||||||||||||
| [3] General | |||||||||||||||||
| [4] Satisfied | |||||||||||||||||
| [5] Very satisfied | |||||||||||||||||
| C21 What type of housing did you live in before and after the relocation? | [1] Yes | Type of house Before relocation After relocation | |||||||||||||||
| [2] No | C21.1 Detached bungalow | ||||||||||||||||
| [3] Not applicable | C21.2 Two-story and above houses | ||||||||||||||||
| C21.3 Other types | |||||||||||||||||
| C22 Are you satisfied with this type of housing now? | [1] Very dissatisfied | ||||||||||||||||
| [2] Dissatisfied | |||||||||||||||||
| [3] Not sure * | |||||||||||||||||
| [4] Satisfied | |||||||||||||||||
| [5] Very satisfied | |||||||||||||||||
| C23 Did the size of your house change after the new community before and after you moved? (Before relocation ______; After relocation ______) | [1] Changed, got bigger | ||||||||||||||||
| [2] Changed, got smaller | |||||||||||||||||
| [3] No change, about the same as before | |||||||||||||||||
| C24 Are you satisfied with the size of your house now? | [1] Very dissatisfied | ||||||||||||||||
| [2] Dissatisfied | |||||||||||||||||
| [3] Not sure * | |||||||||||||||||
| [4] Satisfied | |||||||||||||||||
| [5] Very satisfied | |||||||||||||||||
| C25 Did the number of rooms change before and after you moved? (Before moving ______; after moving ______) (three rooms and one hall/two rooms and one hall) | [1] Changed, more | ||||||||||||||||
| [2] Changed, less | |||||||||||||||||
| [3] No change, more or less the same as before | |||||||||||||||||
| C26 Are you satisfied with the number of rooms you have now? | [1] Very dissatisfied | ||||||||||||||||
| [2] Not satisfied | |||||||||||||||||
| [3] Not sure * | |||||||||||||||||
| [4] Satisfied | |||||||||||||||||
| [5] Very satisfied | |||||||||||||||||
| C27 Which do you think is more promising than the original location where your family lives now? | [1] Before | ||||||||||||||||
| [2] Now | |||||||||||||||||
| [3] Same | |||||||||||||||||
| C28 Which house do you think is more valuable than the original one? | [1] Before | ||||||||||||||||
| [2] Now | |||||||||||||||||
| [3] The same | |||||||||||||||||
| C29 Which house do you think is more convenient for your family to live in now compared to the original one? | [1] Before | ||||||||||||||||
| [2] Now | |||||||||||||||||
| [3] The same | |||||||||||||||||
| C30 Does the house you live in have the following facilities? | [1] Yes | Facility item Before moving After moving | |||||||||||||||
| [2] No | C30.1 Separate kitchen | ||||||||||||||||
| [3] Not applicable | C30.2 Separate bathroom/toilet | ||||||||||||||||
| C30.3 Shower facilities | |||||||||||||||||
| C30.4 Electricity | |||||||||||||||||
| C30.5 Running water | |||||||||||||||||
| C30.6 Cable TV | |||||||||||||||||
| C30.7 Broadband Internet | |||||||||||||||||
| C30.8 Drainage | |||||||||||||||||
| C30.9 Liquefied piped gas | |||||||||||||||||
| C30.10 Air conditioning/heating equipment | |||||||||||||||||
| D Community Environment | |||||||||||||||||
| D01 How far is your home from the market town ______Km? | |||||||||||||||||
| D02 How far is your home from the county town ______Km? | |||||||||||||||||
| D03 How far is your home from the railway station ______Km? | |||||||||||||||||
| D04 Are any of the following facilities within a 10-min walk of your home? | [1] Yes | Facility Item Before Relocation After Relocation | |||||||||||||||
| [2] No | D04.1 Hospital/health room | ||||||||||||||||
| [3] Not applicable | D04.2 Supermarket/mall | ||||||||||||||||
| D04.3 Kindergarten | |||||||||||||||||
| D04.4 Elementary school | |||||||||||||||||
| D04.6 Senior Activity Room | |||||||||||||||||
| D04.5 Park | |||||||||||||||||
| D04.7 Highway | |||||||||||||||||
| D04.8 Bus stops | |||||||||||||||||
| D05 How is the convenience of traveling in your home before and after moving? | [1] More convenient than before relocation | ||||||||||||||||
| [2] More difficult than before relocation | |||||||||||||||||
| [3] About the same as before relocation | |||||||||||||||||
| D06 How did the distance between your home and the production site change before and after the relocation? | [1] Closer than before the relocation | ||||||||||||||||
| [2] Farther than before the relocation | |||||||||||||||||
| [3] About the same as before the relocation | |||||||||||||||||
| D07 Do you agree with the following statements about neighborhood relations in the community? | [1] Strongly disagree | Statements Before relocation After relocation | |||||||||||||||
| [2] Disagree | D07.1 If problems occur in the community, community residents can get together to deal with them together | ||||||||||||||||
| [3] Generally agree | D07.2 In the community, people are willing to help each other | ||||||||||||||||
| [4] Agree | D07.3 If I have to go away someday, I can count on other people in the community to help me collect packages, registered mail, newspapers, etc. | ||||||||||||||||
| [5] Strongly agree | D07.4 People in the community who know each other generally get along well with each other | ||||||||||||||||
| D07.5 People in the community have very different views and opinions about what is happening in the community | |||||||||||||||||
| D07.6 People in the community basically know each other | |||||||||||||||||
| D08 Do you trust the following organizations and people? | [1] Very distrustful | Institutions and people Before moving After moving | |||||||||||||||
| [2] Not very trusting | D08.1 Resident committee | ||||||||||||||||
| [3] Generally | D08.2 Village committee/collective economic development company | ||||||||||||||||
| [4] More trusting | D08.3 Street office | ||||||||||||||||
| [5] Very trusting | D08.4 Community neighbors | ||||||||||||||||
| [6] Not applicable | |||||||||||||||||
| D09 How often do you participate in community activities? | [1] Never participate | ||||||||||||||||
| [2] Rarely participate | |||||||||||||||||
| [3] Sometimes participate | |||||||||||||||||
| [4] Often participate | |||||||||||||||||
| [5] Always participate | |||||||||||||||||
| E Community Satisfaction | |||||||||||||||||
| E01 How satisfied are you with the housing, community facilities and services in the community where you currently live?[Note to surveyors]: [99998] The “Not applicable” option means that the respondent does not have this facility or service in the community where he/she lives | |||||||||||||||||
| Item | Very Satisfied | Satisfied | Fairly Unsatisfied | Very Unsatisfied | Not Applicable | ||||||||||||
| E01.1 Type of housing | 5 | 4 | 3 | 2 | 1 | 99998 | |||||||||||
| E01.2 Housing structure | 5 | 4 | 3 | 2 | 1 | 99998 | |||||||||||
| E01.3 Housing area | 5 | 4 | 2 | 1 | 99998 | ||||||||||||
| E01.4 Housing support | 5 | 4 | 3 | 2 | 1 | 99998 | |||||||||||
| E01.5 Housing quality | 5 | 4 | 3 | 2 | 1 | 99998 | |||||||||||
| E01.6 Neighborhood relations | 5 | 4 | 3 | 2 | 1 | 99998 | |||||||||||
| E01.7 Community integration | 5 | 4 | 3 | 2 | 1 | 99998 | |||||||||||
| E01.8 Community services | 5 | 4 | 3 | 2 | 1 | 99998 | |||||||||||
| E01.9 School childcare | 5 | 4 | 3 | 2 | 1 | 99998 | |||||||||||
| E01.10 Shopping and commercial facilities | 5 | 4 | 3 | 2 | 1 | 99998 | |||||||||||
| E01.11 Transportation conditions | 5 | 4 | 3 | 2 | 1 | 99998 | |||||||||||
| E01.12 Community security | 5 | 4 | 3 | 2 | 1 | 99998 | |||||||||||
| E01.13 Health conditions | 5 | 4 | 3 | 2 | 1 | 99998 | |||||||||||
| E01.14 Recreational facilities | 5 | 4 | 3 | 2 | 1 | 99998 | |||||||||||
| E01.15 Community greening | 5 | 4 | 3 | 2 | 1 | 99998 | |||||||||||
| E01.16 Property management | 5 | 4 | 3 | 2 | 1 | 99998 | |||||||||||
| E01.17 Overall satisfaction with the | 5 | 4 | 3 | 2 | 1 | 99998 | |||||||||||
| F Happiness | |||||||||||||||||
| F01 Do you think your current life is happy? | [1] Very unhappy | ||||||||||||||||
| [2] Less happy | |||||||||||||||||
| [3] Not sure * | |||||||||||||||||
| [4] Happier | |||||||||||||||||
| [5] Very happy | |||||||||||||||||
| F02 Do you agree with the following statements about your satisfaction with your life situation? (Please check the corresponding box). | Life situation | ||||||||||||||||
| F02.1 My life is close to my ideal in most ways | 7 | 6 | 5 | 4 | 3 | 2 | 1 | ||||||||||
| F02.2 My living conditions are good | 7 | 6 | 5 | 4 | 3 | 2 | 1 | ||||||||||
| F02.3 I am satisfied with my life | 7 | 6 | 5 | 4 | 3 | 2 | 1 | ||||||||||
| F02.4 So far, I have gotten the important things I wanted in | 7 | 6 | 5 | 4 | 3 | 2 | 1 | ||||||||||
| F02.5 If I could live again, I would basically not change anything | 7 | 6 | 5 | 4 | 3 | 2 | 1 | ||||||||||
References
- Zhou, H.J.; Sun, Y.H. Policy response to disaster-induced migration in a changing climate: Adjustment of disaster-induced migration policies based on ‘regional conference on policy response to climate-induced migration in Asia and pacific’. Adv. Earth Sci. 2012, 27, 573–580. [Google Scholar]
- Zhou, Y.Y.; Yang, S.Y. Evaluation of social adaptation of post-disaster migrants: A survey based on Beichuan and other places. J. Northwest Agri. For. Univ. of Sci. Tech. 2016, 16, 81–86. [Google Scholar]
- Wang, H.X. Survey of life satisfaction of geological disaster-induced migrants: Exemplified by Kaiyang phosphate mine, Guiyang. New West. 2016, 11, 30–31. [Google Scholar]
- Yin, H.Z.; Su, Q.; Huang, X.T. Content analysis of ten years of domestic research on subjective well-being. J. Southwest Univ. 2012, 38, 100–105. [Google Scholar]
- Lu, Y.X.; Zhao, Y.D. Analysis of motivational mechanism of households, communities and governments in post-disaster housing reconstruction. J. Southeast Univ. 2018, 20, 100–106. [Google Scholar]
- Wang, Z.M.; Yan, S.J. A Review of Subjective Well-Being Theory. Available online: https://gsds.nwnu.edu.cn/DocView/IndexNew?fid=5.3.&filename=JJLT201709034 (accessed on 21 July 2021).
- Diener, E. Subjective well-being. Psychol. Bull. 1984, 95, 542–575. [Google Scholar] [CrossRef] [PubMed]
- Wu, N.; Dai, J.M. Overview of residents’ subjective well-being and its influencing factors. Health Edu. Health Pro. 2019, 14, 48–52. [Google Scholar]
- Miao, Y.J.; Zhu, X.H.; Chen, H.B. From theory to measurement—The development of psychological structure of happiness research. J. Xuzhou Norm. Univ. 2009, 35, 128–133. [Google Scholar]
- Andrews, F.M.; Wither, S.B. Social Indicators of Well-Being; Plenum Press: New York, NY, USA, 1976. [Google Scholar]
- Liu, R.G.; Gong, Y.X. Memorial University of Newfoundland scale of happiness. Chin. J. Clin. Psychol. 1999, 2, 44–45. [Google Scholar]
- Xing, Z.J. Review of SWB measure study. Psychol. Sci. 2002, 25, 336–338. [Google Scholar]
- Liu, J.Q.; Xiong, M.L.; Su, Y. Gross National Happiness in Times of Economic Growth: Follow-Up Study Based on CGSS Data. China Soc. Sci. 2012, 12, 82–102. [Google Scholar]
- Williams, K. Has the future of marriage arrived? A contemporary examination of gender, marriage, and psychological well-being. J. Health Soc. Behav. 2003, 44, 470–487. [Google Scholar] [CrossRef]
- Sun, F. Gender, occupation, and SWB. Econ. Sci. 2007, 1, 95–106. [Google Scholar]
- Fortin, N.; Helliwell, J.F.; Wang, S. How does subjective well-being vary around the world by gender and age. World Happiness Rep. 2015, 9, 42–75. [Google Scholar]
- Wang, Q.; Xing, Z.J. Preliminary Study of the Relationship between Age and SWB of Urban Residents. Stud. Pract. 2008, 6, 85–91. [Google Scholar]
- Chen, W. How education enhances happiness: Comparison of mediating factors in four East Asian countries. Soc. Indic. Res. 2012, 106, 117–131. [Google Scholar] [CrossRef]
- Liu, M.X.; Wang, X.H.; Wang, Z.Z. Statistical test of the Impact of Education level on the happiness index. Stat. Decis. 2013, 24, 4–8. [Google Scholar]
- Bukenya, J.O.; Gebremedhin, T.G.; Schaeffer, P.V. Analysis of quality of life and Rural Development: Evidence from West Virginia data. Growth Change 2003, 34, 202–218. [Google Scholar] [CrossRef]
- Xing, Z.J. Study of the relationship between resident income and happiness in China. J. Sociol. Stud. 2011, 25, 196–219 + 245–246. [Google Scholar]
- Haring, H.M.; Stock, W.A.; Okun, M.A.; Witter, R.A. Marital status and subjective well-being: A research synthesis. J. Marriage Fam. 1985, 47, 947–953. [Google Scholar] [CrossRef]
- Chen, L.; Wang, W.H. Gender, marriage, and SWB. Theor. Horiz. 2013, 12, 74–79. [Google Scholar]
- Gerdtham, U.; Johannesson, M. The relationship between happiness, health, and socio-economic factors: Results based on Swedish microdata. J. Socio Econ. 2001, 30, 553–557. [Google Scholar] [CrossRef]
- Lan, J.J.; Liu, T.T. A study on the relationship among disability attitude, mental health, and subjective well-being of persons with disabilities. Disabil. Stud. 2018, 2, 86–91. [Google Scholar]
- Hou, D.Q. Study of the Relationship between Working Women’s Role Attitude, Work-Family Balance and Subjective Well-Being; Xiamen University: Xiamen, China, 2008. [Google Scholar]
- Guo, J.P.; Shi, G.Q. Study of Resettlement Mode for Rural Earthquake-Induced Migrants; Science Press: Beijing, China, 2017. [Google Scholar]
- He, J.P. Housing reconstruction problem and innovation in relief mechanism after the Wenchuan earthquake. J. Yunnan Norm. Univ. 2008, 6, 60–66. [Google Scholar]
- Kingston, P.; Fries, J. Having a stake in the system: The sociopolitical ramifications of business and homeownership. Soc. Sci. Q. 1994, 75, 679–686. [Google Scholar]
- Zumbro, T. The relationship between homeownership and life satisfaction in Germany. Hous. Stud. 2014, 29, 319–338. [Google Scholar] [CrossRef]
- Rudolf, R.; Potter, C. Housing and happiness: Subjective well−being and residential environment in Korea. jkpa 2015, 50, 50–55. [Google Scholar] [CrossRef][Green Version]
- Lin, J.; Zhou, S.J.; Wei, W.Q. Urban housing price, housing ownership and subjective well-being. Fin. Trade Econ. 2012, 5, 114–120. [Google Scholar]
- Li, T.; Shi, Y.P.; Chen, B.K. Housing and happiness: Housing problem of Chinese urban residents from the perspective of happiness economics. Econ. Res. J. 2011, 46, 69–82. [Google Scholar]
- Ning, L.Y. Influence of urban residents’ living space on their subjective well-being: Empirical study based on the CGSS data of 2010. Lineage 2015, 8, 120–123. [Google Scholar]
- Xia, B. Housing Ownership, Housing Price, and Urban Residents’ Happiness: Empirical Study based on the CGSS (2005) and CEIC (2005) Data; Southwestern University of Finance and Economics: Chengdu, China, 2005. [Google Scholar]
- Wang, D. Analysis of the impact of housing imbalance on residents’ happiness. Econ. Rev. 2020, 5, 121–128. [Google Scholar]
- Yin, L.L.; Mao, J.Q. Exploring the factors that significantly affect residents’ subjective well-being in housing issues-an empirical analysis based on CGSS2015. J. Shanghai Inst. Econ. Manag. 2020, 18, 13–21. [Google Scholar]
- Easterlin, R.A. Explaining happiness. Proc. Natl Acad. Sci. USA 2003, 100, 11176–11183. [Google Scholar] [CrossRef] [PubMed]
- Wilson, W. Correlates of avowed happiness. Psy. Bull. 1967, 67, 294–306. [Google Scholar] [CrossRef] [PubMed]
- Robinson, J.P.; Shaver, P.R. Measures of social psychological attitudes. Cont. Soc. 1976, 5, 507. [Google Scholar]
- Diener, E.; Suh, E.M.; Lucas, R.E. Subjective Well-Being: Three Decades of Progress. Psy. Bull. 1999, 125, 276–302. [Google Scholar] [CrossRef]
- Gao, Y.Z.; Wu, T.; Xiao, C.B. Analysis of Earthquake Disaster Characteristics and Aseismic Capacity of Sichuan’s Rural Housing. Sichuan Build. Sci. 2009, 35, 136–140. [Google Scholar]


| Administrative Region | Resettlement Point | Frequency | Percentage | Cumulative Percentage |
|---|---|---|---|---|
| Sheyang County | Chenyang Community | 18 | 7.03% | 7.03% |
| Wufen | 8 | 3.13% | 10.16% | |
| Xinhong | 6 | 2.34% | 12.50% | |
| Funing County | Lixin | 30 | 11.72% | 24.22% |
| Dalou | 30 | 11.72% | 35.94% | |
| Nanwan | 11 | 4.30% | 40.24% | |
| Chengjun | 20 | 7.81% | 48.05% | |
| Xintu | 29 | 11.33% | 59.38% | |
| Danping | 5 | 1.95% | 61.33% | |
| Chenliang | 7 | 2.73% | 64.06% | |
| Jiqiao | 28 | 10.94% | 75.00% | |
| Shuangqiao | 7 | 2.73% | 77.73% | |
| Dongcui | 5 | 1.95% | 79.68% | |
| Qiqiao | 11 | 4.30% | 83.98% | |
| Zhengzhu | 10 | 3.91% | 87.89% | |
| Kongdang | 21 | 8.20% | 96.09% | |
| Shaozhan | 10 | 3.91% | 100.00% |
| Variable Name | Variable Value | ||
|---|---|---|---|
| Explained variable | Variable category | SWB | 1 = very unhappy; 2 = fairly unhappy; 3 = not sure; 4 = fairly happy; 5 = very happy |
| Explanatory variable | Resettlement housing conditions | Housing allocation mode | 1 = very bad; 2 = fairly bad; 3 = average; 4 = fairly good; 5 = very good |
| Housing expenditure | 1 = 0; 2 = 0 to 20,000; 3 = 20,000 to 40,000; 4 = 40,000 to 60,000; 5 = more than 60,000 (unit: yuan) | ||
| Housing quality | 1 = very bad; 2 = fairly bad; 3 = average; 4 = fairly good; 5 = very good | ||
| Living space | 1 = 30 m2; 2 = 70 m2; 3 = 90 m2; 4 = 100 m2; 5 = 120 m2; 6 = 140 m2 | ||
| Resettlement community environment | Community facilities | 1 to 8: indicating the existing quantity of various types of facilities | |
| Community hygiene | 1 = very dirty; 2 = fairly dirty; 3 = average; 4 = fairly clean; 5 = very clean | ||
| Community participation | 1 = never participate; 2 = seldom participate; 3 = sometimes participate; 4 = often participate; 5 = always participate | ||
| Cadre–mass relationship | 1 = distrust very much; 2 = fairly distrust; 3 = averagely; 4 = fairly trust; 5 = trust very much | ||
| Control variable | Individual and household | Gender | 1 = male; 0 = female |
| Age | 1 = 29 or below; 2 = 30 to 44; 3 = 45 to 59; 4 = 60 or above | ||
| Education level | 1 = primary school level or below; 2 = junior middle school level; 3 = senior middle school level; 4 = technical secondary school level or above | ||
| Health status | 1 = very unhealthy; 2 = fairly unhealthy; 3 = averagely; 4 = fairly healthy; 5 = very healthy | ||
| Marriage status | 1 = married; 0 = unmarried | ||
| Annual household income | 1 = less than 10,000; 2 = 10,000 to 20,000; 3 = 20,000 to 30,000; 4 = 30,000 to 40,000; 5 = more than 40,000 (yuan) |
| Type | Option | Number | Percentage | Type | Option | Number | Percentage |
|---|---|---|---|---|---|---|---|
| Gender | Male | 156 | 60.94% | Health status | Very unhealthy | 2 | 0.78% |
| Female | 100 | 39.06% | Fairly unhealthy | 26 | 10.16% | ||
| Age | 29 or below | 2 | 0.78% | Average | 86 | 33.59% | |
| 30 to 44 | 18 | 7.03% | Fairly healthy | 128 | 50% | ||
| 45 to 59 | 109 | 42.58% | Very healthy | 14 | 5.47% | ||
| 60 or above | 127 | 49.61% | Marriage status | Married | 226 | 88.28% | |
| Education level | Unmarried | 30 | 11.72% | ||||
| Primary school level or below | 140 | 54.69% | Annual household income | Less than CNY 10,000 | 65 | 25.39% | |
| Junior middle school level | 98 | 38.28% | CNY 10,000 to 20,000 | 67 | 26.18% | ||
| Senior middle school level | 16 | 6.25% | CNY 20,000 to 30,000 | 85 | 33.20% | ||
| Technical secondary school level or above | 2 | 0.78 | CNY 30,000 to 40,000 | 36 | 14.06% | ||
| More than CNY 40,000 | 3 | 1.17% |
| Meaning | Variable Name | Sample Size | Mean | Standard Deviation | Maximum | Minimum |
|---|---|---|---|---|---|---|
| SWB | Happiness | 256 | 3.24 | 1.02 | 5 | 1 |
| Variable Type | Variables | Covariance Statistics | |
|---|---|---|---|
| Tolerance | VIF | ||
| Explanatory variables | housing allocation mode | 0.628 | 1.593 |
| housing expenditure | 0.305 | 3.283 | |
| housing quality | 0.439 | 2.275 | |
| living space | 0.247 | 4.044 | |
| community facilities | 0.727 | 1.376 | |
| community hygiene | 0.520 | 1.924 | |
| community participation | 0.563 | 1.775 | |
| cadre–mass relationship | 0.408 | 2.451 | |
| Control variables | gender | 0.758 | 1.319 |
| age | 0.371 | 2.692 | |
| education level | 0.630 | 1.588 | |
| health | 0.610 | 1.640 | |
| marriage status | 0.482 | 2.073 | |
| household annual income | 0.294 | 3.403 | |
| Fitting Information | Parallel Line Test | |||
|---|---|---|---|---|
| Cut-off points | Final | Null Hypothesis | Generalised | |
| −2 log likelihood | 691.217 | 330.915 | 330.915 | 275.604 |
| Chi-square | 360.302 | 55.311 | ||
| p-value | 0.000 | 0.884 | ||
| Fitting Information | Parallel Line Test | |||
|---|---|---|---|---|
| Cut-off points | Final | Null Hypothesis | Generalised | |
| −2 log likelihood | 690.585 | 362.646 | 362.646 | 312.532 |
| Chi-square | 327.939 | 50.115 | ||
| p-value | 0.000 | 0.815 | ||
| Fitting Information | Parallel Line Test | |||
|---|---|---|---|---|
| Cut-off points | Final | Null Hypothesis | Generalised | |
| −2 log likelihood | 722.941 | 276.783 | 276.783 | 275.057 |
| Chi-square | 446.158 | 1.726 | ||
| p-value | 0.000 | 1.000 | ||
| Model 1 | Model 2 | Model 3 | |||||
|---|---|---|---|---|---|---|---|
| Variable (reference group) | Beta Regression Coefficient | Odds Ratio Value | Beta Regression Coefficient | Odds Ratio Value | Beta Regression Coefficient | Odds Ratio Value | |
| Very bad | −2.833 ** | 0.059 | −3.169 ** | 0.042 | |||
| Housing allocation mode | Fairly bad | −2.468 *** | 0.085 | −2.477 ** | 0.084 | ||
| (very good) | Average | −1.934 *** | 0.145 | −1.943 ** | 0.143 | ||
| Fairly good | −2.211 *** | 0.110 | −1.793 ** | 0.166 | |||
| 0 | 4.166 ** | 64.457 | 3.919 * | 50.350 | |||
| Housing expenditure | CNY 0 to 20,000 | 3.160 ** | 23.571 | 3.196 * | 24.435 | ||
| (more than CNY 60,000) | CNY 20,000 to 40,000 | 2.326 ** | 10.237 | 2.217 * | 9.180 | ||
| CNY 40,000 to 60,000 | 1.173 | 3.232 | 0.836 | 2.307 | |||
| Very bad | −11.816 *** | 0.000 | −10.395 *** | 0.000 | |||
| Housing quality | Fairly bad | −9.860 *** | 0.000 | −9.070 *** | 0.000 | ||
| (very good) | Average | −7.292 *** | 0.001 | −6.821 *** | 0.001 | ||
| Fairly good | −4.733 *** | 0.009 | −4.412 * | 0.012 | |||
| 30 m2 | −9.079 *** | 0.000 | −6.525 ** | 0.001 | |||
| Living space | 70 m2 | −3.845 *** | 0.021 | −3.231 ** | 0.040 | ||
| (140 m2) | 90 m2 | −3.318 *** | 0.036 | −3.391 *** | 0.034 | ||
| 100 m2 | −2.308 ** | 0.099 | −2.114 * | 0.121 | |||
| 120 m2 | −1.130 | 0.323 | −0.691 | 0.501 | |||
| Community facilities | 3 | 0.542 | 1.719 | 1.469 | 4.345 | ||
| (6) | 4 | −0.235 | 0.791 | 0.174 | 1.190 | ||
| 5 | 1.139 * | 3.124 | 1.574 * | 4.826 | |||
| Very dirty | −2.751 | 0.064 | 0.338 | 1.402 | |||
| Community hygiene | Fairly dirty | −4.374 *** | 0.013 | −2.029 | 0.131 | ||
| (very clean) | Average | −3.821 *** | 0.022 | −1.538 | 0.215 | ||
| Fairly clean | −2.021 * | 0.133 | 0.226 | 1.254 | |||
| Community participation | Seldom participate | −1.676 | 0.187 | −2.969 | 0.051 | ||
| (always participate) | Sometimes participate | −2.342 | 0.096 | −2.104 | 0.122 | ||
| Often participate | −2.501 * | 0.082 | −2.644 | 0.071 | |||
| Distrust very much | −22.597 *** | 0.000 | −18.338 *** | 0.000 | |||
| Cadre–mass relationship | Fairly distrust | −20.023 *** | 0.000 | −16.294 *** | 0.000 | ||
| (trust very much) | Average | −17.814 *** | 0.000 | −14.743 *** | 0.000 | ||
| Fairly trust | −14.851 *** | 0.000 | −11.346 *** | 0.000 | |||
| Pseudo R2 | 0.803 | 0.768 | 0.877 | ||||
Publisher’s Note: MDPI stays neutral with regard to jurisdictional claims in published maps and institutional affiliations. |
© 2021 by the authors. Licensee MDPI, Basel, Switzerland. This article is an open access article distributed under the terms and conditions of the Creative Commons Attribution (CC BY) license (https://creativecommons.org/licenses/by/4.0/).
Share and Cite
Li, Y.; Feng, X. Influence of Housing Resettlement on the Subjective Well-Being of Disaster-Forced Migrants: An Empirical Study in Yancheng City. Sustainability 2021, 13, 8171. https://doi.org/10.3390/su13158171
Li Y, Feng X. Influence of Housing Resettlement on the Subjective Well-Being of Disaster-Forced Migrants: An Empirical Study in Yancheng City. Sustainability. 2021; 13(15):8171. https://doi.org/10.3390/su13158171
Chicago/Turabian StyleLi, Yi, and Xuanfeng Feng. 2021. "Influence of Housing Resettlement on the Subjective Well-Being of Disaster-Forced Migrants: An Empirical Study in Yancheng City" Sustainability 13, no. 15: 8171. https://doi.org/10.3390/su13158171
APA StyleLi, Y., & Feng, X. (2021). Influence of Housing Resettlement on the Subjective Well-Being of Disaster-Forced Migrants: An Empirical Study in Yancheng City. Sustainability, 13(15), 8171. https://doi.org/10.3390/su13158171