1. Introduction
In February of 2020, the COVID-19 pandemic began to spread throughout Germany. By 9 March, infection rates were rising exponentially and the first deaths were being reported [
1]. On 13 March 2020, the University of Oldenburg (Germany) suspended all in-person lectures, which, as of the time of this research, have yet to resume in-person. In general, the COVID-19 pandemic has been shown to be associated with decreased greenhouse gas (GHG) emissions globally, with a recent study finding an 8.8% decrease in CO
2 emissions globally in the first six months of 2020 relative to the first six months of 2019 [
2]. The same study found a 13.0% decrease in emissions from ground transportation in July 2020 relative to July 2019.
Furthermore, Le Quéré et al. [
3] estimated that global emissions from surface transport fell by 36% by 7 April 2020 relative to the mean level of emissions in 2019 and this sector made the largest contribution to the total estimated global emissions reduction for the same period (−43%). The same research indicated that CO
2 emissions related to the aviation sector declined by 60%, which yielded the largest relative anomaly of any sector. Considering the two studies presented, one would expect a corresponding decrease in emissions in the mobility sector at the University of Oldenburg during the COVID-19 pandemic.
In addition to correlating with the usage of non-renewable resources, GHG emissions can significantly reduce and degrade human well-being [
4]. Emissions have substantial health impacts, which can have synergistic effects with pre-existing conditions or newly arising conditions (such as those seen during a pandemic). Recent research has found that “air pollution leads to almost 250,000 premature deaths a year in the US”, and “aggressive decarbonization … could save around 1.4 million American lives that would otherwise be lost to air quality” [
3]. Further, the same research found that “when you look at the [new] studies, you find that air pollution seems to affect almost every organ in the human body”. It is imperative that emissions be rapidly reduced for the sake of a sustainable future and the well-being of life on Earth.
The objective of this research is twofold: (i) to analyze the order of magnitude of GHG emissions related to mobility—including business trips and commuting—at the University of Oldenburg (UOL) and (ii) to give insight on the impact of possible measures for reducing those emissions. For these aims, the mobility-related emissions are analyzed prior to the COVID-19 pandemic and during it, representing the status quo and a very extreme situation. Further, several scenarios based on different measures aiming at emissions decreases are proposed and analyzed to encourage long-term decreases in the university’s emissions output.
Organizations worldwide have begun quantifying emissions in all aspects of operations, including universities. In one 2006 paper, the potential energy and emissions impact of print-based distance learning, online-based distance learning (“e-learning”), and part-time courses were analyzed for 20 courses in the United Kingdom. With respect to traveling to the university for classes, the researchers found that emissions were reduced by 47% for part-time students compared to full-time students, and the travel-related emissions of distance-learning students were only 11% that of full-time students [
5].
In another study focusing on the emissions of one university in Chile, 26% of the students were interviewed to obtain data on their mobility habits, with the researchers finding that 62% of the total emissions related to the university can be attributed to student commutes. The researchers additionally analyzed proposals for changing commuting behaviors, predicting that emissions could be reduced by 7% if students who live within 3 km of campus replaced motorized vehicles with bicycles for the warmer two-thirds of the year [
6]. Additionally, other higher education institutions have concentrated their efforts in analyzing the lifestyle behavior of students in terms of carbon emissions, such as the case of the University of Applied Science in Konstanz, Germany. In the emissions estimate based on 10% of the university’s students, the researchers calculated a 10.9 tCO
2e per year footprint, a similar order of magnitude as the German average by 2018 [
7].
Versteijlen et al. [
8] compare online vs. in-person higher education as a measure to reduce carbon emissions, highlighting the major role that students traveling to university represent. Potter and Yarrow [
5] and Caird et al. [
9] compared the GHG emissions of presence-delivered courses and online higher education and found that a reduction of around 85% can be achieved via full online course delivery. Research from Güerca et al. in Mexico [
10] found that 50% of the engineering department’s carbon footprint in 2010 could be attributed to transportation. Within commuting mobility, the researchers found that automobile emissions contributed 98% of the transportation emissions, partially due to the large percentage of the campus population using an automobile to commute (52%). This research further investigated scenarios for emissions reductions, finding that the most effective scenario was one which limited the number of days students commute per week to three, and further involved the use of carpooling rather than individual driving, resulting in a 22% emissions reduction [
10].
A comprehensive review of higher education emissions profiles published in 2013 found that among 135 colleges and universities studied, the mean commuting emissions across all institutions were 17% of the mean total emissions (53 × 1000 mt CO
2e), while the mean air travel emissions were 5% of the mean total emissions. However, there was considerable variation in the commuting and air travel emissions among different types of universities. For example, commuting comprised 43% of total emissions at associate and tribal colleges studied (
n = 38), while commuting comprised only 13% of total emissions at doctorate-granting institutions (
n = 32) [
11].
Such findings shed insight into potential changes that could be encouraged in Oldenburg to help reduce mobility-related emissions. In the past, the University of Oldenburg has commissioned sustainability reports to review the impacts of energy usage, emissions, and other sustainability-related aspects of university operations [
12]. In a 2016 survey by the AStA (student council) with 3826 participants which was cited in the 2017 University Sustainability Report, 72% of respondents indicated they commute by bus, and 27% of participants responded they travel by car. Additionally, 60% of respondents regularly use a bus or train. The report for the University of Oldenburg also investigated business trips, ultimately finding a significant increase of approximately 50% in emissions due to business trips between 2013–2016 [
12].
The present research investigates the current emissions profile of the university to update these prior findings. By understanding the unique effects that the COVID-19 pandemic had on mobility-related emissions, the potential for reducing those emissions can be made evident and the impact of several measures for tackling them can be investigated by constructing relevant scenarios. In the following sections, the methodology to determine mobility emissions related to the University of Oldenburg will be explained, followed by results and discussion of the emissions calculations and emissions resulting from possible future scenarios.
2. Materials and Methods
Versteijlen et al. [
8] discuss the difficulties in obtaining representative and reliable data for exactly quantifying the GHG emissions related to mobility in higher education. While data in reasonable accuracy can be obtained for business trips from conventional university accounting systems, major data quality concerns are related to the estimation of emissions related to commuting. Yet, being that commuting is one of the major contributors to mobility emissions in higher education and one of the fields where university measures can be derived to achieve reductions, it represents one of the major foci of the present research. To address the issue on data accuracy, emissions related to mobility—including both business trips and commuting behavior—are estimated based on a convenient sample from the university population. In consequence, results in the current exploratory work present trends and orders of magnitude attached to the different mobility fields and affiliation groups rather than an accurate quantification of the disaggregated GHG mobility related emissions. With valid responses representing around 2% of the university population and with similar shares of the different affiliation groups (see
Appendix A), while the sample is not representative, it serves as a reasonable basis for first inferences on the GHG mobility emissions. One of the biggest biases in the convenient sample is expected in the students commuting emissions due to the number and nature of students’ responses obtained, being that this affiliation group is one of the most relevant contributors to those emissions. To estimate the role of commuting-related emissions for different affiliation groups within university, the convenient sample obtained was scaled up according to the proportion of different groups in the university population. As a cross validation for business trip-related data, data from the university accounting system for business trips from academic and administrative staff have been used.
The Greenhouse Gas Protocol Corporate Standard (GHG Protocol) [
13] provides the requirements for companies and other institutions quantifying GHG emissions. The GHG Protocol was developed to standardize approaches and principles for reporting and estimating GHG emissions and to provide information to the organizations about effective strategies to manage and reduce GHG emissions. This GHG Protocol classifies emission sources around three scopes: Scope 1 corresponds to direct emissions from sources owned or controlled by the organization; Scope 2 includes indirect emissions from the generation of electricity, heat, or steam that are purchased and consumed by the organization; and Scope 3 accounts for other indirect emissions which are a result of the company activities, but from sources that are not owned or controlled by the organization [
13].
Therefore, the commuting and business trips GHG emissions of the University of Oldenburg are classified in Scope 3 of the GHG Protocol due to the organization not having direct ownership or control over its own transport. Despite this classification, the mobility emissions have a high contribution to the total emissions in universities [
6], [
10].
In this section, the following topics will be explained: emissions factors used for the calculation of GHG emissions (
Section 2.1), survey design methodology (
Section 2.2), survey analysis method (
Section 2.3) and the business trip data from the university and analysis (
Section 2.4).
2.1. Emissions Factors
The GHG emissions of each mode of transport are estimated as follows:
Step 1: define the GHG emission factors for each mode of transport (kg CO2e/km travelled or kg CO2e/passenger kilometer).
Step 2: determine the distance travelled for each mode of transport (km travelled).
Step 3: multiply the distance travelled by the associated emission factor to estimate the emissions in kg CO2e for each mode of transport.
A review of literature was conducted for determining the emissions factors needed to obtain the GHG emissions by each mode of transport.
Table 1 shows the emission factors used for each mode of transport and the corresponding source. The principal source was the Handbook of Emission Factors for Road Transport (HBEFA) [
14], which indicates the specific emissions factors of transport in Germany. Another important source was DEFRA (Department for Environment, Food, and Rural Affairs—Gov. UK) [
15], used when there was not specific information in the HBEFA database, for example, to obtain the emission factors of CH
4 for cars and motorcycles, and the air travel factors considering radiative forcing. The emissions factors for public transport are measured per passenger (g/passenger-km) in the present research. The TREMOD (Transport Emission Model) information [
16] was used for the emissions factors of buses in Germany and the Deutsche Bahn information [
17] for the emissions factors of trains. Finally, for the emissions factors of e-bikes, the data were obtained from TREC (the Transportation Research and Education Center) [
18].
2.2. Survey Design
Since numerous transportation modes are used, collecting comprehensive data on transportation habits associated with the university is difficult. The primary data collection method for this investigation was survey data. This study was designed with specific questions to attempt to characterize respondents’ mobility behavior in the past, as well as collect information about current mobility behavior. The survey includes retrospective questions asking respondents to consider their past behavior during the semesters of summer 2019 and winter 2019 (pre-COVID-19), as well as the current semester at the time of response, summer 2020, to represent the estimate behavior of the COVID-19 pandemic effect. During the entirety of the summer semester 2020 (April 2020–July 2020), the university was closed to on-campus teaching, so this semester is considered throughout this study as characteristic of the COVID-19 pandemic period. Additionally, the survey was distributed in the middle of the semester, when respondents were already familiar with their typical behavior during this online-only semester. Due to this large reliance on retrospective questions pertaining to pre-COVID-19 semesters up to 1 year prior to response, some degree of bias due to recall is expected. To attempt to simplify recall, questions were focused on average behavior (e.g., “How many times per week, on average, did you go to University facilities by automobile?” for respondents who state they use automobiles). Additional potential biases include social desirability effects (e.g., due to respondents wanting to appear more environmentally conscious) [
19].
The main survey questions that were asked can be generally split into two categories: commuting behavior and business trip behavior. The commuting behavior was estimated by asking about the modes of transit used, the typical commute distance in kilometers, and the average number of times per week that respondents commute to the university. If respondents indicated more than one mode of transport used to commute to the university, they were then asked to provide the approximate distance traveled on each trip with each selected mode (e.g., 2 km walking, 5 km by bus). For business trip behavior, respondents were asked to specify if they had attended any conferences and/or business trips (e.g., class excursions, off-campus presentations, etc.) during the specified semesters, as well as the mode of transit and the distance of each trip. The definition of a business trip was any trip related to university obligations, with examples of conferences and field trips/excursions provided. To ease the burden on respondents, instead of a distance for a trip, they could specify a destination, which was then used to calculate an estimated trip distance (see
Section 2.3). If a respondent had taken more than 6 trips, they were asked to provide an average mode of transit used for their trips, as well as an average distance.
The survey was distributed on two campus-wide platforms, to attempt to address a more diverse audience. First, the survey was advertised on a message board open to all students and faculty, and second, it was posted as an announcement on the campus’ main IT platform, which students and faculty use to access courseware, email, and other daily functions. To increase the response rate, the survey was also distributed via word of mouth and email announcements to classes primarily in the sciences college. With respect to sampling bias, it is clear that our survey is not a simple random sample, but rather emphasizes responses from members of the sciences faculty, and the distribution scope is at its broadest bound by the population of university persons who access the announcements page and message board.
Although such targeted distribution ultimately introduces a degree of bias into the sample selection, we attempted to overcome this by collecting demographic information and scaling the data appropriately during analysis. Specifically, the affiliation (student, academic staff, administrative staff, other) of each respondent was collected during the survey to ensure during analysis that the end results are weighted to match the known proportions of each of these demographic groups.
2.3. Analysis of Survey Results
In total, 347 valid responses were received to the mobility survey, representing 1.8% of the overall university population based on statistics from winter semester 2019 and summer semester 2020 [
20]. Responses were considered invalid if the respondent failed to complete both the commuting and business trip sections of the survey.
Table 2 shows the percentage of different groups in our sample and in the whole university population. The university population statistics were directly obtained from the university’s website, using archived versions of the website to determine these values for past semesters [
20,
21].
To calculate individual emissions based on the survey data, the respective commuting and business trip distances for a respondent were multiplied by the appropriate emissions factors in
Table 1. Survey responses in the commuting section indicated weekly distances traveled by various modes of transport, which could then be multiplied by the number of weeks in a semester (16) to arrive at semester values. For respondents who indicated one or more business trips, the emissions associated with the business trips were determined based on the indicated mode of transit and the distance of the trip. Assumptions regarding the interpretation of survey results are further described later in this section.
To estimate the order of magnitude of the carbon emissions of the entire population (all university faculty, staff, and other university-associated persons), the survey data obtained were scaled up based on the appropriate demographic proportions in the sample relative to the population. Equation (1) was used to determine the total emissions estimate, where each demographic
D has a demographic scaling factor (DSF) relating the demographic’s proportion in the population to the demographic’s proportion in the sample and a general scaling factor (GSF) which relates the overall sample size to the population. Within each demographic, these factors are multiplied by the sum of emissions
e from the set of respondents
R in the demographic.
Table 2 illustrates the weighting factors and scaling factors used to scale the commuting data from winter semester 2019 (pre-COVID-19) and summer semester 2020 (COVID-19) data from each demographic group.
Additional tables illustrating the scaling factors for summer semester 2019 for commuting, as well as all scaling factors for business trip data, can be found in
Appendix A.
The survey raw data were organized and processed using Python scripts and Excel spreadsheets. Commuting and business trip information were treated separately to facilitate the separate analyses and the process of identifying outliers. A primary challenge throughout survey design was balancing specificity of the questions, privacy of the respondent, and effort required by the respondent. As a result, some questions did not fully capture the precise details of specific travel arrangements. Therefore, some assumptions were implemented during the analysis.
Commuting:
- ○
If a respondent specified using a car but did not specify the size or fuel type, a small petrol car was assumed.
- ○
If a respondent specified more than 1 mode of transport daily without precisely specifying the distances for each, the total distance was distributed among the mode of transports.
Business Trips:
- ○
If respondents provided their destinations (instead of trip distances), flight connections prior to the arrival at the final destination were assumed as necessary based on the most common flight routes.
- ○
Flights were assumed to start at either Bremen airport or Hamburg airport (the two airports within reasonable distance from the university), based on flight availability at these airports (generally, Bremen airport supports short-distance air travel while Hamburg is a larger international airport).
- ○
For each business trip which included a flight, the use of a train was assumed to go to the airport.
- ○
For each business trip which included a train station, the use of a bus to go to the train station was assumed.
Survey results were analyzed to ultimately determine total distances traveled and the corresponding emissions associated with each semester.
2.4. University Business Trip Data
Complementary to the information acquired by the survey, university business trip data for administrative and academic faculty was provided by the University of Oldenburg. These data correspond to all business trips performed by this demographic group during summer and winter semesters of 2019 (pre-COVID-19) and a partial record of the trips related to summer 2020 (current semester at the time of request). All the information was processed similarly to the survey data, (the same mode of transport division, emissions factors, etc.). Finally, these results were used to validate the outcomes of the survey data analysis in terms of emissions.
3. Results and Discussion
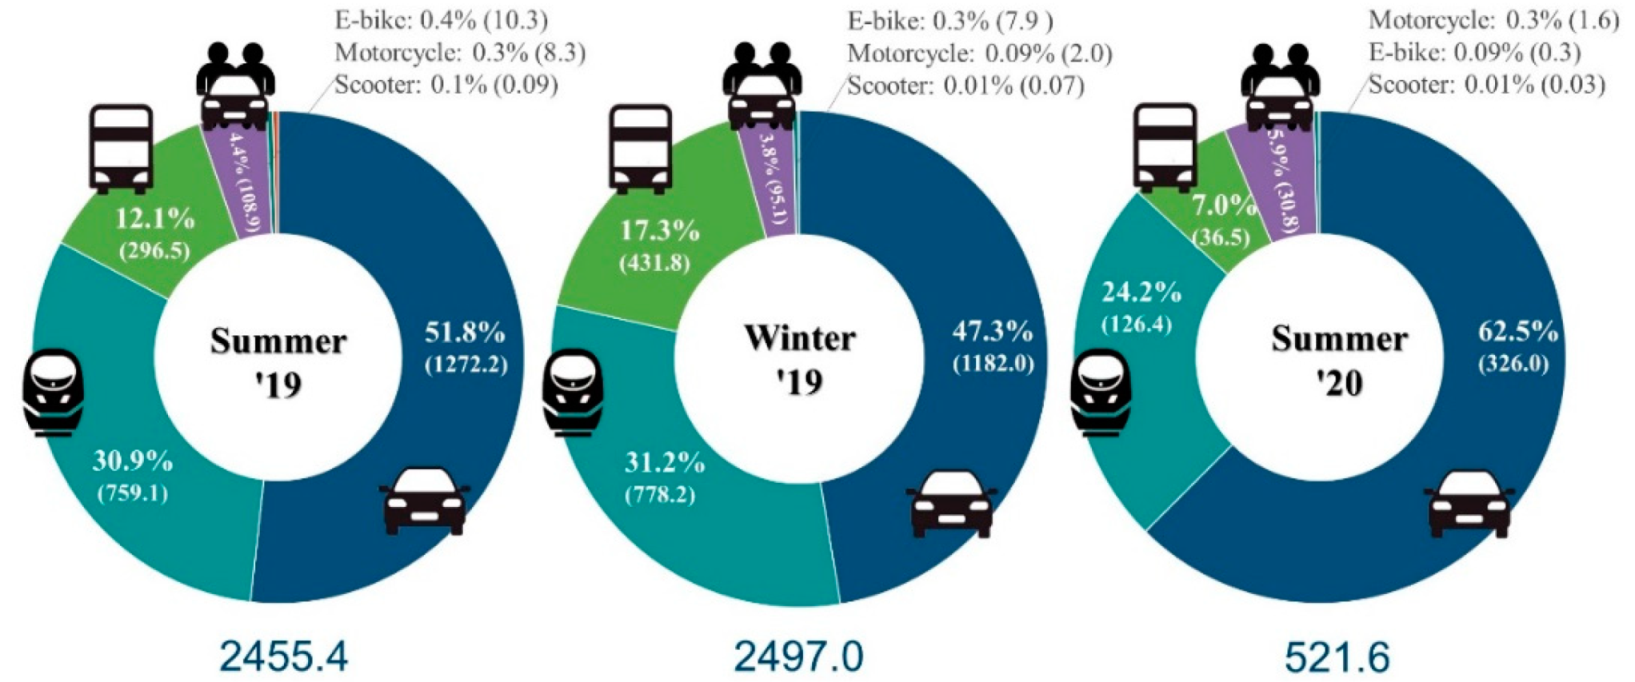
3.1. Commuting Results and Analysis
The estimated commuting-related GHG emissions expressed in terms of tonnes of CO
2e for summer and winter semesters 2019 (pre-COVID-19) and summer semester 2020 (COVID-19) at the University of Oldenburg are presented in
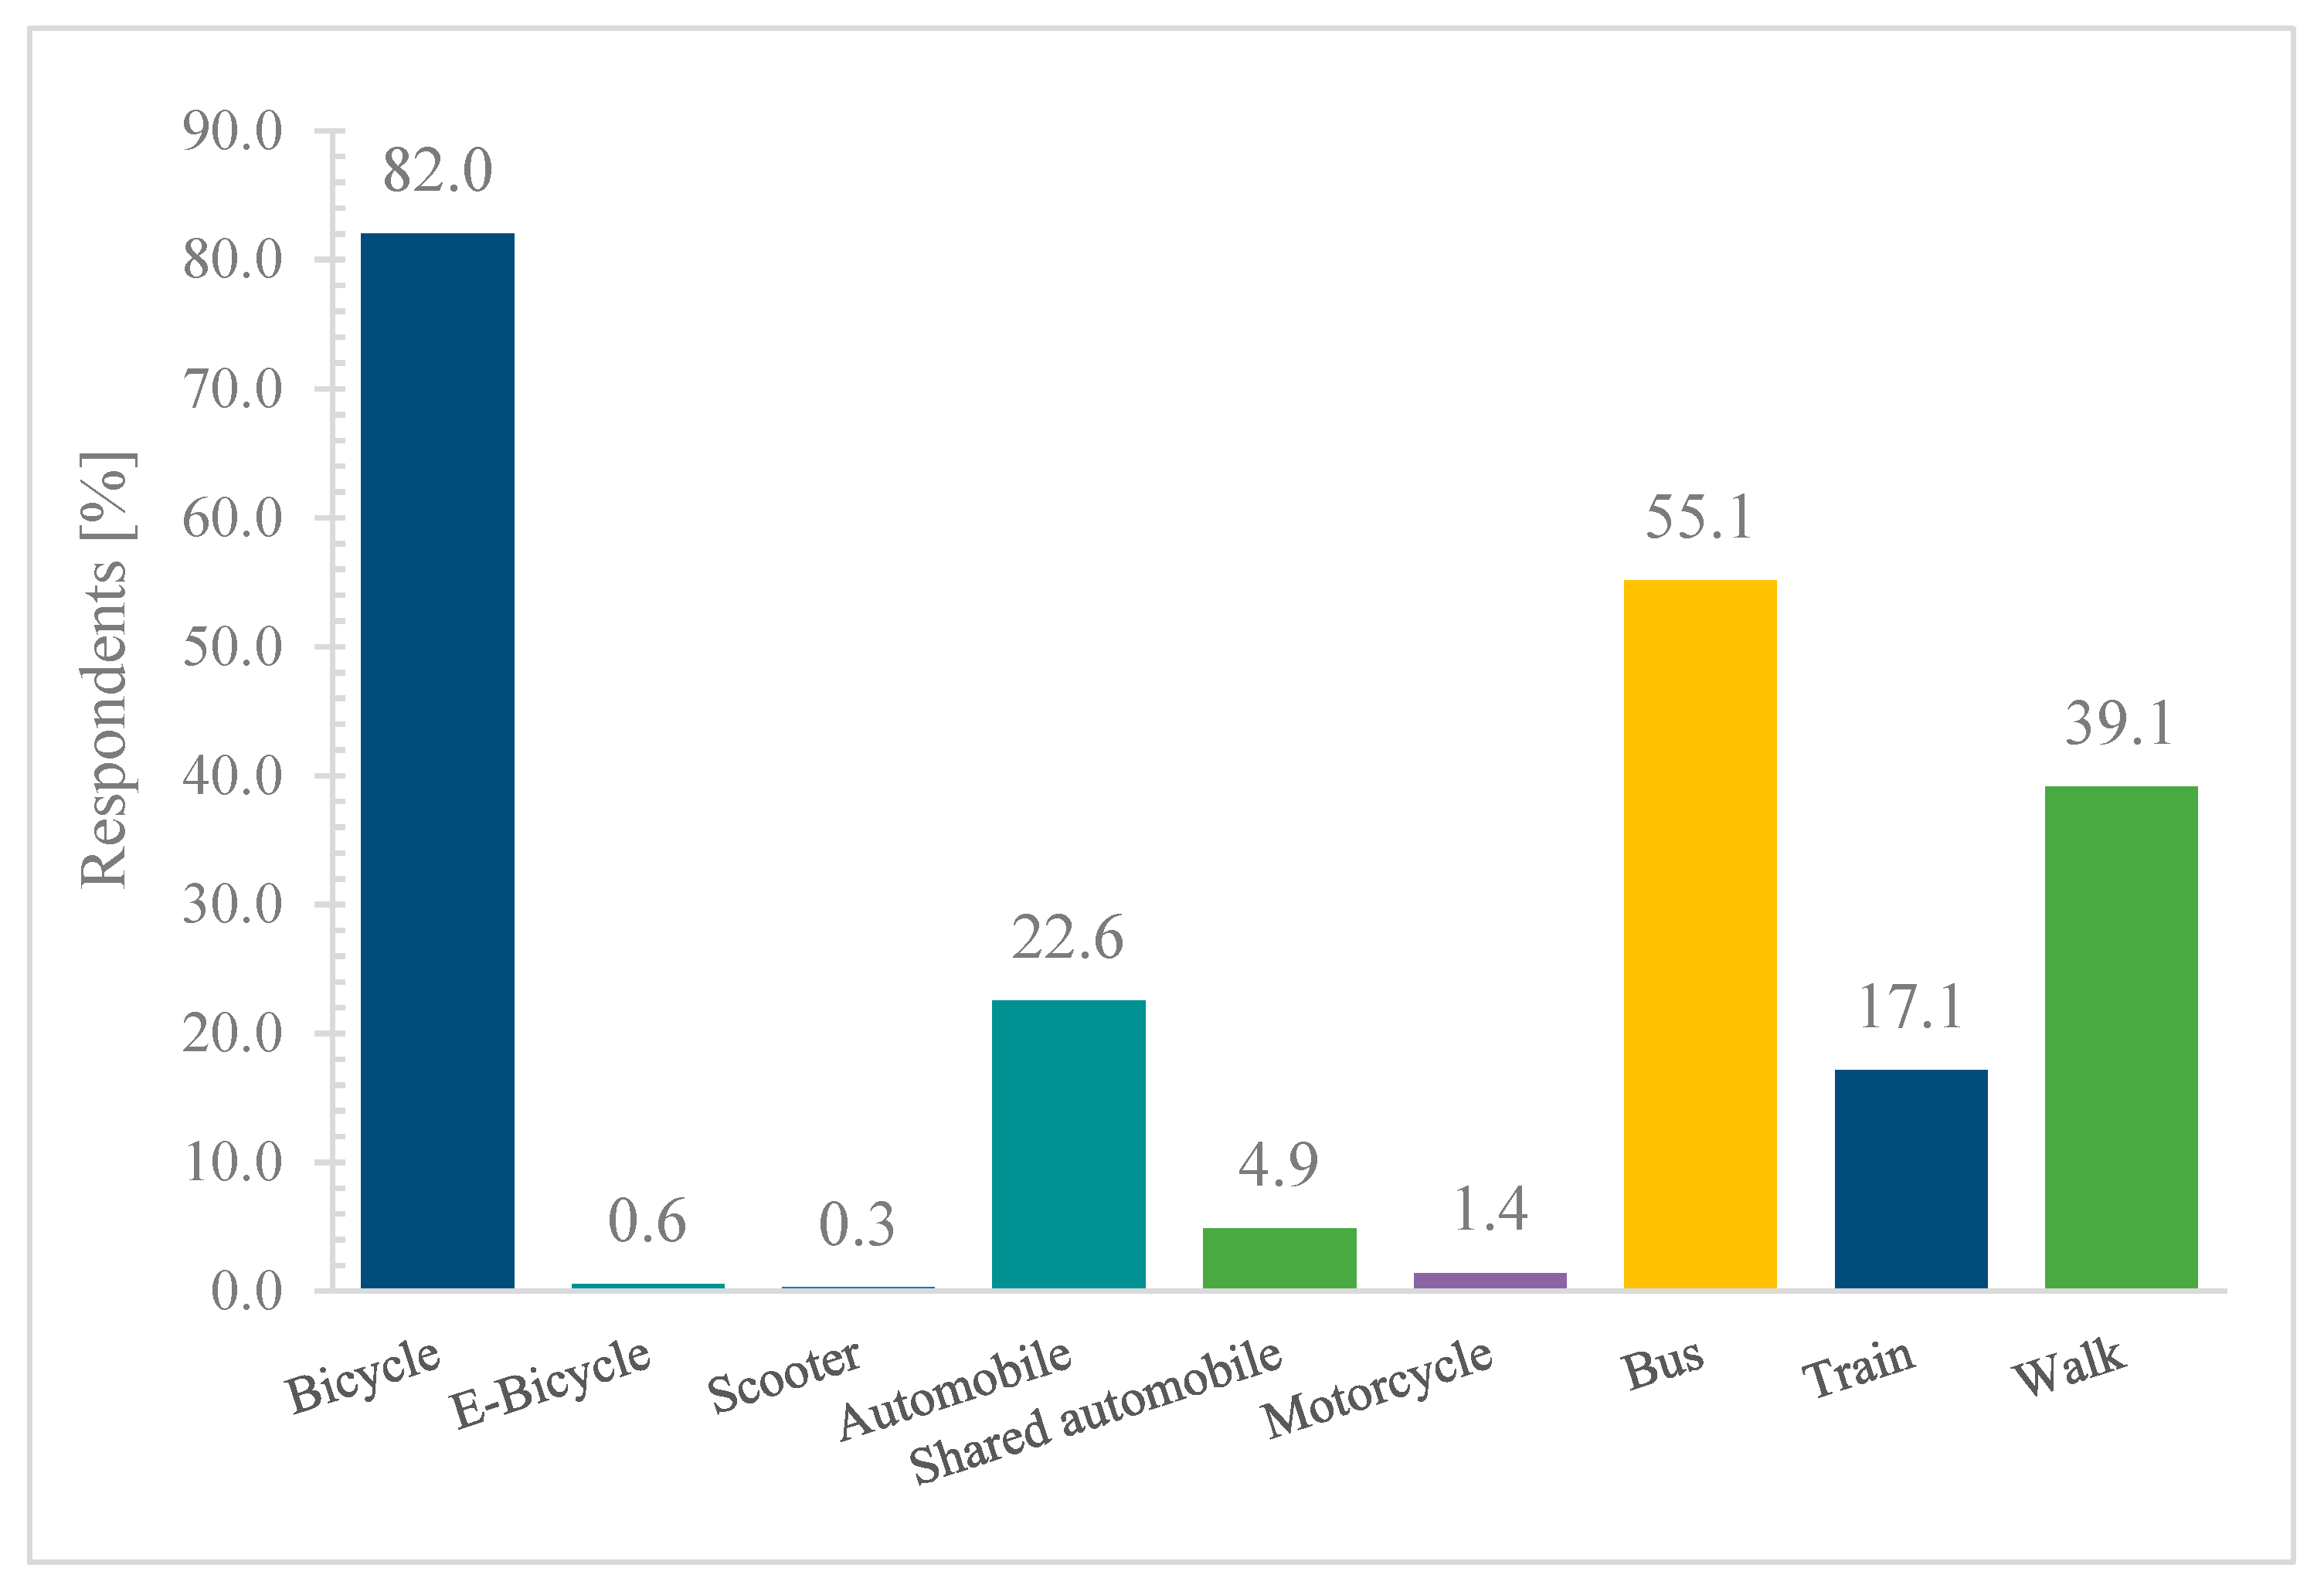
Figure 1. As a general comparison, the mode of transport with the highest share of emissions for all semesters is automobile, followed by train, bus, and then shared car, altogether representing more than 95% of emissions per semester. The analysis shows that the estimated total amount of emissions depends mainly on the total distances covered by each mode of transport. The automobile covered around 40% of the total commuting distances by the scaled-up sample of the university’s community during the summer and winter semesters 2019 individually, and even though bicycles are widely used (
Figure 2), they represent only 3.5% of the total estimated commuting distance.
Comparing only summer semester and winter semester 2019, where the university’s commuting was unaffected by the COVID-19 pandemic, there are some slight differences between the estimated emissions contribution by mode of transport. One possible cause may be the variation of the university’s population among semesters, where the summer semester of 2019 had a population of 18,632 people (considering all affiliations), and a population of 18,986 during winter semester of 2019. On the other hand, it can be expected that students are more likely to change their commuting behavior per semester due to different weather conditions. One example is the increase in the use of buses by 5.2% during the winter semester of 2019 relative to the summer semester of 2019.
The annualized commuting emissions for 2019 could also be expressed as 0.26 tCO
2e per person, or 0.30 tCO
2e per student. These values are lower than in similar research, such as the aforementioned study from the Duquesne University (2019) [
22], where their GHG emissions inventory reported 0.94 tCO
2e per student, per year; another example was reported by the Instituto de Ingeniería at the Universidad Nacional Autónoma de México [
10], where the emissions were 0.66 tCO
2e per student, per year. Additionally, the University of Illinois Chicago (UIC) analyzed GHG emissions reports for 135 colleges and determined the average commuting emissions for several types of institutions [
11]. Based on this study, the scope of associate and tribal colleges had an average emission per full time of enrollment (FTE) of 1.41 tCO
2e per year, and 1.34 tCO
2e per year for the average of all the institutions. One possible reason for the low commuting emissions estimated in this research for the University of Oldenburg compared with other universities could be once again due to the frequent use of bicycles among the community as presented in
Figure 2, where 82% of the population is estimated to use the bicycle as a mode of transport, followed by bus transit and walking. Another consideration is the size of the cities analyzed in the literature (e.g., Mexico City, where the Instituto de Ingeniería at the Universidad Nacional Autónoma de México [
10] is located, is 14.4 times larger [
23] than Oldenburg), which influences the commuter’s behavior and the likelihood of opting for other forms of transport.
Due to the COVID-19 pandemic and its effect on all universities across the world, for the first time, the University of Oldenburg switched completely to an online teaching and learning mode, bringing dramatic changes to commuting behavior. As we can see in
Figure 1, the total estimated emissions released during this semester dropped roughly 79% in comparison with the previous, pre-COVID-19 semester.
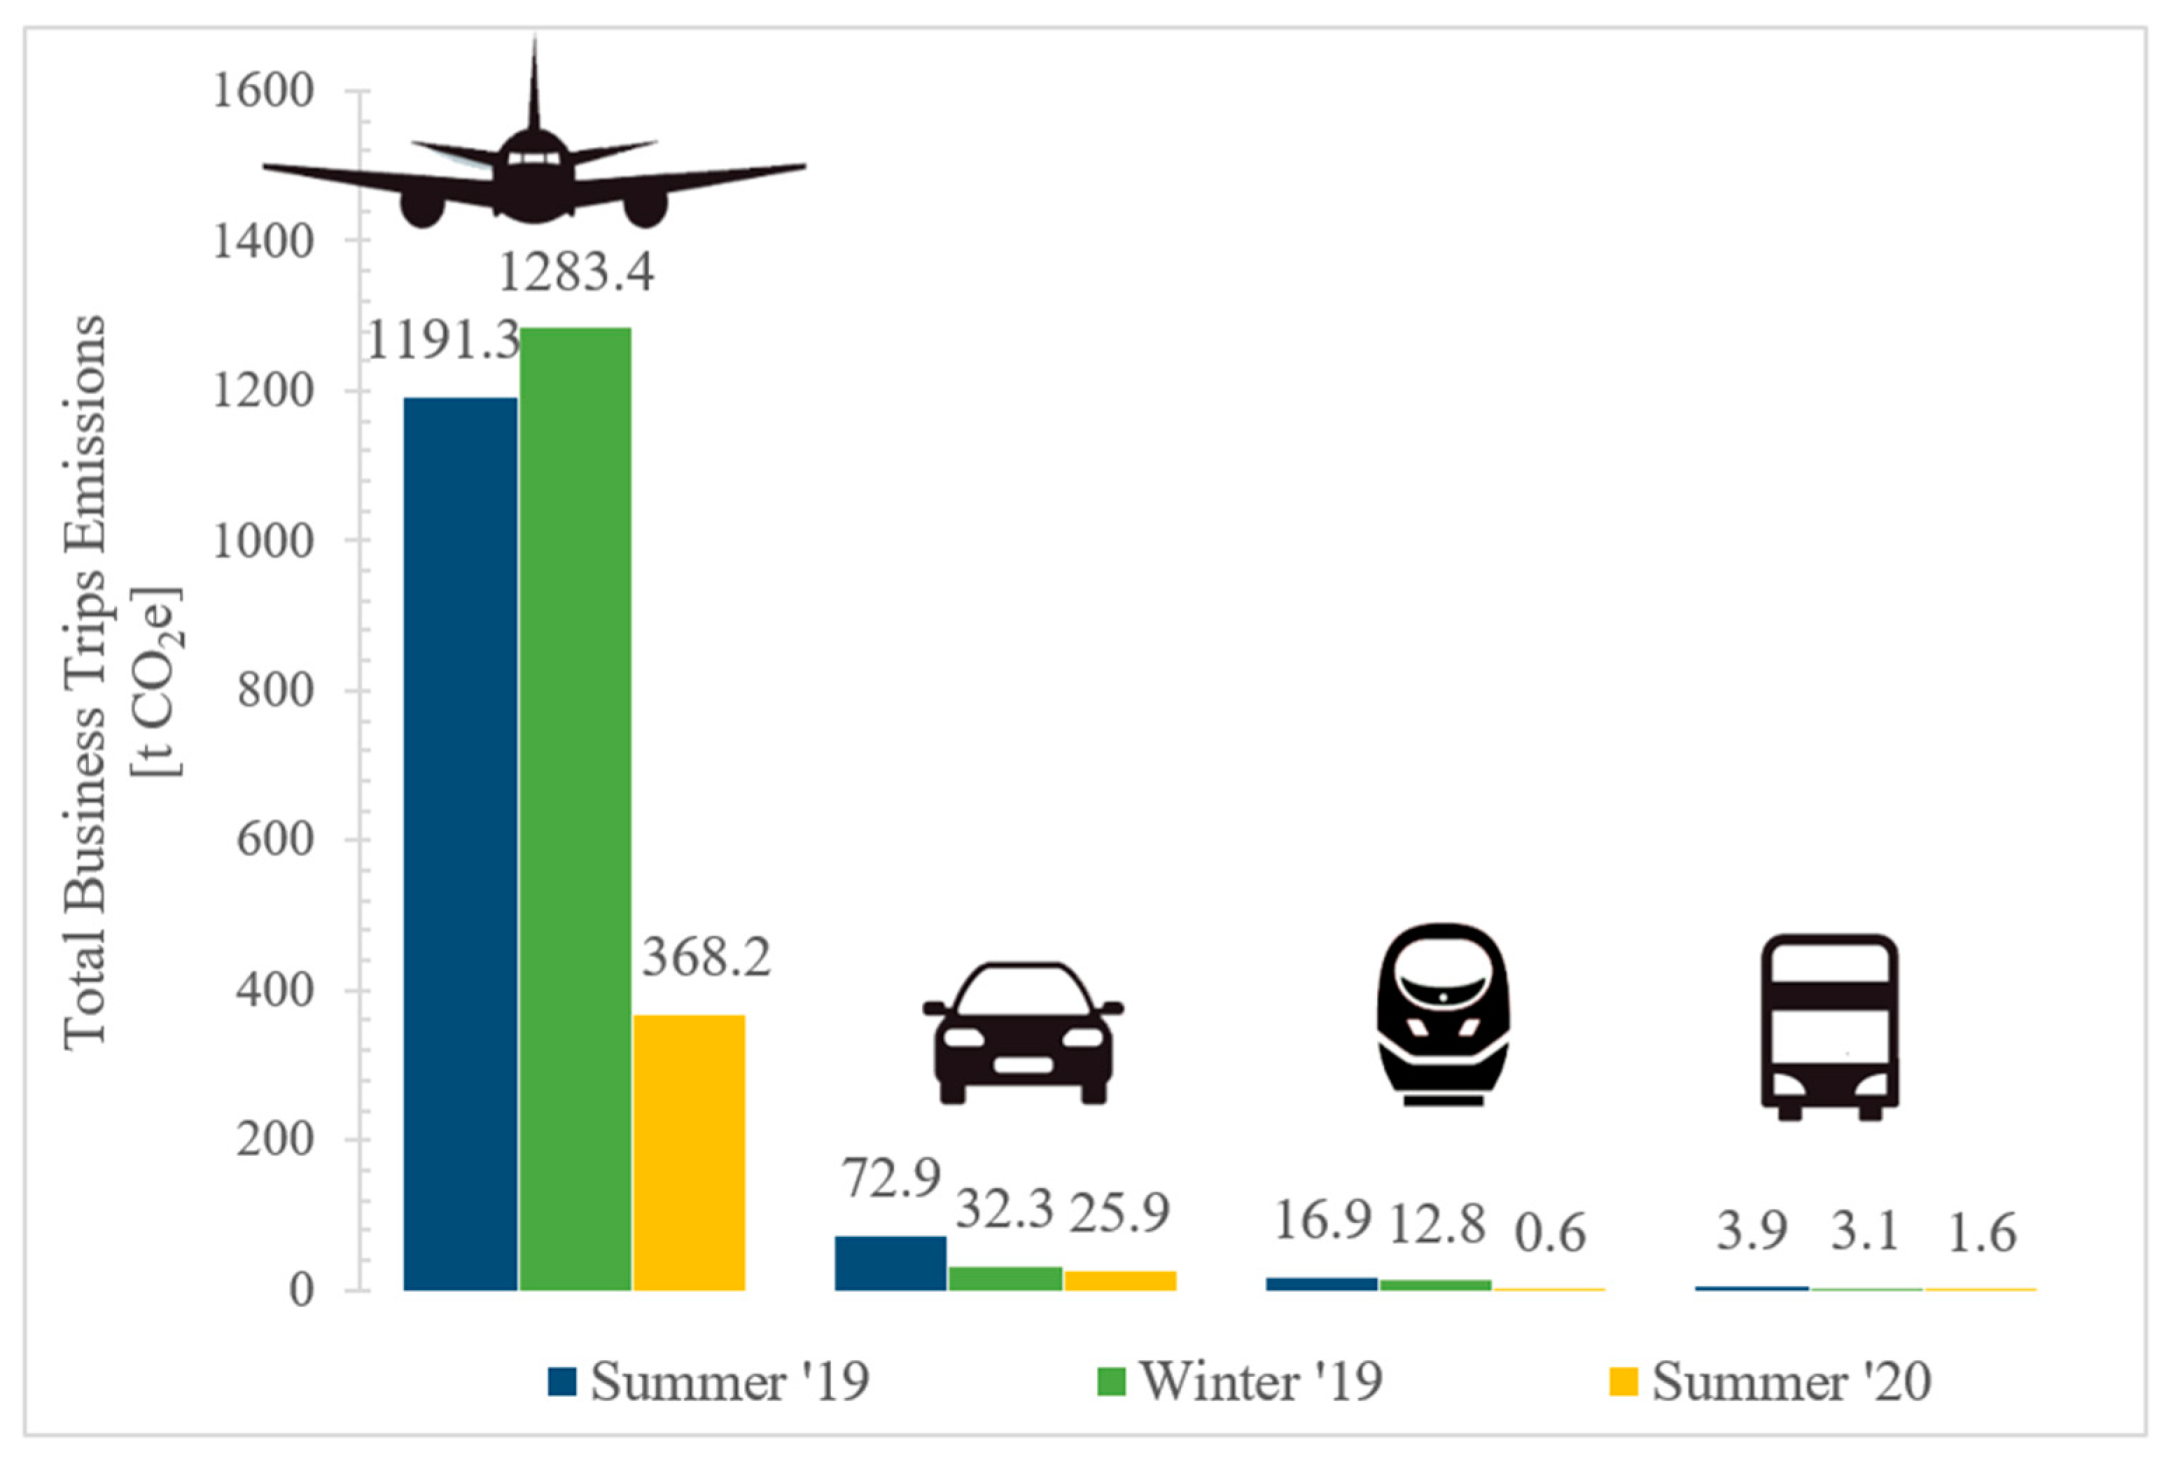
3.2. Business Trips Results and Analysis
As illustrated in
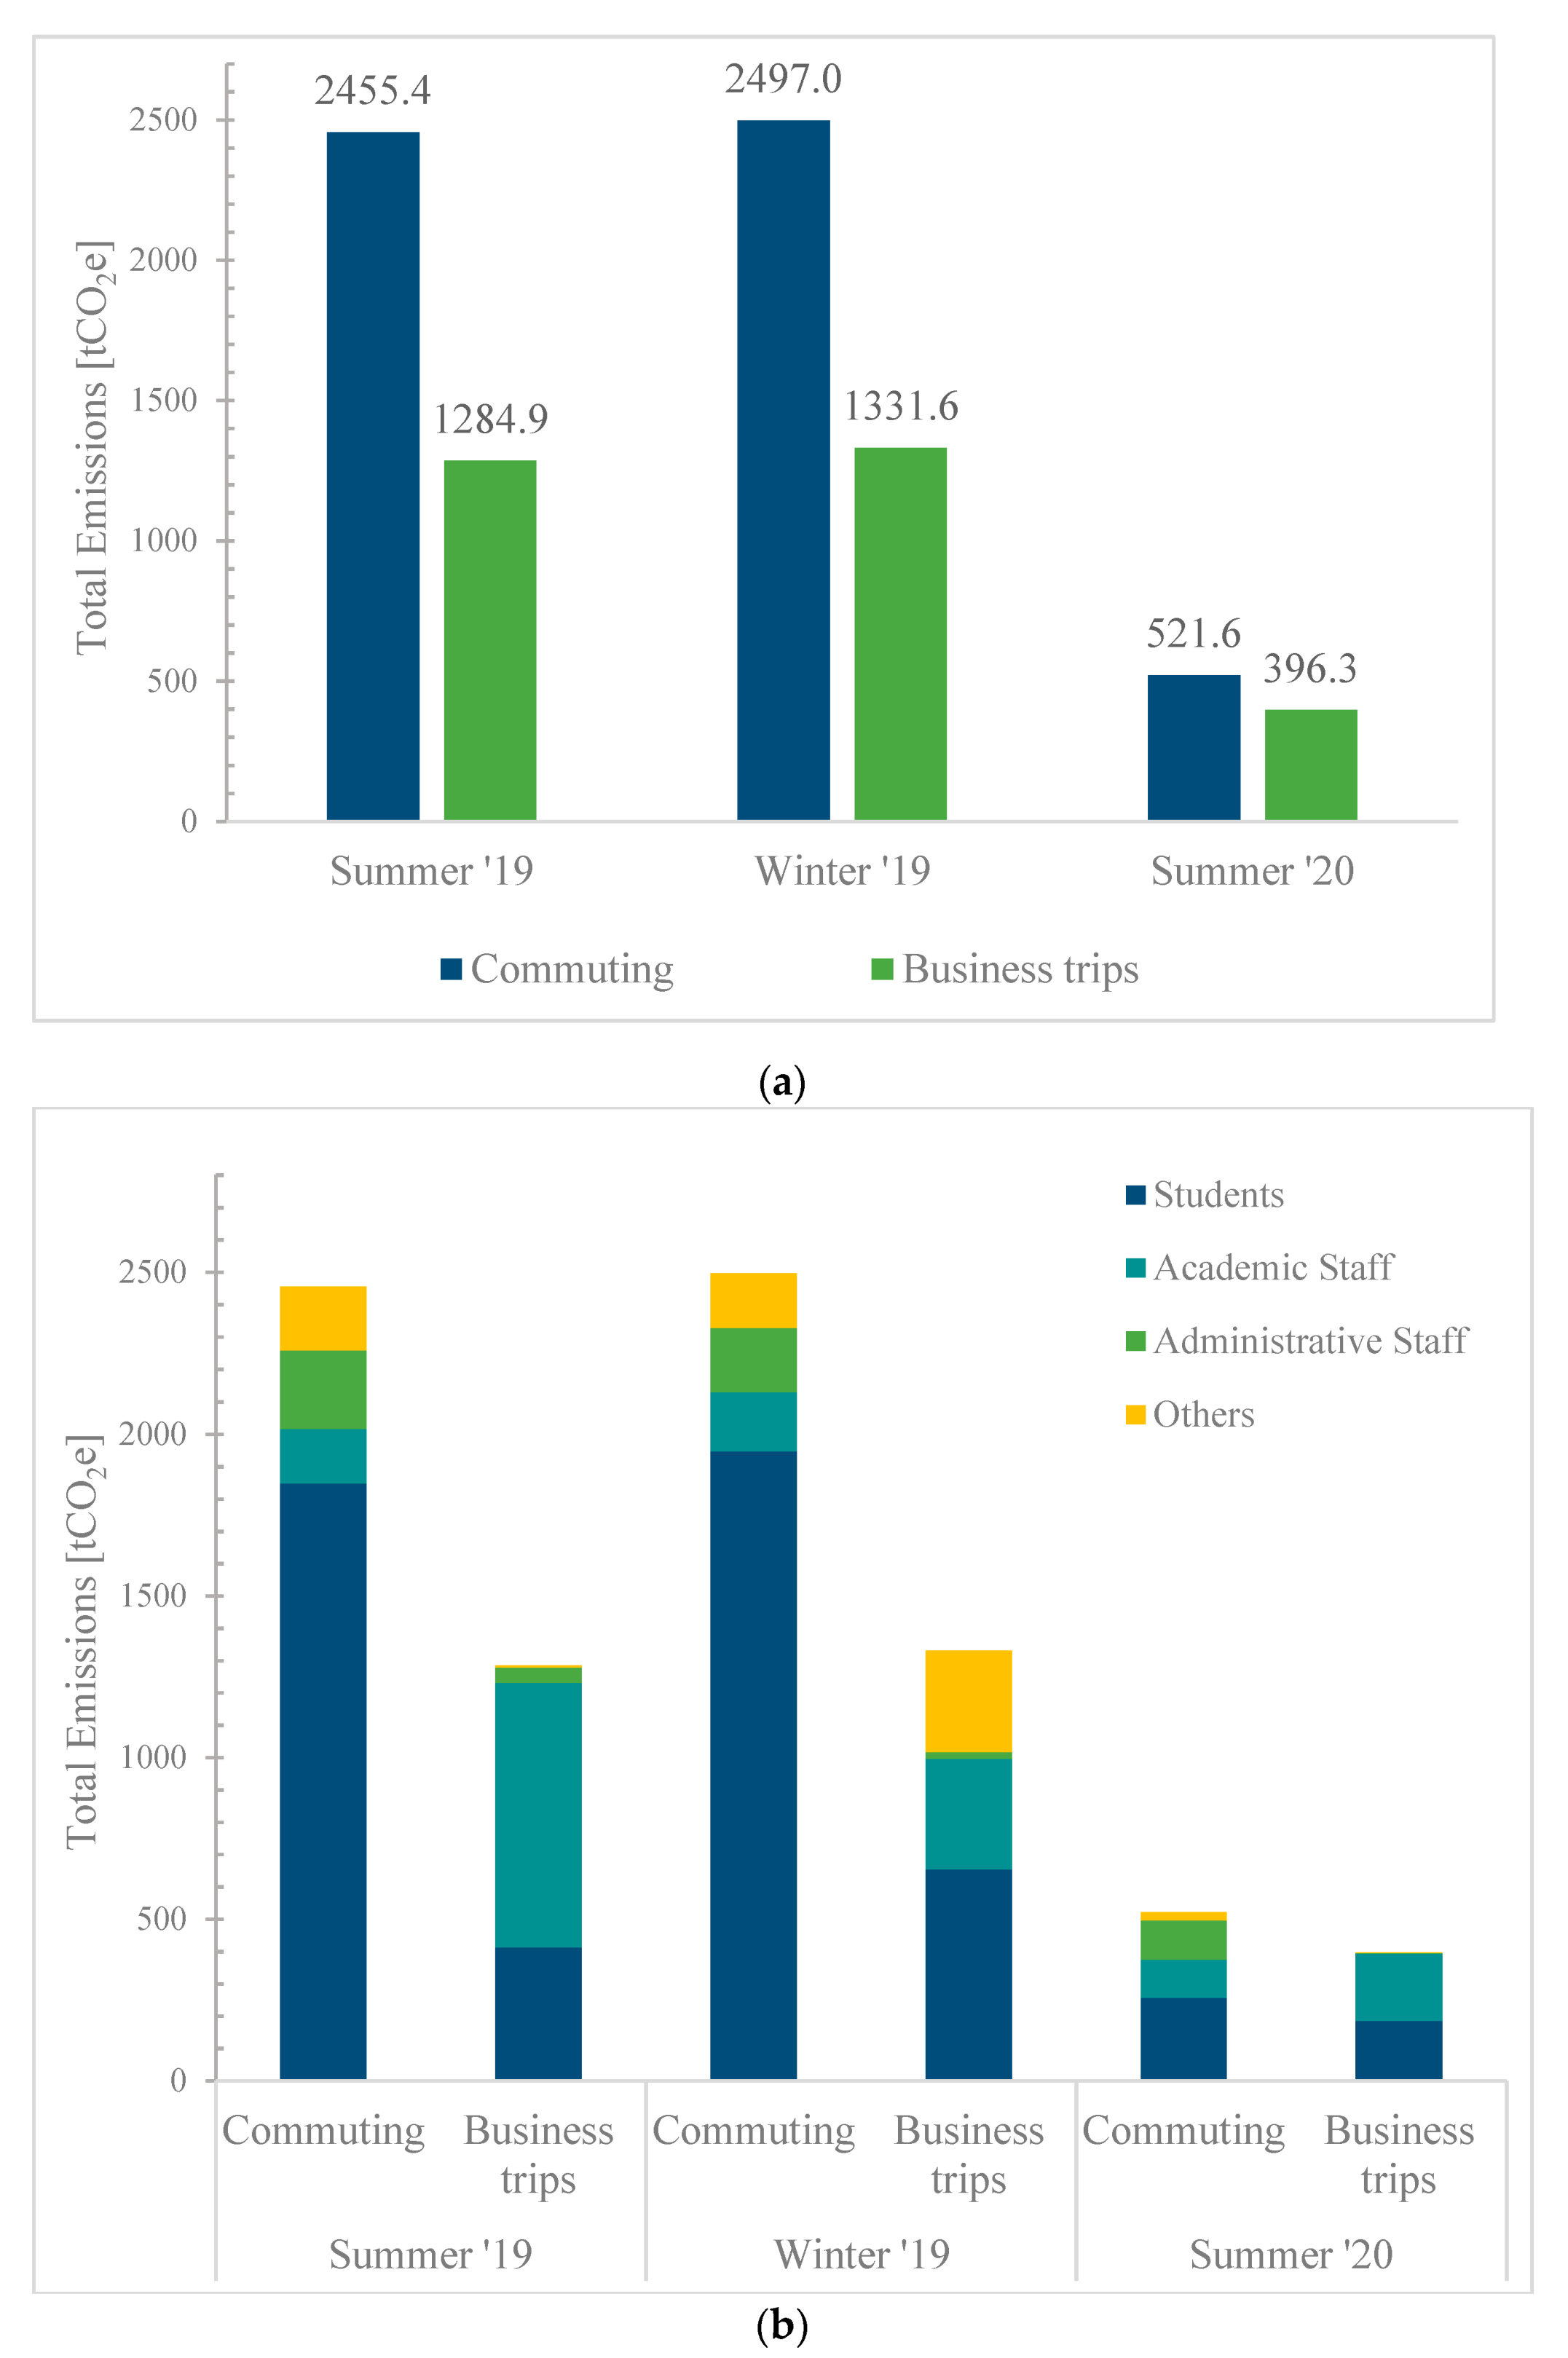
Figure 3, the majority of estimated emissions for business trips were associated with aviation, comprising 92.7% of overall business-trip emissions in summer semester 2019, 96.4% of business-trip emissions in winter semester 2019, and 92.9% of business-trip emissions in summer semester 2020. The particularly high emissions factor for aviation relative to the emissions factors for trains as well as long distances traveled during flights results in an outsized emissions impact compared to the other modes of travel. While 92.7% of business-trip emissions corresponded to aviation travel in the summer semester of 2019, only 56.1% of the business-trip distance traveled during the summer semester of 2019 can be attributed to aviation, with the distance traveled by train for this same semester being 34.8% of the total distance (but only 0.3% of the total emissions). With respect to the total business-trip emissions for each semester, summer semester 2020 had an estimated 69.7% reduction in business-trip emissions relative to the average of the prior two pre-COVID-19 semesters.
When disaggregated by university affiliation (
Figure 4b), academic staff and students contribute the majority of business trip emissions. In the summer semester of 2019, academic staff contributed 60.0% of the total business trip emissions and students contributed 32.1%. Conversely, in the winter semester of 2019, students contributed 30.0% of business trip emissions while academic staff contributed 49.1%.
On a per-person basis, the annualized business trip emissions for 2019 are 0.14 tCO
2e, or 0.13 tCO
2e when considering only air travel. This is within the range of reasonable values observed in similar studies. Güerca et al. (2012) found that the air-travel emissions associated with its institute were 0.08 tCO
2e per person [
10]. The travel-related emissions profile for a university with a diverse set of departments and wider scope of operations such as the University of Oldenburg may expect a higher per-person air travel emissions value relative to a smaller research-oriented institution. The aforementioned University of Illinois Chicago (UIC) study also determined the average air travel emissions for different types of institutions [
11]. On the low end, associate and tribal colleges were found to have an average emissions per full time enrollment (FTE) of 0.10 tCO
2e per year, while generally, larger baccalaureate colleges were found to have an average emissions per full time enrollment (FTE) of 0.65 tCO
2e. Across all institutions, the study found the average annual air travel emissions per FTE to be 0.43 tCO
2e. Considering air travel emissions per FTE at the University of Oldenburg, the emissions value of the current research is 0.152 tCO
2e, similar to the reported values for associate and tribal colleges in the UIC study.
A comparison between commuting and business trips was made to determine the most important contributing sector for emissions (
Figure 4a). The commuting sector has almost double the estimated emissions output for the summer and winter semesters 2019 relative to business trips for the same pre-COVID-19 time period. The summer semester 2020 projects a reduction of around 70% compared with previous semester, presumably due to travel constraints imposed in response to the COVID-19 pandemic. The total estimated emissions for summer semester 2020 are 396.3 tCO
2e. A similar change can be observed for the commuting sector, with an estimated amount of 521.6 tCO
2e emissions for summer semester 2020. Students represent the major contributing group for commuting emissions, as seen in
Figure 4b, where independently of the semester under analysis, this affiliation is predominant. These results are plausible since students represent around the 86% of the entire population of the university.
Finally, similar comparisons of commuting and business trips have been presented by other studies related to the GHG Protocol—Scope 3. The Duquesne University emissions inventory report [
22] showed that the commuting emissions were 2.85 times higher than air travel under the Scope 3 group approach. A comparable behavior was reported by Güerca et al. (2013) [
10], where transportation accounted for 50% of the institute emissions, and only 5% were attributable to air travel, both in reference to Scope 3. All of these studies emphasize the importance of considering indirect GHG emissions related to Scope 3 in order to determine proper strategies to reduce emissions within the higher education sector [
10,
24].
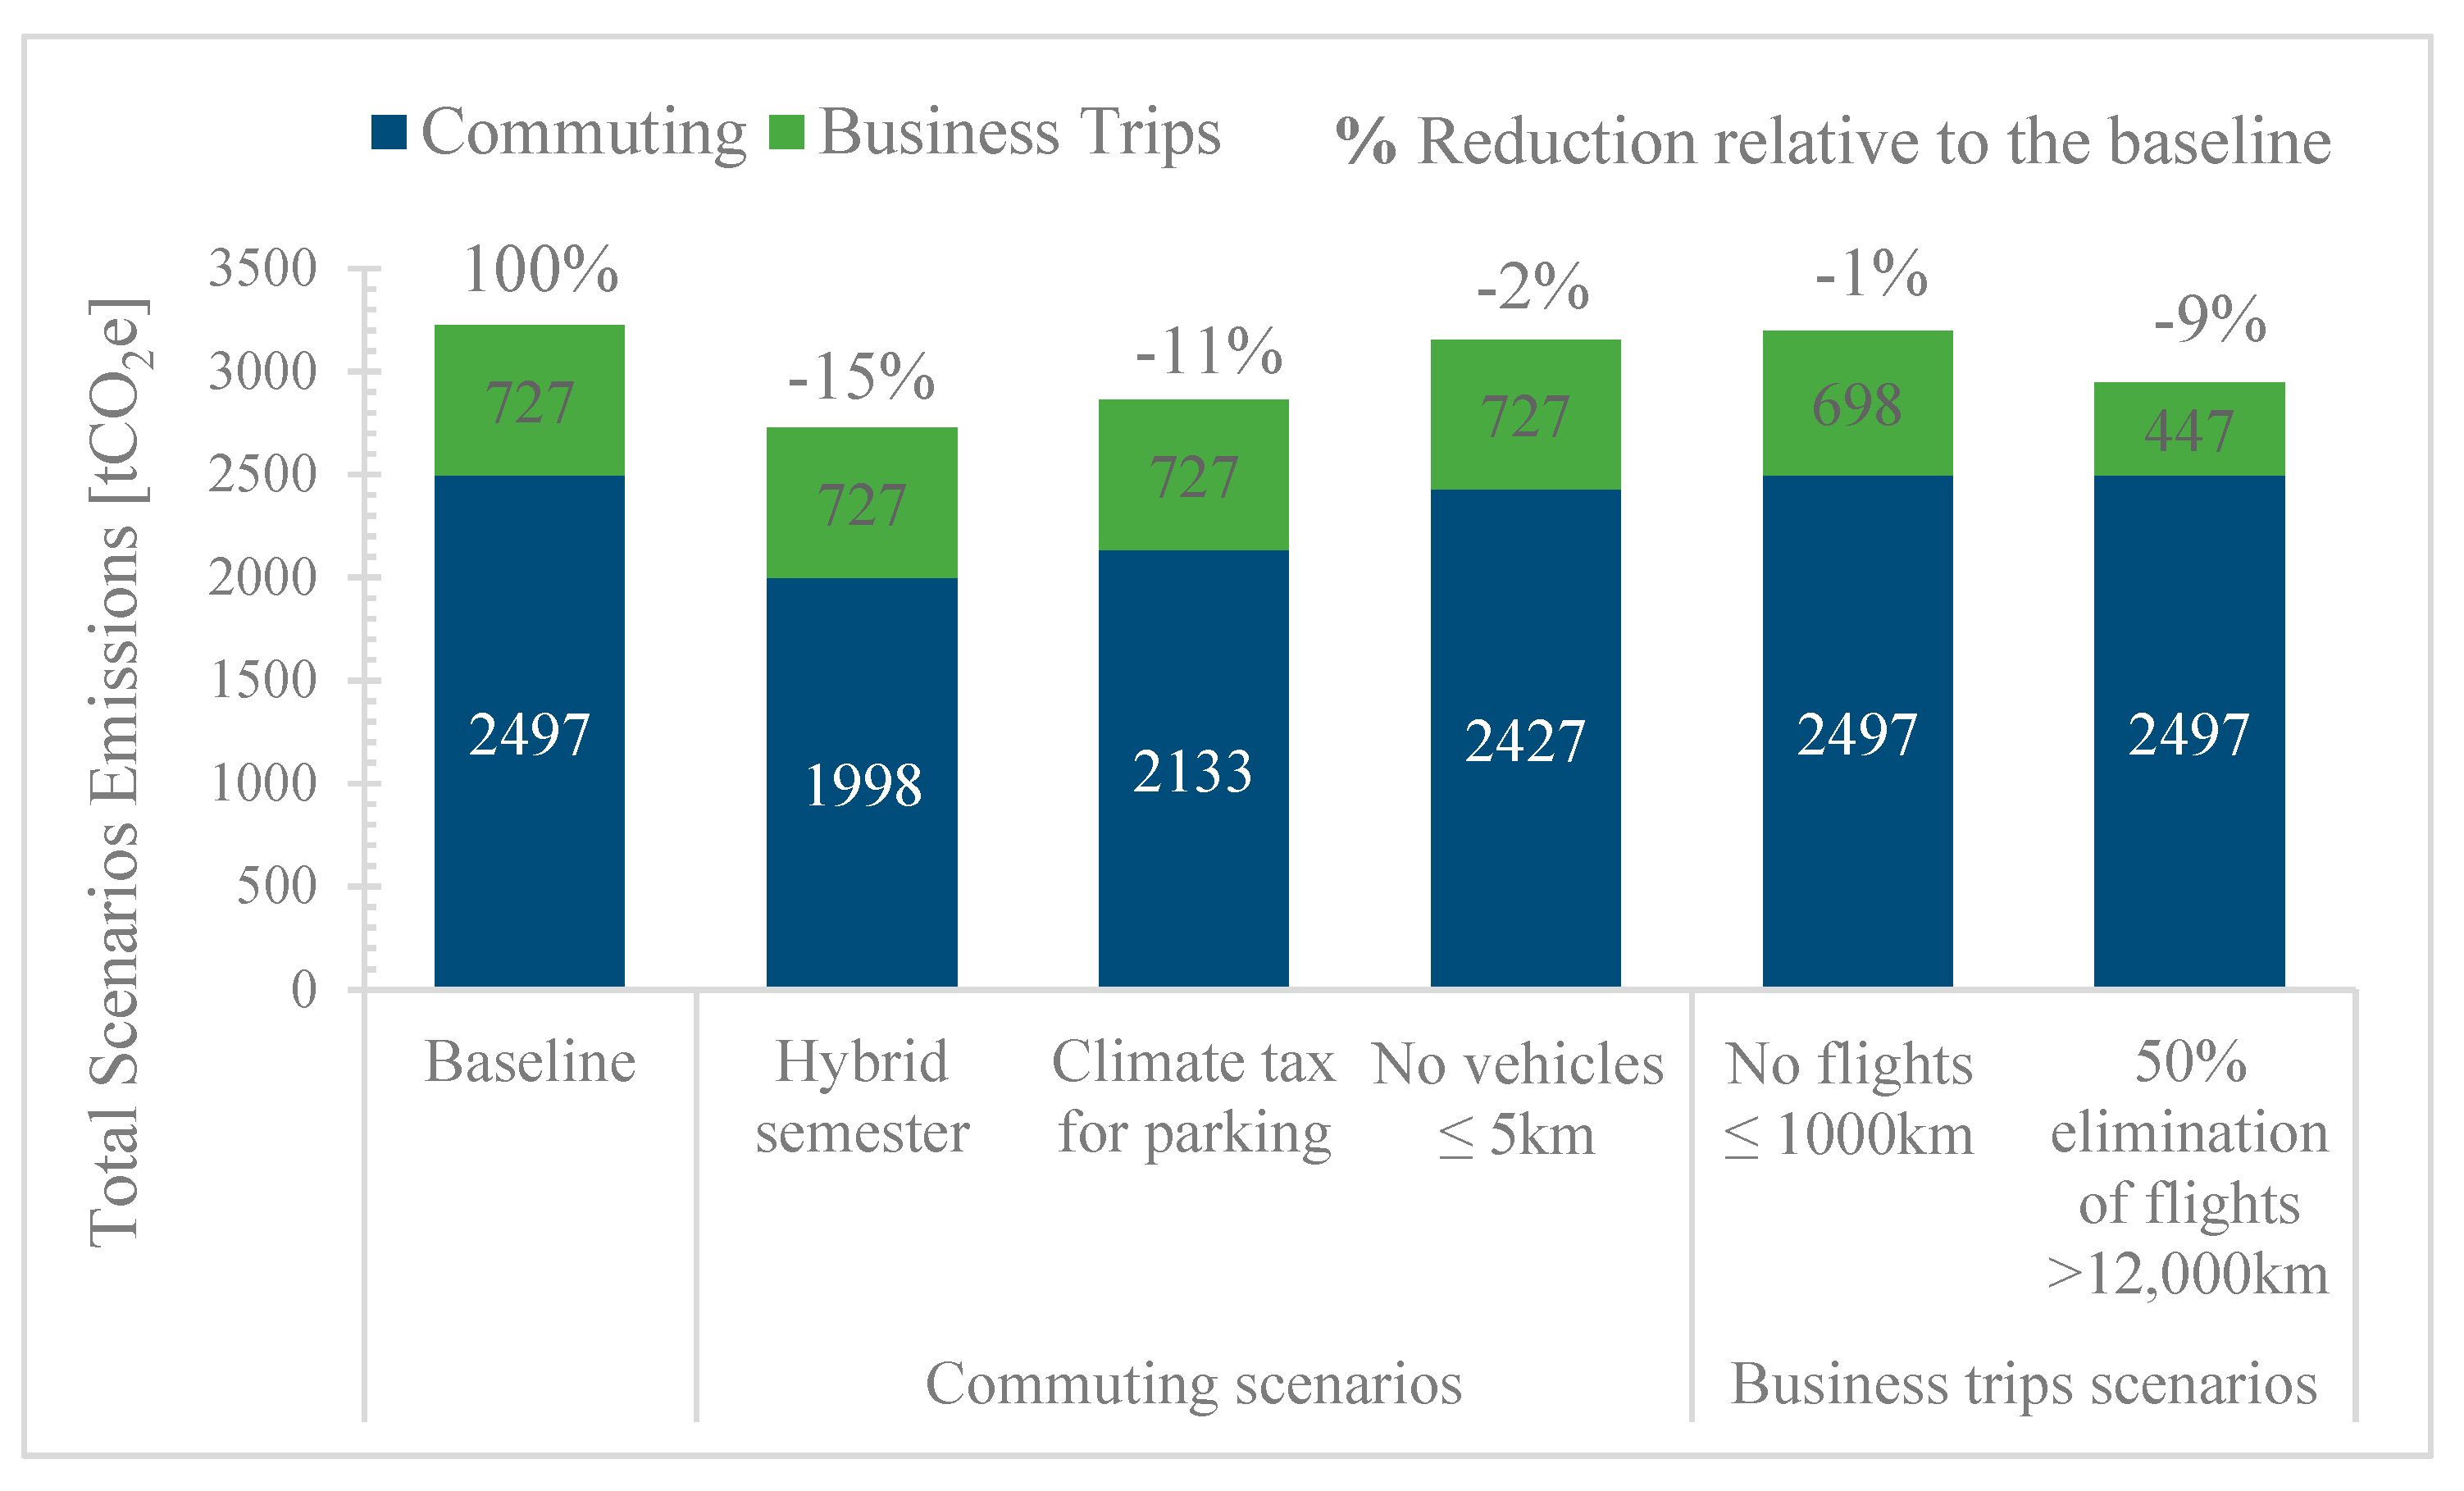
3.3. Emissions Reduction Proposals
Due to the large amount of emissions caused by commuting and business trips, there are significant opportunities for improvements in this area. Three reduction scenarios for commuting (Scenarios 1, 2, and 3) and two reduction scenarios for business trips (Scenarios 4 and 5) are proposed and analyzed. These scenarios are referenced with respect to two pre-COVID-19 semesters (summer 2019 and winter 2019). To estimate the emissions reductions in each of these scenarios, the survey response data were modified based on possible behavior changes described in each scenario below.
Scenario 1—Hybrid Semester: This scenario assumes the university sets policies to encourage 1 day per week of online classes (i.e., no commuting for one day per week). As a consequence, this scenario considers a 20% reduction in commuting for students and staff.
Scenario 2—Climate tax for parking: A survey conducted at the University of Oldenburg [
25] indicated that 43% of automobile users would stop driving their cars if higher parking permits with climate tax were introduced. Thus, this scenario assumes that the climate tax for parking private cars at university may result in a 30% reduction in automobile commutes (e.g., due to switching to cycling or walking).
Scenario 3—No vehicles ≤5 km: This scenario proposes that anyone whose commute distance is less than or equal to 5 km switches from using a motorized vehicle (automobile, bus, and motorcycle) to a bicycle or walking. The calculation was made by modifying the survey data such that all commuters traveling less than 5 km and using a vehicle will no longer have any commuting emissions, followed by scaling-up (as described in
Section 2.3).
Scenario 4—No flights ≤1000 km: Scenario 4 concerns short-distance business trips of the university staff. This scenario proposes that the university finances business trips by flight just for distances longer than 1000 km away. Therefore, business trips less or equal to than 1000 km (one-way distance) would utilize train travel. The scenario was simulated by changing the means of transport on the university business trip data and re-calculating the GHG emissions.
Scenario 5—50% elimination of flights >12,000 km: Scenario 5 considers long-distance business trips of the university staff. This scenario proposes that the university finances less business trips by flight for round-trip distances longer than 12,000 km. Hence, 50% of flights with round-trip distances over 12,000 km are eliminated. The scenario calculation was made via random selection of half of eligible business trips (trips >12,000 km) and removal of these trips from emissions accounting. Three trials were run per semester, and the emissions reductions were averaged to account for variability in the selection of the eliminated trips.
Figure 5 shows the aggregated results of GHG emissions of each scenario in comparison with the baseline (pre-COVID-19) for the winter semester. It was observed that Scenario 1 (hybrid semester) achieves the greatest emissions reduction with a reduction of 499.4 tCO
2e, representing 15% less than the baseline. The COVID-19 crisis has shown that virtual classes and the home office have some advantages such as saving time and money. Accordingly, it is possible to implement a hybrid semester in the future, although some significant changes in university regulations and logistics may be required.
Scenario 2 is the second-best scenario with 11% emissions reduction (364.1 tCO2e), implemented by considering the impact of a climate tax for parking at the university, ultimately reducing private car use by 30%. Finally, Scenario 5 is the third-best scenario, which proposes to cancel half of the flights longer than 12,000 km, representing a reduction of 9% (280.3 tCO2e) in the baseline emissions during winter semester. It must be kept in mind that any application of the scenarios would be affected by resistance to behavior changes, as well as by the economic and legal factors in force.
Lastly, similar scenarios for commuting have been presented by other studies related to the GHG emissions of universities. Instituto de Ingeniería at the Universidad Nacional Autónoma de México [
10] predicted that the best-case scenarios for emissions reduction would include remote classes and work, specifically considering 50% of students and staff working remotely 2 days per week, which was estimated would result in an emissions reduction of 33.3% (237.5 tCO
2e). The percentage of emissions reduction is higher than that of Scenario 1 (hybrid semester) in the current study, since Scenario 1 considers only one day per week of online classes or work. Additionally, the proposal for the emissions reduction at the Universidad de Talca in Chile [
6] considered the scenario of replacement of motorized vehicles for students living near campus, obtaining a emissions reduction of 7% (107 tCO
2e), which is higher than the 2% (69.5 tCO
2e) reduction predicted by Scenario 3 of the current study (no vehicles ≤5 km). One possible reason for the low reduction in emissions in Scenario 3 compared to the scenario of the Universidad de Talca in Chile could be the frequent use of bicycles among the community in Oldenburg, as presented in
Figure 2.
4. Conclusions
This research evaluates the University of Oldenburg’s GHG emissions associated with commuting and business trips, based on Scope 3 of the GHG Protocol method, and quantifies the decrease in emissions related to the online learning mode adopted due to the COVID-19 pandemic.
The mobility analysis has revealed that commuting emissions are generally higher than business trip emissions, with estimated values 1.9 times higher in summer and winter 2019, and 1.3 times higher in summer 2020. The estimates further indicate that most commuting emissions are due to automobiles, representing 52% and 47% of the total emissions in summer and winter 2019, respectively. The next largest percentages of commuting emissions are caused by trains and then buses. Additionally, the results show that the major contributing group to commuting emissions corresponds to the student affiliation, where independently of the semester under analysis, this affiliation is predominant; this is a plausible result since students represent around the 86% of the entire population of the university.
On the other hand, the vast majority of business trip emissions are due to aviation travel, representing 92% and 96% of the total emissions in summer semester 2019 and winter semester 2019, respectively, followed by automobiles, buses, and finally trains. Furthermore, the survey results indicate the online teaching mode has triggered a substantial reduction of 79% of the commuting emissions (equivalent to 1934 tCO2e) and a 69% emissions reduction for business trips (equivalent to 888.6 tCO2e) relative to the average emissions of the prior two semesters. This overall decrease is strictly related to the reduction in the distances traveled by the university population, since total commuting distances traveled were reduced by 82% and total business trip distances traveled were reduced by 66% relative to the pre-COVID-19 semesters. Future work could focus on the effects of different university policies at different stages of the COVID-19 pandemic on mobility patterns and related emissions.
Finally, emissions reduction scenarios were proposed and analyzed. The most effective commuting scenario considers a hybrid semester assuming one day per week without commuting to the university, which is estimated would achieve 499 tCO2e (15%) emissions reduction relative to the baseline scenario. The second-best commuting scenario considers the impact of a climate tax for parking private cars at the university, which is estimated could result in a 30% reduction in private care use, leading to 364 tCO2e (11%) emissions reduction. Additionally, the best business trip scenario considers cancelling half of the flights above km, which is estimated would result in an average reduction of 280 tCO2e (9%) of the total baseline emissions.
A clearer picture of the willingness and motivational factors for current mobility patterns would allow developing further scenarios for reducing the GHG emissions related to commuting to the University of Oldenburg. Similarly, different policy and economic instruments may allow fostering the use of less GHG-intensive means of transport for a greater number of business trips. Further research work in these directions would allow developing new scenarios for reducing mobility-related GHG emissions, thereby enhancing the potential emissions reductions highlighted in the current study.
To conclude, the presented GHG emissions quantification and analyzed scenarios can serve as initial guidance for the University of Oldenburg and other institutions with similar characteristics. By establishing the order of magnitude and importance of mobility-related GHG emissions in the university context, the strong need for addressing and reducing them is clearly shown. Furthermore, the present analysis intends to help them to adopt proper policies and strategies that could help to reduce the associated mobility emissions and achieve sustainability goals.


