Abstract
This paper aims at presenting the notion of corporate social responsibility in Europe by examining its application in Southern European countries, Greece, Italy, Spain and Portugal. These major Mediterranean countries, beside the geographical proximity and common features, were at the center of the financial crisis in Europe in 2009. The aforementioned countries are under evaluation on the one hand as a European region and on the other hand as independent ones. Considering the complexity of CSR, its aspects through time, its diversity depending on the geographical position and the necessity of ethical CSR as part of business activity, this paper presents a new categorization of existing quantitative indicators and a method of evaluation that covers the multidimensional notion of CSR. The new model, which combines quantitative indicators, is used to measure CSR during the period from 2009 until 2016 and reflects companies’ ethical policy, the degree of understanding their moral obligations. The longitudinal comparative analysis is the starting point for further improvement as the countries, except for Portugal, are fluctuating within low levels and the Mediterranean region as a whole in average ones. Furthermore, having estimate CSR index, the examination of the financial performance of Greek companies within the period 2015–2016 confirms the majority of the literature that the adoption of CSR’s good practices, is not only a moral rule, but contributes at least partly, to the development of their effectiveness. As a conclusion, the structure of a commonly acceptable measurement model of the National Social Responsibility and the longitudinal measurement will be a useful tool for all involved institutions, with immediate results to both the society and the companies.
1. Introduction
Over the last decade, due to financial crisis that appeared in America and European countries, climate change, moral dilemmas and issues that arise social concern, the interest in corporate responsibility in society, as well as the benefits offered to the community at large, have increased. Executives have comprehended that in effort to increase their income they have a responsibility towards society [1]. There have been numerous studies and concepts developed relating to how corporations can include matters of corporate responsibility within their entrepreneurship [2].
The notion of CSR is complex, multidimensional, related to many similar definitions and has evolved through years, differentiated among geographical areas. It appeared 60 years ago [3] as charity of traders and industrialists and up until now, several definitions have been put forward and many efforts have taken place so as to present a clear and definite definition [4]. The scientific community is not to be blamed for its ambiguity, but numerous other factors, besides language, such as historical, cultural and socio-economical ones [5] and the fact that CSR is being formed by new tendencies of globalization as well as national political-economic systems [6]. Same core value, though, of all notions is that they reflect the social benefits of business success and they are comprised of methods and practices that contribute to the amelioration of society in a corporate responsibility framework [7]. According to Moon [8], five common features of the definitions of CSR that govern the operation of corporations are (a) the responsibility towards society (b) the responsibility for society (c) ethical rules and responsibility (d) initiatives for society and for environment and (e) managing relations with society. Taking into consideration that corporations play the dominant role in the notion of CSR, it is worth noting that the rest of the affiliated members of this notion such as the governments are contributing parties to its development [9]. Companies have moral obligation to adopt ethical policies and CSR practices in their daily operation.
Global accepted indicators measure one or more aspects of CSR, try to record and highlight CSR practices, but individually they cannot cover all the aspects of CSR. Common CSR characteristics in Europe contribute to group European countries in four parts [10]. Taking into account existing individual indicators of CSR and previous efforts of developmental measurement models, an effort has been made to examine the “Agora”, one of the four CSR parts in Europe, which includes the Mediterranean countries [10]. The main characteristic of this area is the public dialogue among all social agents, which produces CSR policies defined by the governments [10]. These countries were the latest to introduce CSR policies. In addition, features of CSR are analyzed, the ethical actions and behavior of business in the Mediterranean compared to the rest of Europe as well as individual evidence—tendencies of Greece, Italy, Spain and Portugal, which besides the geographical attribution and other features they share in common, were the center of interest during the financial crisis in Europe in 2009. The CSR index is a result of combining global qualitative measurement indicators, takes into account the size of the countries and can easily be used for all the nations. Furthermore, considering the CSR index of Greece, it is examined how the CSR relates to the effectiveness and viability of the Greek companies, when the country was οn the peak of financial crisis and in the center of negative predictions. It is a step, by knowing national CSR index, to relate CSR with financial performance of each country’s companies. The results confirm the differentiation of CSR’s application that is affected by the individual structural particularity of each country, in matters of culture, finance and politics as well as the differentiation of the Mediterranean compared to the rest of Europe. CSR contributes to partly ameliorating the companies’ effectiveness and the future examination of the rest of the European countries within a commonly acceptable model that will combine qualitative and quantitative features and will shape the National Indicator of CSR, thus benefits all interested parties.
2. Complexity of CSR
Definitions and Aspects of CSR
As it is conceived from the plethora of definitions, notions and aspects, despite the numerous publications, the CSR remains a notion that lacks clarity [11]. The fact that CSR occurs in different places, for different people and for different reasons [12] contributes to its complexity. The variations and the diversity of its aspects affect implementation, management and orientation on behalf of corporations, bearing in mind the factors in regional and national framework [13]. Every business domain in every environment sets different goals, different interests, different ability or knowledge to comprehend the notion of CSR and to turn it into action [14].
Different political-economic systems create a different functioning environment for corporations, such a fact is affecting the notion of CSR [6]. In addition, the different cultures, languages, legislations and policies promoted by the public sector, motivations and goals of each company influence the final form of CSR. Companies cannot function on an individual level [14], but it cannot be set aside the fact that higher corporate executives play a significant role on its outcome, as individual entities, as with their decision-making, strategies are formed, decisions are made and initiatives applied based on the CSR [15]. Finally, except for the corporate executives, the motives of basic parties involved form CSR [7]. According to Argandona and Hoivic [5], besides corporations’ moral, governments’ moral, public organizations’ moral, the press, the consumers and generally all parties involved must be under consideration.
The notion of CSR is even more complex and wider if one takes into account that relates with similar, but not the same, meanings, which most of them complement each other. A particular characteristic is the notion of corporate ethics [16], corporate governance and corporate viability. Moreover, notions which do not contain the word ‘corporate’- such as human rights, globalization, protection of the environment, education, corruption, supply chain management, professional conduct and many more—are related more or less to CSR.
Business ethics is a notion that relates to CSR and according to Goel and Ramanathan [17]; CSR is a subject of business ethics. Keeping in mind that CSR is both complex and complicated, Sheehy [18] points out that CSR is not only a private business regulation of harms but also a public good. Firms do not only have rights but also duties and obligations to the environment they operate and these duties must be part of business ethics, of the firm’s behavior and of business plan [19]. Not all the actions of a firm can be profitable but sometimes actions should be taken just because are right [20]. Right actions that pertain to investments, sustainability, environment, finance, employees and stakeholders are related to CSR. Ethical CSR based on the motion of ethical duties and responsibilities is mandatory [21]. Ethical CSR practices should take place not because of the law or the competition but due to the code of conduct, the continuous effort to improve in all areas and to show an overall good image in all aspects and dimensions.
According to Dahlsrud [4], most of the CSR definitions include one or more of the following aspects: (a) parties involved (b) social aspect (c) financial aspect (d) volunteering and (e) environmental. For Rahman [22] all definitions cover one or more of the domains below: (a) obligation towards society (b) participation of parties interested (c) amelioration of the quality of life (d) economic growth (e) moral entrepreneurial practice (f) legislation (g) volunteering (h) human rights (i) protection of the environment and (j) transparency and accountability. A clear definition will be useful for organizations and public policies to go a step forward [18], but unfortunately the definitional problem of CSR seems to be unsolved.
3. Qualitative Measurement Indicators
The more prevalent definitions of CSR are not suitable as a base for contrastive measurement of its practices [6]. The inability to define CSR precisely and the wide range of practices and aspects it contains, make it difficult to record, to be measured and to export comparable data. By measuring CSR, corporations can define their strong points and weaknesses, form a strategy and seize opportunities [23]. Meanwhile, the configuration of a national indicator of CSR per country or regional area, contributes to forming strategies on behalf of governments and public authorities, recording tendencies and issues that arise as well as analyzing phenomena. The utilization of qualitative measurement indicators is an attempt to record CSR practices. Concurrently their data are comparable and can be exported to a measurement data base. The development of valid and reliable indicators is a significant factor in the process of measurement [24]. Each indicator collects evidence and contributes to the assessment of CSR of one or more of the above aspects. Participating in the formation of indicators from different categories, as result of values, norms, ethical practices and principles that guide a business, leads to a comprehensive representation of CSR. The number of corporations implementing variables of indicators or those certified shapes the national indicator [25]. Composite indicators are an adequate approach to synthesize and summarize all the information that represents different dimensions [26]. Some of the most prevalent indicators, which if combined a, respectively, full picture of social is being shaped, are the following:
- (a)
- Global Reporting Initiative, a series of essays, reports and notifications from organizations irrespective of size and domain, relating to the governance way and the environmental, social and economic achievements.
- (b)
- UN Global Compact, initiative developed by the United Nations which reaches out to companies in order to support and adopt within their function ten generally acceptable principles that concern, among others, the protection of human rights, working role models, environmental management and measures against corruption.
- (c)
- KPMG’s Survey of Corporate Responsibility Reporting, regarding non-profitable corporate essays of 100 and 250 largest companies, including an analysis of the state, evaluations and comparative data.
- (d)
- Dow Jones Sustainability Index which is based on the analysis of corporate finances, environmental and social achievements, estimating matters such as corporate governance, risk management, climate change, standards of supply chain and working practices. There are criteria concerning choice of the greatest companies and it includes companies having the best practices.
- (e)
- FTSE4Good, measures the efficacy of companies that suffice the global acknowledged standards of CSR.
- (f)
- Global 100, a list of 100 worldwide most viable companies in the world which is annually announced in the Global Economic Forum in Davos, developed by the Canadian magazine ‘Corporate Knights’ in cooperation with the research company “Innovest Strategic Value Advisors”.
- (g)
- ISO 14001, a standard system of environmental management.
- (h)
- SA 8000, an auditing certification standard for decent working conditions (human rights, working practices, etc.).
4. Measurement Attempts—Connection with Financial Performance
Even though the theoretical question about its definition remains until recent years [18] and despite the CSR’s problem of measuring, a fact noted years ago [27], there have been many different attempts since 2000 and thereafter [28]. Matten and Moon [7] and [29] were the first to have mentioned the national indicator of CSR. According to Soana [30], the attempts to measure the national indicator are divided into five categories, based on the method employed (a) content analysis (b) use of questionnaires (c) use of one-dimensional indicators (d) comparing reputation and (e) evaluating code of conduct-ethos.
All attempts to either record CSR or compare various countries concern only one year. The longitudinal progress is not being examined and only the methodology is being differentiated. Maugnan and Ralston [31] as well as Chapple and Moon [32] proceeded into measuring CSR by performing content analysis, Vitell and Paolillo [33], Turker [34], Boesso and Kumar [35], Kourula [36] tried to measure it by the use of questionnaires and factor analysis. In addition, Jackson and Apostolakou [37] attempted with the use of various criteria of CSR’s dimensions and Sustainable Asset Management (SAM)’s elements to form the national indicator and compare the European Countries’ results. Midttun et al., [38] gave their first try into measuring it by the use of multiple quantitative factors and in 2009. Gjolberg [6] combining each country’s company participation into forming nine one-dimensional indicators, presented a new measurement model of CSR and compared the results of twenty countries concerning and Skouloudis et al. [25] have further extended it with the use of sixteen one-dimensional indicators and compared the results of eighty-six countries for the year 2012. In comparison, Esteban et al. [39], in their attempt to avoid the restrictions of Gjolberg’s model [6], evaluating twenty-two practices-initiatives of corporations connected to their viability and CSR on a scale from 0–4, proceed with a macro financial process, a model of configuring the national indicator of CSR and present the findings of countries for the year 2014. One more proposal about composing indicators at the country level has been carried out by Esteban et al. [26] by synthesizing and rating companies’ social and environmental practices. CSR composed index at sector level [40] can be extend and used as a measure of comparison between nations.
The results of the above surveys are useful for country comparison at a given time and do not record CSR’s evolution over time. In addition, they do not identify the positive and negative aspects of the individual indicators that shape the overall result. Until now, there is not any commonly accepted method that encompasses all its aspects.
Since 1985, Ullmann through his research realized the ambiguity and the difficulty of investigating the relation between the CSR and the financial development-position of the companies. Many factors create difficulties towards this effort, mainly some having to do with the methodology of measuring CSR, which is based on indicators, models, questionnaires, etc. and the evaluation method of the financial status of the companies, which is based on the stock broking value, the profit share, the financial situation, etc. Another problem pinpointed by Karagiorgos [41] is that the relation is bidirectional in the sense that the CSR practices are possibly leading to the amelioration of the companies’ financial status and that the companies with remarkable financial position participate in CSR practices. According to Margolis and Walsh [42] within the majority of the studies, CSR is the independent variable. The ambiguity and uncertainty concerning the existence of possible positive or negative relation is confirmed more recently by Mercedes [43], as a plethora of studies, depending on the methodology, has drawn different conclusions, either a positive correlation, a negative or neutral one. Indeed, the literature of Beurden and Gossling’ studies [44] as well as Choi et al.’s [45] shows a rather positive correlation between CSR and effectiveness-viability of the company. A positive correlation occurs in the studies of Wahba [46], Wang [47] and Karegiorgos [41] concerning Greek companies’ empirical analysis and Mercedes [43] relating to Spanish companies. On the contrary, Wood and Jones [48] and Brammer et al. [49] found out a negative relation. Finally, McWilliams and Siegel [50], Lopez et al. [51] and Mitt et al. [52] found either a neutral relationship or their results cannot lead to clear conclusions. The results aim to differentiate according to the methodology and the period under review and each individually country examined.
Moreover, a scope of researches is to find out whether CSR has been influenced by the financial crisis as its consequences and impact is differentiated from one country to another [53] but the results are still not clear. However, Charitoudi et al. [54] consider that the crisis will have to be perceived as an opportunity to redefine the companies’ role within society and not to be thought of as an obstacle because of the rise in implementation cost. Having estimated the national CSR, it can be compared with the financial performance of companies and their fluctuation during the years.
5. Methodology
5.1. Measuring Model
Data of individual indicators will be taken into consideration and establish a connection to Gjolberg [6] application model type 1, with certain differentiations, for the period 2009 to 2016, in order to form the national CSR. Is a formative measurement type because the index is formed by global indicators (number of companies that participate) and takes into account the counties’ size. The comparative analysis of data concerns (a) the under evaluation countries of Greece, Italy, Spain and Portugal and (b) between the above countries as an undivided geographical Mediterranean area, compared to the rest European regions.
Type 1 Gjolberg Model [6]
For each one of the individual indicators, the number of companies of each country (or region) participating in its configuration is divided with the total number of the companies of the countries that are examine. The result then is being adjusted to the GDP of each country, which is divided with each country’s GDP to have results based on the size and financial dynamics of each country. Afterwards, in order to prevent erroneous results and fluctuating, National CSR is being transformed into a natural algorithm. The results over 0 depict a positive relation of the country and the CSR’s indicator, whereas the results lower that 0 depict the opposite. The total number of companies that participate in each indicator collected by indicators’ data center.
5.2. Categorization of Indicators
Based on its complex nature, there needs to be an implementation of the “multiple indicators, multiple causes (MIMIC) model” [55]. Combining the categorization of CSR indicators of Midttun et al. [38] and Zhen-Yu Zhao et al. [56], four grouped categories are shaped, as Table 1 illustrates, from which the most important and representative ones have been chosen. They are considered as the most suitable ones for the current longitudinal study as they: (a) are universal indicators and the under examination countries can be included (b) are representative of the different aspects of CSR and their combination allows for examination of CSR as a total notion (c) offer data for all the years of the time period of the financial crisis 2009–2016, except for the KPMG’s Survey and FTSE4Goodindicators, as there is no evidence for the years 2010, 2012 and 2014. Regarding the indicators of these years, the average has been used between previous and following year. The new model presents limitation associated with the fact that the indicators are based on participation and underwriting in CSR practices. The new proposal of composite qualitative measurement indicators is an attempt to synthesize and involve different aspects of CSR, so the exported index to be representative of CSR. It is pointed out that (a) many companies may adopt CSR policies but not participate, for many reasons, to CSR indicators (b) many companies could not participate to all indicators of the same category and (c) the indicators have not been checked for their quality characteristics.

Table 1.
Categorization of Indicators.
5.3. CSR and Financial Performance
Concerning the period 2015 to 2016, where based on the above model, CSR has an upward tendency in Greece, will examine if the Greek companies belong to “CSR Hellas”, the most famous organization for CSR and member of “CSR Europe” from 2000, and adopted CSR actions, appear in their financial performance important statistical difference concerning efficiency and viability, to those that not participate to the organization.
For the examination of the existence of the positive relation of the financial performance of the Greek companies and CSR, a statistical hypothesis inspection will be implemented, based on the existence significant difference between the mediums of the two independent samples that will be examined [54,57]. Τhe statistical analysis is basic and descriptive. More specifically, the two-sample t-test hypothesis test will be used [58] with confidence intervals of 1%, 5% και 10%:
Hypothesis 1.
the average efficiency and viability, as that appears by financial performance, of corporations having adopted CSR does not differ from those of corporations that have not adopted CSR.
Hypothesis 2.
the average efficiency and viability, as that appears by financial performance, of corporations having adopted CSR is greater than those of corporations that have not adopted.
Griffin and Mahon [59] conclude that of the most popular indicators for measuring the financial efficiency of the companies are the following, which have repeatedly used in surveys of comparison and measurement [27,60]:
- (a)
- Return on assets—ROA (Net Income/Total Assets)
- (b)
- Return on Sales—ROS (Operating Profit/Net Sales)
- (c)
- Return on equity—ROE (Net income/Shareholders Equity)
5.4. Sample Data
The sample is consisted of Greek companies that are members of “CSR Hellas” and companies that belong to the Greek stock market as shown in Table 2. Stratified random sampling is the method of sampling and so all companies have been divided into seven homogeneous subgroups as Table 3, according to their activity. The Banks, due to their unique characteristics and the different financial performance that they present, have been excluded. From the companies of the Greek stock market, companies belonging to the “CSR Hellas” were excluded, ensuring the independence of the two populations. No sample was taken from the category “Others”, as the diversity of the companies and the unique characteristics of certain working sectors present dissimilarity, in order to achieve less dispersal. The sample’s size was chosen randomly (same sample number from both populations), 4 to 5 companies from each category and 10 companies from the category “Services”, as they consist of about 30% of the total population and in this way they still consist of about 30% of the sample, as presented in Table 3.
Table 2.
Greek Company Population.
Table 3.
Sample categorization.
6. CSR Analysis and Findings
6.1. CSR from 2009 until 2016
Considering the categorization of indicators, as in Table 1, and according to the averages of the period as Table 4, Greece is on a positive level only in Reporting category. In SRI and Standards is in the last place, Greek firms do not care about socially investments and certifications. Italy is the only country at negative level in Reporting category and the only one on a positive level about issuing certifications and following global standards. Spain ranks first in terms of SRI and Initiatives but very low in the Standards category. Finally, Portugal ranks first in Reporting and almost zero in socially investments and participating in initiatives.
Table 4.
Country Average of Indicators Categorization.
Regarding the examined areas and the averages of Table 5, the Mediterranean is the only area on a positive level in the Standards category, with a significant difference from the other regions. In addition, the Mediterranean is on a positive level only in Reporting category. Considering that these two categories are defined by organizations’ standards and public policies, is confirmed the active involvement of governments of “Agora” model [10]. The Northern European countries show high positive averages, except the Standards category that show a negative sign. Only UK countries are on the positive level in the SRI category and finally the Central European countries are at negative level on all categories.
Table 5.
Region Average of Indicators Categorization.
In the SRI category, as Figure 1 and Table 6, Greece is showing significant fluctuations over the period under review, with the most significant drop during the period from 2012 to 2013. Since then and until 2016, Greece has remained in the last place, just below from Italy, which remains at steady negative levels. Portugal, while in 2009 ranking third and at negative levels, managed to have a positive sign as well as the first place in 2014, but since then has declined. Finally, Spain has positive steady course throughout the years.
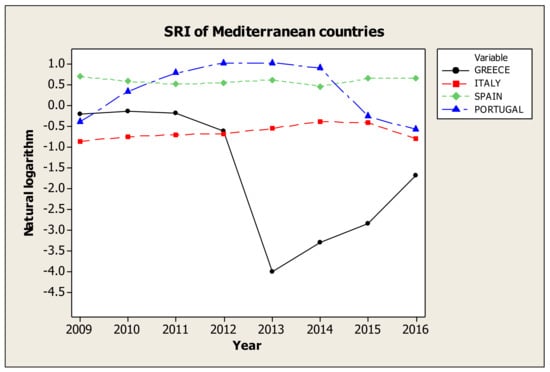
Figure 1.
SRI of Mediterranean Countries.
Table 6.
SRI of Mediterranean Countries.
In the same category, the regions of Europe, as Figure 2 and Table 7, show significant differences between them. The Mediterranean and the Central European countries are continuously moving to negative levels, with the difference that the Central European countries show an increasing trend while the Mediterranean a decreasing. The UK was in the first place until 2015, but, since then, both their downward trend and the rising trend of the northern European countries brought them to the second place.
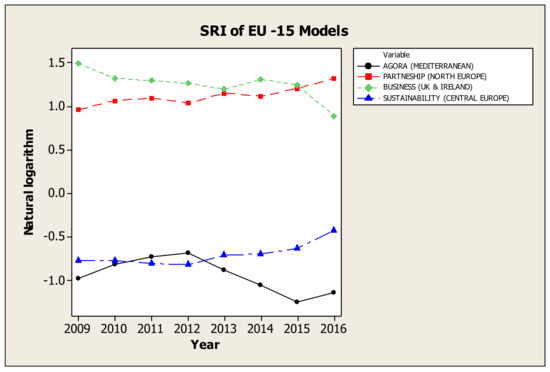
Figure 2.
SRI of EU Regions.
Table 7.
SRI of EU Regions.
In the Initiatives category, as Figure 3 and Table 8, all the countries have shown significant fluctuations, however, except Portugal, all other countries in 2016 are almost at the same level as in 2009. Portugal, in 2012, showed a steady upward trend and managed to keep positive levels near the level of Spain. Italy and Greece are continuously at negative levels.
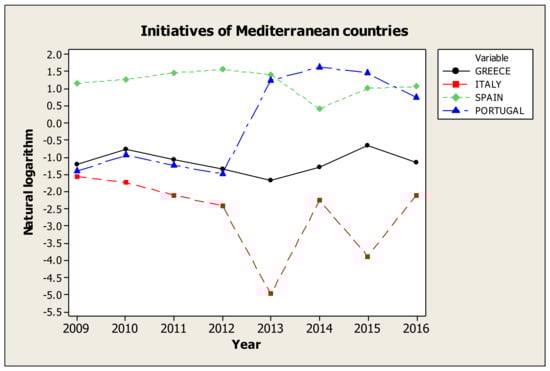
Figure 3.
Initiatives of Mediterranean Countries.
Table 8.
Initiatives of Mediterranean Countries.
In the same category, for the regions of Europe, as Figure 4 and Table 9, only northern European countries are moving at positive levels, with very little growth. The Mediterranean and the United Kingdom countries are changing significantly, while the Central European countries from 2010 onwards show a slight increase and from 2013 are in second place.
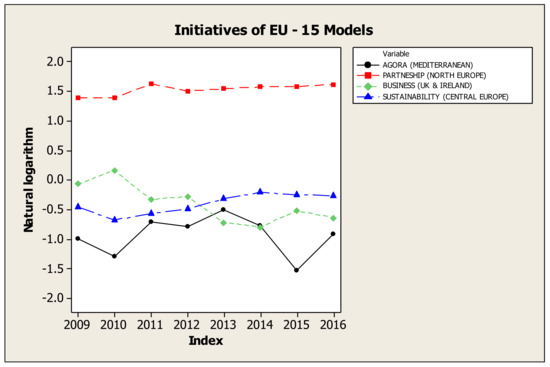
Figure 4.
Initiatives of European regions.
Table 9.
Initiatives of European regions.
In Reporting category, as Figure 5 and Table 10, Italy is the only country that is continuously at negative levels. Greece managed to climb up and reach in 2016 Portugal at the first place. Finally, Spain, although continuously on a marginal positive level, shows a small but downward trend since 2011.
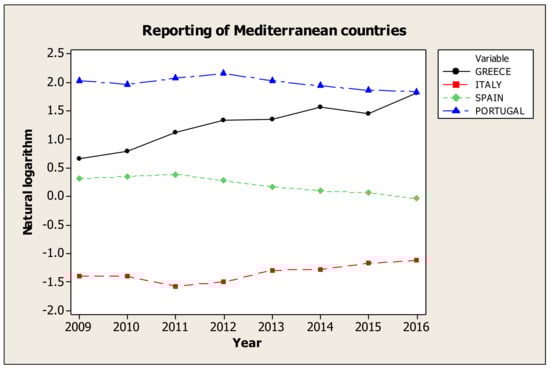
Figure 5.
Reporting of European Regions.
Table 10.
Reporting of European Regions.
In the same category, as Figure 6 and Table 11, Northern European countries show a significant difference from the rest of the regions, moving continuously to high levels. The simultaneous downward trend of the Mediterranean and the upward trend of the UK countries led them to be at marginally negative level in 2016. The Central European countries, since the beginning of the period, have been on the rise, but have not managed to reach positive levels.
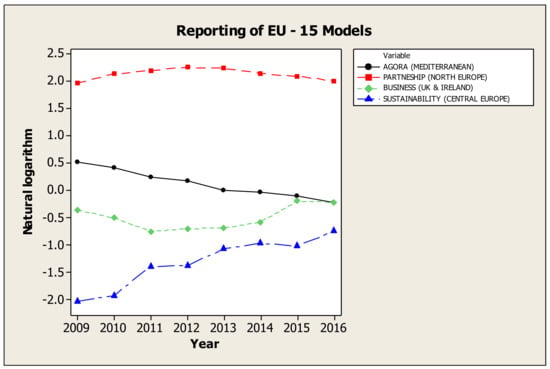
Figure 6.
Reporting of European Regions.
Table 11.
Reporting of European Regions.
In Standards category, as Figure 7 and Table 12, Italy is the only country that remains continuously to positive levels. The countries of Greece and Spain since 2012 and then, present an opposite trend, Greece rising and Spain decreasing. Portugal is always in the second place, with a steady upward trend, but still at negative levels.
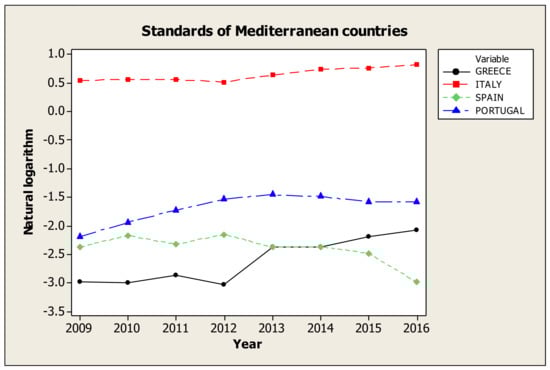
Figure 7.
Standards of Mediterranean Countries.
Table 12.
Standards of Mediterranean Countries.
In the same category, as Figure 8 and Table 13, Mediterranean has a significant positive difference from the rest regions. The remaining regions, despite the slight fluctuations during the period, are in 2016 almost at the same negative level as in 2009.
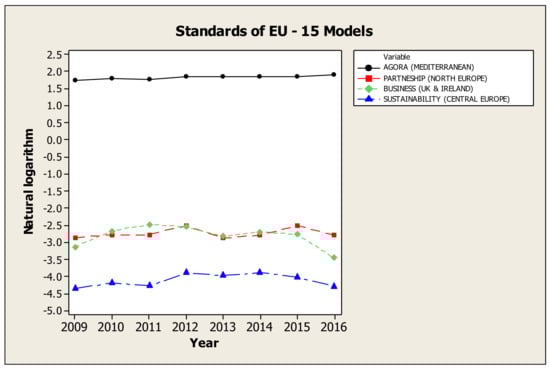
Figure 8.
Standards of European Regions.
Table 13.
Standards of European Regions.
According to the index that combines all of the above, as Figure 9 and Table 14, Portugal, despite of the initial negative levels and the second place, manage to draw ahead Spain in 2012 and remain in the first place despite its downward course since 2014. Greece and Italy, especially from 2012 and then, present significant fluctuations and, at the same time, a slight improvement in 2016 compared to their 2009 levels. Researches [6,25] confirm the first place of Spain until 2012 but they present Greece at the last place.
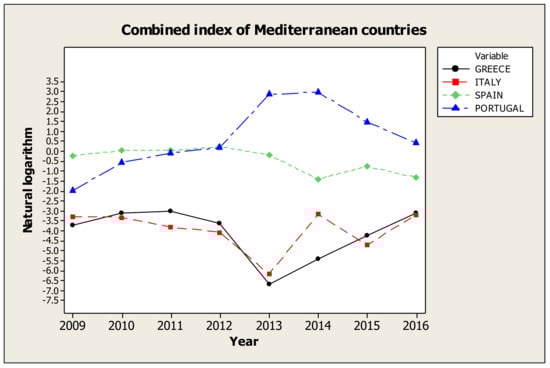
Figure 9.
Combined Index of Mediterranean Countries.
Table 14.
Combined Index of Mediterranean Countries.
As a Mediterranean region, as Figure 10 and Table 15, they are consistently in the second place, behind the northern European countries, with a negative sign from 2013 until 2015 and then a recovery effort is taking place. Even though Mediterranean countries were the latest to introduce CSR [10] they score higher than more developed and more sustainable economies. The Central European countries, although constantly in the last position, are steadily rising, but they need to move faster in order to reduce the distance. It is impressive that the countries of Central Europe, which role in the functioning of Europe is important, show very low levels of CSR.
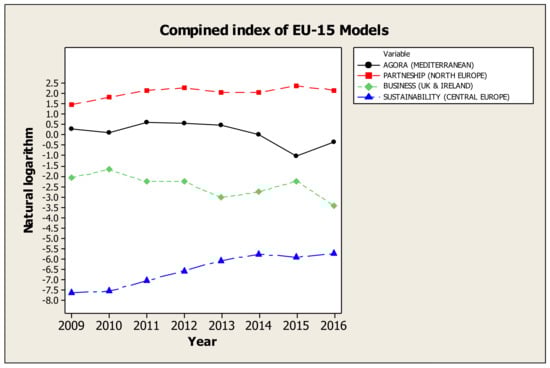
Figure 10.
Combined Index of European Regions.
Table 15.
Combined Index of Mediterranean Countries.
In order to analyze better the results of the new model indicator, one should take a look at the results of the individual indicators, as Table 16 and Table 17. There is a significant differentiation of the averages of the individual indicators for all the countries and regions. Portugal and Spain rank better than the other countries, but only Portugal is, according the new model index, at a positive level. Greece and Italy are not ranked in the first place in any single index, which shows that they need to be improved in all aspects of CSR. Italy, the largest economy in Mediterranean by GDP, except ISO and SA, that is Standards category, is on negative level. On the other hand, Greece, a small economy, is on positive level in a few indicators but at the last place in combined indicator, with small distance from Italy.
Table 16.
Indicators Average of Mediterranean Countries.
Table 17.
Indicators Average of European Regions.
As for the regions of Europe, the northern European countries have the best results, with a significant difference from the rest regions. The difference would be even greater if they had better results of the SA index. The Mediterranean has even a marginal positive sign due to positive performance in the ISO and SA indices and a future increase in Global 100 will improve the total level. On the contrary, Central European countries have a negative sign on all indicators. Large economies, expect of those in Northern, need to make decisions and to set effective policies in order to improve all aspects CSR and to reach smaller economies of Mediterranean.
6.2. Relation between CSR and Financial Performance
The findings of this sample of the Greek companies cannot lead to clear conclusions as they differentiate, depending on the evaluation indicator of the financial performance that being employed. In all inspection, there has been an equal inspection test of the two fluctuations and for the ROA and ROS indicators there is indication that no equality exists (p-value 0.00), for the ROE indicator the indications are not too strong (p-value 0.062).
Taking into consideration the ROA indicator of this sample, the “CSR Hellas” companies that employ good CSR practices show statistically important better financial performance (p-value 0.008) concerning their efficiency of their asset elements, as in Table 18.
Table 18.
Analysis of ROA.
The average efficiency of the elements of the Greek companies’ assets which employ good CSR practices are greater than the average of the asset elements of the Greek companies that do not employ in the Greek stock exchange market. With a 99% probability, this difference is from 0.71% and more, with a 95% probability the difference is 7.79%. The average efficiency of the asset elements of the “CSR Hellas” companies is 22.05% when the average efficiency of those companies that do not belong to it is negative and is −2.23%. 50% of the companies which follow the CSR policies have efficiency of their assets above 2.54% compared to the companies that do not do so, resulting in 50% efficiency of −0.35% and below.
Taking into consideration the ROS indicator and based on the current sample, we cannot claim that the average profit margin of the companies from the two categories is statistically different (p-value 0.438), as shown in Table 19. Therefore, the average profit margin of the companies that are members of the ‘CSR Hellas’ is up to 3.93% and statistically equal to the average profit margin of the companies that are not members is up to 2.93%. 50% of the companies that are “CSR Hellas” members have a margin of net profit over 3.61%, which is relatively close to the average, while on the contrary 50% of the non-member companies have a margin of net profit 0.47%, which is below the average. For the specific category of companies, there is a positive asymmetry and the greatest percentage of the companies is being accumulated in the lower rates of the variable.
Table 19.
Analysis of ROS.
Taking into account, the ROΕ indicator of the current sample, there are significant indications (p-value 0.016) that the average efficiency of the capitals of the member companies of the “CSR Hellas” are statistically greater that the average efficiency of the same capitals of the non-member companies, as shown in Table 20. With a 99% probability, this difference is up to 8.46% and more, with a probability of 95% the difference is 21.74% and over. The average efficiency of the same capitals of member companies of the “CSR Hellas” have an efficiency of 69.90% when the average efficiency of the same capitals of the non-member companies is fluctuated in negative signs and is −23.40%. 50% of the member companies have an efficiency of the same capitals over than 74.10%, which is slightly above the average, while 50% of the non-member companies have an efficiency up to 3.34%, which is higher than the average rate, mainly meaning that the largest percentage of the population from this category is being accumulated in the higher rates of the variable.
Table 20.
Analysis of ROE.
7. Conclusions
The aim has been by using only existing individual quantitative indicators and combining them, to record CSR and to examine the longitudinal evolution in the big Southern European counties of Greece, Italy, Spain and Portugal, taking into account the size of each country. The evidence has been used to compare the countries as well as to compare the geographic Mediterranean region where they belong in relation to the rest of the European countries. In addition, knowing the CSR index of Greece during the period of financial crisis, the aim has been to investigate the relation of CSR to the efficiency of the corporations and to find out whether the benefits of these practices are reflected in the financial performance.
Considering the limitations of examining only quantitative indicators, which have not been checked for their quality characteristics, the fact that is not taken into account the role and the actions of formal and informal institutions and that GDP is used to measuring the size and financial dynamic of each country, the results have confirmed the differentiation and variety of CSR among different areas, even among counties that belong to the same geographical region. At the same time, CSR is differentiating in the country during the course and it is necessary to examine the evolution of individual indicators that shape it. When referring to CSR one should be very specific about the aspect and dimension that been examined, as the differentiation among them might be significant and their occurrence might vary. Adopting CSR good practices and the implementation methods are shaped by the individual political-financial systems of the countries and by the social and cultural characteristics. Despite the variations in its appearance, the implementation of business ethics practices in daily operation of the enterprise that pertain to finance, investments, environment, employees and stakeholders, leads to a comprehensive depiction of CSR.
More specifically, combining individual indicators, Greece and Italy, two countries that are still at the center of attention when anyone refers to financial crisis, present very low levels and follow the same developmental course in time. The last place of these countries is confirmed by previous researches [6,25]. The quite low levels in Standards category and in Initiatives of Greece and Italy, respectively, show the first category that needs to be improved. Spain follows a steadier course but within negative levels, whereas Portugal shows a higher increase. Portugal seems to be the new leader in Mediterranean. If Spain and Portugal improve the level in Standards category their score will be higher in the future. The Mediterranean region should become aware of their ethical duties and responsibilities and must have the Northern European countries as a role model in order to escape from the roughly zero or negative levels so far and to edit their ethical practices. The very high score in Standards category and the positive level in Reporting, show that companies in Mediterranean do not take initiatives and do not innovate, but in contrast, try to discipline to guidelines and rules of organizations and their governments. Italy, the largest economy in Mediterranean by GDP, is just in a better position, with small distance, than Greece, the smallest economy of the area. At the same time, the Mediterranean is in a better position than larger economies in Europe. The examined countries can review the evolution over time of the individual indicators and the overall indicator in order to identify problems and to improve their weaknesses.
Considering the characteristics of “Agora” model [10], the longitudinal evolution of the aforementioned countries, both in individual indicators and in their combination, may be a very useful tool for constitutions, institutions and governments, which have an active role, in order to locate problems and shortages. At the same time, they can control the efficiency of their policies, so that they can have as model the other countries, those of Northern Europe, to make better decisions and to set effective practices. High scores of Northern Europe, which also are the best globally [6,25,39] show the right way to other countries. Possibly, the rise of CSR could be a step toward to the exit from the financial crisis, as that not only benefits society, not only externalizes the adoption of unwritten ethical rules in the implementation of corporate policy, but it also partly contributes to the improvement of their financial performance of those companies that adopt CSR.
Future studies should look for the appropriate combination of quantitative indicators that best represent each category of them and check for their significance. The challenge is to expand the proposal model of measuring CRS and the present methodology of statistical aggregation by using not only qualitative variables, but also and quantitative variables. By adding to the model qualitative features, such as quality of reports, legislature, education, government policies etc., which should be transformed to a comparable scale, weighing their importance, we will have a more spherical view of CSR. That will be a significant step to form a globally accepted CSR National indicator, that will contribute to the comparison among countries as well as to the following up of their longitudinal evolution. Finally, knowing CSR indices of the rest Mediterranean countries, researches may relate CSR to the financial performance of each country’s companies during the financial crisis.
Author Contributions
Conceptualization: I.Z., methodology: I.Z., formal analysis: I.Z., investigation: I.Z. and T.M., data preparation: I.Z. and T.M., writing—original draft preparation: I.Z., supervision: T.M., project administration: T.M., writing, review and editing: I.Z. and T.M. All authors have read and agreed to the published version of the manuscript.
Funding
This research received no external funding.
Institutional Review Board Statement
Not applicable.
Informed Consent Statement
Not applicable.
Data Availability Statement
Data derived from empirical research contacted by the authors.
Acknowledgments
Many thanks to all experts that participate on this study and to CSR Indicators’ data centers for providing the necessary data.
Conflicts of Interest
The authors declare no conflict of interest.
References
- Falck, O.; Heblich, S. Corporate social responsibility: Doing well by doing good. Bus. Horiz. 2007, 50, 247–254. [Google Scholar] [CrossRef]
- Melé, D. Corporate Social Responsibility Theories. In The Oxford Handbook of Corporate Social Responsibility; Crane, A., McWilliams, A., Matten, D., Moon, J., Siegel, D., Eds.; Oxford University Press: Oxford, UK, 2008; pp. 47–82. [Google Scholar]
- Bowen, H.R. Social Responsibilities of the Businessman; Harper & Row: New York, NY, USA, 1953. [Google Scholar]
- Dahlsrud, A. How Corporate Social Responsibility is defined: An Analysis of 37 Definitions. Corp. Soc. Responsib. Environ. Manag. 2008, 15, 1–13. [Google Scholar] [CrossRef]
- Argandona, A.; von Weltzien Hoivik, H. Corporate Social Responsibility: One Size Does Not Fit All. Collecting Evidence from Europe. J. Bus. Ethics 2009, 89, 221–234. [Google Scholar] [CrossRef] [Green Version]
- Gjølberg, M. Measuring the immeasurable? Constructing an index of CSR practices and CSR performance in 20 countries. Scand. J. Manag. 2008, 25, 10–22. [Google Scholar] [CrossRef] [Green Version]
- Matten, D.; Moon, J. Implicit and explicit CSR: A conceptual framework for a comparative understanding of corporate social responsibility. Acad. Manag. Rev. 2008, 33, 404–424. [Google Scholar] [CrossRef] [Green Version]
- Moon, J. Corporate Social Responsibility: A Very Short Introduction; Oxford University Press: Oxford, UK, 2014. [Google Scholar]
- Albareda, L.; Lozano, J.M.; Tencati, A.; Midttun, A.; Perrini, F. The changing role of governments in corporate social responsibility: Drivers and responses. Bus. Ethics Eur. Rev. 2018, 17, 347–363. [Google Scholar] [CrossRef]
- Albareda, L.; Lozano, J.; Ysa, T. Public policies on corporate social responsibility: The role of governments in Europe. J. Bus. Ethics 2007, 74, 391–407. [Google Scholar] [CrossRef]
- Clarkson, M.E. A stakeholder framework for analyzing and evaluating corporate social performance. Acad. Manag. Rev. 1995, 20, 92–117. [Google Scholar] [CrossRef]
- Campbell, L. Why Would Corporations Behave in Socially Responsible Ways? An Institutional Theory of Corporate Social Responsibility. Acad. Manag. Rev. 2007, 32, 946–967. [Google Scholar] [CrossRef]
- Maon, F.; Swain, V.; Lindgreen, A. One Vision, Different Paths: An Investigation of Corporate Social Responsibility Initiatives in Europe. J. Bus. Ethics 2017, 143, 405–422. [Google Scholar] [CrossRef] [Green Version]
- Metaxas, T.; Tsavdaridou, M. Corporate social responsibility in Greece during the crisis period. J. Adv. Res. Manag. 2013, 7, 20–34. [Google Scholar]
- Aguinis, H.; Glavas, A. What we know and don’t know about Corporate Social Responsibility: A review and research agenda. J. Manag. 2021, 18, 932–968. [Google Scholar] [CrossRef] [Green Version]
- Rossouw, G.J. A Global Comparative Analysis of the Global Survey of Business Ethics. J. Bus. Ethics 2011, 104, 93–101. [Google Scholar] [CrossRef]
- Goel, M.; Ramanathan, P.E. Business Ethics and Corporate Social Responsibility—Is there a dividing line? Procedia Econ. Financ. 2014, 11, 49–59. [Google Scholar] [CrossRef] [Green Version]
- Sheehy, B. Defining CSR: Problems and Solution. J. Bus. Ethics 2015, 131, 625–648. [Google Scholar] [CrossRef]
- Singer, A.E. Corporate political activity, Social responsibility, and competitive strategy: An integrative model. Bus. Ethics Eur. Rev. 2013, 22, 308–324. [Google Scholar] [CrossRef]
- Goodpaster, K.E. Business Ethics and Stakeholder Analysis. Bus. Ethics Q. 1991, 1, 53–75. [Google Scholar] [CrossRef]
- Lantos, G.P. The boundaries of strategic corporate social responsibility. J. Consum. Mark. 2001, 18, 595–630. [Google Scholar] [CrossRef]
- Rahman, S. Evaluation of Definitions: Ten Dimensions of Corporate Social Responsibility. World Rev. Bus. Res. 2011, 1, 166–176. [Google Scholar]
- Sirgy, M.J. Measuring Corporate Performance by Building on the Stakeholders Model of Business Ethics. J. Bus. Ethics 2002, 35, 143–162. [Google Scholar] [CrossRef]
- Carroll, A.B. Commentary and an Overview of Key Questions on Corporate Social Performance Measurement. Bus. Soc. 2000, 39, 466–478. [Google Scholar] [CrossRef]
- Skouloudis, A.; Isaac, D.; Evaggelinos, K. Revisiting the national corporate social responsibility index. Int. J. Sustain. Dev. World Ecol. 2016, 23, 61–70. [Google Scholar] [CrossRef] [Green Version]
- Amor-Esteban, V.; Galindo-Villardón, M.P.; García-Sánchez, I.M. Useful information for stakeholder engagement: A multivariate proposal of an Industrial Corporate Social Responsibility Practices Index. Sustain. Dev. 2018, 26, 620–637. [Google Scholar] [CrossRef]
- Waddock, S.A.; Graves, S.B. The corporate social performance—financial performance link. Strateg. Manag. J. 1997, 18, 303–319. [Google Scholar] [CrossRef]
- Wood, D.J. Measuring Corporate Social Performance: A Review. Int. J. Manag. Rev. 2010, 12, 50–84. [Google Scholar] [CrossRef]
- Habisch, A.; Jonker, J.; Wegner, M.; Schmidpeter, R. Corporate Social Responsibility across Europe; Springer: Berlin, Germany, 2005. [Google Scholar]
- Soana, M.G. The relationship between corporate social performance and corporate financial performance in the banking sector. J. Bus. Ethics 2011, 104, 133–148. [Google Scholar] [CrossRef]
- Maignan, I.; Ralston, D.A. Corporate social responsibility in Europe and the US: Insights from businesses’ self-representations. J. Int. Bus. Stud. 2002, 33, 497–514. [Google Scholar] [CrossRef]
- Chapple, W.; Moon, J. Corporate social responsibility in Asia: A seven-country study of CSR website reporting. Bus. Soc. 2005, 44, 415–441. [Google Scholar] [CrossRef] [Green Version]
- Vitell, S.J.; Paolillo, J.G.P. A cross-cultural study of the antecedents of the perceived role of ethics and social responsibility. Bus. Ethics Eur. Rev. 2004, 13, 185–199. [Google Scholar] [CrossRef]
- Turker, D. Measuring Corporate Social Responsibility: A scale development study. J. Bus. Ethics 2009, 85, 411–427. [Google Scholar] [CrossRef]
- Boesso, G.; Kumar, K. Stakeholder prioritization and reporting: Evidence from Italy and the US. Acc. Forum 2009, 33, 162–175. [Google Scholar] [CrossRef]
- Kourula, A. Corporate engagement with non-governmental organizations in different institutional contexts—A case study of a forest products company. J. World Bus. 2010, 45, 395–404. [Google Scholar] [CrossRef]
- Jackson, G.; Apostolakou, A. Corporate Social Responsibility in Western Europe: An Institutional Mirror or Substitute? J. Bus. Ethics 2010, 94, 371–394. [Google Scholar] [CrossRef]
- Midttun, A.; Gautesen, K.; Gjølberg, M. The political economy of CSR in Western Europe. Corp. Gov. Int. J. Bus. Soc. 2006, 6, 369–385. [Google Scholar] [CrossRef]
- Amor-Esteban, V.; Galindo-Villardón, M.P.; García-Sánchez, I.M. A Multivariate Proposal for a National Corporate Social Responsibility Practices Index (NCSRPI) for International Settings. Soc. Indic. Res. 2019, 143, 525–560. [Google Scholar] [CrossRef]
- Amor-Esteban, V.; Galindo-Villardón, M.P.; García-Sánchez, I.M.; David, F. An extension of the industrial corporate social responsibility practices index: New information for stakeholder engagement under a multivariate approach. Corp. Soc. Responsib. Environ. Manag. 2018, 27, 125–140. [Google Scholar] [CrossRef]
- Karagiorgos, T. Corporate Social Responsibility and Financial Performance: An Empirical Analysis on Greek Companies. Eur. Res. Stud. 2010, 13, 86–108. [Google Scholar] [CrossRef] [Green Version]
- Margolis, J.D.; Walsh, J.P. Misery Loves Companies: Rethinking Social Initiatives by Business. Adm. Sci. Q. 2003, 48, 268–305. [Google Scholar] [CrossRef] [Green Version]
- Mercedes, R.F. Social responsibility and financial performance: The role of good corporate governance. Bus. Res. Q. 2016, 19, 137–151. [Google Scholar]
- Van Beurden, P.; Gössling, T. The worth of values: A literature review on the relation between corporate social and financial performance. J. Bus. Ethics 2008, 82, 407–424. [Google Scholar] [CrossRef] [Green Version]
- Choi, J.; Kwak, Y.; Choe, C. Corporate social responsibility and corporate financial performance: Evidence from Korea. Aust. J. Manag. 2010, 35, 291–311. [Google Scholar] [CrossRef] [Green Version]
- Wahba, H. Does the Market Value Corporate Environmental Responsibility? An Empirical Examination. Corp. Soc. Responsib. Environ. Manag. 2008, 15, 89–99. [Google Scholar] [CrossRef]
- Wang, H.D. Corporate social performance and financial based brand equity. J. Prod. Brand Manag. 2010, 19, 335–345. [Google Scholar] [CrossRef]
- Wood, D.J.; Jones, R.E. Stakeholder mismatching: A theoretical problem in empirical research on corporate social performance. Int. J. Organ. Anal. 2005, 3, 229–267. [Google Scholar] [CrossRef]
- Brammer, S.; Brooks, C.; Pavelin, S. Corporate Social Performance and Stock Returns: UK Evidence from Disaggregate Measures. Financ. Manag. 2006, 35, 97–116. [Google Scholar] [CrossRef] [Green Version]
- McWilliams, A.; Siegel, D. Corporate social responsibility and financial performance: Correlation or misspecification? Strateg. Manag. J. 2000, 21, 603–609. [Google Scholar] [CrossRef]
- López, M.V.; Garcia, A.; Rodriguez, L. Sustainable development and corporate performance: A study based on the Dow Jones Sustainability Index. J. Bus. Ethics 2007, 75, 285–300. [Google Scholar] [CrossRef]
- Mittal, K.R.; Sinha, N.; Singh, N. Current research development: An analysis of linkage between economic value added and corporate social responsibility. Manag. Decis. 2008, 46, 1437–1443. [Google Scholar] [CrossRef]
- Karaibrahimoglu, Y.Z. Corporate social responsibility in times of financial Crisis. Afr. J. Bus. Manag. 2010, 4, 382–389. [Google Scholar]
- Charitoudi, G.; Giannarakis, G.; Lazarides, T. Corporate Social Responsibility performance in periods of financial crisis. Eur. J. Sci. Res. 2011, 63, 447–455. [Google Scholar]
- Elsayed, K.; Paton, D. The impact of environmental performance on firm performance: Static and dynamic panel data evidence. Struct. Chang. Econ. Dyn. 2005, 16, 395–412. [Google Scholar] [CrossRef]
- Zhao, Z.Y.; Zhao, X.J.; Davidson, K.; Zuo, J. A corporate social responsibility indicator system for construction enterprises. J. Clean. Prod. 2012, 29–30, 277–289. [Google Scholar] [CrossRef]
- Branco, M.C.; Rodrigues, L.L. Factors Influencing Social Responsibility Disclosure by Portuguese Companies. J. Bus. Ethics 2008, 83, 685–701. [Google Scholar] [CrossRef]
- Snedecor, G.W.; Cochran, W.G. Statistical Methods, 8th ed.; Iowa State University Press: Ames, IA, USA, 1989. [Google Scholar]
- Griffin, J.J.; Mahon, J.F. The Corporate Social Performance and Corporate Financial Performance Debate: Twenty-Five Years of Incomparable Research. Bus. Soc. 1997, 36, 5–31. [Google Scholar] [CrossRef]
- Artiach, T.; Lee, D.; Nelson, D.; Walker, J. The determinants of corporate sustainability performance. Account. Financ. 2010, 50, 31–51. [Google Scholar] [CrossRef]
- CSR Hellas. Available online: http://www.csrhellas.org (accessed on 15 January 2019).
- Hellenic Capital Market Commission. Available online: http://www.hcmc.gr (accessed on 20 January 2019).
Publisher’s Note: MDPI stays neutral with regard to jurisdictional claims in published maps and institutional affiliations. |
© 2021 by the authors. Licensee MDPI, Basel, Switzerland. This article is an open access article distributed under the terms and conditions of the Creative Commons Attribution (CC BY) license (https://creativecommons.org/licenses/by/4.0/).