
A Crash Injury Model Involving Autonomous Vehicle: Investigating of Crash and Disengagement Reports


Abstract
:1. Introduction
2. Literature Review
2.1. Existing Crash Severity Models and Their Limitations in AV Deployed Scenario
2.2. Previous Studies Employing CA DMV Data
3. Study Area and Data Description
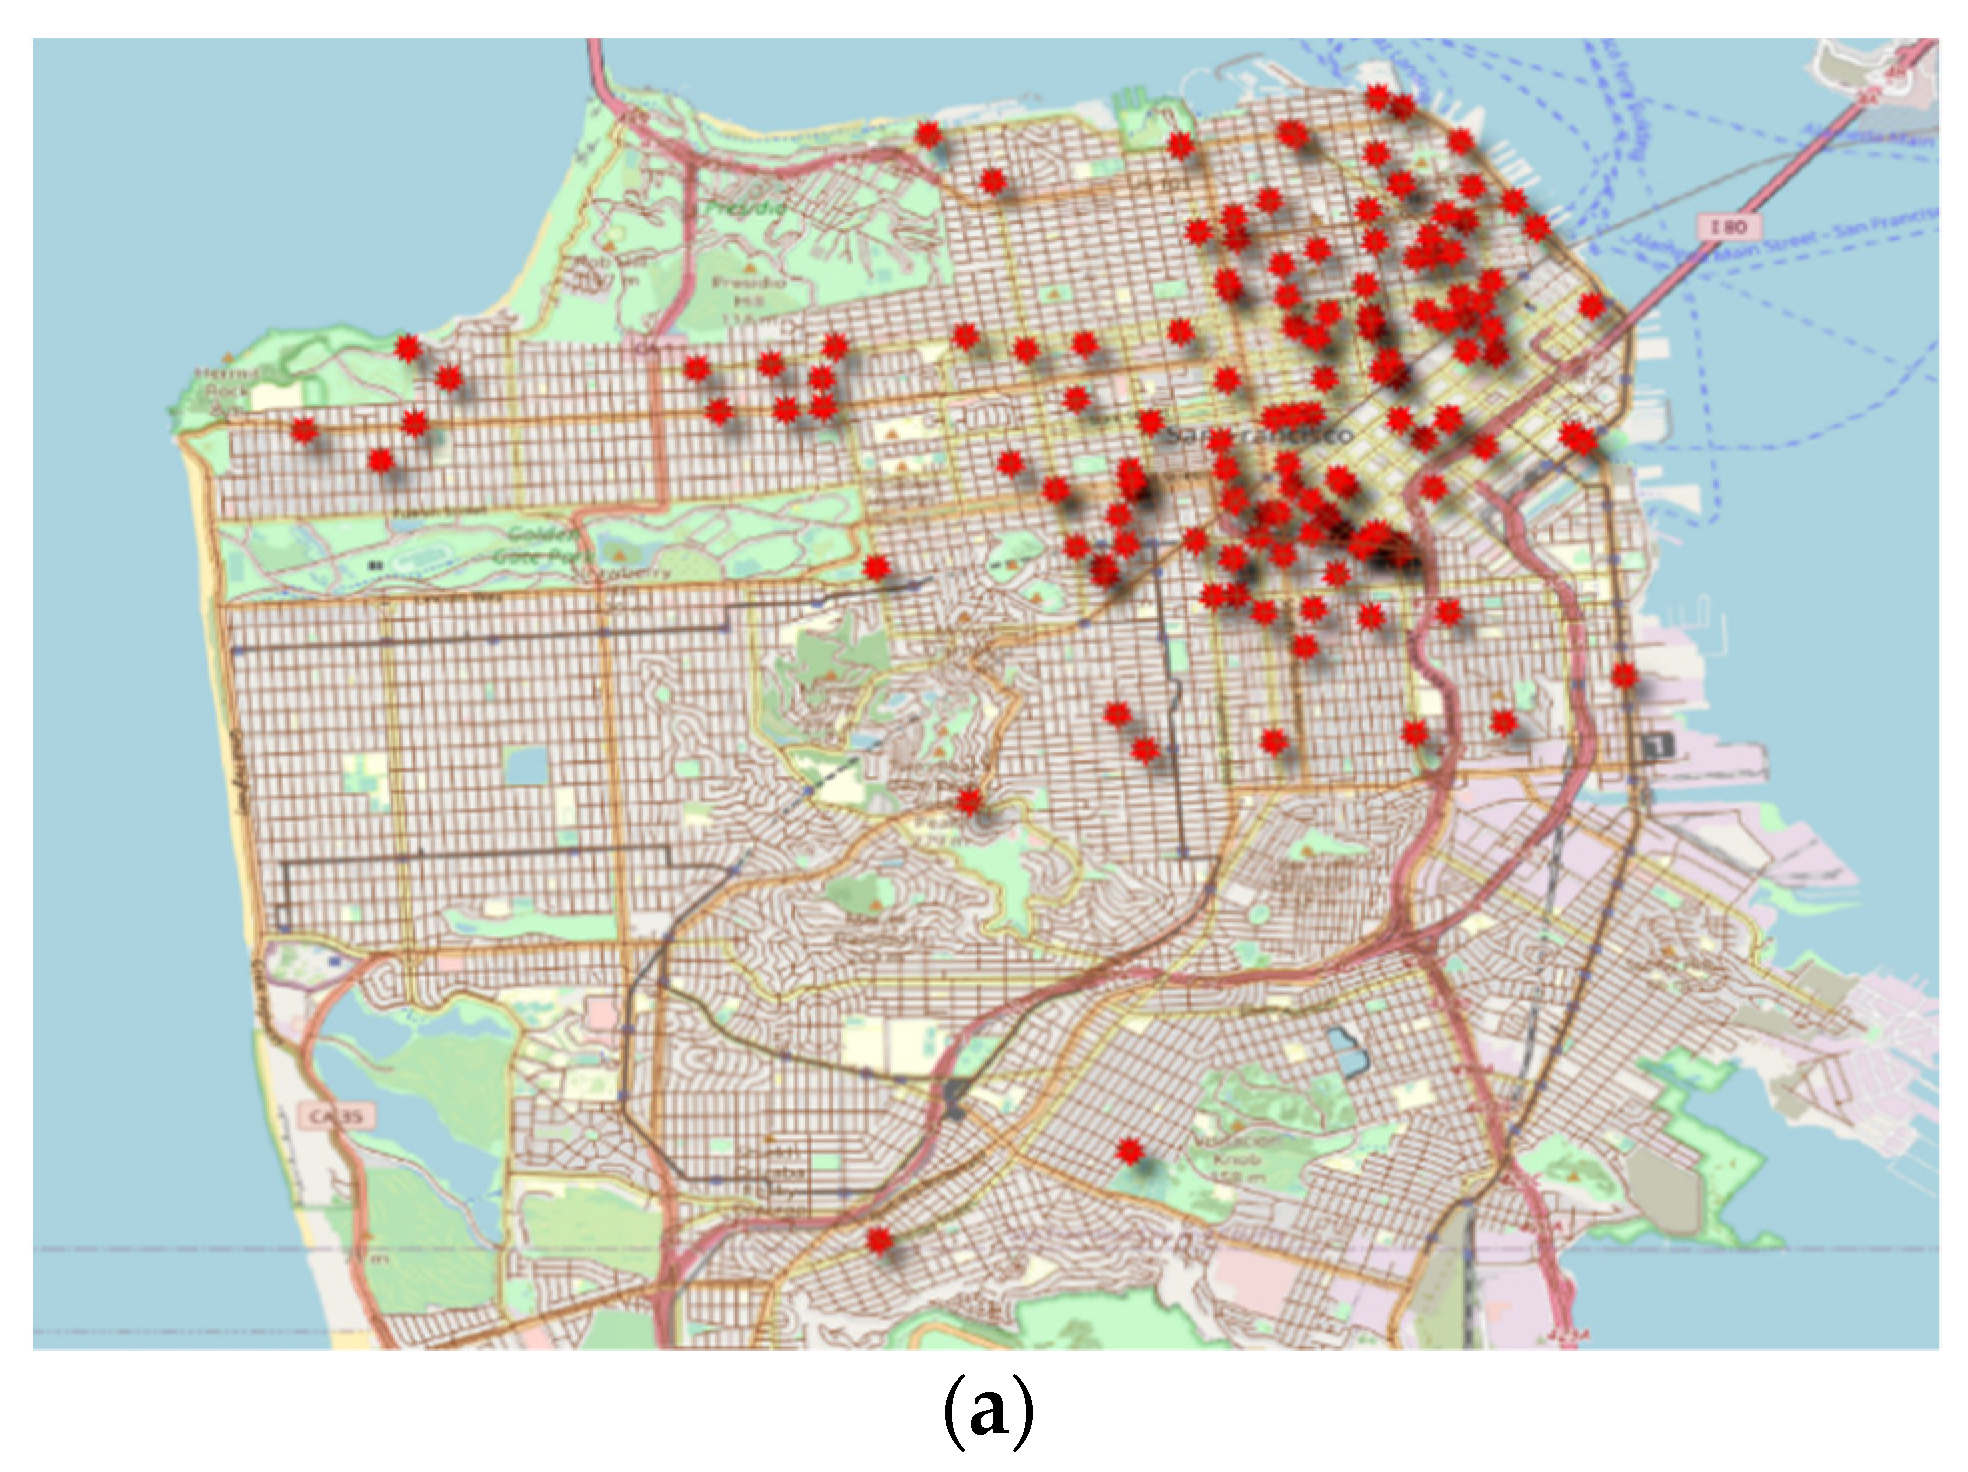
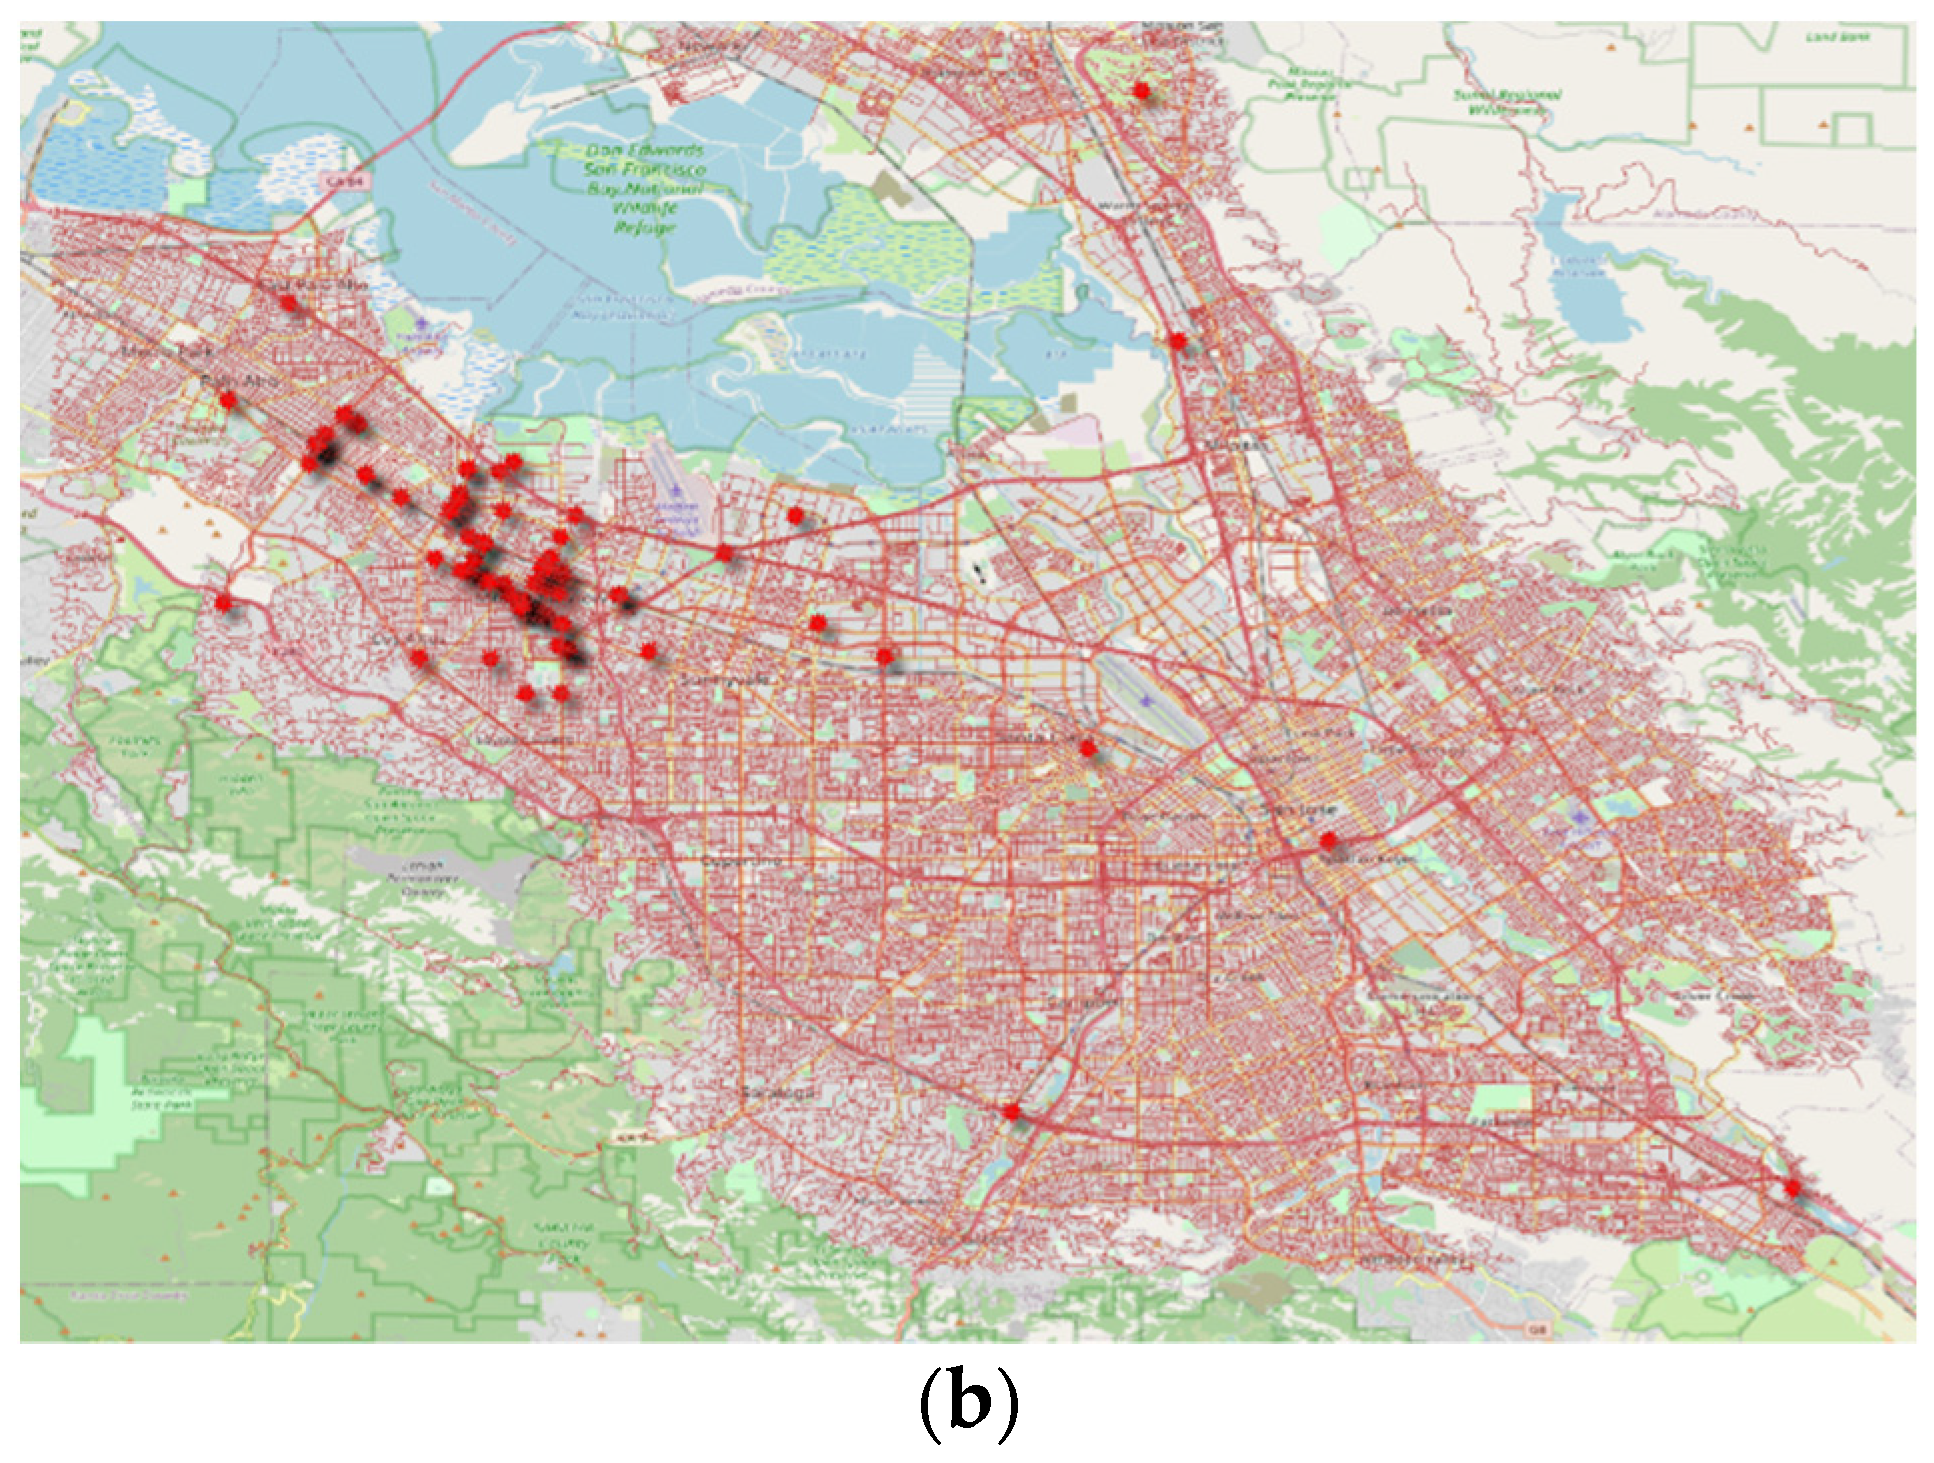
3.1. Study Area
3.2. Data Description
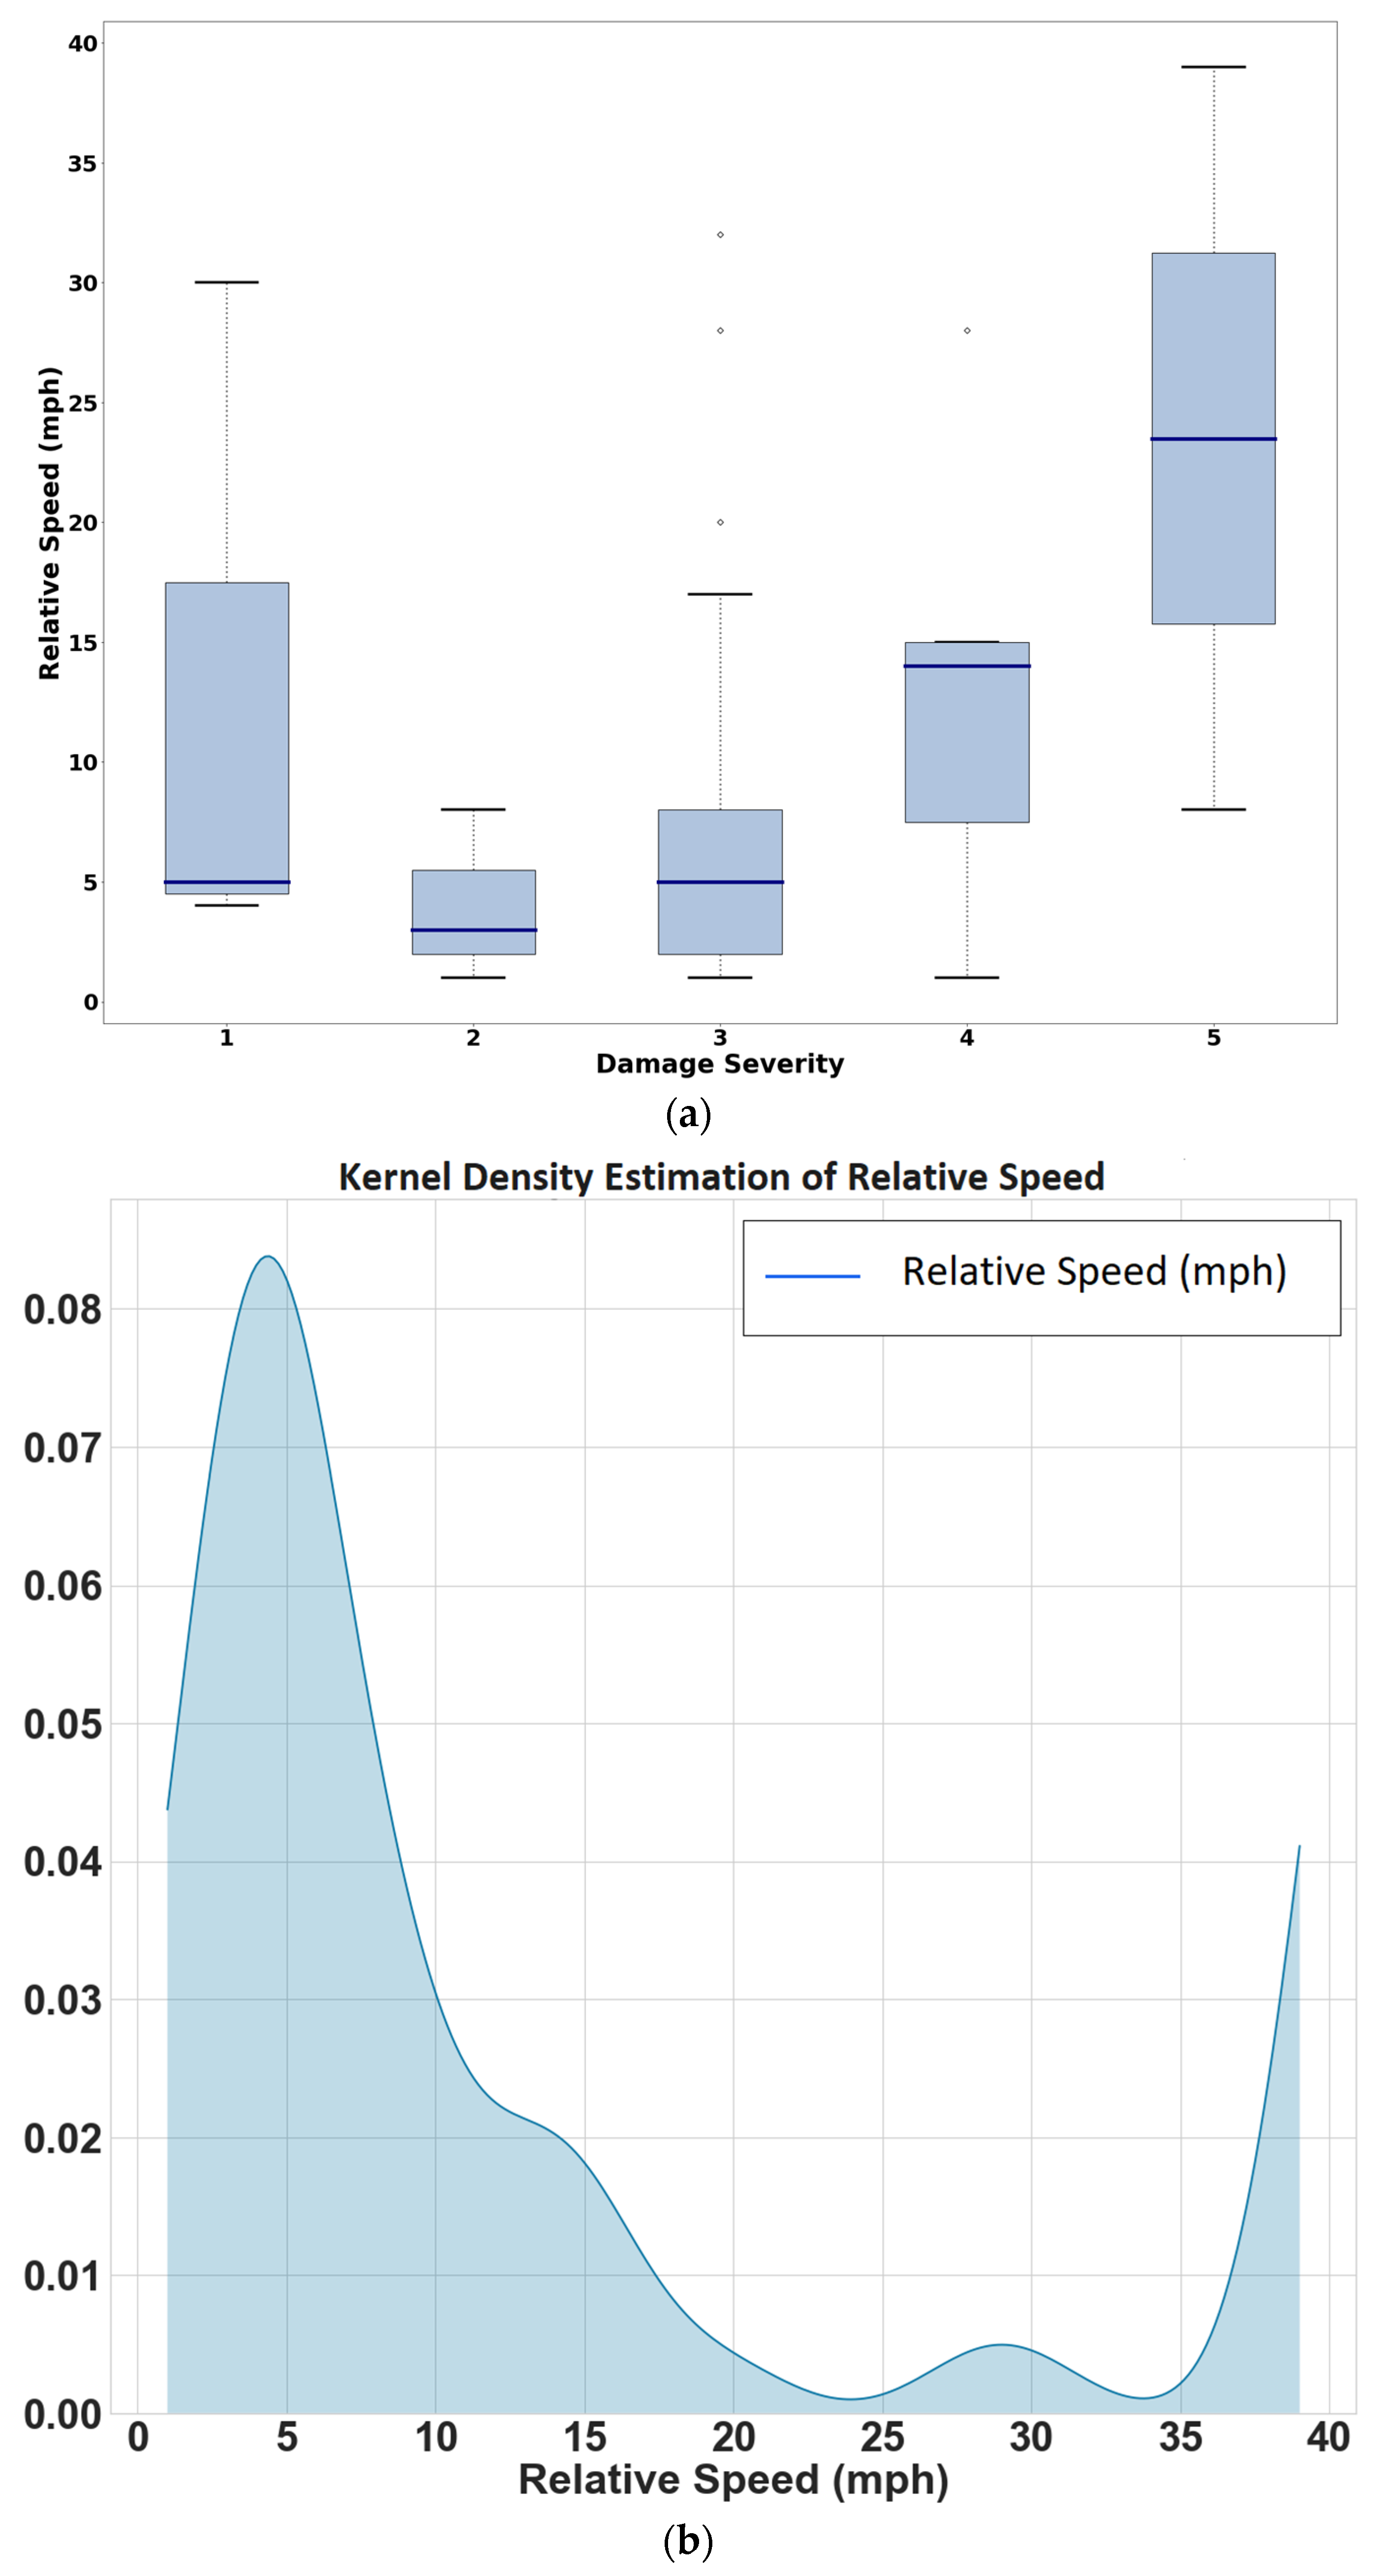
- The observed damage severity levels sustained by autonomous vehicles during the examination period have the following distribution: no damage (7.14%); minor damage (71.43%); moderate damage (20.41%); major damage (1.02%).
- Vehicle type is the representation of vehicle size derived from the vehicle model stated in the reports. “Two wheels” type refers to vehicles with two wheels such as bikes, motorcycles, and scooters. Subcompact and compact cars are slightly smaller than mid-size cars with an inside volume between 2.4 m3 and 3.1 m3 by combining cargo and passenger volume. Mid-size vehicles are identified as possessing an interior volume of between 3.1 m3 and 3.4 m3. The last category is large vehicles, which represents trucks and buses in this study.
4. Data Analysis and Crash Model Formulation
4.1. Crashes
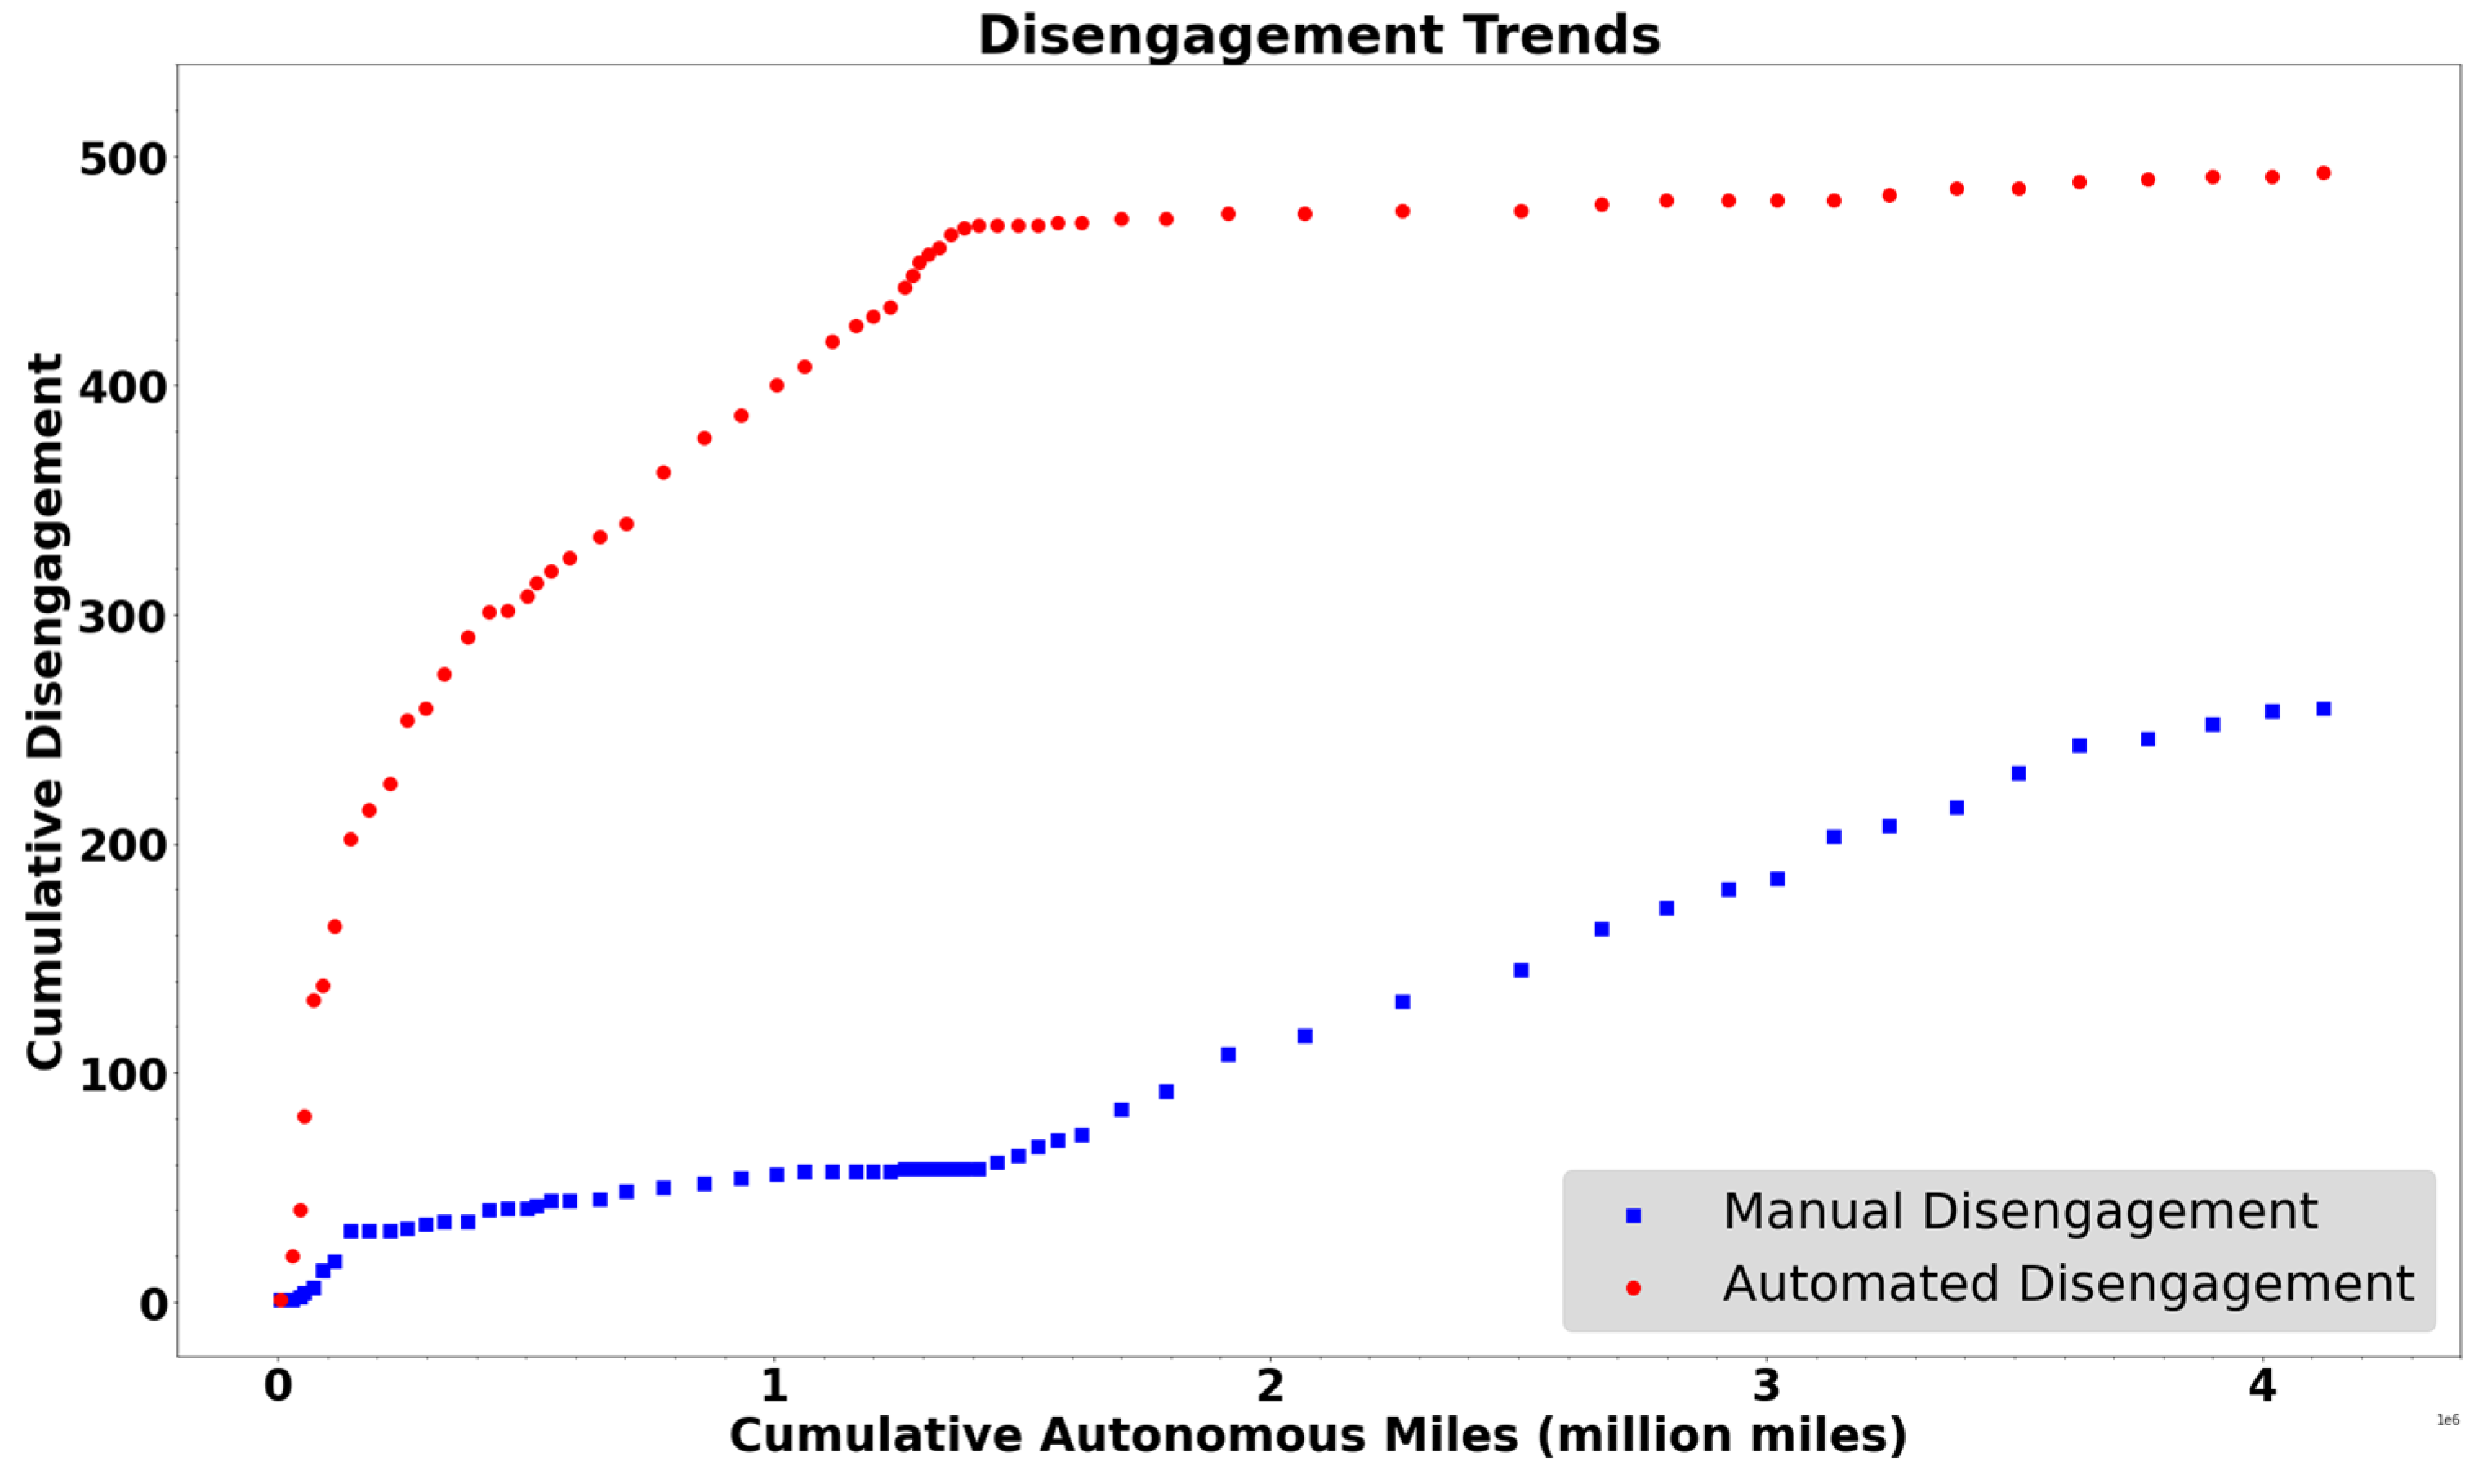
4.2. Disengagements
4.3. Models
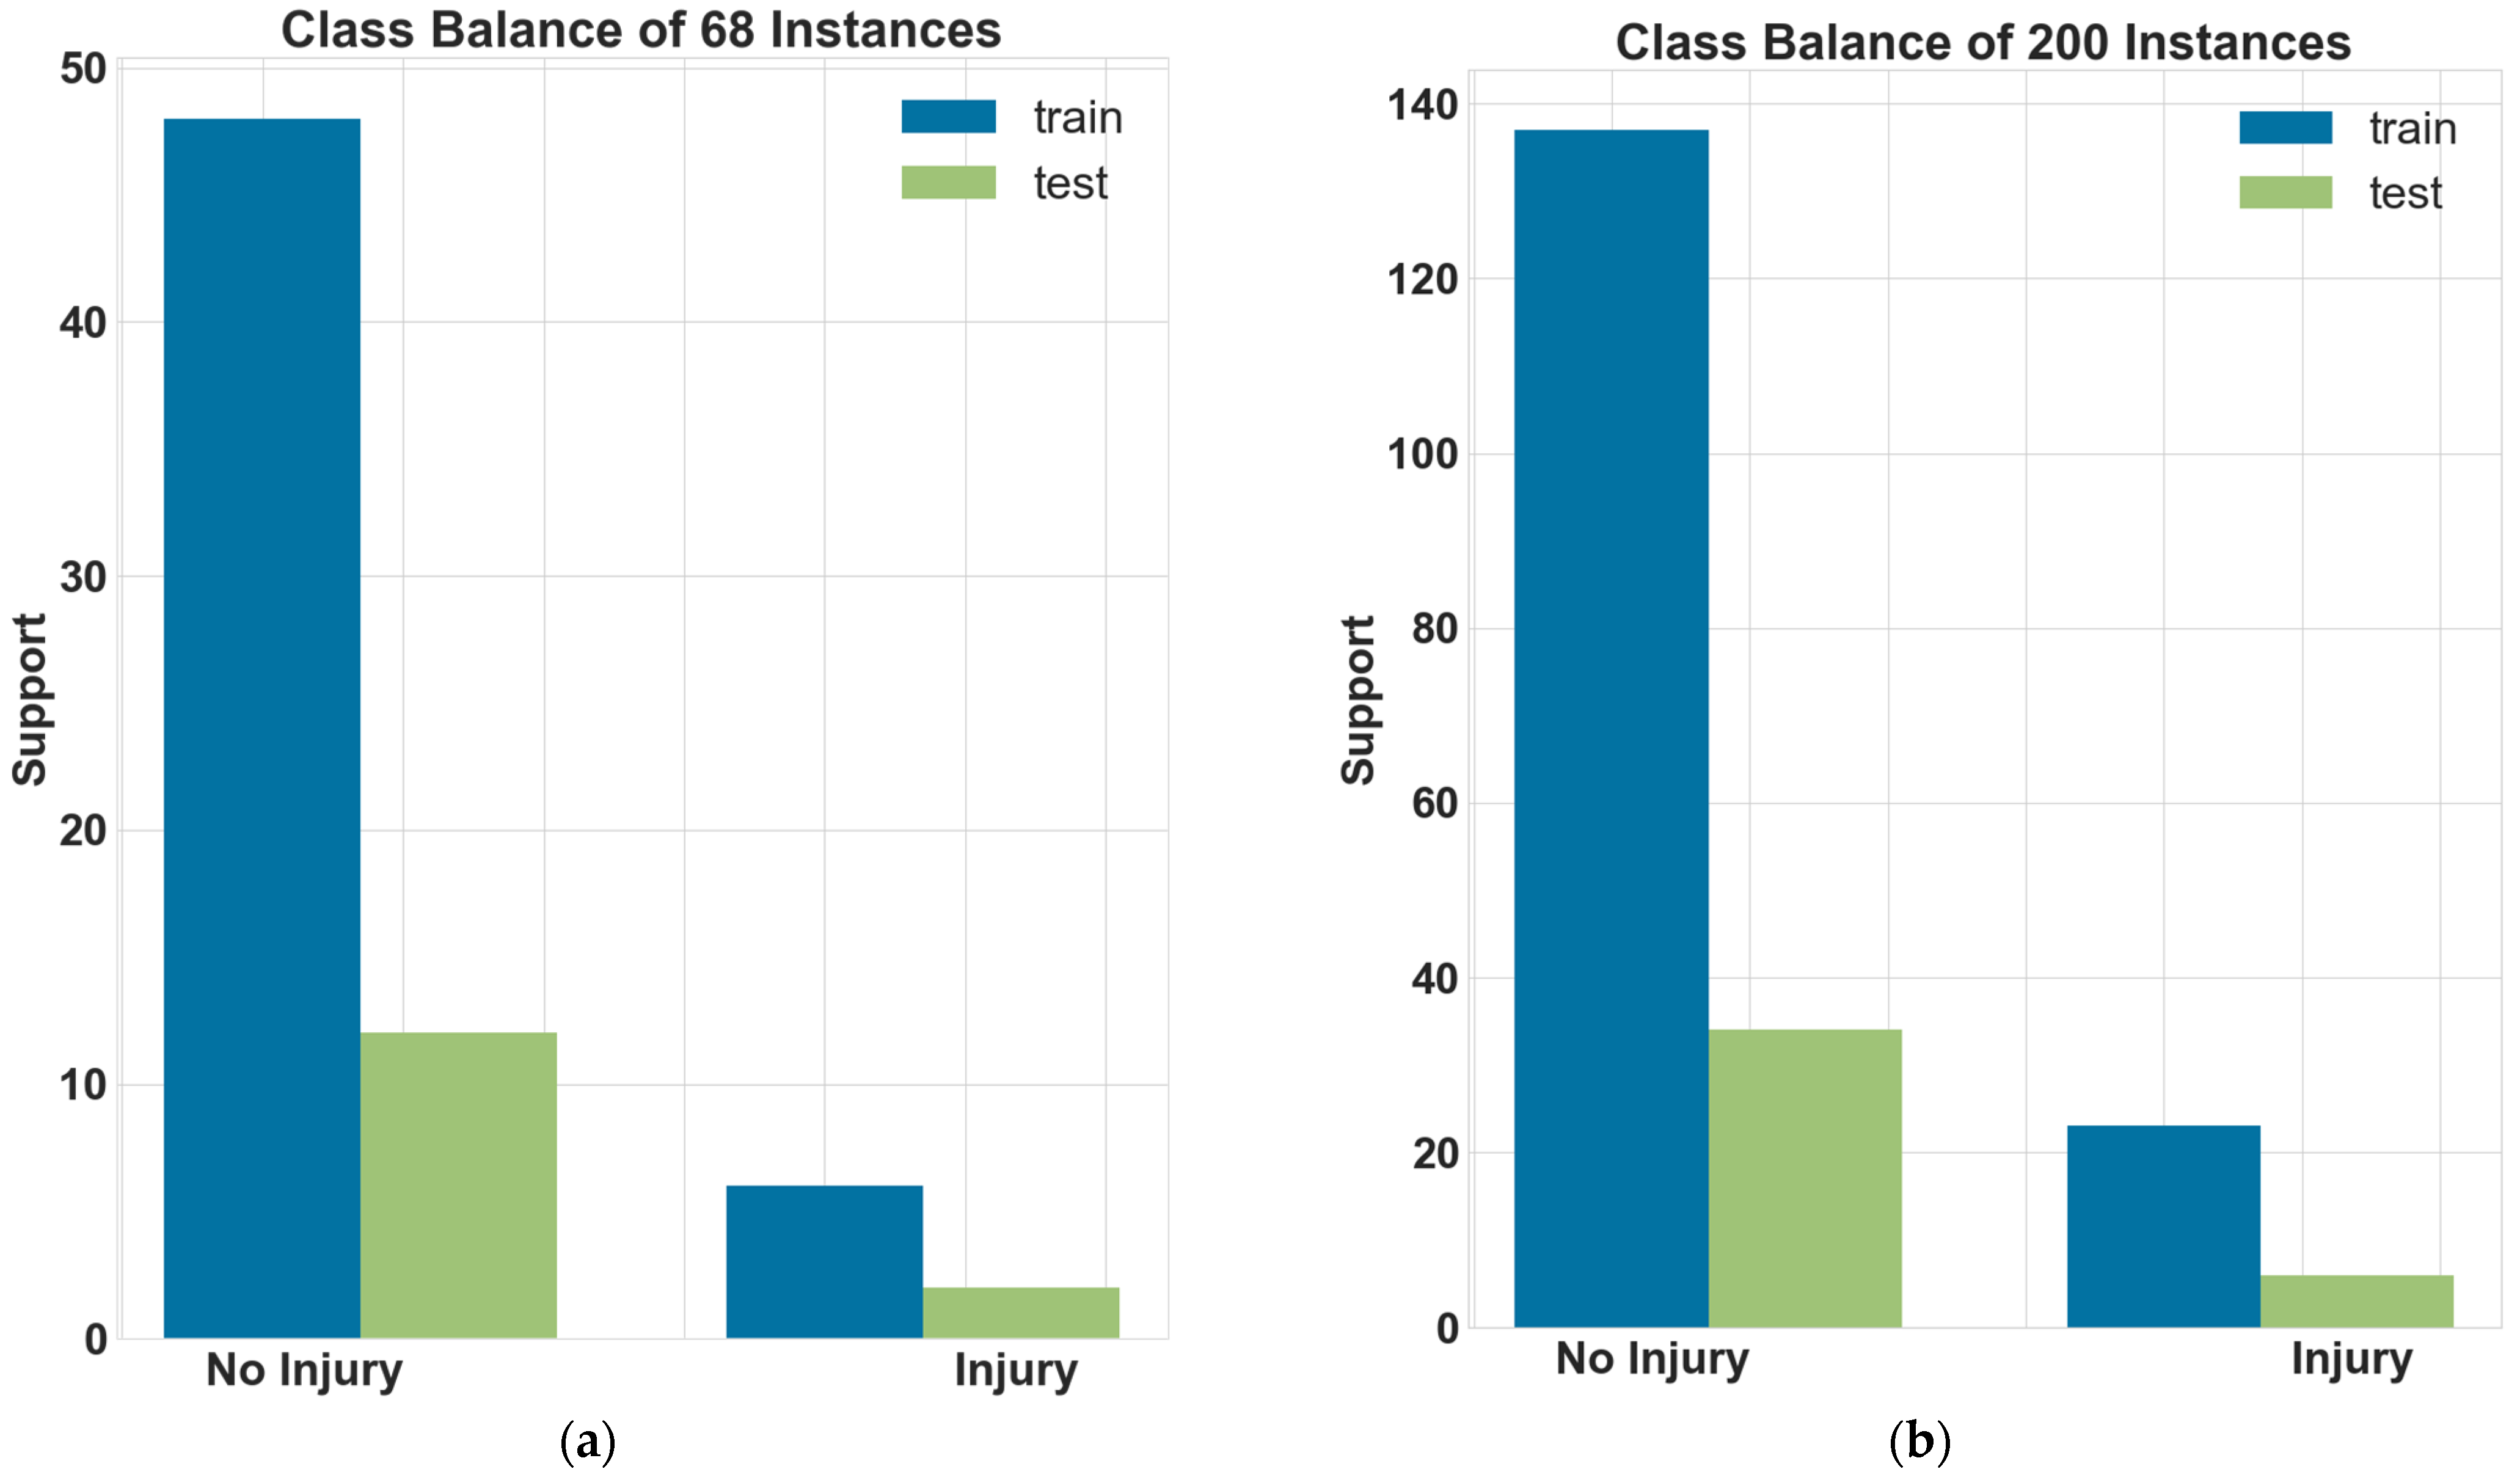
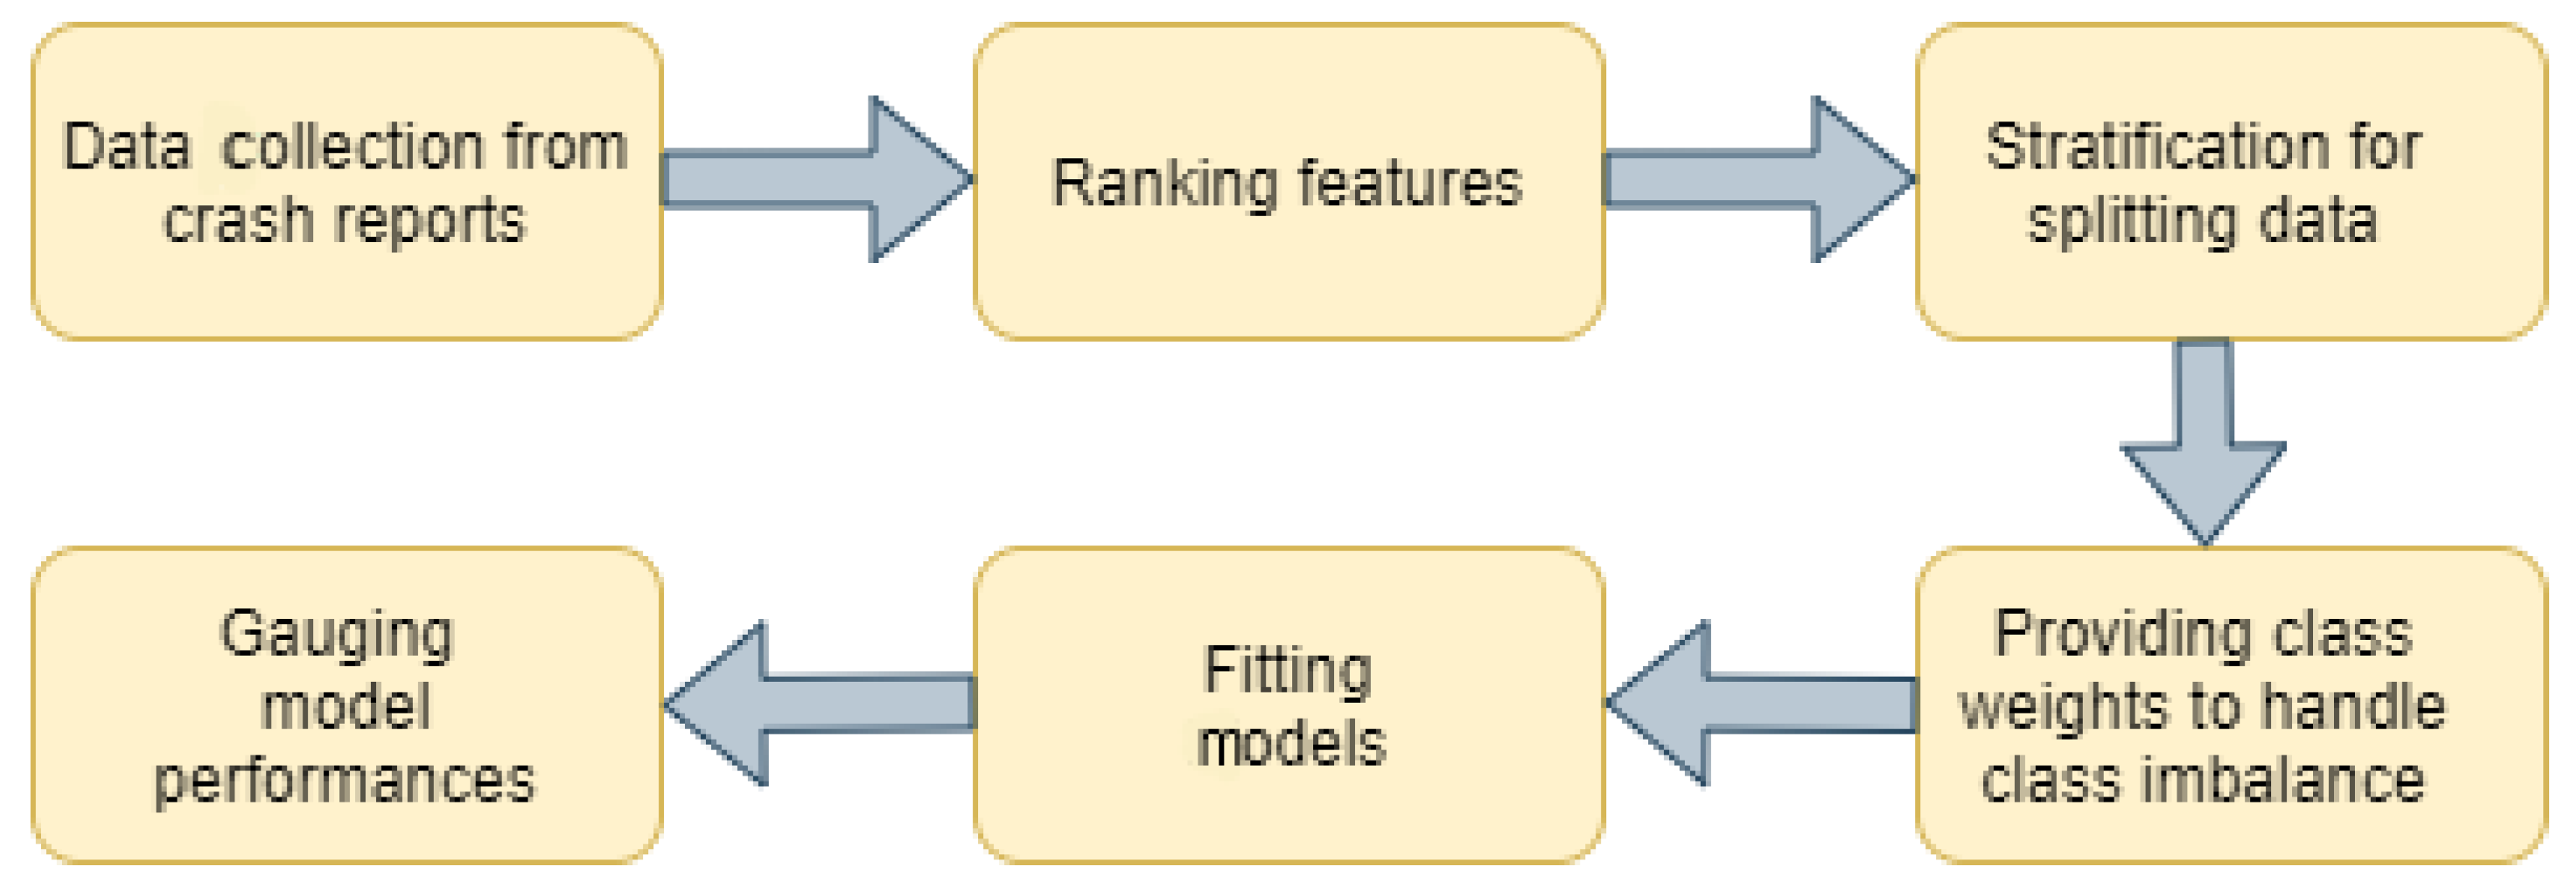
4.3.1. Methodology and Data Brief
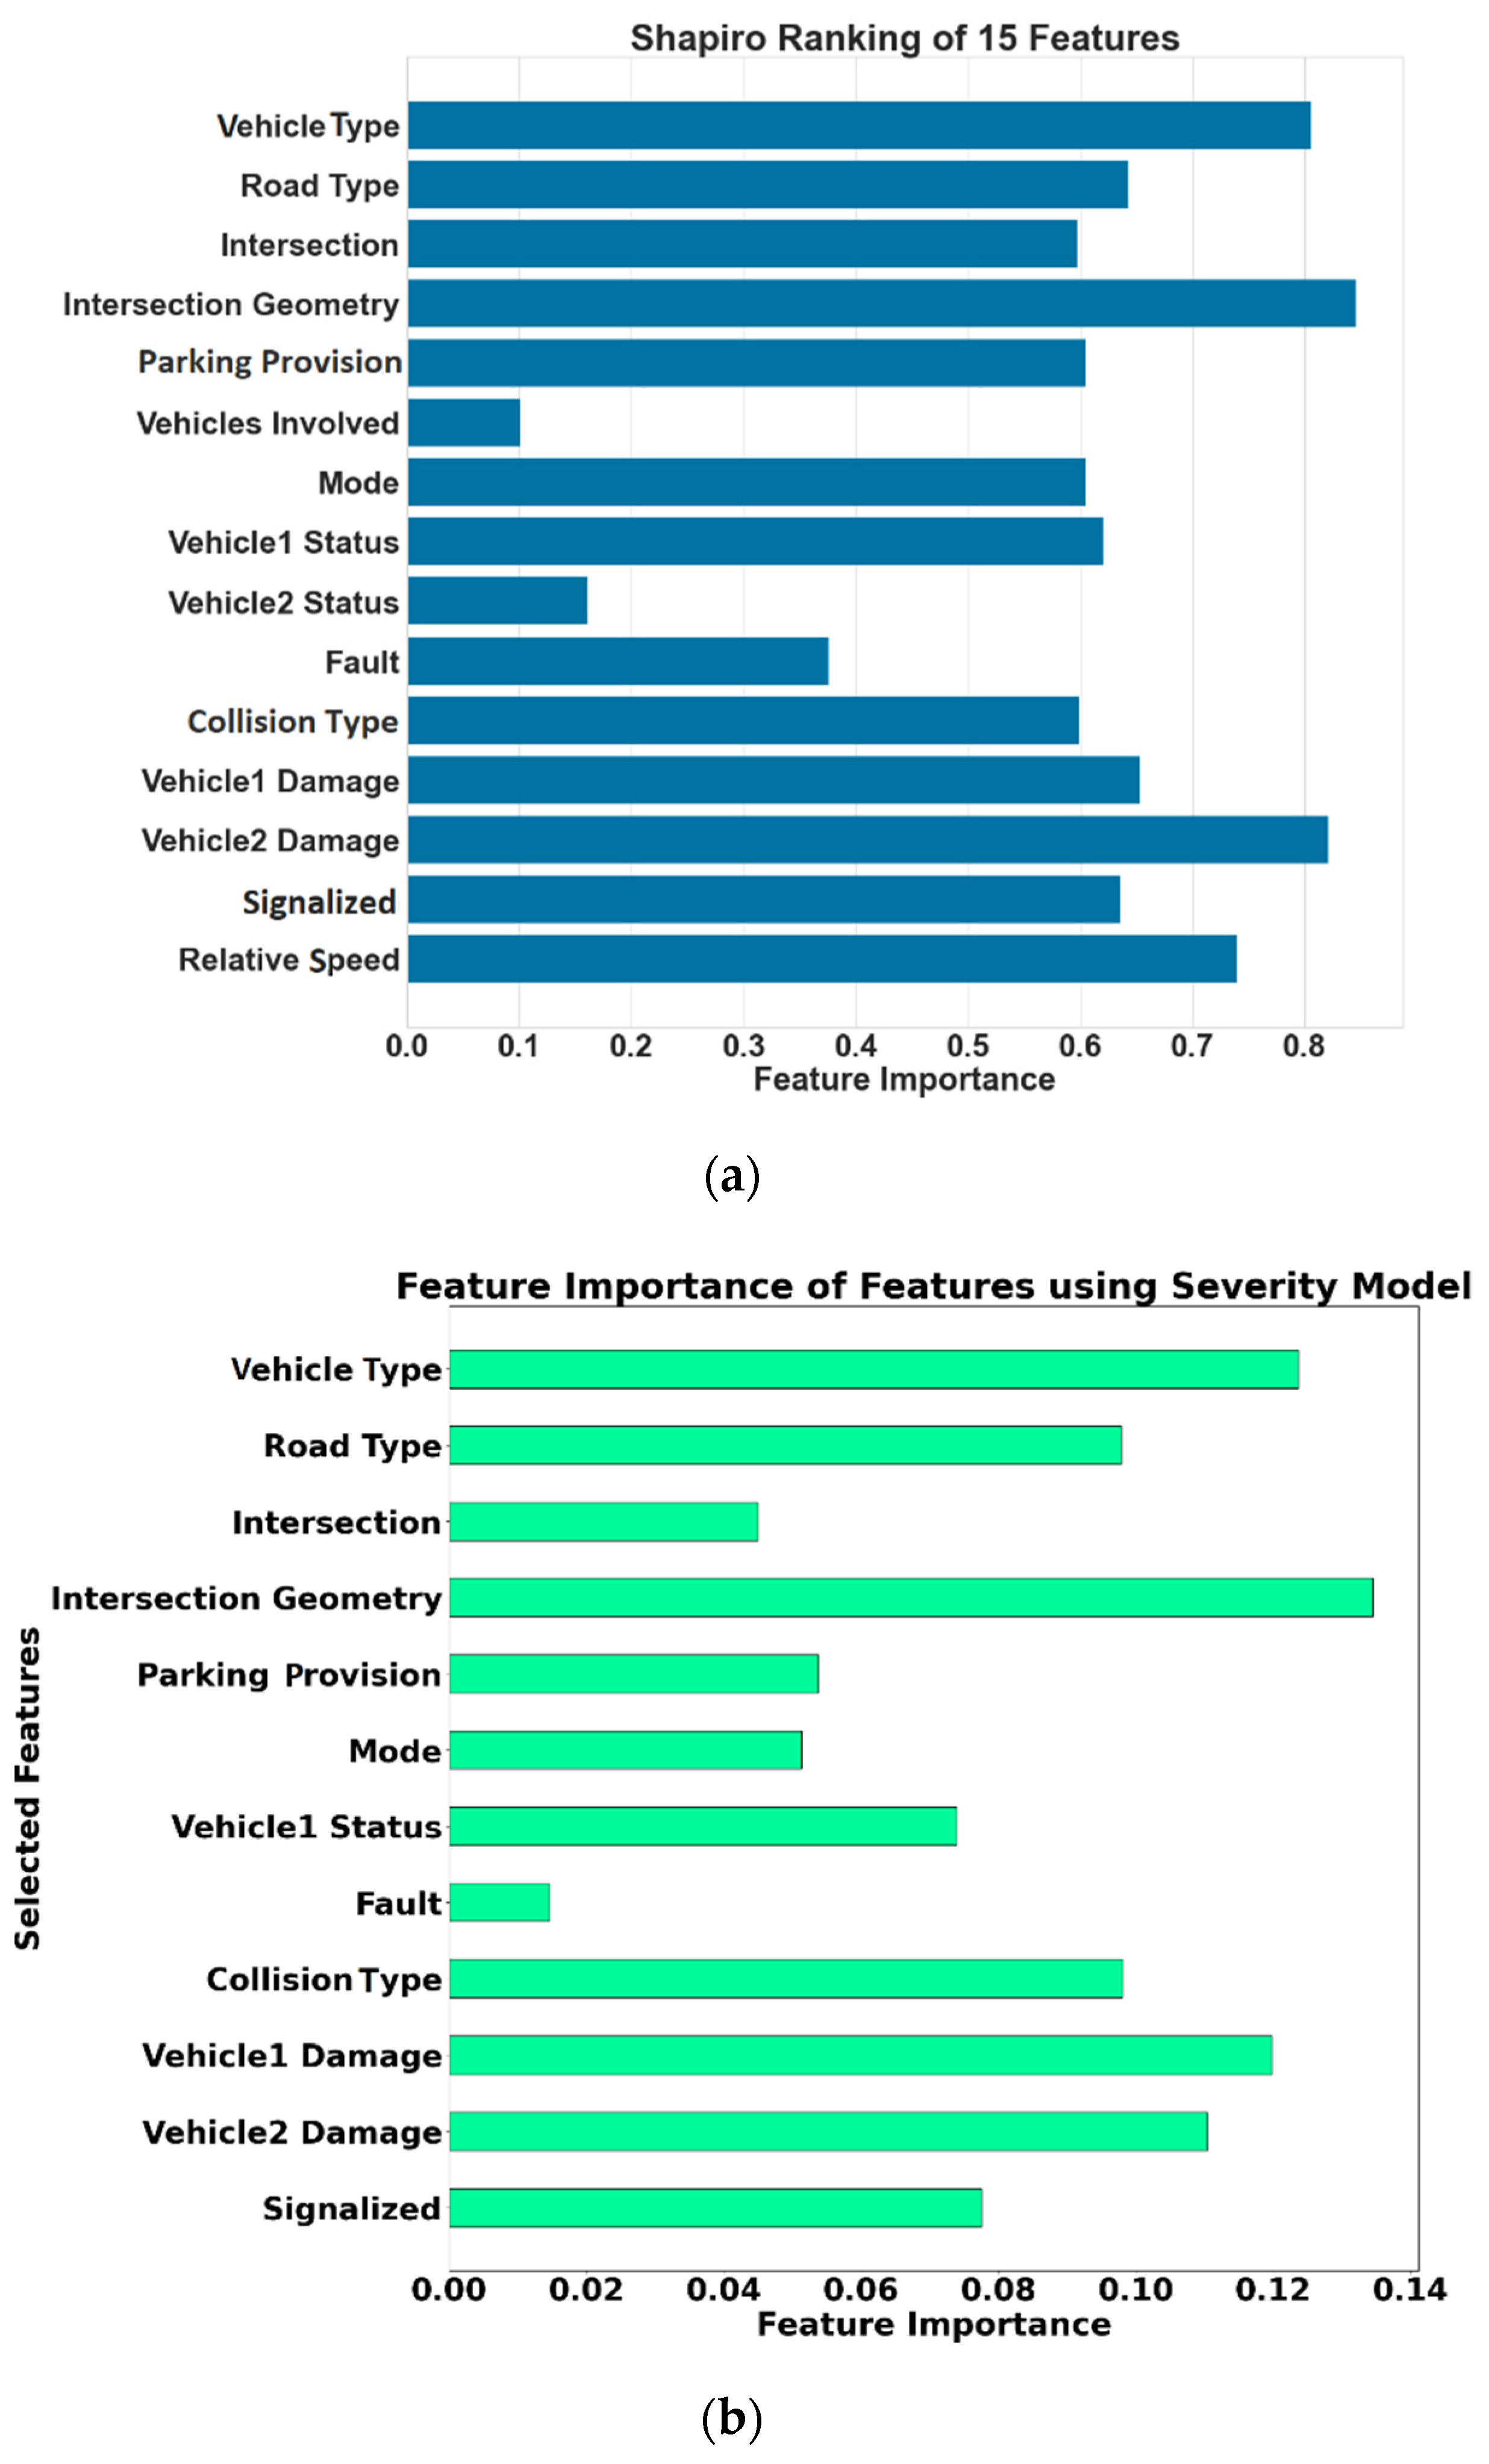
4.3.2. Crash Severity Model
5. Concluding Remarks and Future Work
Author Contributions
Funding
Institutional Review Board Statement
Informed Consent Statement
Data Availability Statement
Acknowledgments
Conflicts of Interest
Appendix A
Appendix A.1. Performance Comparison of Different Models

| Models | Balanced Accuracy | Confusion Matrix | Evaluation Metric | |||||||||
|---|---|---|---|---|---|---|---|---|---|---|---|---|
| TP | FP | FN | TN | FPR | FDR | FOR | Precision | Recall | F1 | Adjusted F1 Score | ||
| Decision Tree | 0.62 | 32 | 3 | 4 | 2 | 0.60 | 0.09 | 0.67 | 0.91 | 0.89 | 0.45 | 0.91 |
| Decision Tree with Weights | 0.51 | 30 | 5 | 5 | 1 | 0.83 | 0.14 | 0.83 | 0.86 | 0.86 | 0.43 | 0.86 |
| Bagging Classfier | 0.65 | 34 | 1 | 4 | 2 | 0.33 | 0.03 | 0.67 | 0.97 | 0.89 | 0.47 | 0.96 |
| Balanced Bagging Classifier | 0.59 | 24 | 11 | 3 | 3 | 0.79 | 0.31 | 0.50 | 0.69 | 0.89 | 0.39 | 0.72 |
| Random Forest | 0.57 | 34 | 1 | 5 | 1 | 0.50 | 0.03 | 0.83 | 0.97 | 0.87 | 0.46 | 0.95 |
| Balanced Random Forest Classifier | 0.38 | 21 | 14 | 5 | 1 | 0.93 | 0.40 | 0.83 | 0.60 | 0.81 | 0.34 | 0.63 |
| Easy Ensemble Classifier | 0.73 | 16 | 19 | 0 | 6 | 0.76 | 0.54 | 0.00 | 0.46 | 1.00 | 0.31 | 0.51 |
| RUSboost Classfier | 0.73 | 22 | 13 | 1 | 5 | 0.72 | 0.37 | 0.17 | 0.63 | 0.96 | 0.38 | 0.67 |
| Extra Trees Classifier | 0.62 | 32 | 3 | 4 | 2 | 0.60 | 0.09 | 0.67 | 0.91 | 0.89 | 0.45 | 0.91 |
Appendix A.2. Variables Used in the Modelling
| Vehicle Type | Vehicles Involved | Collision Type |
|---|---|---|
| Road Type | Mode | Vehicle1 Damage |
| Intersection | Vehicle1 Status | Vehicle2 Damage |
| Intersection Geometry | Vehicle2 Status | Signalized |
| Parking Provision | Fault | Relative Speed |
Appendix A.3. Methodology
| Parameters | Assignment |
|---|---|
| Base Estimator | Decision Tree Classifier |
| n_estimators (the number of base estimators in th ensemble) | 20 |
| random_state | 0 |
| max_samples, max_features, bootstrap, bootstrap_features, oob_score, warm_start, n_jobs, verbose | Default values as in [42] |
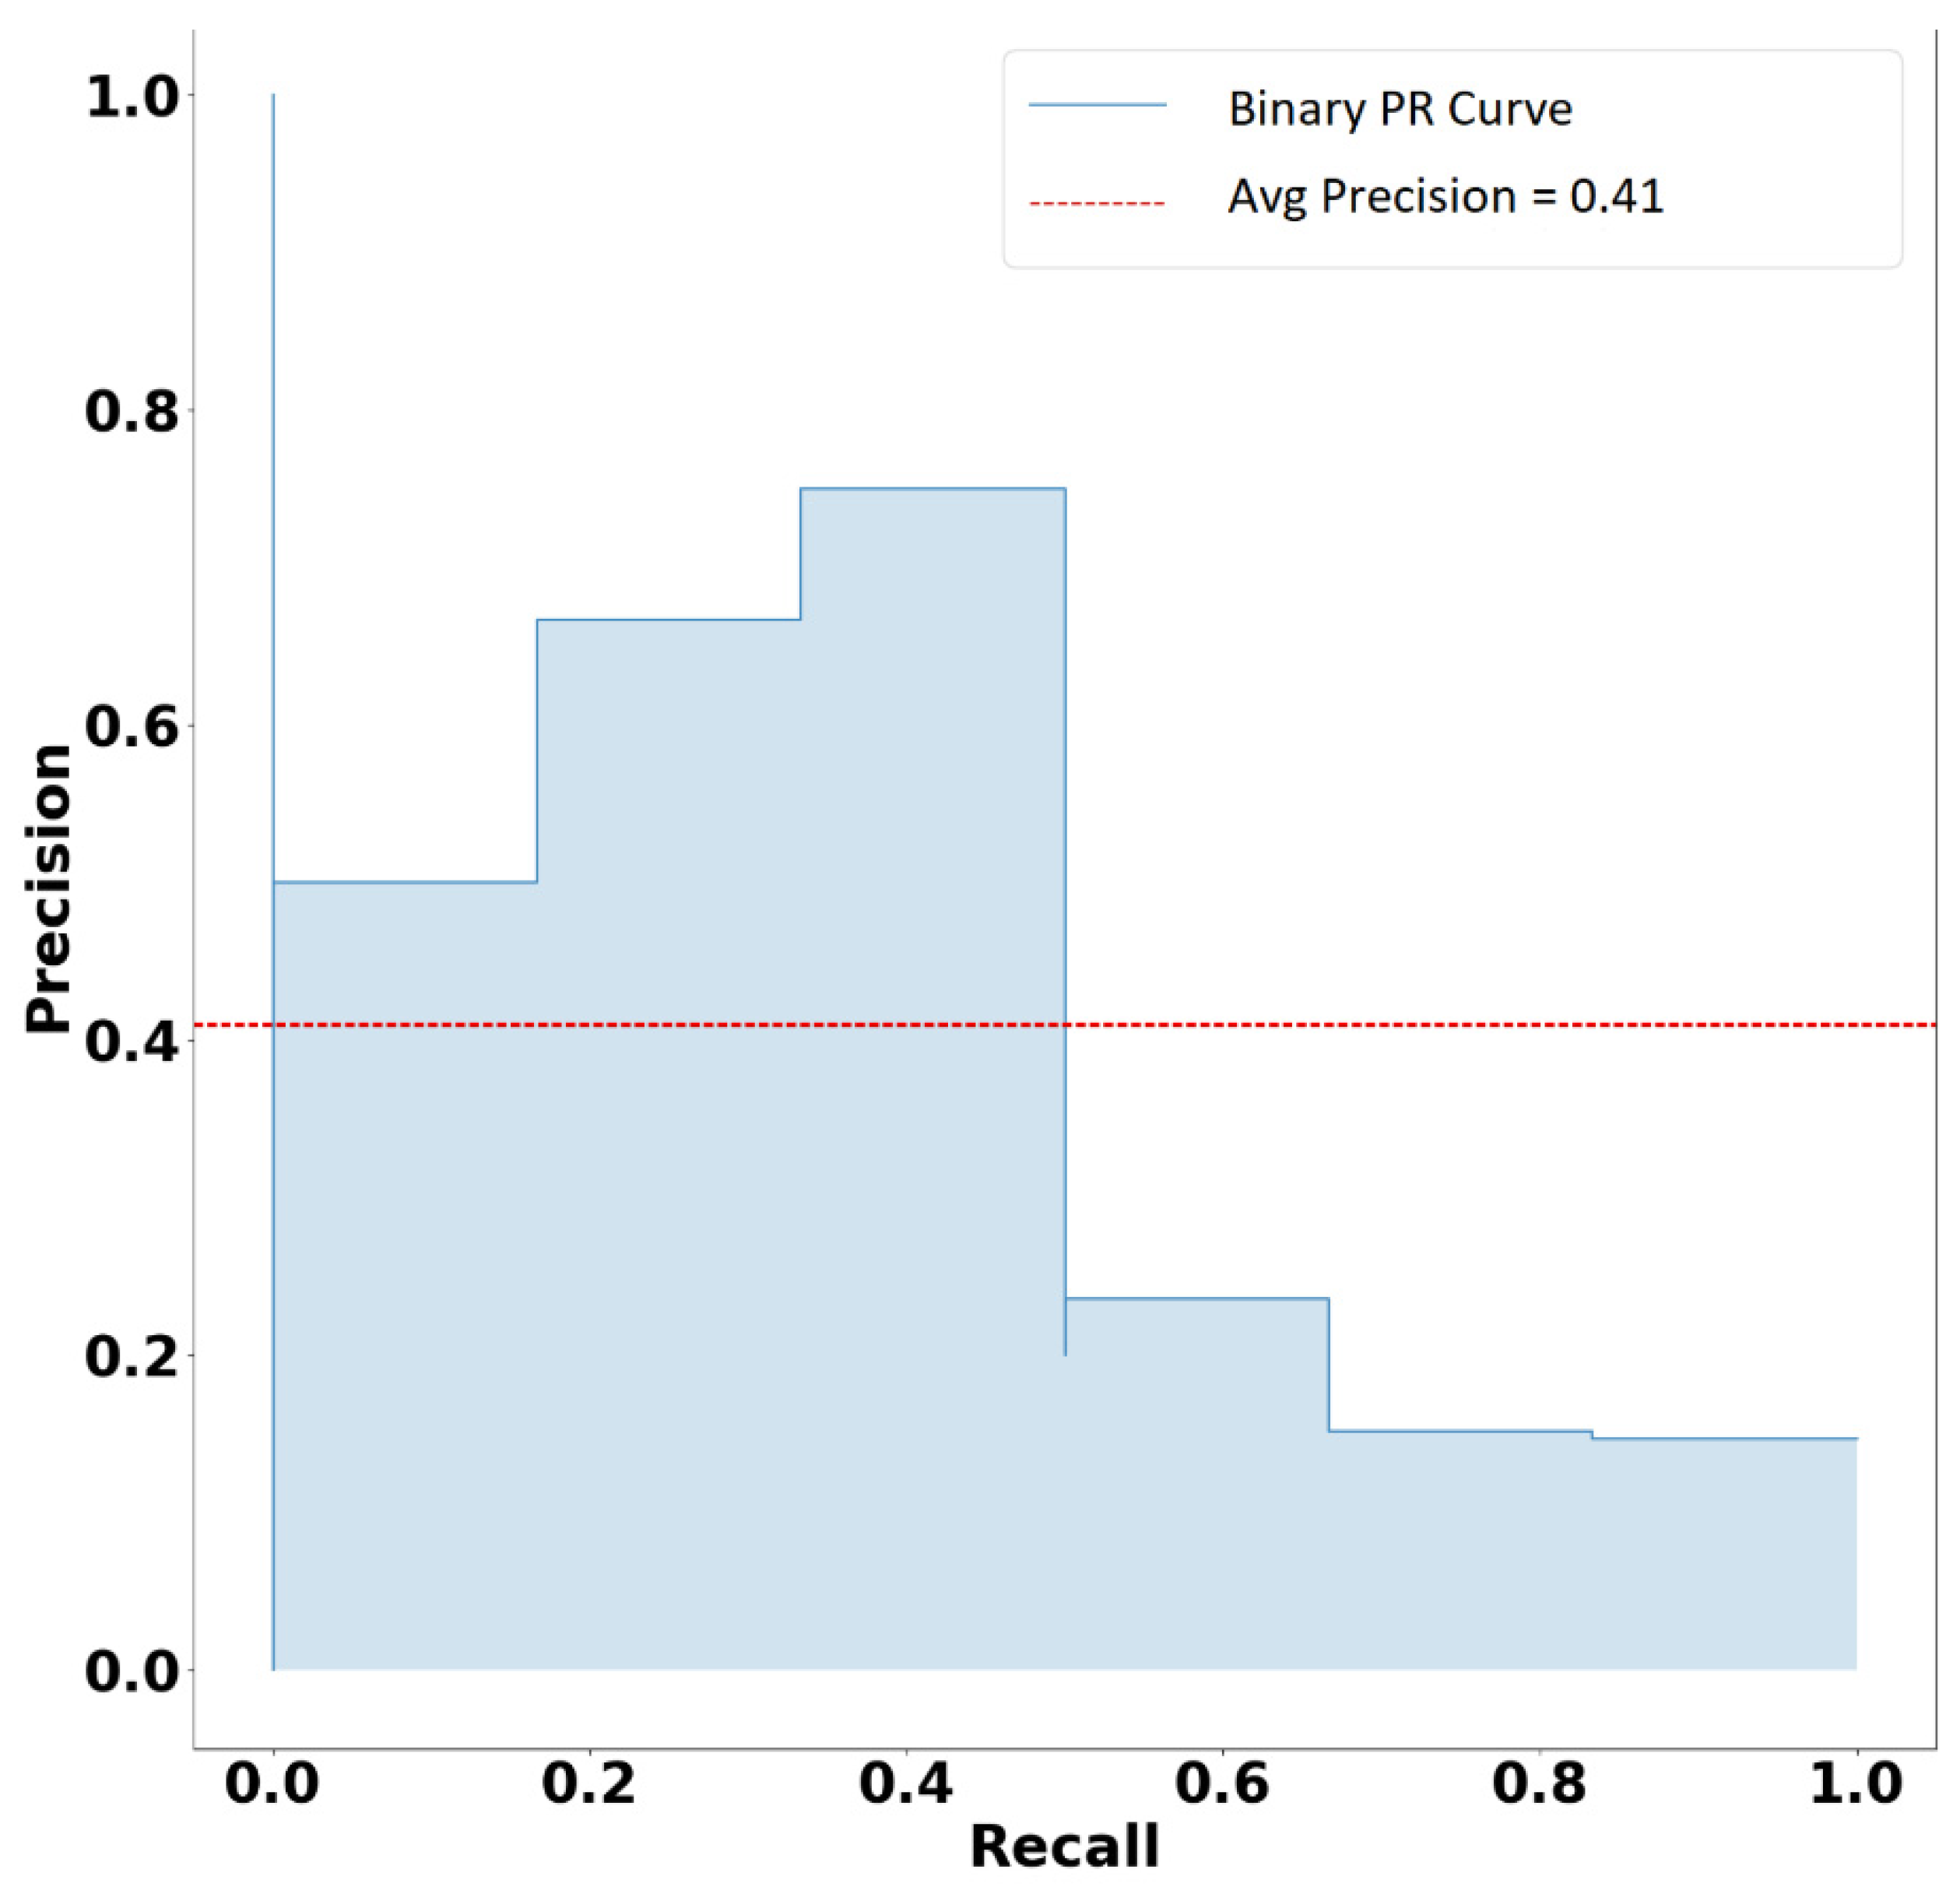
Appendix A.4. Precision–Recall Curve

References
- Taeihagh, A.; Lim, H.S.M. Governing Autonomous Vehicles: Emerging Responses for Safety, Liability, Privacy, Cybersecurity, and Industry Risks. Transp. Rev. 2019, 39, 103–128. [Google Scholar] [CrossRef] [Green Version]
- Papadoulis, A.; Quddus, M.; Imprialou, M. Evaluating the Safety Impact of Connected and Autonomous Vehicles on Motorways. Accid. Anal. Prev. 2019, 124, 12–22. [Google Scholar] [CrossRef] [Green Version]
- Sinha, A.; Chand, S.; Wijayaratna, K.P.; Virdi, N.; Dixit, V. Comprehensive Safety Assessment in Mixed Fleets with Connected and Automated Vehicles: A Crash Severity and Rate Evaluation of Conventional Vehicles. Accid. Anal. Prev. 2020, 142, 105567. [Google Scholar] [CrossRef]
- Dixit, V.V.; Chand, S.; Nair, D.J. Autonomous Vehicles: Disengagements, Accidents and Reaction Times. PLoS ONE 2016, 11, e0168054. [Google Scholar] [CrossRef] [Green Version]
- Favarò, F.M.; Nader, N.; Eurich, S.O.; Tripp, M.; Varadaraju, N. Examining Accident Reports Involving Autonomous Vehicles in California. PLoS ONE 2017, 12, e0184952. [Google Scholar] [CrossRef]
- Favarò, F.; Eurich, S.; Nader, N. Autonomous Vehicles’ Disengagements: Trends, Triggers, and Regulatory Limitations. Accid. Anal. Prev. 2018, 110, 136–148. [Google Scholar] [CrossRef] [PubMed]
- Favarò, F.M.; Eurich, S.O.; Rizvi, S.S. “Human” Problems in Semi-Autonomous Vehicles: Understanding Drivers’ Reactions to Off-Nominal Scenarios. Int. J. Hum. Comput. Interact. 2019, 35, 956–971. [Google Scholar] [CrossRef]
- Banerjee, S.S.; Jha, S.; Cyriac, J.; Kalbarczyk, Z.T.; Iyer, R.K. Hands Off the Wheel in Autonomous Vehicles?: A Systems Perspective on over a Million Miles of Field Data. In Proceedings of the 48th Annual IEEE/IFIP International Conference on Dependable Systems and Networks (DSN), Luxembourg, 25–28 June 2018; pp. 586–597. [Google Scholar]
- Khattak, Z.H.; Fontaine, M.D.; Smith, B.L. Exploratory Investigation of Disengagements and Crashes in Autonomous Vehicles under Mixed Traffic: An Endogenous Switching Regime Framework. IEEE Trans. Intell. Transp. Syst. 2020, 1–11. [Google Scholar] [CrossRef]
- Boggs, A.M.; Wali, B.; Khattak, A.J. Exploratory Analysis of Automated Vehicle Crashes in California: A Text Analytics & Hierarchical Bayesian Heterogeneity-Based Approach. Accid. Anal. Prev. 2020, 135, 105354. [Google Scholar] [CrossRef] [PubMed]
- Wang, J.; Zhang, L.; Huang, Y.; Zhao, J. Safety of Autonomous Vehicles. J. Adv. Transp. 2020, 2020, e8867757. [Google Scholar] [CrossRef]
- Das, S.; Dutta, A.; Tsapakis, I. Automated Vehicle Collisions in California: Applying Bayesian Latent Class Model. IATSS Res. 2020, 44, 300–308. [Google Scholar] [CrossRef]
- Xu, C.; Ding, Z.; Wang, C.; Li, Z. Statistical Analysis of the Patterns and Characteristics of Connected and Autonomous Vehicle Involved Crashes. J. Saf. Res. 2019, 71, 41–47. [Google Scholar] [CrossRef]
- Khattak, Z.H.; Fontaine, M.D.; Smith, B.L. An Exploratory Investigation of Disengagements and Crashes in Autonomous Vehicles. In Proceedings of the Transportation Research Board 98th Annual Meeting, Washington, DC, USA, 13–17 January 2019. [Google Scholar]
- Sobhani, A.; Young, W.; Logan, D.; Bahrololoom, S. A Kinetic Energy Model of Two-Vehicle Crash Injury Severity. Accid. Anal. Prev. 2011, 43, 741–754. [Google Scholar] [CrossRef]
- Zeng, Q.; Hao, W.; Lee, J.; Chen, F. Investigating the Impacts of Real-Time Weather Conditions on Freeway Crash Severity: A Bayesian Spatial Analysis. Int. J. Environ. Res. Public Health 2020, 17, 2768. [Google Scholar] [CrossRef]
- Cheng, W.; Gill, G.S.; Sakrani, T.; Dasu, M.; Zhou, J. Predicting Motorcycle Crash Injury Severity Using Weather Data and Alternative Bayesian Multivariate Crash Frequency Models. Accid. Anal. Prev. 2017, 108, 172–180. [Google Scholar] [CrossRef] [PubMed]
- Holdridge, J.M.; Shankar, V.N.; Ulfarsson, G.F. The Crash Severity Impacts of Fixed Roadside Objects. J. Saf. Res. 2005, 36, 139–147. [Google Scholar] [CrossRef]
- Quddus, M.A.; Wang, C.; Ison, S.G. Road Traffic Congestion and Crash Severity: Econometric Analysis Using Ordered Response Models. J. Transp. Eng. 2009, 136, 424–435. [Google Scholar] [CrossRef]
- Olia, A.; Razavi, S.; Abdulhai, B.; Abdelgawad, H. Traffic Capacity Implications of Automated Vehicles Mixed with Regular Vehicles. J. Intell. Transp. Syst. 2018, 22, 244–262. [Google Scholar] [CrossRef]
- Virdi, N.; Grzybowska, H.; Waller, S.T.; Dixit, V. A Safety Assessment of Mixed Fleets with Connected and Autonomous Vehicles Using the Surrogate Safety Assessment Module. Accid. Anal. Prev. 2019, 131, 95–111. [Google Scholar] [CrossRef]
- Buzeman, D.G.; Viano, D.C.; Lövsund, P. Injury Probability and Risk in Frontal Crashes: Effects of Sorting Techniques on Priorities for Offset Testing. Accid. Anal. Prev. 1998, 30, 583–595. [Google Scholar] [CrossRef]
- Rana, T.A.; Sikder, S.; Pinjari, A.R. Copula-Based Method for Addressing Endogeneity in Models of Severity of Traffic Crash Injuries: Application to Two-Vehicle Crashes. Transp. Res. Rec. 2010, 2147, 75–87. [Google Scholar] [CrossRef]
- Farmer, C.M.; Braver, E.R.; Mitter, E.L. Two-Vehicle Side Impact Crashes: The Relationship of Vehicle and Crash Characteristics to Injury Severity. Accid. Anal. Prev. 1997, 29, 399–406. [Google Scholar] [CrossRef]
- Huelke, D.F.; Compton, C.P. The Effects of Seat Belts on Injury Severity of Front and Rear Seat Occupants in the Same Frontal Crash. Accid. Anal. Prev. 1995, 27, 835–838. [Google Scholar] [CrossRef]
- Bédard, M.; Guyatt, G.H.; Stones, M.J.; Hirdes, J.P. The Independent Contribution of Driver, Crash, and Vehicle Characteristics to Driver Fatalities. Accid. Anal. Prev. 2002, 34, 717–727. [Google Scholar] [CrossRef]
- Carbaugh, J.; Godbole, D.N.; Sengupta, R. Safety and Capacity Analysis of Automated and Manual Highway Systems. Transp. Res. Part C Emerg. Technol. 1998, 6, 69–99. [Google Scholar] [CrossRef] [Green Version]
- Langley, J.; Marshall, S.W. The Severity of Road Traffic Crashes Resulting in Hospitalisation in New Zealand. Accid. Anal. Prev. 1994, 26, 549–554. [Google Scholar] [CrossRef]
- Conroy, C.; Tominaga, G.T.; Erwin, S.; Pacyna, S.; Velky, T.; Kennedy, F.; Sise, M.; Coimbra, R. The Influence of Vehicle Damage on Injury Severity of Drivers in Head-on Motor Vehicle Crashes. Accid. Anal. Prev. 2008, 40, 1589–1594. [Google Scholar] [CrossRef]
- Lee, J.; Conroy, C.; Coimbra, R.; Tominaga, G.T.; Hoyt, D.B. Injury Patterns in Frontal Crashes: The Association between Knee–Thigh–Hip (KTH) and Serious Intra-Abdominal Injury. Accid. Anal. Prev. 2010, 42, 50–55. [Google Scholar] [CrossRef]
- Bainbridge, L. Ironies of Automation. In Analysis, Design and Evaluation of Man–Machine Systems; Johannsen, G., Rijnsdorp, J.E., Eds.; Pergamon: Oxford, UK, 1983; pp. 129–135. ISBN 978-0-08-029348-6. [Google Scholar]
- Wiener, B.E.L.; Curry, R.E. Flight-Deck Automation: Promises and Problems. Ergonomics 1980, 23, 995–1011. [Google Scholar] [CrossRef]
- Corben, B.; Senserrick, T.; Cameron, M.; Rechnitzer, G. Development of the Visionary Research Model: Application to the Car/Pedestrian Conflict; Monash University Accident Research Centre: Melbourne, Australia, 2004. [Google Scholar]
- Elvik, R. To What Extent Can Theory Account for the Findings of Road Safety Evaluation Studies? Accid. Anal. Prev. 2004, 36, 841–849. [Google Scholar] [CrossRef]
- Papaioannou, P. Driver Behaviour, Dilemma Zone and Safety Effects at Urban Signalised Intersections in Greece. Accid. Anal. Prev. 2007, 39, 147–158. [Google Scholar] [CrossRef]
- The Insurance Institute for Highway Safety (IIHS). Fatality Facts 2019: Passenger Vehicle Occupants. Available online: https://www.iihs.org/topics/fatality-statistics/detail/passenger-vehicle-occupants (accessed on 25 June 2021).
- Shapiro, S.S.; Wilk, M.B. An Analysis of Variance Test for Normality (Complete Samples). Biometrika 1965, 52, 591–611. [Google Scholar] [CrossRef]
- Jordan, J. Learning from Imbalanced Data. Available online: https://www.jeremyjordan.me/imbalanced-data/ (accessed on 25 June 2021).
- Branco, P.; Torgo, L.; Ribeiro, R.P. A Survey of Predictive Modeling on Imbalanced Domains. ACM Comput. Surv. 2016, 49, 1–50. [Google Scholar] [CrossRef]
- Li, Z.; Chen, W.; Pei, D. Robust and Unsupervised KPI Anomaly Detection Based on Conditional Variational Autoencoder. In Proceedings of the 2018 IEEE 37th International Performance Computing and Communications Conference (IPCCC), Orlando, FL, USA, 17–19 November 2018; pp. 1–9. [Google Scholar]
- Lemaître, G.; Nogueira, F.; Aridas, C.K. Imbalanced-Learn: A Python Toolbox to Tackle the Curse of Imbalanced Datasets in Machine Learning. J. Mach. Learn. Res. 2017, 18, 559–563. [Google Scholar]
- Pedregosa, F.; Varoquaux, G.; Gramfort, A.; Michel, V.; Thirion, B.; Grisel, O.; Blondel, M.; Prettenhofer, P.; Weiss, R.; Dubourg, V.; et al. Scikit-Learn: Machine Learning in Python. J. Mach. Learn. Res. 2011, 12, 2825–2830. [Google Scholar]
- Saito, T.; Rehmsmeier, M. The Precision-Recall Plot Is More Informative than the ROC Plot When Evaluating Binary Classifiers on Imbalanced Datasets. PLoS ONE 2015, 10, e0118432. [Google Scholar] [CrossRef] [PubMed] [Green Version]
- Caesar, H.; Bankiti, V.; Lang, A.H.; Vora, S.; Liong, V.E.; Xu, Q.; Krishnan, A.; Pan, Y.; Baldan, G.; Beijbom, O. NuScenes: A Multimodal Dataset for Autonomous Driving. In Proceedings of the IEEE/CVF Conference on Computer Vision and Pattern Recognition, Seattle, WA, USA, 13–19 June 2020; pp. 11621–11631. [Google Scholar]
- Maddern, W.; Pascoe, G.; Linegar, C.; Newman, P. 1 Year, 1000 Km: The Oxford RobotCar Dataset. Int. J. Robot. Res. 2017, 36, 3–15. [Google Scholar] [CrossRef]
- Huang, X.; Cheng, X.; Geng, Q.; Cao, B.; Zhou, D.; Wang, P.; Lin, Y.; Yang, R. The ApolloScape Dataset for Autonomous Driving. In Proceedings of the IEEE Computer Society Conference on Computer Vision and Pattern Recognition Workshops (CVPRW), Salt Lake City, UT, USA, 18–22 June 2018; pp. 954–960. [Google Scholar]
- Sun, P.; Kretzschmar, H.; Dotiwalla, X.; Chouard, A.; Patnaik, V.; Tsui, P.; Guo, J.; Zhou, Y.; Chai, Y.; Caine, B. Scalability in Perception for Autonomous Driving: Waymo Open Dataset. In Proceedings of the IEEE/CVF Conference on Computer Vision and Pattern Recognition, Seattle, WA, USA, 13–19 June 2020; pp. 2446–2454. [Google Scholar]
- Terrell, G.R.; Scott, D.W. Variable Kernel Density Estimation. Ann. Stat. 1992, 20, 1236–1265. [Google Scholar] [CrossRef]
- Dixit, V.; Xiong, Z.; Jian, S.; Saxena, N. Risk of Automated Driving: Implications on Safety Acceptability and Productivity. Accid. Anal. Prev. 2019, 125, 257–266. [Google Scholar] [CrossRef]
- Wiseman, Y.; Grinberg, I. Circumspectly Crash of Autonomous Vehicles. In Proceedings of the 2016 IEEE International Conference on Electro Information Technology (EIT), Grand Forks, ND, USA, 19–21 May 2016; pp. 0387–0392. [Google Scholar]
- Washington, S.P.; Karlaftis, M.G.; Mannering, F. Statistical and Econometric Methods for Transportation Data Analysis; CRC Press: Boca Raton, FL, USA, 2010. [Google Scholar]
- Mannering, F. Temporal Instability and the Analysis of Highway Accident Data. Anal. Methods Accid. Res. 2018, 17, 1–13. [Google Scholar] [CrossRef]
- Al-Bdairi, N.S.S.; Behnood, A.; Hernandez, S. Temporal Stability of Driver Injury Severities in Animal-Vehicle Collisions: A Random Parameters with Heterogeneity in Means (and Variances) Approach. Anal. Methods Accid. Res. 2020, 26, 100120. [Google Scholar] [CrossRef]
- Theofilatos, A.; Antoniou, C.; Yannis, G. Exploring Injury Severity of Children and Adolescents Involved in Traffic Crashes in Greece. J. Traffic Transp. Eng. 2020. [Google Scholar] [CrossRef]
- Breiman, L. Bagging Predictors. Mach. Learn. 1996, 24, 123–140. [Google Scholar] [CrossRef] [Green Version]
- Efron, B.; Tibshirani, R.J. An Introduction to the Bootstrap; CRC Press: Boca Raton, FL, USA, 1994; ISBN 978-0-412-04231-7. [Google Scholar]
- Branco, P.; Torgo, L.; Ribeiro, R. A Survey of Predictive Modelling under Imbalanced Distributions. arXiv 2015, arXiv:1505.01658. [Google Scholar]

| Study | Significant Findings/Insights |
|---|---|
| Dixit et al. (2016) |
|
| Favarò et al. (2017) |
|
| Favarò et al. (2018) |
|
| Banerjee et al. (2018) |
|
| Favarò et al. (2019) |
|
| Khattak et al. (2019) |
|
| Xu et al. (2019) |
|
| Boggs et al. (2020) |
|
| Wang et al. (2020) |
|
| Das et al. (2020) |
|
| Khattak et al. (2020) |
|
| Variable | Type | Definition | Descriptive Statistics |
|---|---|---|---|
| Vehicle number | Categorical | Number of vehicles involved | F(1) = 5% |
| F(2) = 92% | |||
| F(3) = 3% | |||
| Intersection | Categorical | = 1 if crash location was intersection; = 0 otherwise | F(0) = 37% |
| F(1) = 63% | |||
| Signalized | Binary | = 1 with signals; = 0 without | F(0) = 51% |
| F(1) = 49% | |||
| Parking provision | Binary | = 1 with parking provision; = 0 without or no information | F(1) = 56% |
| F(0) = 44% | |||
| Mode | Binary | = 1 autonomous; = 0 conventional | F(1) = 54% |
| F(0) = 46% | |||
| Fault | Binary | = 1 AV at fault; = 0 not at fault | F(1) = 12% |
| F(0) = 88% | |||
| AV status | Binary | = 1 moving; = 0 stopped | F(1) = 57% |
| F(0) = 43% | |||
| Other party’s vehicle status | Binary | = 1 moving; = 0 stopped | F(1) = 95% |
| F(0) = 5% | |||
| Vehicle type | Categorical | = 1 two wheels (i.e., bicycle, scooter); | F(1) = 12% |
| = 2 sub-compact/compact cars; | F(2) = 41% | ||
| = 3 mid-size cars; | F(3) = 36% | ||
| = 4 trucks/buses/trailers | F(4) = 12% | ||
| Collision type | Categorical | = 1 head-on; | F(1) = 6% |
| = 2 sideswipe; | F(2) = 21% | ||
| = 3 rear-end; | F(3) = 62% | ||
| = 4 others | F(4) = 11% | ||
| Intersection type | Categorical | = 0 straight road | F(0) = 9% |
| = 1 Y-intersection | F(1) = 11% | ||
| = 2 T-intersection | F(2) = 15% | ||
| = 3 Cross intersection | F(3) = 59% | ||
| = 4 Complex intersection | F(4) = 5% |
| Rear-End Crashes: | Mode | Total | |
| Conventional | Autonomous | ||
| Number of rear-end crashes | 47 | 103 | 150 |
| Number at fault | 8 | 2 | 10 |
| Percentage of total rear-end crash with AV at fault | 5.333% | 1.333% | 6.667% |
| Sideswipe Crashes: | Mode | Total | |
| Conventional | Autonomous | ||
| Number of sideswipe crashes | 24 | 23 | 47 |
| Number at fault | 6 | 2 | 8 |
| Percentage of the total sideswipe crash with AV at fault | 12.77% | 4.26% | 17.02% |
| Confusion Matrix | Balanced Accuracy | Precision | Recall | Modified F1 Score |
|---|---|---|---|---|
 | 0.65 | 0.97 | 0.89 | 0.96 |
Publisher’s Note: MDPI stays neutral with regard to jurisdictional claims in published maps and institutional affiliations. |
© 2021 by the authors. Licensee MDPI, Basel, Switzerland. This article is an open access article distributed under the terms and conditions of the Creative Commons Attribution (CC BY) license (https://creativecommons.org/licenses/by/4.0/).
Share and Cite
Sinha, A.; Vu, V.; Chand, S.; Wijayaratna, K.; Dixit, V. A Crash Injury Model Involving Autonomous Vehicle: Investigating of Crash and Disengagement Reports. Sustainability 2021, 13, 7938. https://doi.org/10.3390/su13147938
Sinha A, Vu V, Chand S, Wijayaratna K, Dixit V. A Crash Injury Model Involving Autonomous Vehicle: Investigating of Crash and Disengagement Reports. Sustainability. 2021; 13(14):7938. https://doi.org/10.3390/su13147938
Chicago/Turabian StyleSinha, Amolika, Vincent Vu, Sai Chand, Kasun Wijayaratna, and Vinayak Dixit. 2021. "A Crash Injury Model Involving Autonomous Vehicle: Investigating of Crash and Disengagement Reports" Sustainability 13, no. 14: 7938. https://doi.org/10.3390/su13147938
APA StyleSinha, A., Vu, V., Chand, S., Wijayaratna, K., & Dixit, V. (2021). A Crash Injury Model Involving Autonomous Vehicle: Investigating of Crash and Disengagement Reports. Sustainability, 13(14), 7938. https://doi.org/10.3390/su13147938