Article

The Impact of Reward–Penalty Policy on Different Recycling Modes of Recyclable Resources in Residential Waste

School of Economics and Management, Beijing Jiaotong University, Beijing 100044, China
*
Author to whom correspondence should be addressed.
Sustainability 2021, 13(14), 7883; https://doi.org/10.3390/su13147883
Submission received: 19 May 2021 / Revised: 3 July 2021 / Accepted: 6 July 2021 / Published: 14 July 2021

Abstract

:
Facing enormous pressure from the rapid growth of waste on the environment and society, many developed countries have combined urban waste recycling systems with waste classification to reduce pollution and recycle resources. However, this technique is not well established in developing countries. From the 2000s, China has carried out many waste classification recycling projects in many pilot cities although they have yet to reach widespread success. This paper focuses on China’s Newest Waste Classification Recycling Project (NWCRP), which was first implemented in Shanghai from 2019 and has a three-echelon supply chain containing waste classification guiders (WCGs), recyclers and demanders. Firstly, two recycling modes in NWCRP are studied: the recyclers of the first mode are dominated by the recycling company (mode RC), and the recyclers of the second mode are dominated by the environmental sanitation engineering group (mode ESEG). Secondly, a reward–penalty policy is proposed, which can be implemented for WCGs or different recyclers in the two modes (RC or ESEG), and the impacts of different scenarios are also compared. The results showed that (1) with increasing reward–penalty intensity, the sorting rate and the profit show upward trends in two modes, while the subsidy efficiency of government decreases; (2) when the reward–penalty policy is implemented for WCGs, the recyclers’ recycling price decreases in the two modes; (3) all scenarios that implement the reward–penalty policy in mode RC have certain advantages in the sorting rate and profit and (4) with increasing reward–penalty intensity and target sorting rate in the reward–penalty policy, the social welfare first increases and then decreases in all scenarios. Finally, some suggestions on the recycling mode and the reward–penalty policy for establishing a 3RW recycling system are provided.

1. Introduction

In recent years, the reutilization of recyclable resources in residential waste (3RW), which can conserve resources, beautify the living environment and address the issue of limited landfill space for waste, has attracted significant attention from various countries [1]. The recycling of 3RW is more difficult than that of other products (household appliances [2], remanufactured products [3], spent electric vehicle batteries [4] and so on), as it is hard to separate from waste, has a low margin and is widely dispersed in urban areas. Moreover, the heterogeneity of customs in different countries also causes different recycling modes of 3RW at different times [5]. Therefore, it is very important to find appropriate solutions for 3RW recycling in each country, as no recycling mode can be applied to all [1].
Developed countries started to pay attention to municipal solid waste (MSW) management relatively early and have made significant achievements in the recycling of 3RW by building urban recycling systems with waste classification, especially Germany [6], Japan [7] and Sweden [8]. However, the recycling modes in these countries are different. For example, private companies are mainly responsible for solid waste collection in Sweden [8] and the USA [9], while in Japan, the garbage is collected by municipalities and private companies are responsible for the recycling of recyclables in order to reduce the fiscal expenditure [7]. In addition, all the above countries have made many relevant laws and regulations to guarantee and promote 3RW recycling.
Unlike in developed countries, the recycling of 3RW is not as well established in developing countries. There are few professional companies or organizations responsible for the recycling of 3RW in them, and the basic waste classification knowledge of their residents is very weak. In Latin America, the informal recycling sector, which comprises some people with low income, such as elderly people, women and children, recycle and sell 3RW through informal forums [10]. The informal recycling sector, working in a poor environment with low costs [11], not only leads to a low amount of 3RW recycling but also brings some hidden social dangers [12]. It is commendable that many countries have been working on how to formalize informal recycling organizations [13,14].
China, whose urbanization rate increased from 17.92% to 57.35% from 1978 to 2016 [1], is also facing pressure to increase solid waste recycling and is eager to build a 3RW recycling system [15]. From the 2000s, China has carried out many waste classification recycling projects in many pilot cities although they have yet to reach widespread success [1]. It is found that there are two key factors restricting the 3RW recycling: finding the suitable 3RW recycling mode [8] and formulating corresponding incentive policies [15], through the successful implementation of 3RW recycling in other countries. In addition, solid waste collection, which has a great impact on the urban environment [16,17], also affects the implementation effect of 3RW recycling. Moreover, the waste collection in China is different from that in many countries [18], which increases the difficulty of 3RW recycling.
In view of the above problems, the main purpose of this paper is to find a 3RW recycling mode suitable for China’s national conditions, as well as the effective incentive policies for it. We organize the remainder of this article as follows: The relevant literature review of 3RW recycling and the research significance of this paper are introduced in Section 2. In Section 3, the problems are described, the notations are listed and the formulas are described. A game theory model is built, and the validity of the model is verified in Section 4. In Section 5, the simulation results are analyzed and discussed in different scenarios. Finally, we draw our conclusions in Section 6.

2. Literature Review

Academically, there have been many studies on municipal solid waste management, including the cost of the MSW system [7] and sustainability of the MSW system [6]. Many studies have also focused on the informal recycling sector, i.e., networks of informal recycling [5], recycling efficiency [19] and formalization of the informal sector [13]. Moreover, some studies have highlighted high-value recyclable waste, such as waste plastic [20,21] and wastepaper [22]. However, few studies have been conducted on the recycling process and model of 3RW as well as the impact of policies on it, which have been fully studied for other recyclable materials [2,3,4].
The following sections first summarize the literature on 3RW recycling, then introduce the recycling situation in China and finally analyze the previous research on reward–punishment policy.

2.1. Research on 3RW Recycling

Through summarizing the existing literature on 3RW recycling, the research can be classified into three types.
As waste classification has been proven to be an effective approach to recycling 3RW, the first type refers to those studies on recycling systems of 3RW with classification. Ibáñez-Forés et al. analyzed the evolution of the MSW management system of Joao Pessoa (Brazil) and determined the relation of MSW management data with the socioeconomic characteristics of the populations in different city districts based on stakeholder data in the system and highlighted the great deal of room for improvement in the selective waste collection ratio [23]. Tang et al. investigated the status of MSW management in Guangzhou, China, and identified that a combination of waste sorting by individual residents and sanitation workers is one of the most feasible strategies to achieve sustainable waste management [24].
The second research type concerns the recycling behaviors of residents regarding waste classification. Meng et al. analyzed the main factors that affect residents’ household solid waste (HSW) disposal behaviors and discussed decision-making mechanisms [25]. Xu et al. found that the effects of economic incentives and social influence are the two general solutions to the domestic waste separation dilemma, along with economic and sociological/social psychological logic, respectively [26]. Lu et al. used a qualitative case-study approach to explore the potential of a community-based co-production strategy for household waste sorting as an alternative to the conventional top–down approach [27] and showed that the regulatory environment should focus on long-lasting changes in the behaviors of citizens by designing a citizen-centric approach related to ecological concerns because it could define the future of HSW sorting behaviors (HSWSB) in Chinese society [1].
A very small number of studies comprise the third research type, which is about the recycling model of 3RW. Jafari et al. were the first to focus on recyclables under a dual-channel structure considering the economic and environmental aspects of sustainability and found that a higher degree of waste recyclability leads to higher profits for members [28].

2.2. RW Recycling in China

China has many recycling modes at different times and under different economic policies [15]. In the past forty years, the recycling process in China can be divided into three stages.
The first stage: formal sector recycling. The establishment of the waste material recycling bureau, which was approved by the central government, was the official birth of the waste material recycling industry in China on April 28, 1954. After that, a state-owned recycling system was established, and the recycling ratio of renewable resources was as high as 80% at that time.
The second stage: informal sector recycling. The individual economy and private economy entered the recycling industry after the 1990s, with the emergence of the socialist market economy. After this, the state-owned recycling system of renewable resources shrank. As a result, the market spontaneously formed a large-scale non-standard reverse material flow system driven by the perceived benefits at the expense of the environment.
The third stage: innovative recycling. In the 21st century, the use of internet technology has been suggested as a unique and effective way of solving China’s residential waste and recycling problems [29]. In addition, the Ministry of Commerce is trying to establish a standardized recycling system with waste classification, but China is still currently at an early stage in it [26]. Previous projects on waste classification in many pilot cities have failed [27], and the latest pilot project results show that replicating tier-1 practices in other cities could produce unsatisfactory results [1].

2.3. Reward–Penalty Policy

In the reward–penalty policy, a company can get corresponding rewards when a certain target specified by the government is met, on the contrary, the company will be punished when the target is not reached. The impact of the reward–penalty policy has also been widely researched in many areas, such as electric distribution utilities and system [30,31], recycling [32], closed-loop supply chain [33] and so on.
Many researchers used game mode to explain the impact of the reward–penalty policy [30,31,33]. Moreover, previous studies have shown that the reward–penalty policy can significantly promote the development of the industry in a certain mode. In the above studies, some have paid attention to the impact of reward–penalty policies on social welfare, including social, economic and environmental sectors, but most of them have not considered this factor. Unlike others, Amini et al. used the Reasoned Action Approach (RAA) to investigate the effects of intervention factors on households’ recycling intention, in order to help the Malaysian government to apply a proper intervention in advancing and enforcing recycling regulations [32].
The above analysis shows that China is in the critical stage of 3RW recycling now, and the smooth implementation of the NWCRP depends on whether the suitable recycling mode and the corresponding incentive policies can be found. However, few review studies on the 3RW recycling mode have been published, especially under the NWCRP in China. The impact of relevant policies on the 3RW recycling model have also not been studied.
In order to make up for the shortcomings of the existing literature, this paper attempts to makes an in-depth study of 3RW recycling in China, the innovation and significance of this research is mainly reflected in the following three aspects:
(1)
Two 3RW recycling modes were studied for the first time under the NWCRP in China. Furthermore, the profit models of two modes were established based on Stackelberg game theory, which can enrich the recycling model research of 3RW.
(2)
In this study the recycling amount was calculated by the degree of efforts such as publicity and supervision, which takes into account the impact of residents’ environmental awareness and has been used in the recycling of free recyclables [3]. It is different from the method used to calculate the recycling amount of 3RW in the research of Jafari et al. [19], which was calculated by the customers’ demand for the finished product.
(3)
A reward–penalty policy was proposed, what is more, the impact of reward–penalty policies on social welfare and its subsidy efficiency were analyzed, which are rarely studied by other literatures.

3. Problem

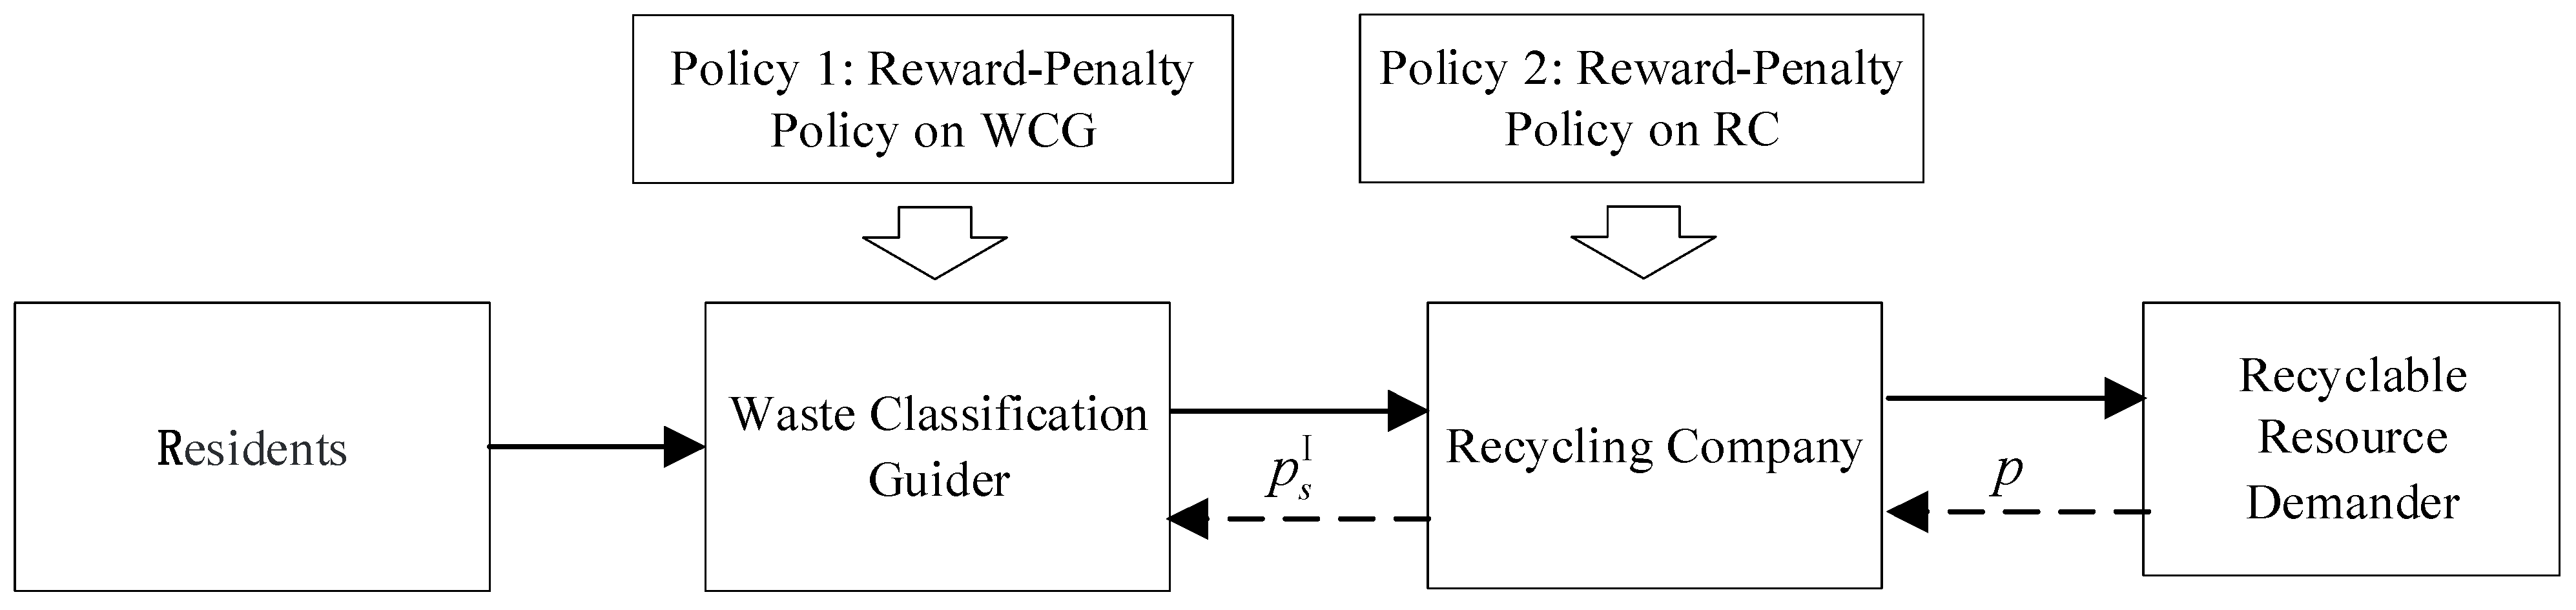
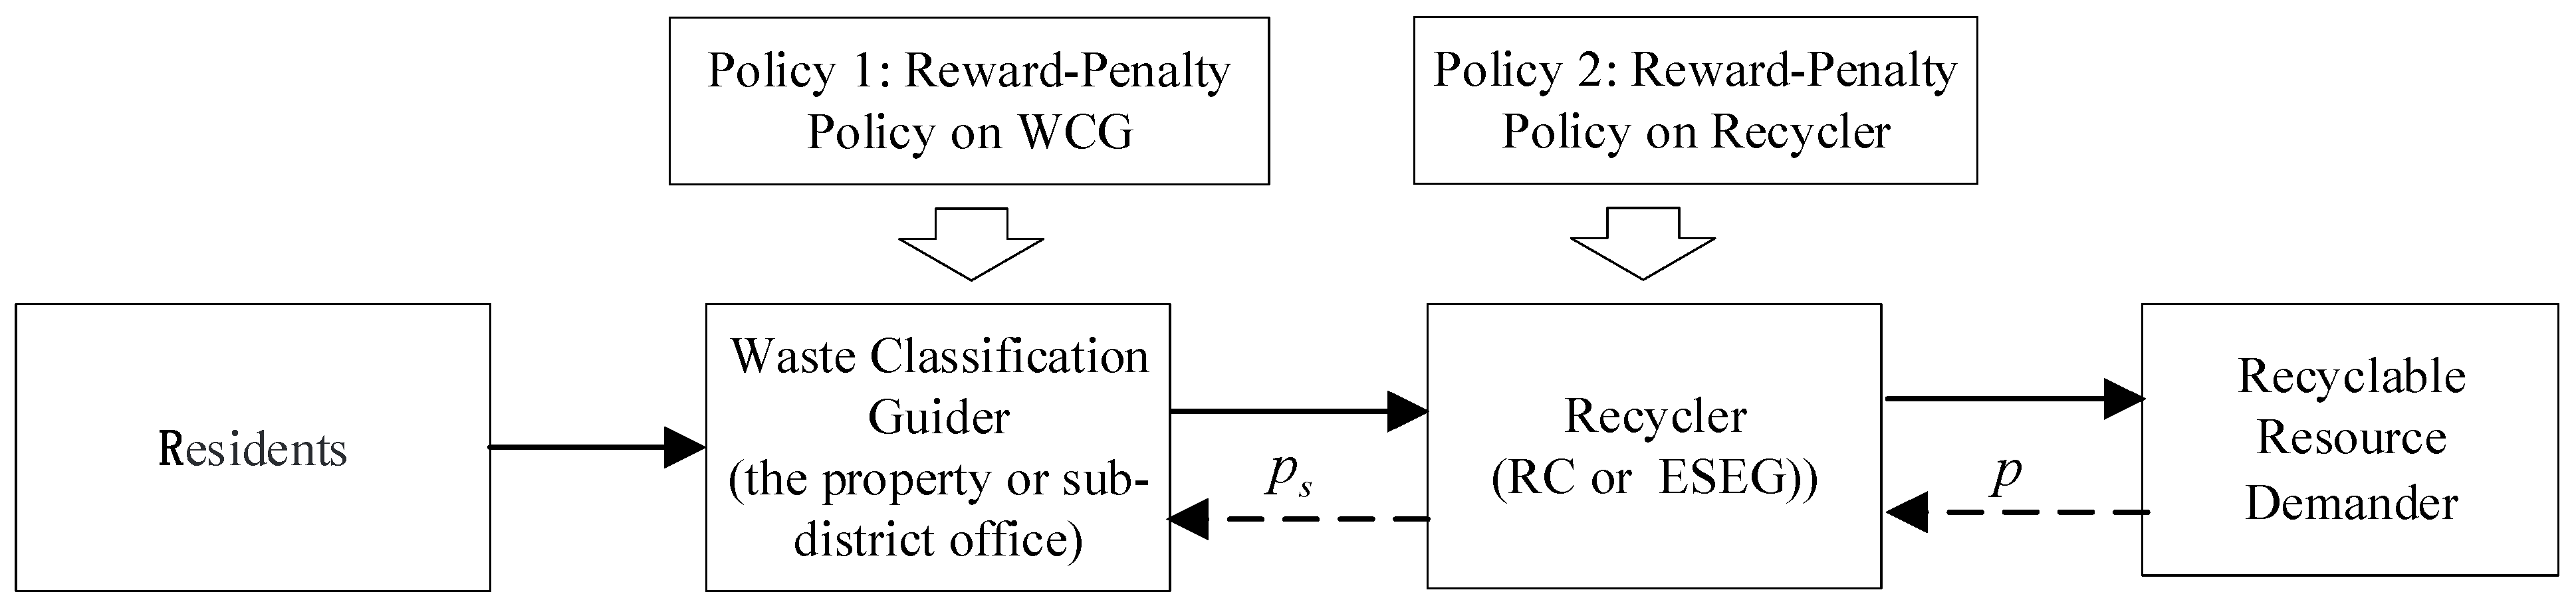
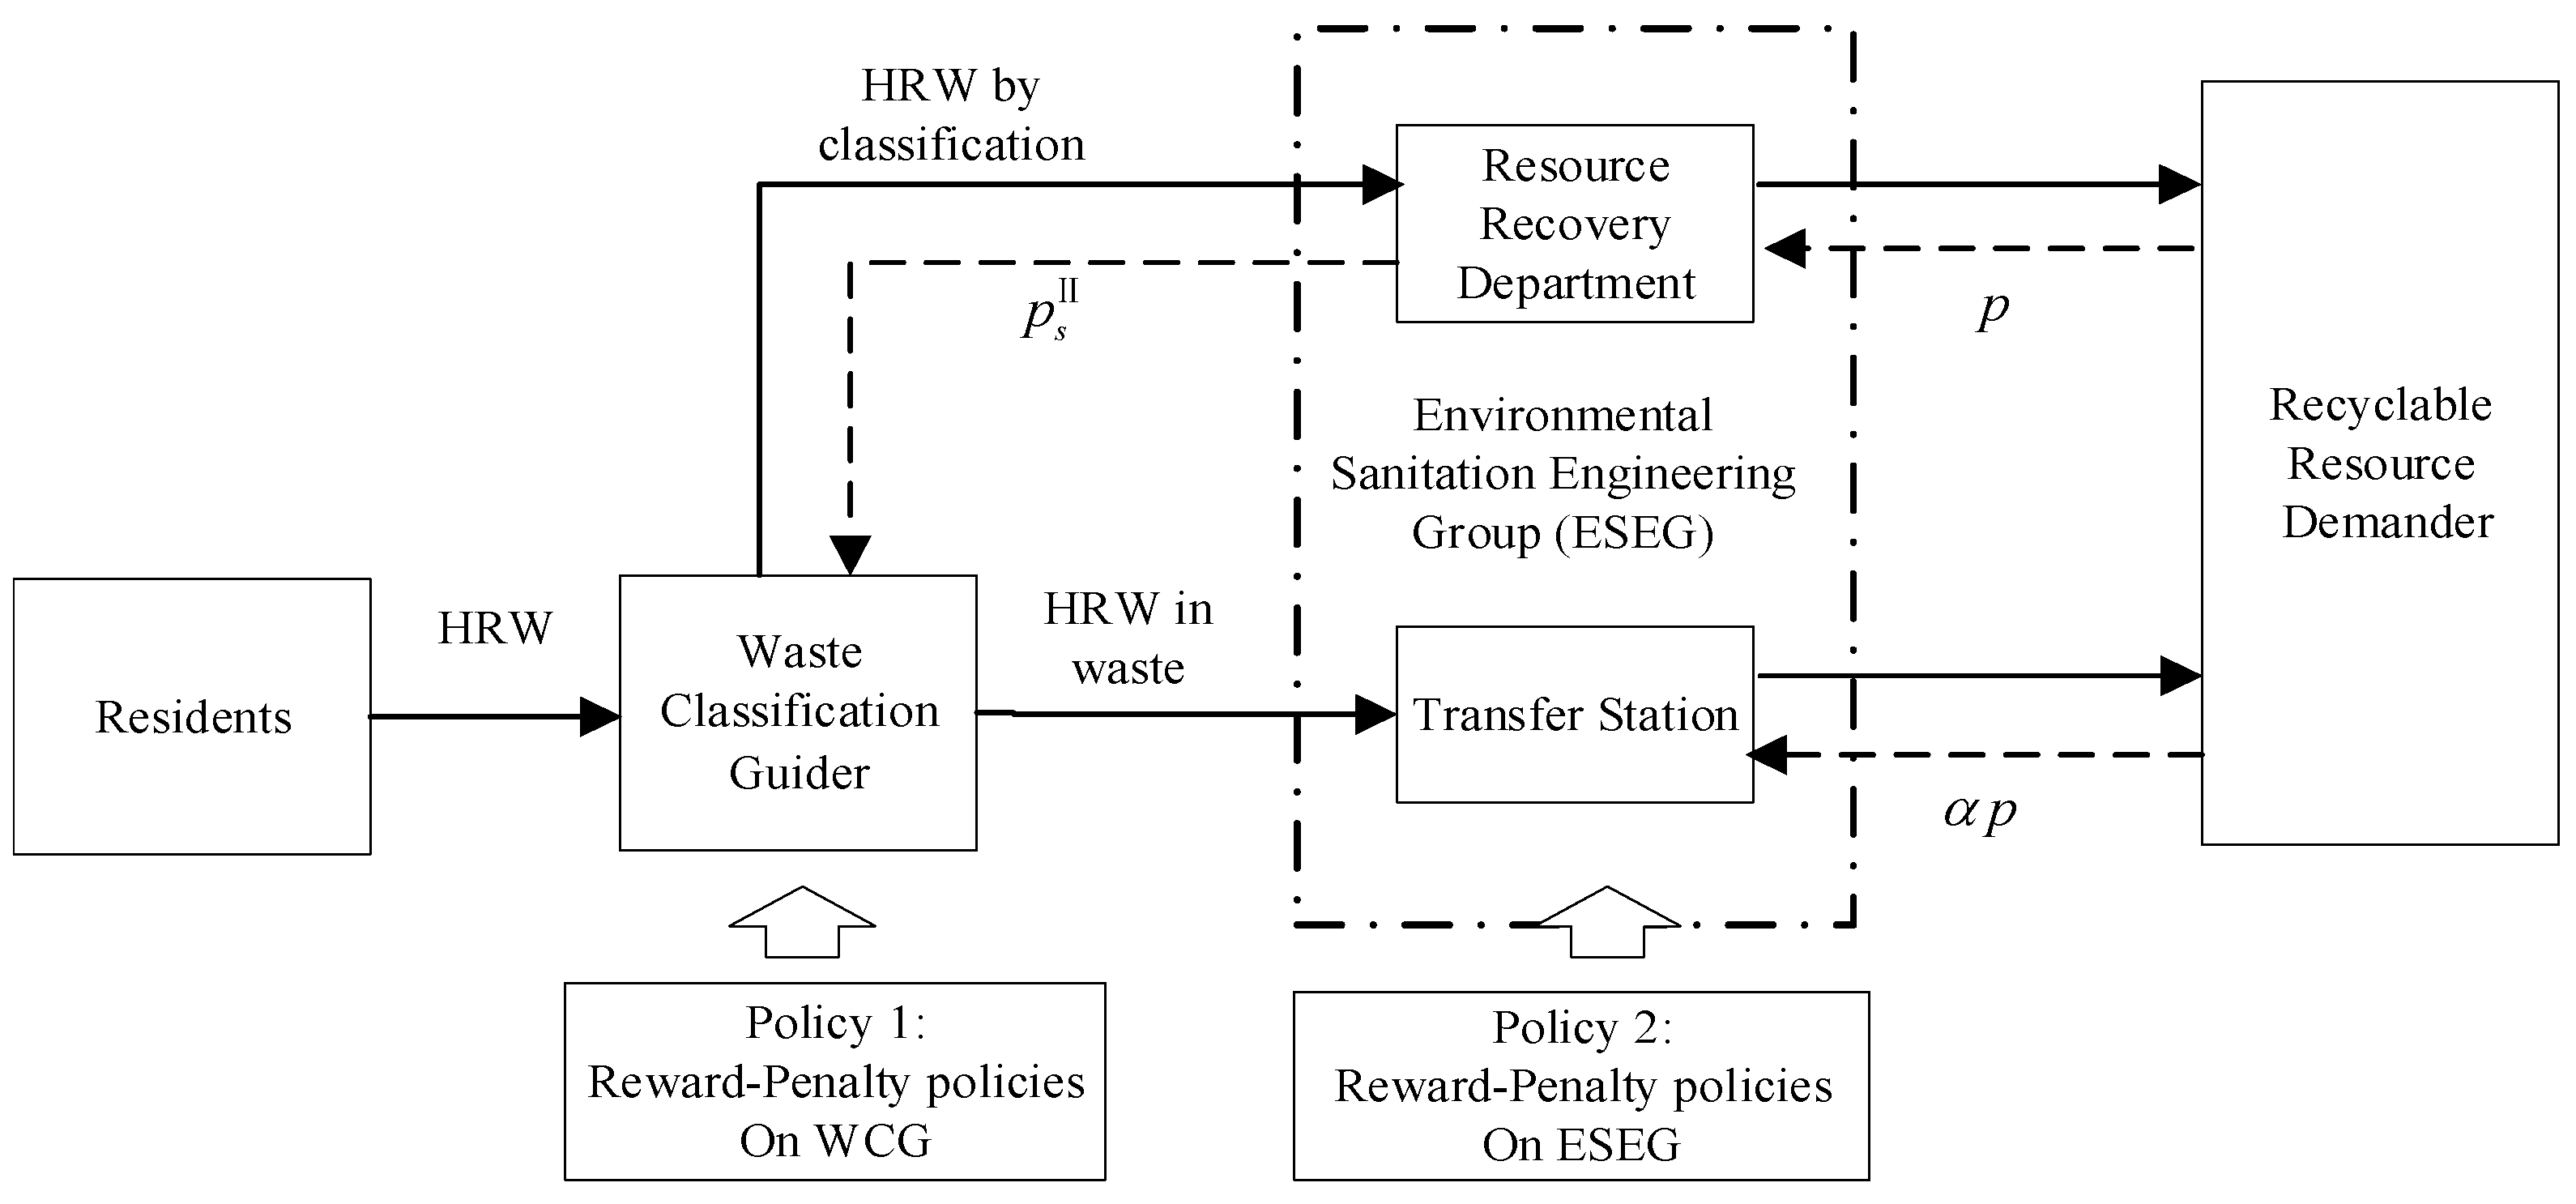
3.1. Problem Description

Figure 1 summarizes the 3RW recycling process under China’s waste classification project, which is combined with the existing literature [19] and is based on the investigation of the implementation of municipal solid waste management regulations in Shanghai, Beijing, Guangzhou and Shenzhen in China.The recyclers of the first mode are dominated by the recycling company (mode RC), and the recyclers of the second mode are dominated by the environmental sanitation engineering group (mode ESEG).
First, the government chooses the WCG for different districts of the city. The WCG is responsible for supervising and guiding the classification of household waste from the property or sub-district office. Two 3RW recycling modes are considered under the waste classification project in China: one is dominated by recycling company (RC), and the other is dominated by environmental sanitation engineering group (ESEG). Then, the WCG can directly sell the 3RW sorted from residential waste to the RC or ESEG at the recycling price, p s . The RC or ESEG will sell the rough finished HRW to the recyclable resource demander at the purchase price, p.
To encourage the recovery efficiency of 3RW, the government can design a reward–penalty mechanism: first, set the target sorting rate, then give a certain reward to the subject who has achieved the target sorting rate and give a certain punishment to the subject who has not achieved the target sorting rate. In view of the two 3RW recycling modes proposed in this paper, we can choose two kinds of reward–penalty policies: one is to adopt the reward–penalty mechanism for the WCG; the other is to adopt the reward–penalty mechanism for the RC or ESEG.

3.2. Notation and Formulas

3.2.1. Notation

Suppose that the number of people in a city’s district that has implemented waste classification is A, and the residents’ average environmental awareness is φ, which is a scaling parameter. The district government can choose the RC or ESEG to be responsible for 3RW recycling and sell the 3RW recycling to the recyclable resource demand company. In economic activities, the recyclable resource demand company first sets the purchase price and is the leader in the Stackelberg game. The recycling activities of each subject are economic.
The notation is defined and summarized in Table 1. Superscripts I and II represent the recycling modes RC and ESEG, respectively. Subscripts s, e and h represent the corresponding participant, the WCG, RC and ESEG, respectively.

3.2.2. Description of Related Formulas

(1) The 3RW sorting rate, τ , consists of two parts, τ = τ 0 + V τ , where τ 0 is the proportion of 3RW recycled by residents who consciously carry out 3RW classification when there is no propaganda or supervision of waste classification guiders, and V τ is the proportion after propaganda and supervision of waste classification guiders.
(2) Based on previous studies [16], the sorting rate without payment is equal to I C , where I is the investment in publicity and supervision and C is a scaling parameter. In this research, we set the 3RW sorting rate after propaganda and supervision to V τ = I A φ , and the cost of publicity investment is A φ V τ 2 .
(3) We assume ξ is the target recycling rate set by the government, and ξ q A is the target recycling amount. In addition, the reward–penalty intensity is set as S . Overall, the total reward or penalty is S [ ( τ 0 + V τ ) q A ξ q A ] .
(4) Supervision costs are involved for the government to implement the penalty and reward mechanism [24]. The fixed cost coefficient is γ , and the total supervision cost is γ × { S [ ( τ 0 + V τ ) q A ξ q A ] } 2 .

4. Stackelberg Game Model

Based on the problem formulation and assumptions, we suppose that the WCG, the recyclable-resource recycler and the demander are all independent decision-makers. Each of them aims to maximize its own profit, but the decision-making results are mutually influential. Due to its sufficient channel dominance, the demander behaves as the Stackelberg leader and can use foresight about other followers’ action functions when making his own first move. The WCG and recycler are followers that observe the leader’s strategy and react correspondingly. This chapter first establishes the profit function of each subject in the two recycling modes and solves it using Stackelberg theory.

4.1. Mode I—RC Recycling

As shown in Figure 2, the recycling company directly collects 3RW from residents. In this mode, the demander first sets p to maximize its own profit. Then the recycling enterprises determine p s to maximize its profit. The government’s first choice is to adopt the reward–penalty policy for the WCG, and the second choice is to adopt the reward–penalty policy for the recycling company.
The profit functions of the WCG and the recycler are as follows:
π s [ V τ ] = p s ( τ 0 + V τ ) q A A φ ( V τ ) 2 + S s [ ( τ 0 + V τ ) q A ξ s q A ] ,
π e [ p s ] = ( p p s ) ( τ 0 + V τ ) q A + S e [ ( τ 0 + V τ ) q A ξ e q A ] ,
The calculation is first conducted by characterizing the best response function of the WCG. As 2 π s V τ 2 = 2 < 0 , let π s V τ = 0 , so V τ = q p s + S s 2 φ . Subsequently, the WCG’s best response function is substituted into the recycler’s objective Function (2), as 2 π e p s 2 = q 2 A φ < 0 , let π e p s = 0 , so the optimal values can be calculated as follows:
p s * = p S s + S e 2 τ 0 φ q ,
V τ * = q p + S s + S e 4 φ τ 0 2 ,
Then, we can derive the optimal profit of the WCG and recycler:
π s * = A q 2 4 φ ( P + S s + S e 2 + τ 0 φ q ) 2 A φ τ 0 2 S s q A ξ s ,
π e * = A q 2 2 φ ( P + S s + S e 2 + τ 0 k φ q ) 2 S e q A ξ e ,
The above conclusions show that the increase in 3RW recycling price, the increase in residents’ environmental awareness (the number is decreased) and the increase in 3RW quantity generated by residents promote the sorting rate. The reward–penalty policy can promote the sorting rate and increase the profits of waste classification guiders and RCs. Considering the actual situation V τ * < 1 τ 0 , we can obtain Theorem 1.
Theorem 1. 
In the mode RC, when S s < 2 φ 2 τ 0 q p or S e < 2 φ 2 τ 0 q p , all the 3RW can be recovered, as τ * = 1 .

4.2. Mode II—ESEG Recycling

As shown in Figure 3, the environmental sanitation engineering group directly collects Q 1 3RW from residents with recycling price p s . The remaining q A Q 1 3RW is transported to the waste transfer station mixed with solid waste, and Q 2 = β ( q A Q 1 ) of 3RW is separated from the waste through a sorting machine, where β ( 0 β 1 ) is the mechanical sorting rate, and then sold to the recyclable resource demander at price α p ( 0 α 1 ) .
In this mode, the demander first sets p to maximize his or her own profit. Then, the ESEG determines p s to maximize its profit. The government’s first choice is to adopt the reward–penalty mechanism for the WCG, and the second choice is to adopt the reward–penalty mechanism for the ESEG. The profit functions of the WCG and ESEG are as follows:
π s [ V τ ] = p s ( τ 0 + V τ ) q A A φ ( V τ ) 2 + S s [ ( τ 0 + V τ ) q A ξ s q A ] ,
π h [ p s ] = ( p p s ) q A ( τ 0 + V τ ) + α p [ 1 ( τ 0 + V τ ) ] q A β + S h [ ( τ 0 + V τ ) q A + [ 1 ( τ 0 + V τ ) ] q A β ξ h q A ] ,
The calculation is first performed by characterizing the best response function of the ESEG. As π s 2 V τ 2 = 2 < 0 , let π s V τ = 0 , so V τ = q p s + S s 2 φ . Subsequently, the ESEG’s best response function is substituted into the ESEG’s objective Function (8). As 2 π h p s 2 = q 2 A φ < 0 , let π h p s = 0 , so the optimal values can be calculated as follows:
p s * = p ( 1 α β ) S s + ( 1 β ) S h 2 τ 0 φ q ,
V τ * = q 2 φ p ( 1 α β ) + S s + S h ( 1 β ) 2 τ 0 2 ,
Then, we can derive the optimal sorting rate and profit of mode II.
τ * = [ q 2 φ p ( 1 α β ) + S s + S h ( 1 β ) 2 + τ 0 2 ] ( 1 β ) + β ,
π s * = A q 2 4 φ ( p ( 1 α β ) + S s + ( 1 β ) S h 2 + τ 0 φ q ) 2 A τ 0 2 k 2 S s q A ξ s ,
π h * = A q 2 2 φ ( p ( 1 α β ) + S s + ( 1 β ) S h 2 + τ 0 φ q ) 2 + ( p α + S h ) q β A S h q A ξ h ,
The above conclusions show that the increase in 3RW purchase price, the increase in residents’ environmental awareness (the number is decreased) and the increase in 3RW quantity generated by residents promote the sorting rate. However, the higher the price discount of purchasing 3RW from the transfer station is, the lower the sorting rate of 3RW. The reward–penalty policy can promote the sorting rate and increase the profits of the WCG and ESEG. Considering the actual situation V τ * < 1 τ 0 , we can obtain Theorem 2.
Theorem 2. 
In mode II, when S s 2 φ 2 τ 0 q p ( 1 α β ) or S h 2 φ 2 τ 0 q ( 1 β ) p ( 1 α β ) ( 1 β ) , all the 3RW can be recovered, as τ * = 1 .

5. Analysis of Results

Table 2 shows the optimal decisions of the two models. The observations show that in mode I, S s and S e have the same impact on the sorting rate, τ , and the total profit, V , but increasing S s will reduce the recovery price, p s , while increasing S e increases it; in mode II, the impacts of S s and S e on the sorting rate, τ , recovery price, p s , and total profit, π , are different.
The optimal sorting rate and the main profit of the two models without reward–penalty policies will be compared first in the following, and then, the subsidy efficiency and total social welfare impact are set to compare the recovery efficiency of the two models with reward–penalty policies.

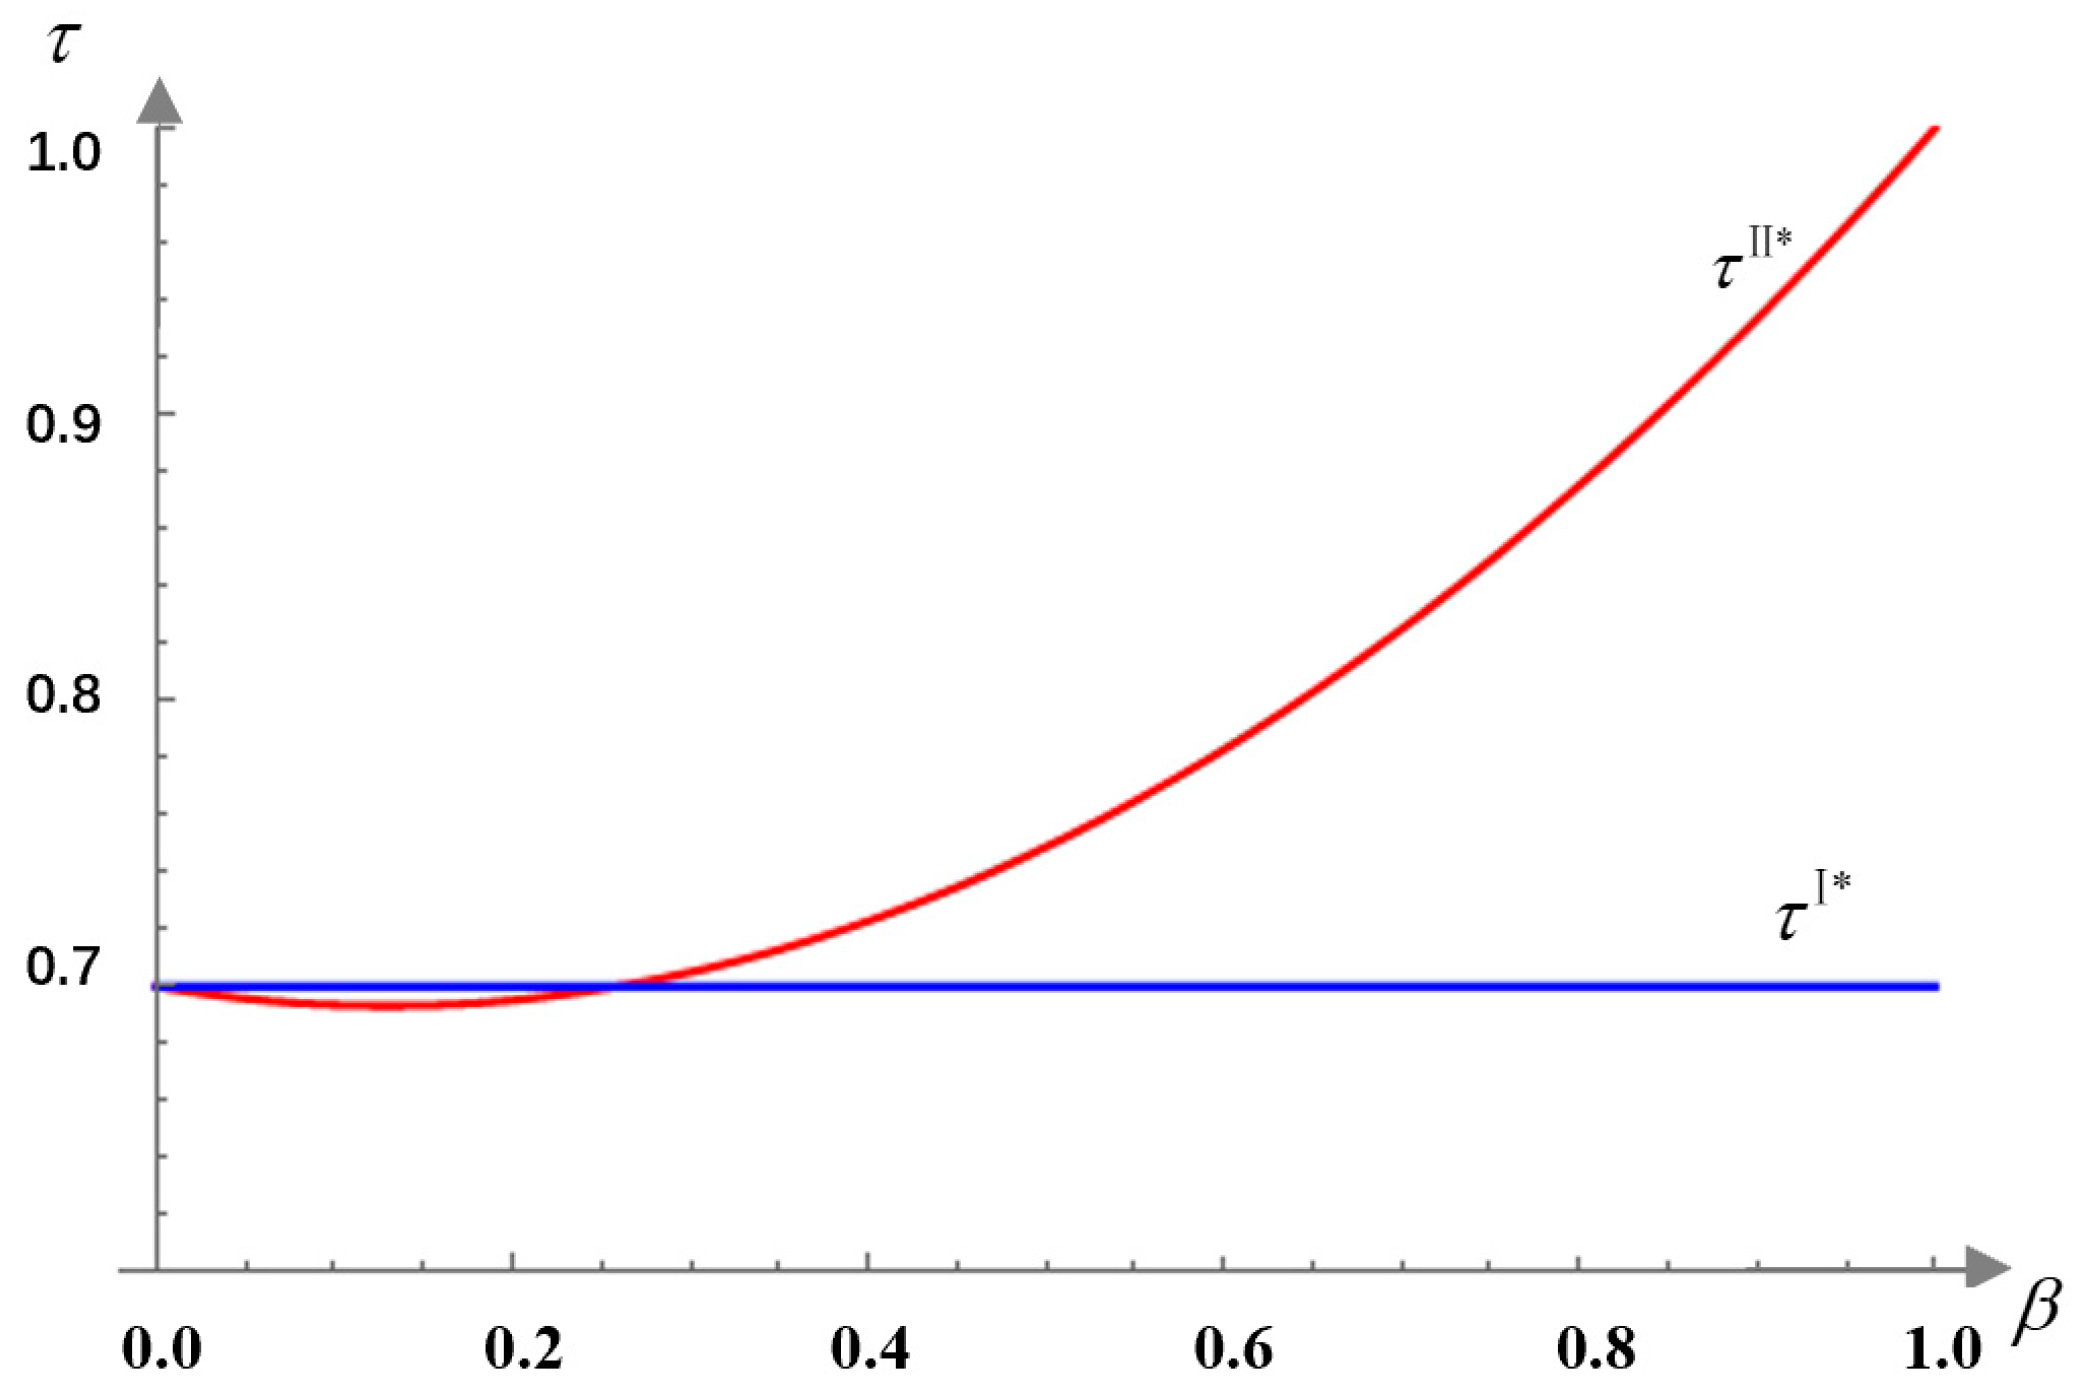
5.1. Comparison of Models without Reward–Penalty Policies

In this section, the formulas of the optimal sorting rate and the total profit of the two modes without reward–penalty policies are first introduced and then compared.
(1) Comparison of sorting rates
Let S = 0 , ξ = 0 ; then, we can obtain the formula of the optimal sorting rate of the two modes without reward–penalty policies as follows:
τ * = q p 4 φ + τ 0 2 ,
τ * = [ q p ( 1 α β ) 4 φ + τ 0 2 ] ( 1 β ) + β ,
Formula (15) can be regarded as a quadratic function of the mechanical sorting rate, β . According to the assumption of the problem, to meet the requirement τ * > τ 0 , the parameters of model II should be satisfied α 4 φ + p q 6 φ τ 0 + 4 φ p q 2 φ 2 τ 0 φ p q τ 0 + 2 φ 2 τ 0 2 p q . If we let τ * > τ * , then β > β 1 = p q 4 φ + α p q + 2 φ τ 0 α p q is obtained. Therefore, we can obtain Theorem 3.
Theorem 3. 
The parameters of model II should satisfy the formula α 4 φ + p q 6 φ τ 0 + 4 φ p q 2 φ 2 τ 0 φ p q τ 0 + 2 φ 2 τ 0 2 p q , and when β > β 1 = p q 4 φ + α p q + 2 φ τ 0 α p q , the sorting rate of mode II is higher than that of mode I, as τ * > τ * .
(2) Comparison of total profits
As before, let S = 0 , ξ = 0 ; then, we can obtain the formula of the WCG’s profit in the two modes without reward–penalty policies as follows:
π s * = A q 2 4 φ ( P 2 + τ 0 φ q ) 2 A φ τ 0 2 ,
π s * = A q 2 4 φ ( p ( 1 α β ) 2 + τ 0 φ q ) 2 A φ τ 0 2 ,
If we assume π s * > π s * , it can be found that it is impossible to satisfy 1 α β > 1 , then it can be obtained that π s * > π s * , and Theorem 4 can be obtained as follows.
In addition, the formulas of total profit in the two modes without reward–penalty policies are as follows:
V * = 3 A q 2 4 φ ( P 2 + τ 0 φ q ) 2 A φ τ 0 2 ,
V * = 3 A q 2 4 φ ( p ( 1 α β ) 2 + τ 0 φ q ) 2 A φ τ 0 2 + α p q β A ,
The expression of V * can be regarded as a quadratic function of the mechanical sorting rate, β . Let V * > V * , then the formulate β > β 2 = 2 ( 3 p q 8 φ + 6 φ τ 0 ) 3 α p q should be satisfied, and Theorem 4 can be obtained.
Theorem 4. 
The profit of the WCG in mode I is higher than that in mode II, that is, π s * > π s * , and the total profit of mode II is higher than that of mode I when  β > β 2 = 2 ( 3 p q 8 φ + 6 φ τ 0 ) 3 α p q , that is V * > V * .
To study the impact of different reward–penalty policy objects on the two recycling modes, numerical examples are introduced in the following section.

5.2. Numerical Analysis

5.2.1. Data Determination and Analysis of Model I

Based on the literature study and data collected from Haidian District of Beijing, as well as from investigating the waste classification activities of Beijing ESEG, the parameters in 3RW recycling are determined and shown in Table 3. Here, we set α 0.04 to meet the needs of society τ * > τ 0 , so it is assumed that α = 0.6 , the recyclable sales price P is 300,000 CNY/ton, and the scaling parameter, φ , is 4000. Considering the high regulatory cost of waste classification and low value of 3RW, let γ be 0.0000006 and E be 150, referring to the literature [34].
Using the above conclusions to analyze the parameters, the recycling price and sorting rate of mode I are p s * = 14.44 and τ * = 0.7 , respectively. The profits of the WGC, RC and total profit are π s * = 654 , 810 , π e * = 1 , 316 , 340 and π e * = 1 , 971 , 150 , respectively.
On this basis, let β [ 0 , 1 ] , and the impact of the mechanical sorting rate, β , on the sorting rate and total profit of mode II is shown as Figure 4 and Figure 5. Comparing the sorting rate and total profit of mode II with those of mode I shows that the sorting rate of mode II was higher than that of mode I when β > 0.259 , and the total profit of mode II was higher than that of mode I when β > 0.165 , which is consistent with Theorem 3.
Different scenarios (see Table 4) were set in this paper by changing factors such as the recycler, the implementation objects of policies and the mechanical sorting rate. The results in different scenarios are analyzed and compared in the following section.
Considering that different mechanical sorting rates, β , lead to different sorting rates and profits in mode I and mode II, two cases of mode II are considered in the following study: case 1 with a lower mechanical sorting rate ( β = 0.1 ) and case 2 with a higher mechanical sorting rate ( β = 0.4 ).
Through the analysis, the effects of the two policies in mode I can be called scenario 1, the effects of policy 1 and policy 2 on case 2 in mode II can be called scenario 2 and scenario 3, respectively and the effects of policy 1 and policy 2 on case 2 in mode II can be called scenario 4 and scenario 5, respectively. According to conclusion 1 and conclusion 2, in mode I, when S s 13 or S e 13 , τ * = 1 ; and in mode II, if β = 0.1 in case 1, then when S s 15 or S h 16 , τ * = 1 , and if β = 0.4 in case 2, then when S s 20 or S h 34 , τ * = 1 .
In summary, this paper proposes the evaluation indexes of subsidy efficiency and total social welfare to study the impact of reward–penalty intensity, S [ 0 , 10 ] , and target sorting rate, ξ [ 0 , 1 ] , on the above five scenarios.

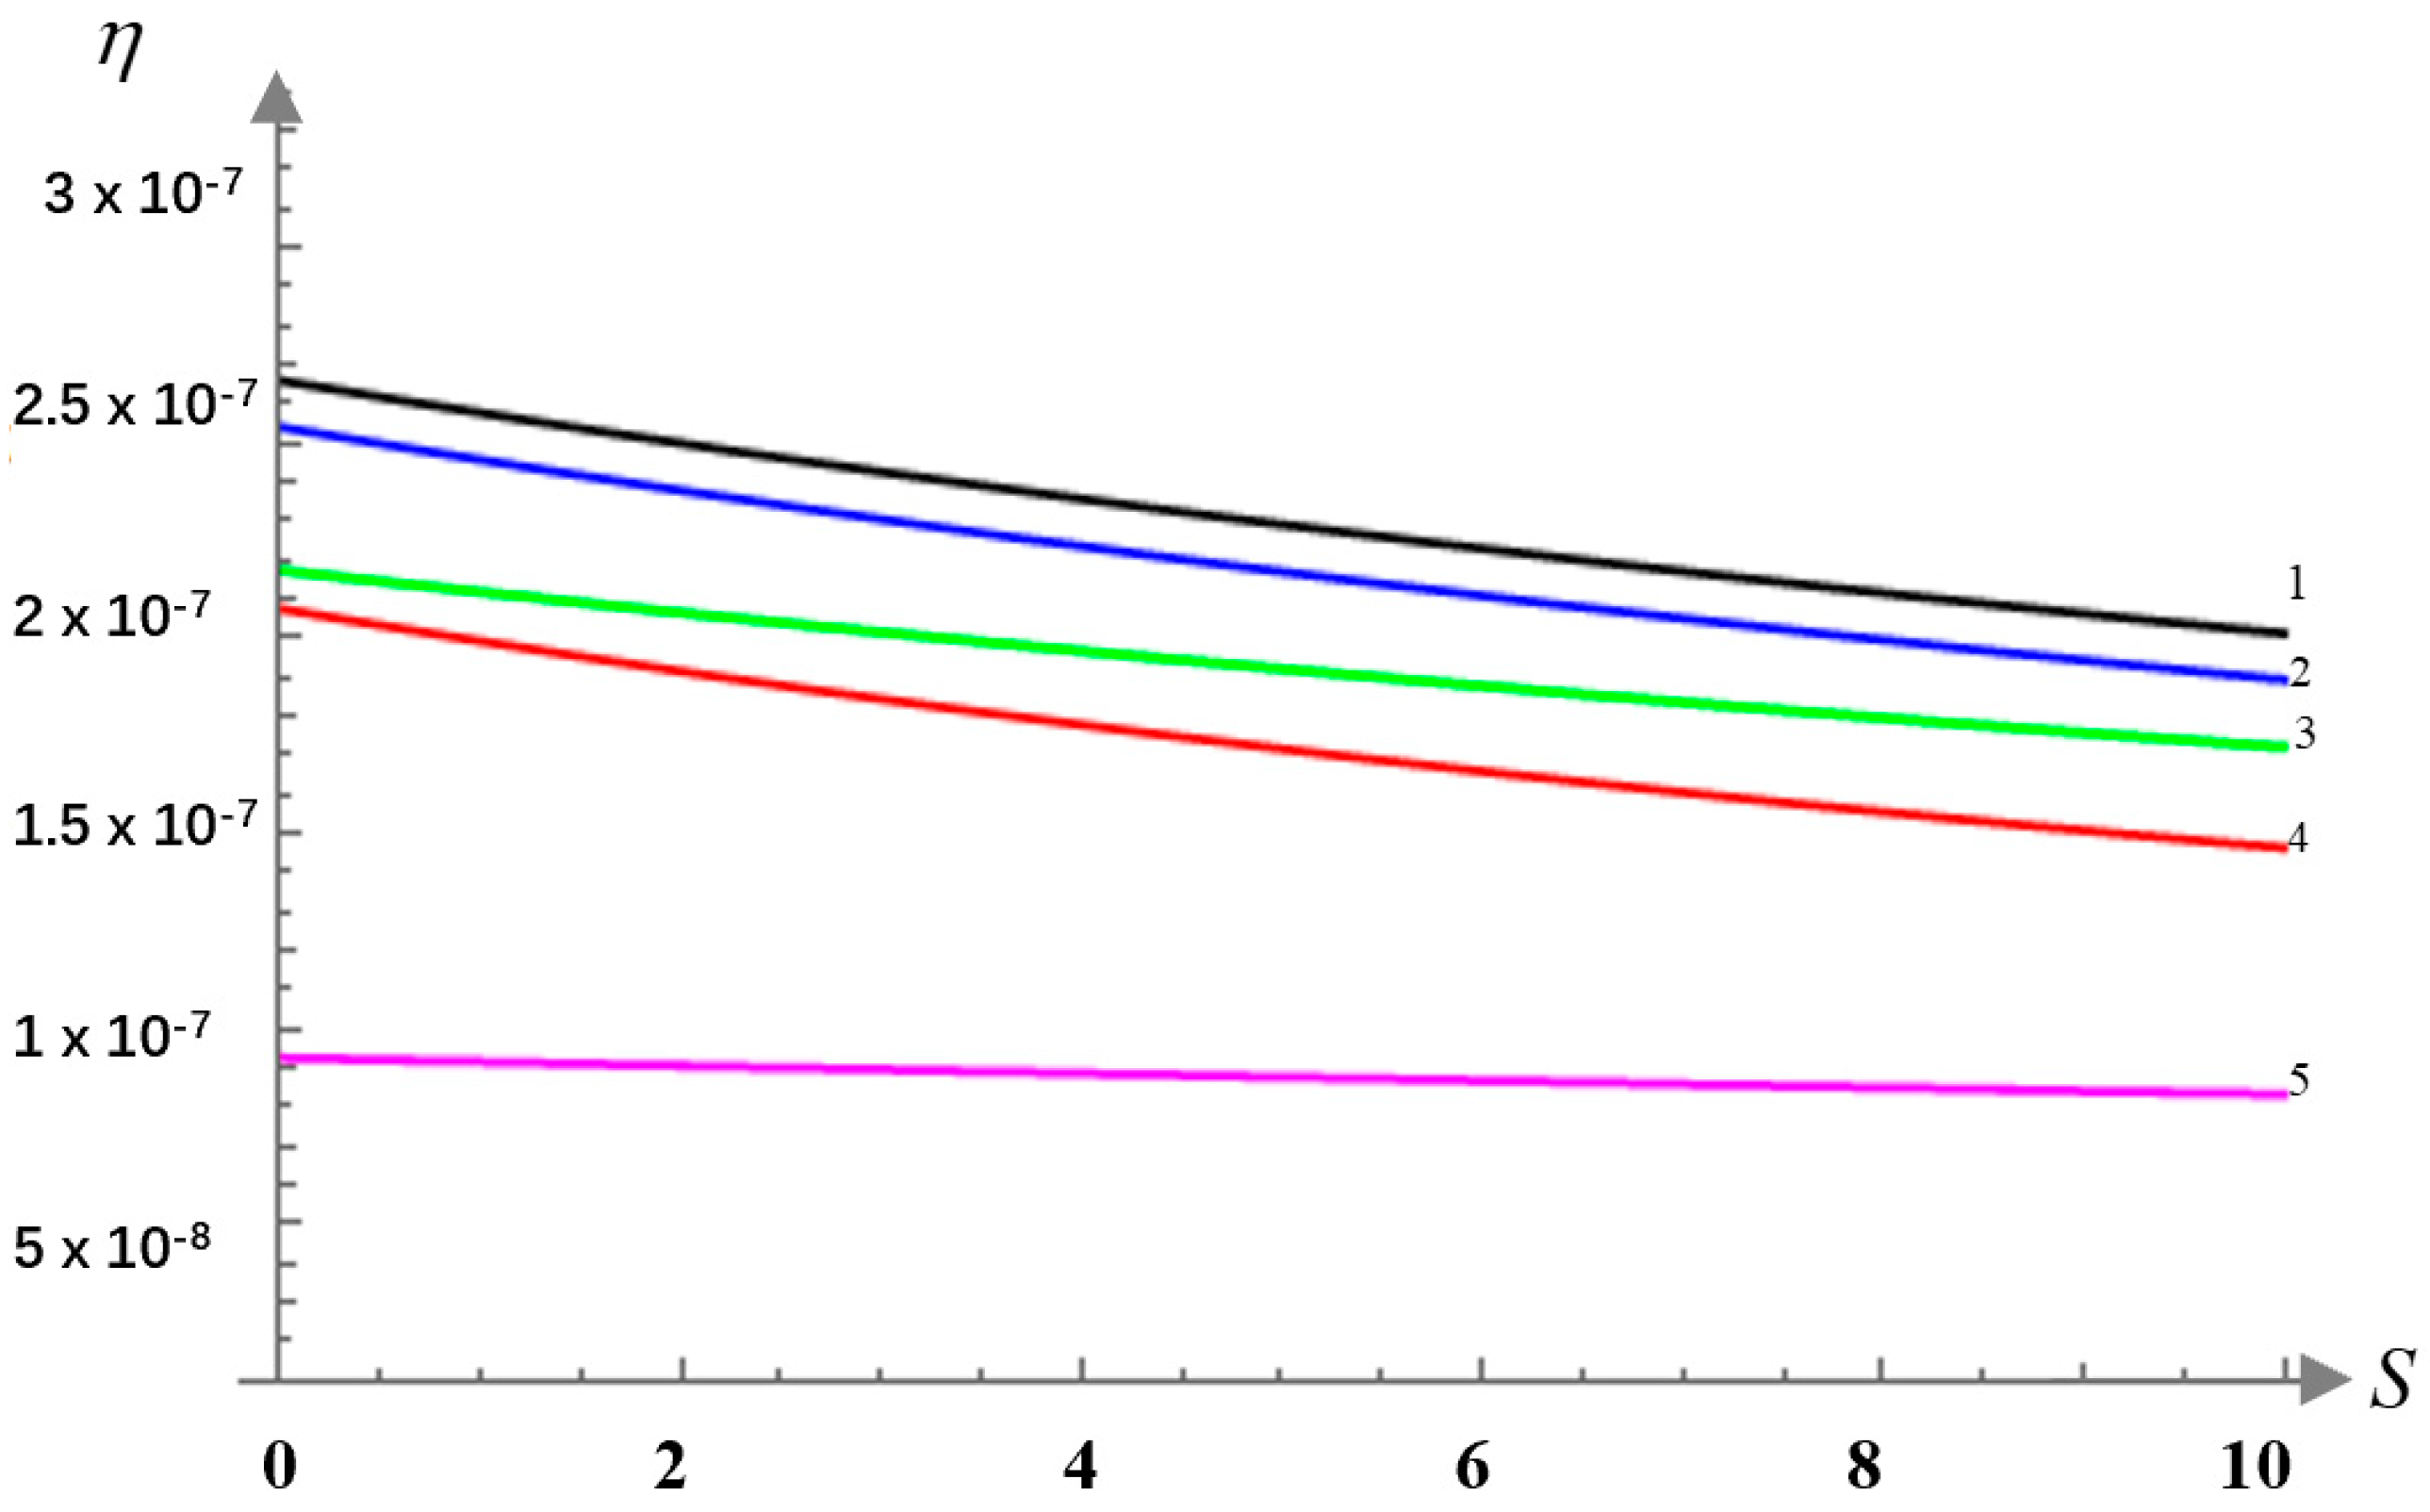
5.2.2. Comparison of the Reward Efficiency

As the optimal sorting rate and profit formula of each mode can be obtained from the above, then the calculation formula of the 3RW collection quantity under each mode can be deduced as follows:
Q * = q 2 A 2 ( P + S s + S e 2 φ + τ 0 q ) ,
Q = q 2 A 2 ( p ( 1 α β ) + S s + S h ( 1 β ) 2 φ + τ 0 q ) ,
Let ξ = 0 ; when the reward–penalty intensity S [ 0 , 10 ] , the impact of S on collection quantity in the above five scenarios can be obtained, which is shown in Figure 6 below. It is easy to find that the graph of the sorting rate is the same as that of the collection quantity.
Figure 6 shows that with the increase in reward–penalty intensity, the recycling quantity of 3RW shows an upward trend in the five scenarios. When the reward–penalty policy is adopted for mode I, the increase in collection quantity with the increase in reward–penalty intensity is the fastest in the five scenarios. The growth rate of the collection quantity in scenario 2 is higher than that in scenario 3. The growth rate of the collection quantity in scenario 4 is higher than that in scenario 5, which indicates that there is more 3RW quantity when enacting the reward policy for the WCG than for the ESEG in mode II. The growth rate of collection quantity in scenario 2 and scenario 3 is higher than that in scenario 4 and scenario 5, respectively, which indicates that the higher mechanical sorting rate is not conducive to the increase in 3RW in mode II under the reward–penalty policy.
To further analyze the subsidy impact in five situations, the subsidy efficiency, η , which is equal to the increase in 3RW quantity/investment is set in this paper. Then, the formulas under the two modes can be obtained as follows:
η = 1 q ( p + S 1 ) + 2 φ τ 0 4 φ ξ 1 ,
η = ( 1 β ) q ( p ( 1 α β ) + S s + ( 1 β ) S h ) A + 2 φ τ 0 A 4 φ ξ s A 4 φ A ( β ξ h ) / ( 1 β ) ,
Let ξ = 0 , and the impact on subsidy efficiency in the above five scenarios can be obtained when the reward–penalty intensity S [ 0 , 10 ] , which is shown in Figure 7 below.
Figure 7 shows that with the increase in reward–penalty intensity, the subsidy efficiency decreases in all five scenarios. Of the five scenarios, scenario 1 has the highest subsidy efficiency, and the subsidy efficiency in scenario 2 is higher than that in scenario 3, meanwhile, the subsidy efficiency in scenario 4 is higher than that in scenario 5, which indicates that the subsidy efficiency is higher when enacting the reward policy for the WCG than for the ESEG in mode II. In addition, the subsidy efficiency in scenario 2 and scenario 3 is higher than that in scenario 4 and scenario 5, respectively, which indicates that the higher mechanical sorting rate is not conducive to the increase in subsidy efficiency in mode II under the reward–penalty policy; however, the decreasing slopes of scenario 3 and scenario 5 are lower than those of scenario 2 and scenario 4, which indicates that a higher mechanical sorting rate can reduce the impact of reward–penalty intensity on decreasing subsidy efficiency.

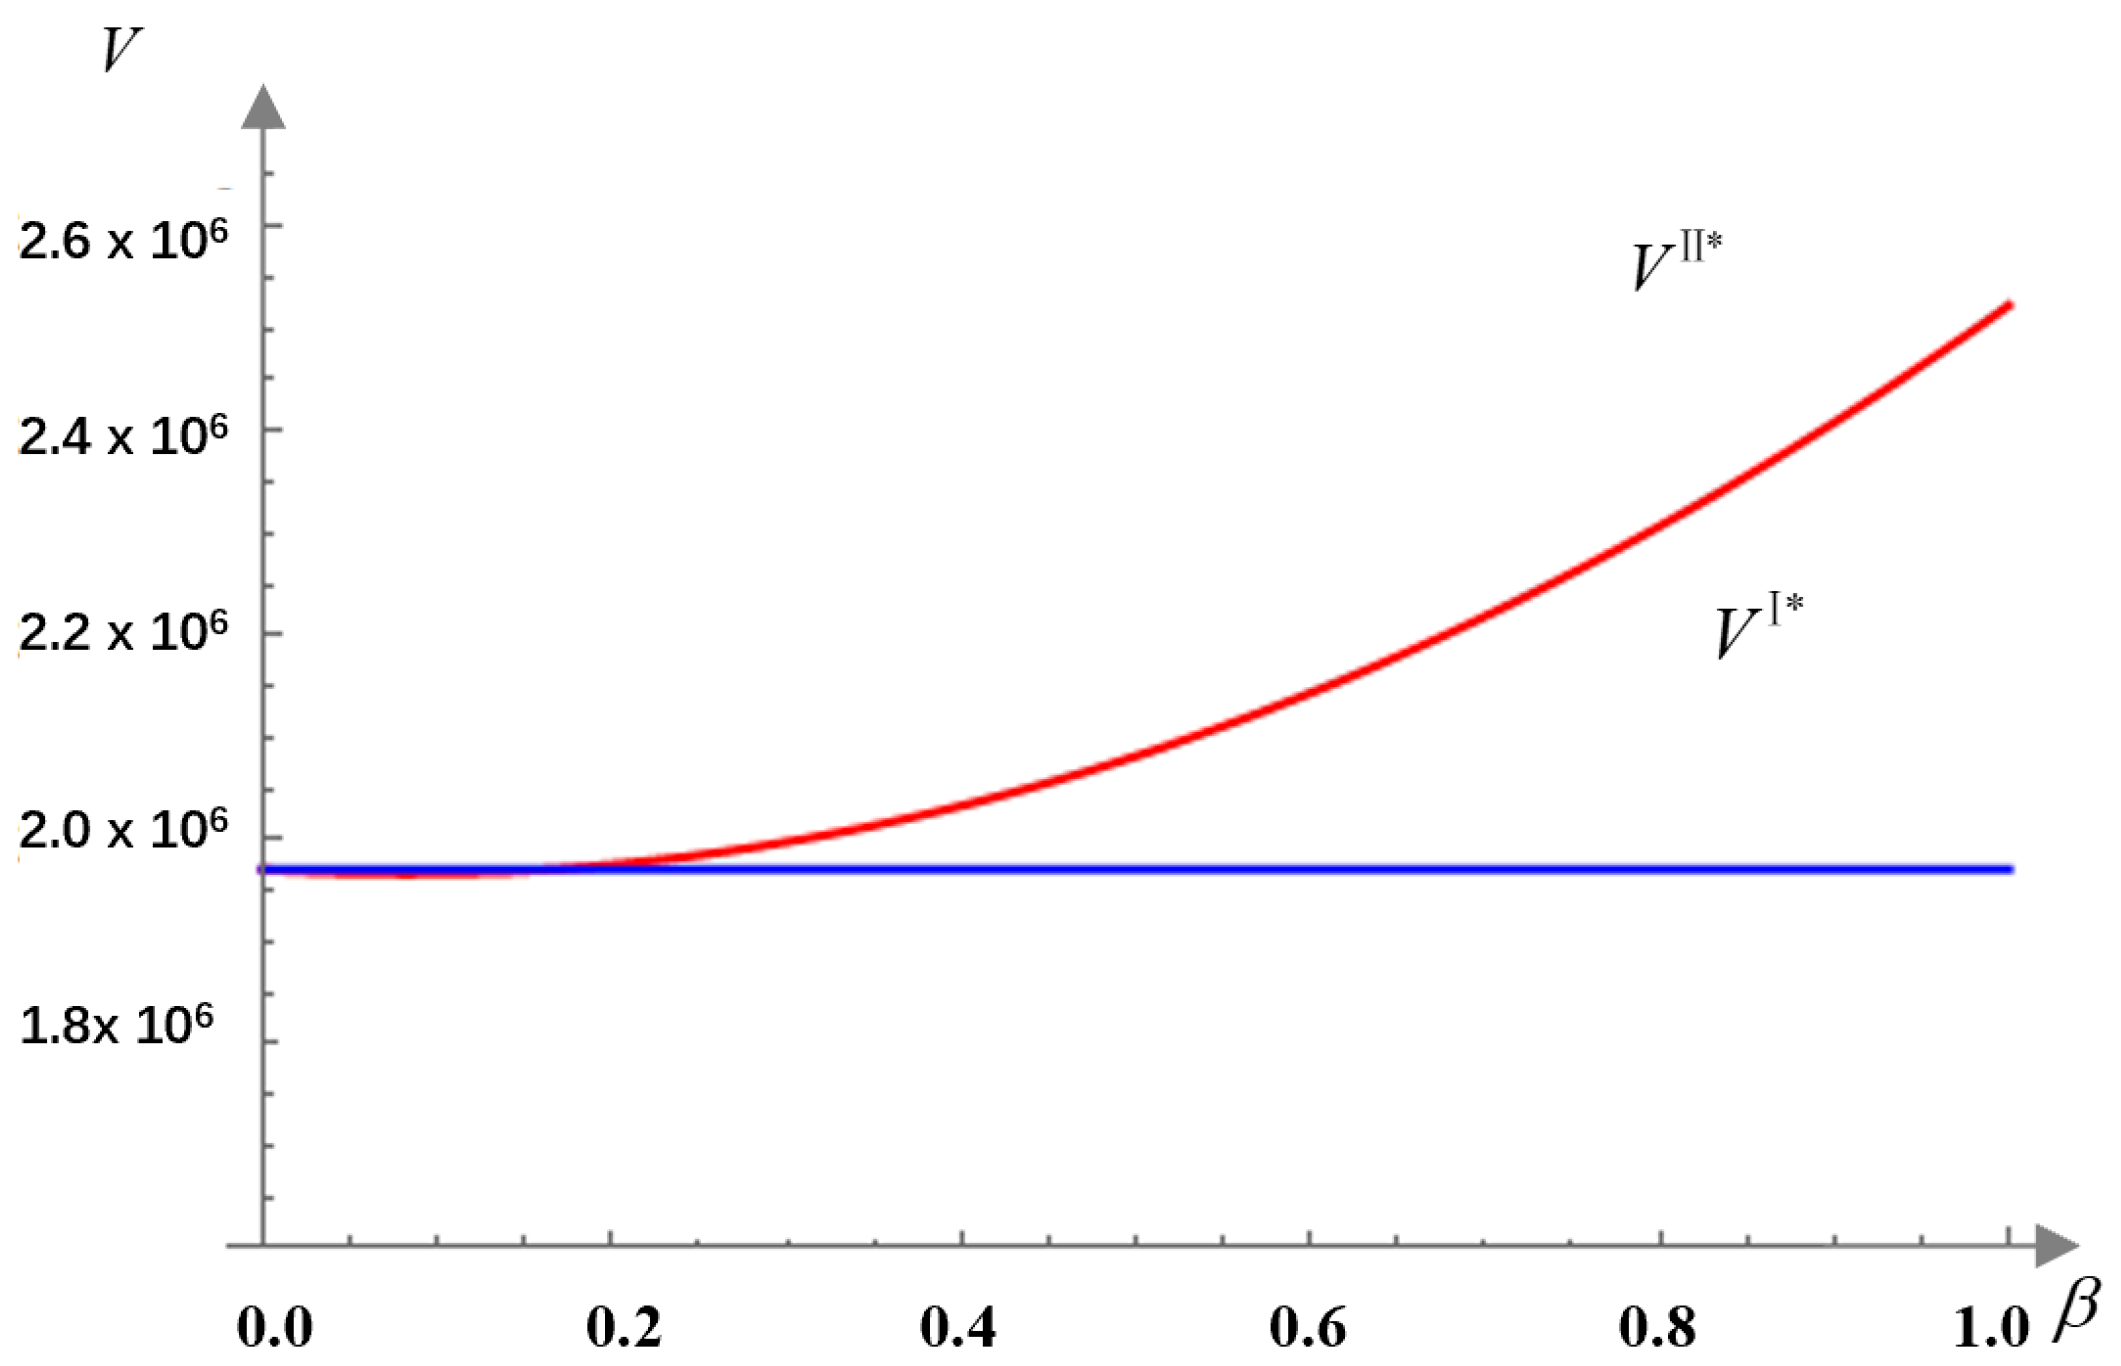
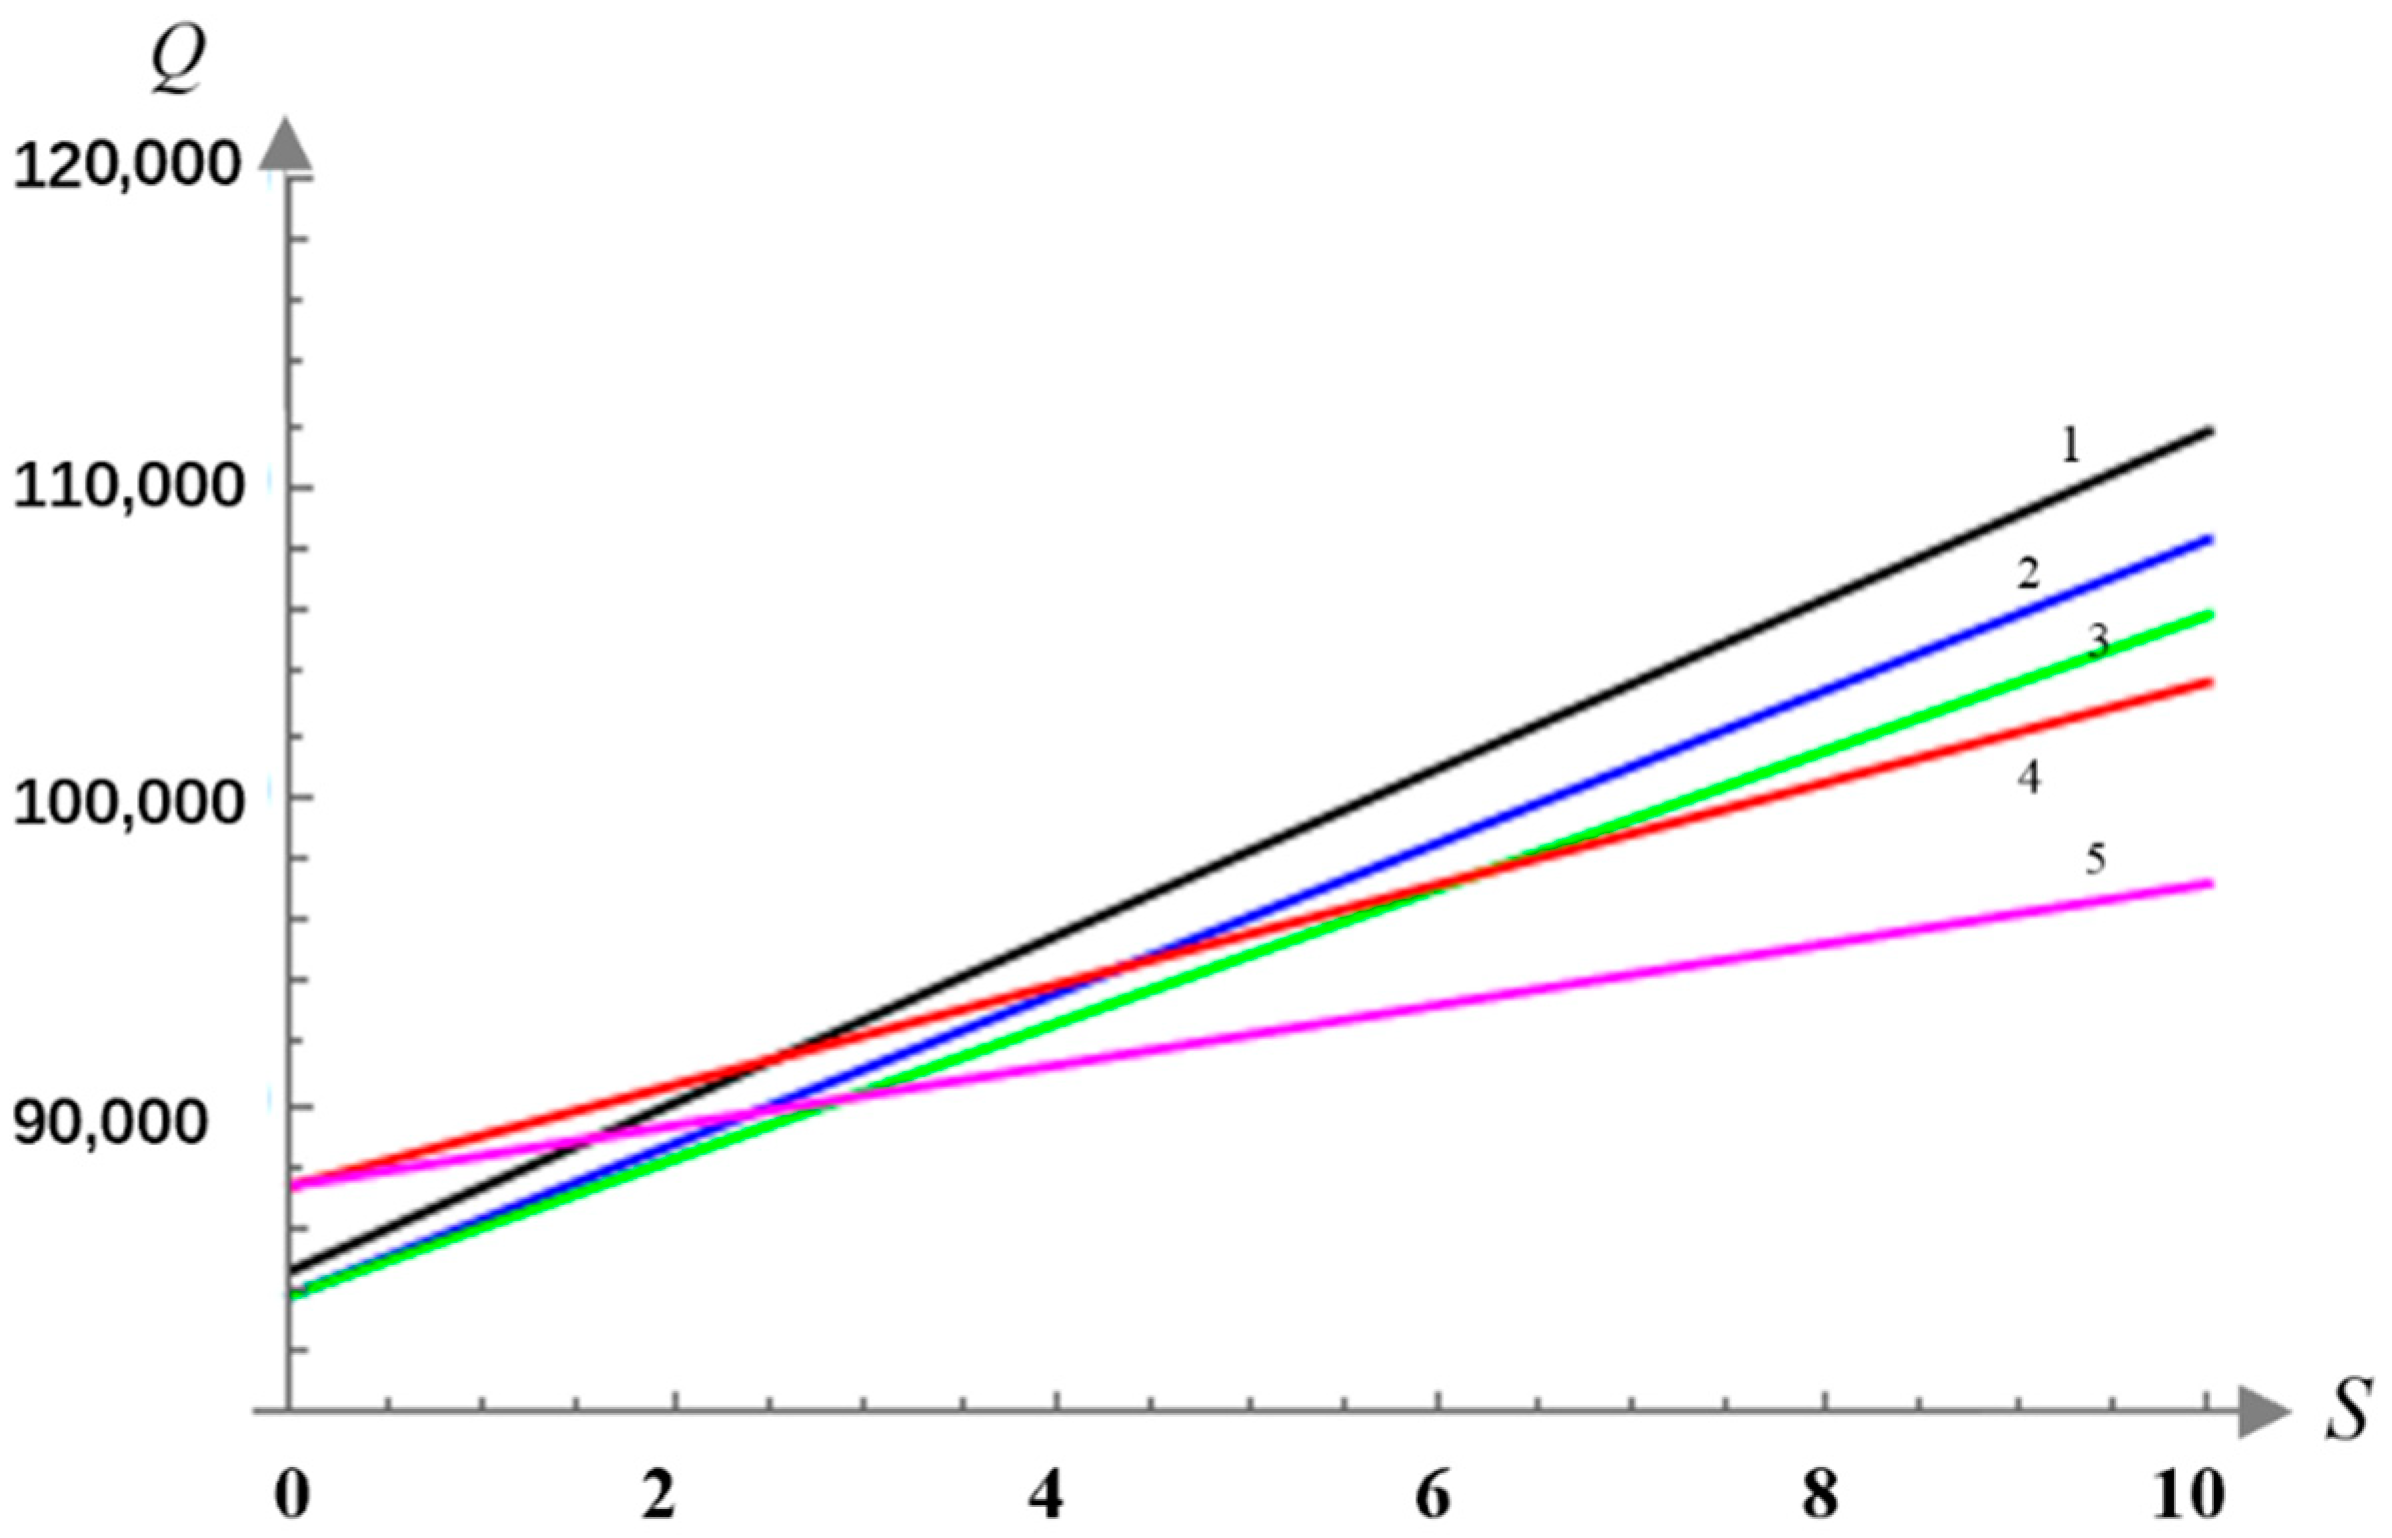
5.2.3. Comparison of the Total Social Welfare

Let ξ = 0 ; when the reward–penalty intensity S [ 0 , 10 ] , we can obtain the changes in the WCG profit and the total profit in mode I and mode II in the above five scenarios, as shown in Figure 8 and Figure 9, respectively.
Figure 8 and Figure 9 show that with the increase in reward–penalty intensity, the WCG profit and the total profit increase in all five scenarios. Of the five scenarios, scenario 1 has the highest rates of increase in the WCG profit and the total profit, and the rates of increase in the WCG profit and the total profit in scenario 2 are higher than those in scenario 3, meanwhile, those in scenario 4 are higher than that in scenario 5, which indicates that the profit is higher when enacting the reward policy for the WCG than for the ESEG in mode II. In addition, the rates of increase in the WCG profit and the total profit in scenarios 2 and 3 are higher than those in scenarios 4 and 5, respectively, which indicates that the higher mechanical sorting rate is not conducive to the increase in profit under the reward–penalty policy in mode II.
To comprehensively analyze the impact of the reward–penalty policy on the economy, society and environment in the five scenarios, we introduce the total social welfare W , which is composed of the sum of profit j π j i , government supervision cost γ × { S [ ( τ 0 + V τ ) q A ξ q A ] } 2 and resource saving impact q A τ i E under the reward–penalty policy [34], where E is the environmental cost savings when using renewable resources for production.
W i = j π j i γ × { S [ ( τ 0 + V τ ) q A ξ q A ] } 2 + q A τ i E ,
Based on the assumption ξ = 0.1 , we can obtain the change in total social welfare in the above five scenarios when the reward–penalty intensity S [ 0 , 10 ] , as shown in Figure 10 below.
Figure 10 shows that the reward–penalty policy can indeed promote total social welfare to some degree. However, higher intensity does not always cause higher social welfare; with the increase in reward–penalty intensity, the total social welfare first increases and then decreases in all scenarios. When the intensity is above a certain level, it brings a large supervision burden for the government, which is also demonstrated in [34]. Therefore, the reward–penalty intensity should not exceed the value that makes the total social welfare reach the peak. In addition, the comparison shows that, of the five scenarios, scenario 1 has the highest peak of total social welfare; the order of the rate of increase of total social welfare with the increase in reward–penalty intensity in the five scenarios from low to high is scenario 5, scenario 4, scenario 3, scenario 2 and scenario 1; when the total social welfare reaches the peak and begins to decline, the order of the rate of decrease from low to high is scenario 5, scenario 4, scenario 3, scenario 2 and scenario 1.

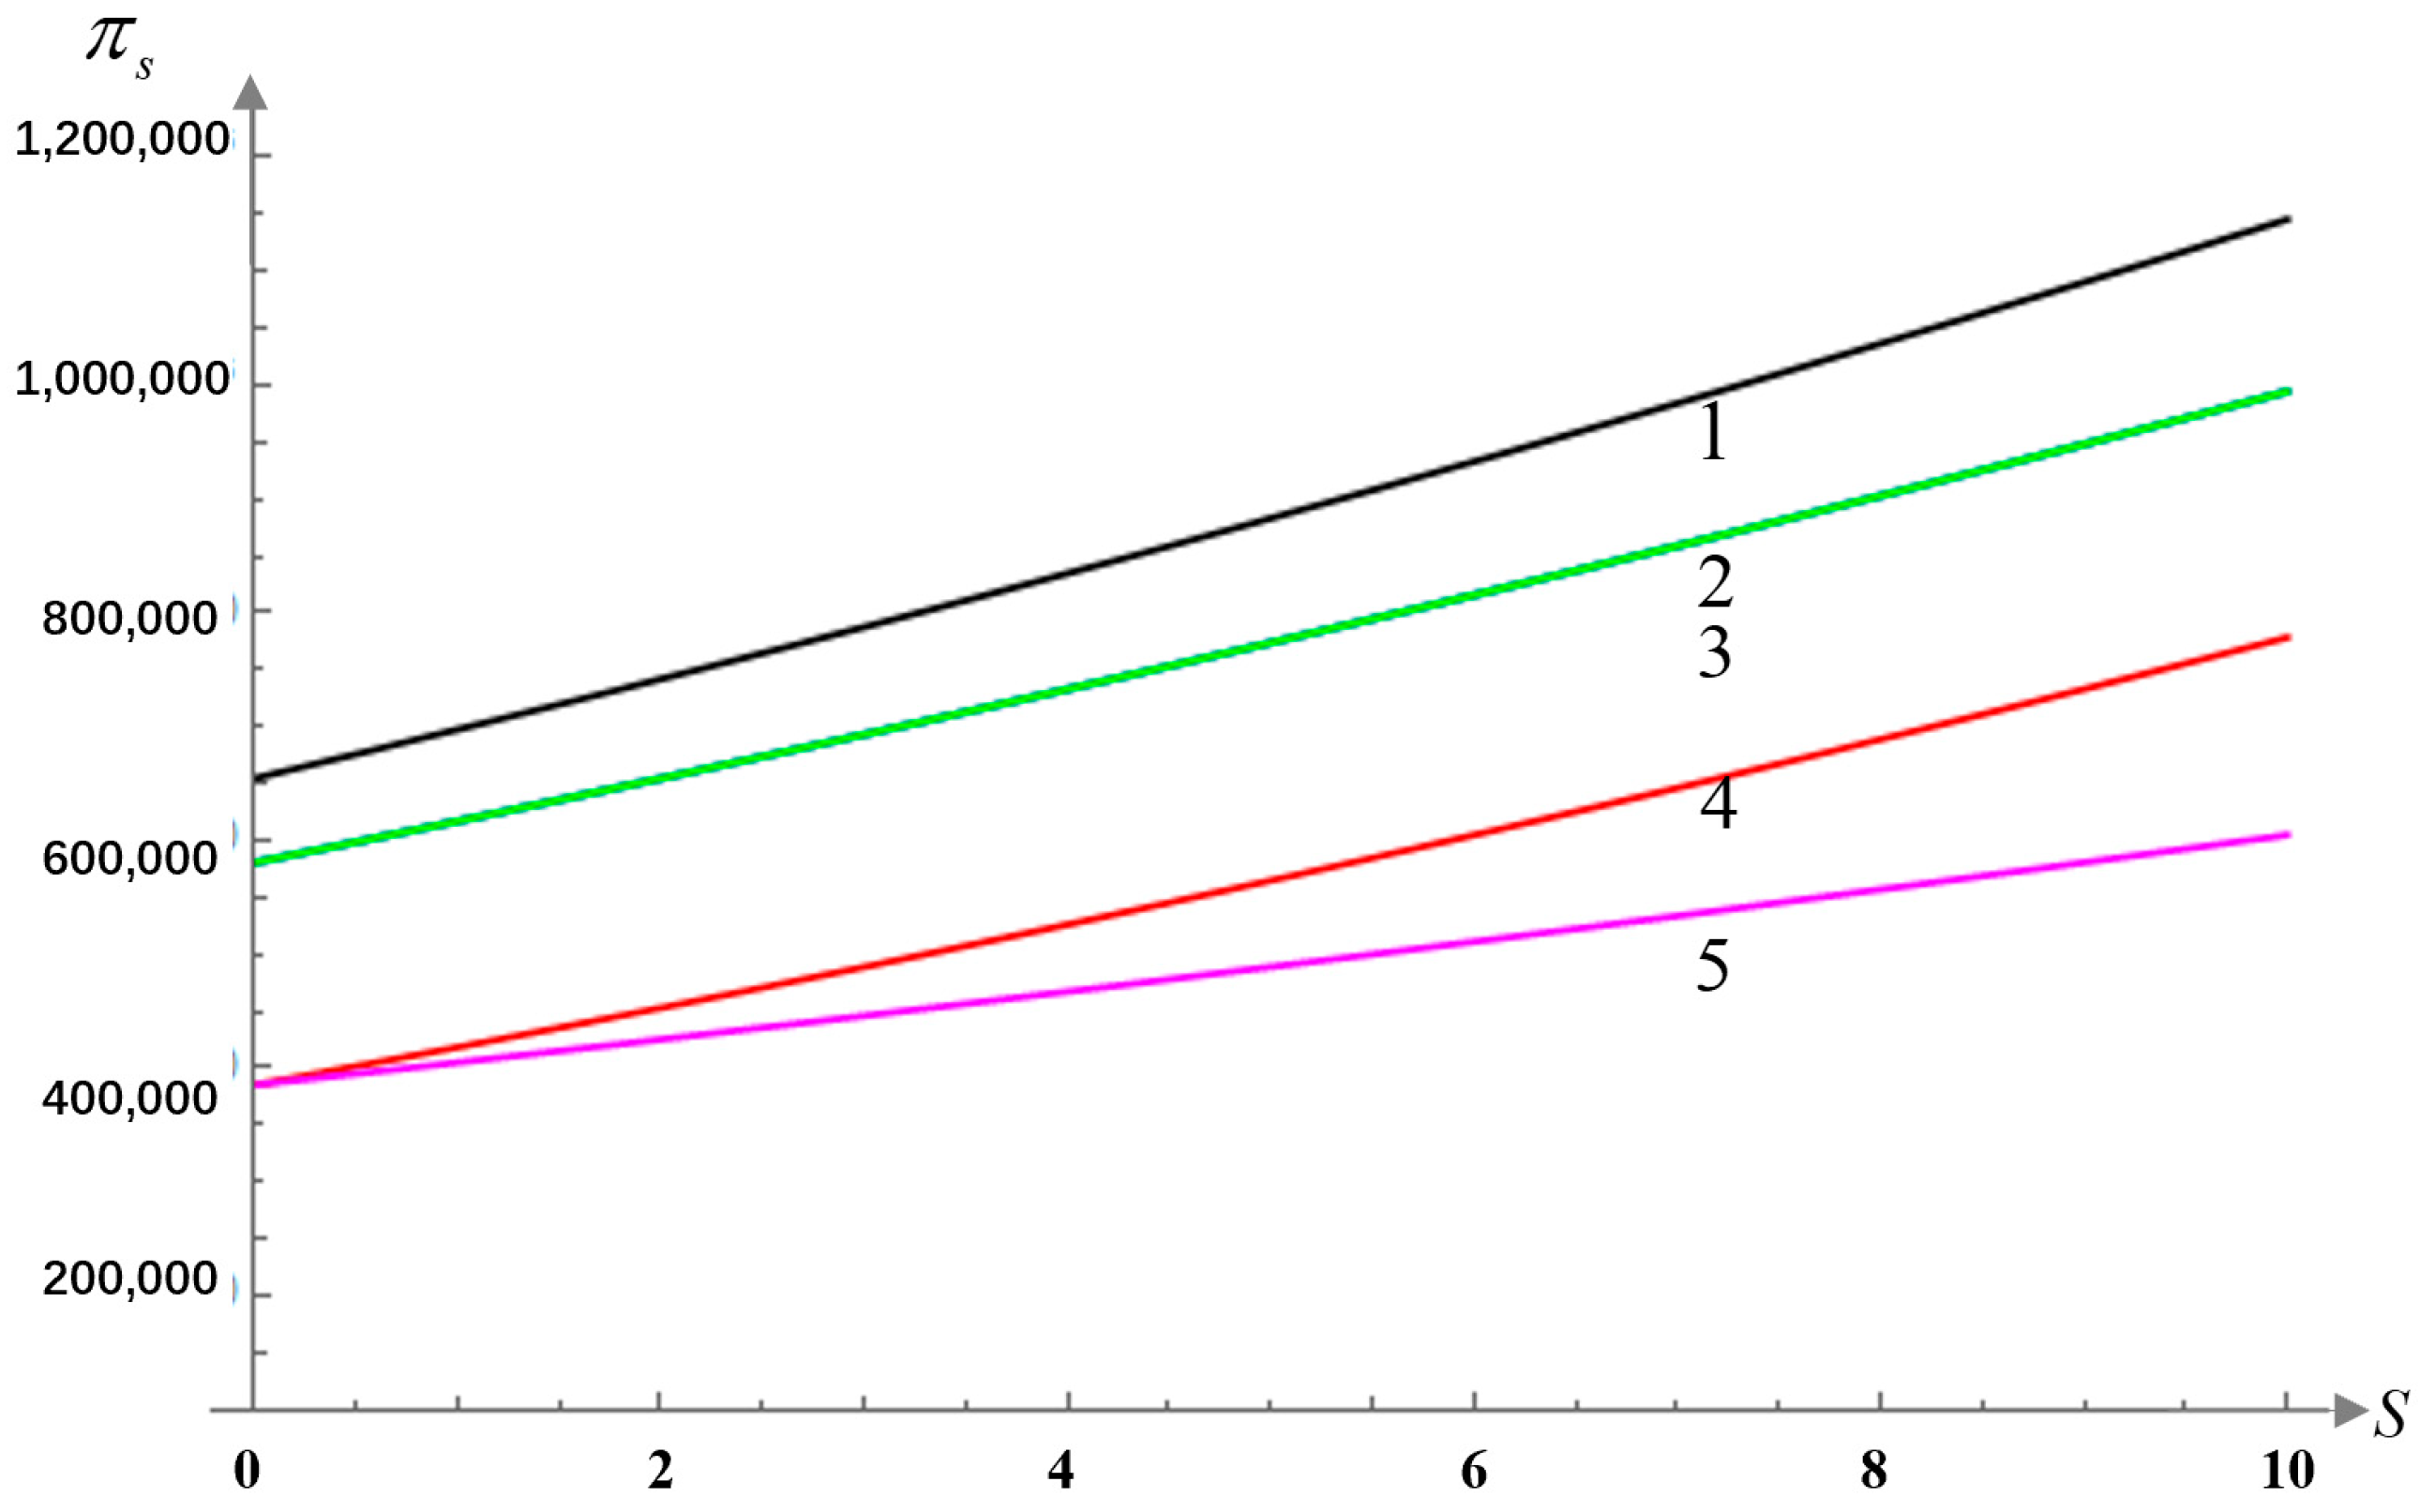
5.2.4. Penalty Analysis

In this section, assuming the reward–penalty intensity S = 4.5 , we analyzed the impact of the target sorting rate, ξ [ 0 , 1 ] , on the total social welfare in the above five scenarios, as shown in Figure 11 below.
Figure 11 shows that, with the increase in the target sorting rate, the total social welfare first increases and then decreases in the five scenarios. This shows that under the reward–penalty policy, an increase in the target sorting rate in the early stage is conducive to an increase in total social welfare, but it has a negative impact in the later stage. The target sorting rate should not exceed the value that makes the total social welfare reach the peak. It is easy to see that the total social welfare of scenario 1 is still the highest among those of the five scenarios.

5.3. Discussions and Suggestions

Two 3RW recycling modes were studied for the first time, and it was found that the mechanical sorting rate in mode II plays a decisive role in the relationship between the profits of two modes. When there is no reward–penalty policy, the profit of the WCG in mode I is greater than that in mode II; in mode II, the mechanical sorting rate affects its sorting rate and profit and plays a decisive role in the relationship between the sorting rate and the total profit of the two modes.
The model results show that the reward–penalty policy can promote the 3RW recycling, and it has been illustrated in many studies that the reward–penalty policy promotes the development of their industry [30,31,33]. When there is a reward–penalty policy, it is obvious that the increase in reward–penalty intensity has the best incentive impact on the sorting rate, collection quantity and profit in scenario 1 among the five scenarios. However, the subsidy efficiency decreases as the reward–penalty intensity increases, and the total social welfare first increases with the increase in reward–penalty intensity, and then decreases after it reaches the peak, so the reward–penalty intensity should be moderate. After all, scenario 1 still has the highest subsidy efficiency and total social welfare among the five scenarios.
Comparative analysis shows that the reward policies have different effects on the recycling prices of the two models. The numerical analysis of the five scenarios shows that enacting reward policies on the WCG and RC has the same impact on the sorting rate and the total profit in mode I; however, there is a higher collection quantity, subsidy efficiency and profit when enacting the reward policy on the WCG than on the ESEG in mode II. Notably, an increase in reward intensity on the WCG reduces the recovery price in modes I and II, and an increase in reward–penalty intensity on the RC in mode I or on the ESEG in mode II increases the recovery price. Therefore, if the government implements reward–penalty policies on the WCG, the recovery price of 3RW will decrease, which is conducive to limiting the development of the informal recycling sector.
This research has reached the same conclusion as Tang [34] that the target sorting rate can promote the increase in the total social welfare to a certain extent, but with the increase in its value, it is the same as the reward–penalty intensity in that the total social welfare decreases after reaching the peak value, so the choice of the target sorting rate should be moderate too. Scenario 1 has the highest total social welfare among the five scenarios when the target sorting rate changes.
What is more, it can be found that when the environmental awareness of residents is weak, adopting mode II and reward–penalty policies for the WCG are suggested. Furthermore, when the environmental awareness of residents is low, a higher reward–penalty intensity should be adopted, while when the environmental awareness of residents is high, the reward–penalty intensity can be reduced.
In summary, the reward–penalty policy can promote the 3RW recycling in a certain mode; however, it is necessary to consider the residents’ environmental awareness, the mechanical sorting rate and the impact of policies on informal recyclers when formulating the reward–penalty intensity and target sorting rate.

6. Conclusions

In view of the fact that developing countries have not yet achieved effective results in the implementation of waste recycling projects, this article is dedicated to finding a suitable mode for recycling 3RW and formulating incentive policies under the NWCRP in China. Based on the implementation of municipal solid waste management regulations in several cities in China, two recycling modes in NWCRP are studied and the profit models of two modes are established based on Stackelberg game theory. What is more, a reward–penalty policy is proposed, and the impacts of different scenarios are also compared. It can be concluded that (1) with increasing reward–penalty intensity, the sorting rate and the profit show upward trends in two modes, while the subsidy efficiency of government decreases; (2) when the reward–penalty policy is implemented for WCGs, the recyclers’ recycling price decreases in the two modes; (3) all scenarios that implement the reward–penalty policy in mode RC have certain advantages in the sorting rate and profit and (4) with increasing reward–penalty intensity and target sorting rate in the reward–penalty policy, the social welfare first increases and then decreases in all scenarios.
In view of the above analysis, some suggestions for building urban 3RW recycling systems are given: (1) if there has no reward–penalty policy, mode II should be chosen when the mechanical sorting rate of the ESEG is high enough; otherwise, mode I should be chosen; (2) enacting reward–penalty policies for the WCG is a more powerful choice, as it can make a decent collection quantity, profit as well as subsidy efficiency and reduce the recovery price, which is conducive to limiting the development of the informal recycling sector; (3) the appropriate values should be selected for the reward–penalty intensity and target sorting rate, as high values for these parameters are not the best for the total social welfare in 3RW recycling.
The research of this article can provide certain theoretical support for the government to choose the recycling mode and formulate incentive policies for the3RW recycling. Certainly, there are still some areas for improvement in this article. For example, the impact of informal organizations on 3RW trading has not been considered in this paper and will be studied in future research.

Author Contributions

Conceptualization, D.M. and S.Z.; methodology, S.Z.; software, S.Z.; validation, S.Z.; formal analysis, S.Z.; investigation, D.M.; resources, D.M.; data curation, S.Z.; writing—original draft, S.Z.; writing—review and editing, D.M.; supervision, D.M.; project administration, D.M. All authors have read and agreed to the published version of the manuscript.

Funding

This research was funded by the National Natural Science Foundation of China (No.71473013).

Institutional Review Board Statement

Not applicable.

Informed Consent Statement

Not applicable.

Data Availability Statement

Not applicable.

Acknowledgments

This work is supported by the National Natural Science Foundation of China (No. 71473013).

Conflicts of Interest

The authors declare no conflict of interest.

References

  1. Ye, Q.; Anwar, M.A.; Zhou, R.; Asmi, F.; Ahmad, I. China’s green future and household solid waste: Challenges and prospects. Waste Manag. 2020, 105, 328–338. [Google Scholar] [CrossRef]
  2. Xie, L.; Ma, J. Study the complexity and control of the recycling-supply chain of China’s color TVs market based on the government subsidy. Commun. Nonlinear. Sci. 2016, 38, 102–116. [Google Scholar] [CrossRef]
  3. Liu, L.; Wang, Z.; Xu, L.; Hong, X.; Govindan, K. Collection effort and reverse channel choices in a closed-loop supply chain. J. Clean. Prod. 2017, 144, 492–500. [Google Scholar] [CrossRef]
  4. Li, X.; Mu, D.; Du, J.; Cao, J.; Zhao, F. Game-based system dynamics simulation of deposit-refund scheme for electric vehicle battery recycling in China. Resour. Conserv. Recycl. 2020, 157, 104788. [Google Scholar] [CrossRef]
  5. Ezeah, C.; Fazakerley, J.A.; Roberts, C.L. Emerging trends in informal sector recycling in developing and transition countries. Waste Manag. 2013, 33, 2509–2519. [Google Scholar] [CrossRef]
  6. Nelles, M.; Grünes, J.; Morscheck, G. Waste Management in Germany—Development to a Sustainable Circular Economy? Procedia Environ. Sci. 2016, 35, 6–14. [Google Scholar] [CrossRef]
  7. Honma, S.; Hu, J. Cost efficiency of recycling and waste disposal in Japan. J. Clean Prod. 2021, 284, 125274. [Google Scholar] [CrossRef]
  8. Stoeva, K.; Alriksson, S. Influence of recycling projects on waste separation behaviour. Waste Manag. 2017, 68, 732–741. [Google Scholar] [CrossRef]
  9. Kim, B.; Kim, S.; Sahoob, S. Waste collection vehicle routing problem with time windows. Comput. Oper. Res. 2006, 33, 3624–3642. [Google Scholar] [CrossRef]
  10. Botello-Álvarez, J.E.; Rivas-García, P.; Fausto-Castro, L.; Estrada-Baltazar, A.; Gomez-Gonzalez, R. Informal collection, recycling and export of valuable waste as transcendent factor in the municipal solid waste management: A Latin-American reality. J. Clean Prod. 2018, 182, 485–495. [Google Scholar] [CrossRef]
  11. Sandhu, K.; Burton, P.; Dedekorkut-Howes, A. Between hype and veracity; privatization of municipal solid waste management and its impacts on the informal waste sector. Waste Manag. 2017, 59, 545–556. [Google Scholar] [CrossRef] [PubMed]
  12. Steuer, B.; Ramusch, R.; Part, F.; Salhofer, S. Analysis of the value chain and network structure of informal waste recycling in Beijing, China. Resour. Conserv. Recycl. 2017, 117, 137–150. [Google Scholar] [CrossRef]
  13. Aparcana, S. Approaches to formalization of the informal waste sector into municipal solid waste management systems in low- and middle-income countries: Review of barriers and success factors. Waste Manag. 2017, 61, 593–607. [Google Scholar] [CrossRef] [PubMed] [Green Version]
  14. Fei, F.; Qu, L.; Wen, Z.; Xue, Y.; Zhang, H. How to integrate the informal recycling system into municipal solid waste management in developing countries: Based on a China’s case in Suzhou urban area. Resour. Conserv. Recycl. 2016, 110, 74–86. [Google Scholar] [CrossRef]
  15. Xiao, S.; Dong, H.; Geng, Y.; Brander, M. An overview of China’s recyclable waste recycling and recommendations for integrated solutions. Resour. Conserv. Recycl. 2018, 134, 112–120. [Google Scholar] [CrossRef] [Green Version]
  16. Liu, S.; Li, Q.; Qiao, F. Characterizing the Relationship between Carbon Dioxide Emissions and Vehicle Operating Modes on Roundabouts—A Pilot Test in a Single Lane Entry Roundabout. Environ. Pollut. Climate Change 2017, 1, 1–120. [Google Scholar] [CrossRef] [Green Version]
  17. Li, Q.; Du, J.; Qiao, F. Characterizing Particulate Matter 2.5 Concentration Pattern within a Transportation Network: A Case Study in the Port of Houston Region. J. Pollut 2018, 1, 106. [Google Scholar]
  18. Zhang, S.Q.; Mu, D.; Wang, C. A Solution for the Full-Load Collection Vehicle Routing Problem with Multiple Trips and Demands: An Application in Beijing. IEEE Access 2020, 8, 89381–89394. [Google Scholar] [CrossRef]
  19. Vergara, S.E.; Damgaard, A.; Gomez, D. The Efficiency of Informality: Quantifying Greenhouse Gas Reductions from Informal Recycling in Bogotá, Colombia. J. Ind. Ecol. 2016, 20, 107–119. [Google Scholar] [CrossRef] [Green Version]
  20. Alhazmi, H.; Almansour, F.H.; Aldhafeeri, Z. Plastic Waste Management: A Review of Existing Life Cycle Assessment Studies. Sustainability 2021, 13, 5340. [Google Scholar] [CrossRef]
  21. Zhang, H.; Wen, Z. The consumption and recycling collection system of PET bottles: A case study of Beijing, China. Waste Manag. 2014, 34, 987–998. [Google Scholar] [CrossRef]
  22. Cheung, W.M.; Pachisia, V. Facilitating waste paper recycling and repurposing via cost modelling of machine failure, labour availability and waste quantity. Resour. Conserv. Recycl. 2015, 101, 34–41. [Google Scholar] [CrossRef] [Green Version]
  23. Ibáñez-Forés, V.; Coutinho-Nóbrega, C.; Bovea, D.M.; de Mello-Silva, C.; Lessa-Feitosa-Virgolino, J. Influence of implementing selective collection on municipal waste management systems in developing countries: A Brazilian case study. Resour. Conserv. Recycl. 2018, 134, 100–111. [Google Scholar] [CrossRef]
  24. Tang, J.; Wei, L.; Su, M.; Zhang, H.; Chang, X.; Liu, Y.; Wang, N.; Xiao, E.; Ekberg, C.; Steenari, B.; et al. Source analysis of municipal solid waste in a mega-city (Guangzhou): Challenges or opportunities? Waste Manag. Res. 2018, 36, 1166–1176. [Google Scholar] [CrossRef] [PubMed]
  25. Meng, X.; Tan, X.; Wang, Y.; Wen, Z.; Tao, Y.; Qian, Y. Investigation on decision-making mechanism of residents’ household solid waste classification and recycling behaviors. Resour. Conserv. Recycl. 2019, 140, 224–234. [Google Scholar] [CrossRef]
  26. Xu, L.; Ling, M.; Wu, Y. Economic incentive and social influence to overcome household waste separation dilemma: A field intervention study. Waste Manag. 2018, 77, 522–531. [Google Scholar] [CrossRef] [PubMed]
  27. Lu, H.; Sidortsov, R. Sorting out a problem: A co-production approach to household waste management in Shanghai, China. Waste Manag. 2019, 95, 271–277. [Google Scholar] [CrossRef]
  28. Jafari, H.; Hejazi, S.R.; Rasti-Barzoki, M. Sustainable development by waste recycling under a three-echelon supply chain: A game-theoretic approach. J. Clean Prod. 2017, 142, 2252–2261. [Google Scholar] [CrossRef]
  29. Xue, Y.; Wen, Z.; Bressers, H.; Ai, N. Can intelligent collection integrate informal sector for urban resource recycling in China? J. Clean Prod. 2019, 208, 307–315. [Google Scholar] [CrossRef]
  30. Wang, B.; Camacho, J.A.; Pulliam, G.M.; Etemadi, A.H.; Dehghanian, P. New reward and penalty scheme for electric distribution utilities employing load-based reliability indices. IET Gener. Transm. Dis. 2018, 12, 3647–3654. [Google Scholar] [CrossRef] [Green Version]
  31. Alvehag, K.; Awodele, K. Impact of Reward and Penalty Scheme on the Incentives for Distribution System Reliability. IEEE Trans. Power Syst. 2014, 29, 386–394. [Google Scholar] [CrossRef]
  32. Amini, F.; Ahmad, J.; Ambali, A.R. The Influence of Reward and Penalty on Households’ Recycling Intention. APCBEE Procedia 2014, 10, 187–192. [Google Scholar] [CrossRef]
  33. Wang, W.; Ding, J.; Sun, H. Reward-penalty mechanism for a two-period closed-loop supply chain. J. Clean Prod. 2018, 203, 898–917. [Google Scholar] [CrossRef]
  34. Tang, Y.; Zhang, Q.; Li, Y.; Wang, G.; Li, Y. Recycling mechanisms and policy suggestions for spent electric vehicles’ power battery—A case of Beijing. J. Clean Prod. 2018, 186, 388–406. [Google Scholar] [CrossRef]
Figure 1. Process of 3RW recycling under waste classification project.
Sustainability 13 07883 g001
Figure 2. Process of 3RW recycling in mode I.
Sustainability 13 07883 g002
Figure 3. Process of 3RW recycling in mode II.
Sustainability 13 07883 g003
Figure 4. The impact of β on τ .
Sustainability 13 07883 g004
Figure 5. The impact of β on V .
Sustainability 13 07883 g005
Figure 6. The impact of S on collection quantity.
Sustainability 13 07883 g006
Figure 7. The impact of S on η.
Sustainability 13 07883 g007
Figure 8. The impact of S on πs.
Sustainability 13 07883 g008
Figure 9. The impact of S on V.
Sustainability 13 07883 g009
Figure 10. The impact of S on W.
Sustainability 13 07883 g010
Figure 11. The impact of ξ on W.
Sustainability 13 07883 g011
Table 1. Descriptions of the symbols.
SymbolsDefinition
A Population of a district in a city
q Quantity of 3RW contained in household waste produced by residents each year
φ Scaling parameter, represents the average environmental awareness of residents
τ 0 Sorting rate without publicity and supervision
V τ Increased sorting rate under publicity and supervision
I Investment cost of publicity and supervision
p s j Average recycling price per 3RW set by the recycler of mode j
a Price discount of 3RW to transfer station
b Proportion of 3RW sorting from garbage by mechanical equipment
P Purchase price of 3RW
S Reward–penalty intensity established by the government
ξ Target sorting rate set by the government
γ Government’s fixed cost coefficient in reward–penalty mechanism
Table 2. Summary of optimal solutions in mode I and II.
Mode I Mode II
τ τ I * = q P + S s + S e 4 φ + τ 0 2 τ II = [ q 2 φ p ( 1 α β ) + S s + S h ( 1 β ) 2 + τ 0 2 ] ( 1 β ) + β
Ps p s I = P S s + S e 2 τ 0 φ q p s II = p ( 1 α β ) S s + ( 1 β ) S h 2 τ 0 φ q
π s π s I = A q 2 4 φ ( P + S s + S e 2 + τ 0 φ q ) 2 A φ τ 0 2 S s q A ξ s π s II = A q 2 4 φ ( p ( 1 α β ) + S s + ( 1 β ) S h 2 + τ 0 φ q ) 2 A φ τ 0 2 S h q A ξ h
π e π e I = A q 2 2 φ ( P + S s + S e 2 + τ 0 k φ q ) 2 S e q A ξ e
π h π h II = A q 2 2 φ ( p ( 1 α β ) + S s + ( 1 β ) S h 2 + τ 0 φ q ) 2 + ( p α + S h ) q β A S h q A ξ h
V V I = 3 A q 2 4 φ ( P + S s + S e 2 + τ 0 φ q ) 2 A φ τ 0 2 ( S s + S e ) q A ξ s V II = 3 A q 2 4 φ ( p ( 1 α β ) + S s + ( 1 β ) S h 2 + τ 0 φ q ) 2 A φ τ 0 2 ( S s + S h ) q A ξ h + q A β ( α β + S h )
Table 3. Summary of parameter values.
ParameterValue
A 335.8 p
q 360 t/p/y
φ 4000
τ 0 0.05
P 30 RMB/t
α 0.6
E 150 RMB/t
γ 0.0000006
Table 4. Summary of scenarios.
ScenarioRecyclerImplementation Objects
of Policies
Mechanical Sorting Rate
1RCWCG/RC--
2ESEGWCG β = 0.1
3ESEGRC β = 0.1
4ESEGWCG β = 0.4
5ESEGRC β = 0.4
Publisher’s Note: MDPI stays neutral with regard to jurisdictional claims in published maps and institutional affiliations.

