Abstract
Humans are significantly perturbing the global nitrogen cycle, leading to excess reactive nitrogen in the environment. Nitrogen oxides as a key reactive nitrogen species are mainly controlled by selective non-catalytic reduction and selective catalytic reduction. Converting nitrogen oxides to ammonia, defined as ReNOx, emerges as an alternative method under a disparate design concept. However, little is known about its overall environmental performance. In this study, we conducted for the first time a life cycle assessment of ReNOx. Compared with the eco-index in the condition of 200 °C with a conversion rate of 95%, it would increase substantially in the condition of 160 °C with a conversion rate of 80% and in the case without a sound NH3 treatment. Feedstock format change, adsorption material performance deterioration, and recovery rate decline would increase the eco-index by 8%, 12%, and 18%, respectively. The eco-index was decreased by 31% in the optimized scenario with a renewable energy source and an increased conversion rate. The environmental impacts were compared with traditional methods at impact, damage, and eco-index levels. Finally, the implications on process arrangement in the flue gas system, the externality for power generation, and the contribution to the nitrogen circular economy were examined. The results can serve as a reference for its developers to improve the technology from the environmental perspective.
1. Introduction
Nitrogen (N2) makes up 78% of the air and is harmless and extremely chemically unreactive. All other nitrogen forms are referred to as reactive nitrogen (Nr), such as nitrogen oxides (NOx), ammonia (NH3), nitrous oxide (N2O), nitrite (NO2−), and nitrate (NO3−). Humans are massively perturbing the global nitrogen cycle, leading to excess Nr in the environment [1,2,3,4]. As a key Nr species, NOx mainly derived from combustion processes results in acidification, eutrophication, photochemical smog, and so forth [5,6].
A commonly employed post-combustion method for NOx treatment is selective non-catalytic reduction (SNCR) [7,8]. It involves the injection of ammonia or urea directly into the combustion gas and has the advantages of simplicity and low cost [9]. To pursue a higher reduction efficiency, selective catalytic reduction (SCR), commercially achieved for the first time in Japan [10], has been widely applied in developed countries and is experiencing a rapid growth in developing economies [11]. The mechanism is that NO is generally reduced by NH3 to harmless N2 [12]. Currently, NH3 is mainly produced using N2 and hydrogen (H2) as feedstocks through the Haber–Bosch process [13], which is energy-intensive. Hence, this mode represents a massive loss of resources from the viewpoint of the circular nitrogen economy [1].
Recent research has been conducted on the conversion of NO to NH3 for recovery, which was defined as ReNOx [14,15,16]. NH3 is not only one of the most important traditional sources of fertilizers for agriculture, but is also emerging as a promising energy carrier which might play an important part in future energy scenarios [17,18]. For ReNOx, NH3 was not used as a reducing agent, but as a product. This reveals the potential to remodel the nitrogen economy. In this context, ReNOx might provide a viable alternative to traditional NOx treatment technology.
Nevertheless, it should be noted that ReNOx itself consumes energy and materials and generates emissions and waste, all of which have direct or indirect environmental impacts. Those environmental impacts cannot be neglected when evaluating alternative treatment technologies [19]. To achieve true environmental improvement, it is necessary to carry out a life cycle assessment considering broad environmental deteriorations at other locations or other times throughout the life cycle.
Life cycle assessment has been successfully applied to various flue gas treatment systems. The treatment for steel industry sintering flue gas emissions was evaluated, which indicated that the main environmental impacts were derived from the wet denitration and ozone oxidation processes [20]. A life cycle assessment of sulfur dioxide removal from flue gas using carbonate melt was conducted which implies a better performance compared with traditional process [21]. The reduction of NOx in waste incinerators by SNCR and SCR were compared from a life cycle perspective. The conclusion was that incinerators installed with SCR that meet lower emission limit values will significantly increase the impact of global warming [22]. The energy consumption and environmental impact of SCR technology in China was investigated, providing the basis for potential improvements in its environmental performance [23]. SNCR in a full-scale municipal solid waste incinerator was evaluated, suggesting that the fate of ammonia is crucial [24]. Typical flue gas cleaning processes were compared by means of a life cycle assessment, and it was found that process operation dominates energy and resource consumption [25]. Plasma-based and traditional exhaust gas treatment technologies were evaluated, highlighting the remarkable process waste from traditional technologies [26]. The flue gas treatment technologies for municipal waste incineration was assessed by analyzing the overall environmental impacts across whole life cycle, providing insights into a new standard for pollution control [27]. However, to the best of our knowledge, studies focusing on the life cycle environmental performance of ReNOx are limited, although it is effective in holistically addressing trade-off issues. The life cycle assessment result can serve as an important evaluation criterion for both technology developers and environmental policy makers.
To fill this gap, we carried out a life cycle assessment of ReNOx in the present study. The main objectives of this study are to uncover the key variables and explore trade-offs between impact categories of ReNOx for further potential technology improvement. The remainder of this paper is organized as follows. Section 2 describes the research framework, assessment methodology, and scenario modeling. Section 3 presents the results, interpretations, and implications. Section 4 presents the conclusions.
2. Methodology
2.1. Research Framework
Figure 1 shows the research framework of this study. The combustion of fossil fuels and waste unintentionally generates huge amounts of NOx. Traditionally, NOx is treated by denitrition (DeNOx), which is achieved with or without catalysts using NH3 as the reduction agent, forming N2 and water. ReNOx was developed as a potential alternative with two stages of conversion and recovery, treating NOx as a resource rather than waste. First, to support new technology development, a life cycle assessment of ReNOx was conducted. Second, scenarios were modeled to examine the sensitivity of the environmental performance of ReNOx. Third, the life cycle assessment results were compared with traditional methods. The system boundary, life cycle impact assessment method, and detailed scenario modeling are introduced in the next sections.
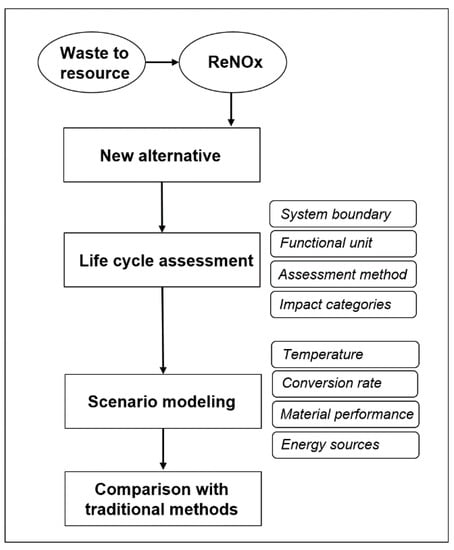
Figure 1.
Research framework of this study.
2.2. Life Cycle Assessment
According to the ISO 14040 and 14044, the life cycle assessment methodology consists of four distinct phases: goal and scope definition, life cycle inventory, life cycle impact assessment, and results interpretation [28,29].
The goal of this study is to evaluate the environmental performance of the nitrogen circular economy-based method of ReNOx from a life cycle perspective. The results are of use to improve the technology design and to manage flue gases toward sustainability. The scope covers the production, use, and disposal stages to avoid an environmental impact shift over time and/or space. The boundary of the ReNOx technology system is shown in Figure 2. The main considered processes include material production, transportation, the operation of ReNOx, onsite emissions, waste collection, and disposal. Unlike the functional unit (FU) of a product system defined in terms of its output, the FU of a waste treatment system is usually defined in terms of its input [19]. In this study, the FU was thus defined as treating flue gas containing 500 kg of NOx with a concentration of 1000 ppm. It provides the reference point associating the inputs and outputs of unit processes. The connected unit processes constitute the technology system.
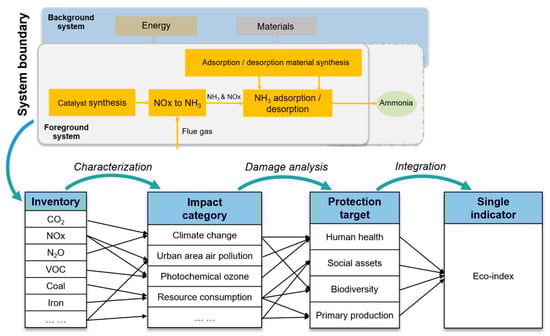
Figure 2.
ReNOx system and the assessment framework.
For the conversion stage of ReNOx, the main consumed materials include the reducing agent and catalysts. Electricity and natural gas were used as energy sources. The mean of the Japan electricity mix from 2004 to 2017, representing an average level, was used as the electricity source. The conversion rate was 95% at a temperature of 200 °C. The amount of natural gas and electricity were 2.8 × 10⁻³ and 9.9 × 10⁻⁴ MJ/m3, respectively. The mass of methane was 5.9 × 10⁻⁴ kg/m3, and the catalyst was 2.7 × 10⁻⁵ kg/m3. Regarding the recovery stage of ReNOx, electricity was used for the operation. The electricity emission intensity was the same as that for the conversion stage. The primarily consumed materials were the adsorption/desorption material and the final treatment reagent. The recovery rate was 80%. The onsite emissions of NOx, NH3, and CO2 were quantified according to the stoichiometric equation of the chemical reaction. The electricity consumed for adsorption and desorption was 7.7 × 10⁻⁴ and 1.7 × 10⁻³ MJ/m3, respectively. The adsorption material was 1.8 × 10⁻⁶ kg/m3. The electricity intensity for adsorption material production was 2.6 × 10⁻⁵ MJ/m3. The NH3 was treated by nitric acid. The nitric acid was 5.5 × 10⁻⁴ kg/m3. The unit emissions of the electricity and natural gas production, basic material production and transportation, and waste disposals were obtained from the Inventory Database for Environmental Analysis, shortened as IDEA [30]. It is a comprehensive inventory database of nearly all economic activities of the Japanese industry. More than 3000 processes in both the gate to gate and the cradle to gate types are available. Each process was assigned a unique IDEA code. The processes are classified according to the Japan Standard Commodity Classification. In this study the general assumptions made for the calculation are listed below.
- (1)
- For the conversion catalysts, the service life was 2 years.
- (2)
- A typical transportation distance of 100 km was assumed for materials.
- (3)
- Generated waste waters were disposed by industrial wastewater treatment services.
- (4)
- NOx usually consists of 95% NO and 5% NO2. However, NOx was set as 100% NO in this study for simplicity.
- (5)
- The recycling of consumed materials was not considered.
The life cycle impact assessment was conducted in Excel using the life cycle impact assessment method based on endpoint modeling (LIME2) and the IDEA database. LIME2 is a life cycle impact assessment method which reflects environmental and social conditions in Japan. The impacts of midpoint impact results, damage assessment results, and a final single indicator result are calculated. It can be used for the environmental assessment of products and technologies [31]. Its framework is shown in Figure 2. The impact categories include climate change (kg CO2 eq.), ozone layer destruction (kg CFC-11 eq.), acidification (kg SO2 eq.), urban area air pollution (kg SO2 eq.), photochemical ozone (kg C2H4 eq.), toxic chemicals (cancer) (kg C6H6 eq.), toxic chemicals (chronic) (kg C6H6 eq.), aquatic toxicity (kg C6H6 eq.), biological toxicity (kg C6H6 eq.), eutrophication (kg PO43− eq.), land use occupation (m2a), land use transformation (m2), and resource consumption (kg Sb eq.). The damage assessments cover the damage to human health (disability-adjusted life year; DALY), social assets (JPY), biodiversity (expected increase in the number of extinct species; EINES), and primary production (net primary production; NPP). Finally, four damage categories were integrated into the eco-index (JPY) to support an improved decision making.
2.3. Scenario Modeling of ReNOx Technology
Uncertainty exists for the variables in the assessment. These variables could be modified by process optimization. Therefore, a scenario analysis was carried out to investigate the effect of key ReNOx technology variables. A total of seven scenarios were modeled. The descriptions of these scenarios are shown in Table 1. The key variables, such as the reaction temperature, feedstock format, ammonia treatment method, adsorption material performance, recovery rate, and energy sources, were varied to create scenarios. The analysis of the relative environmental performance of the alternative scenarios provided insights into the prioritization of future research.

Table 1.
Scenario modeling to investigate the effects of key variables of ReNOx.
Although there are many studies about SNCR and SCR with a large reduction rate range, the corresponding energy intensity, material consumption, and catalyst production information is limited. In this context, the environmental impacts of ReNOx in the study were compared with traditional methods reported with inventory data [23]. The main materials consumed by SCR include steel, catalysts, activating elements, and reducing agents of NH3. The consumed material of SNCR was mainly NH3. The FU was converted to the treatment of an identical mass of NOx in the flue gas for comparison. The uncertainty was examined in the comparison. Although it is challenging to compare ReNOx with other methods, this attempt provided insights into its preliminary environmental profiles for technology developers.
3. Results and Discussion
3.1. Environmental Performance of ReNOx under Different Conditions
Figure 3 shows the environmental impacts of ReNOx technology. The color scale distinguishes the environmental impacts in different scenarios. Green with a smaller value represents improved performance, whereas red with a higher value represents a worse performance, as shown in Figure 3, (1). The increase or decrease rates of environmental impacts in S2–S7 comparing with that in S1 are shown in Figure 3, (2). In general, some impacts were increased; however, other impacts were simultaneously decreased relative to S1. Under S2, a lower conversion rate led to more NOx emissions, which is an important pollutant causing acidification and urban area air pollution. Consequently, acidification and urban area air pollution were significantly increased. However, several other impact categories especially for climate change and ozone layer destruction were simultaneously decreased. This can be attributed to the fact that the amount of energy consumption and final waste treatment were decreased. With respect to S3, the feedstock format in the conversion stage was changed from methane to carbon monoxide and hydrogen. The impact of land use was increased, while the photochemical zone was evidently decreased. When NH3 was released into the environment directly under S4, eutrophication and acidification were remarkably increased. As no final treatment is needed, almost all other impacts were decreased apart from the two impacts mentioned above. If the adsorption material capacity and reuse times were halved under S5, all impact categories were increased. The technical performance reduction caused increased demands for adsorption materials. These additional material consumptions can result in additional impacts. As for S6, under which the recovery rate was halved, climate change, ozone layer destruction, photochemical ozone, toxic chemicals (chronic), and land use were the largest among all scenarios. In the optimized scenario of S7, with a higher conversion rate and a renewable energy source, almost all impacts were decreased. The impacts of acidification, urban area air pollution, and aquatic and biological toxicity were minimal compared with those in other scenarios.
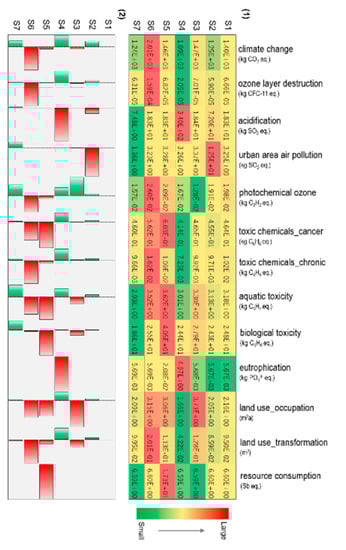
Figure 3.
Environmental impacts of ReNOx technology: (1) color scales with values; (2) rate of change compared with S1.
Global warming is the most analyzed impact category in the life cycle assessment of chemical processes [32]. However, the results revealed that various trade-offs existed for the environmental impacts of ReNOx under different conditions, which highlighted the significance of holistic evaluation. It was frequently observed that when one impact was mitigated, others were aggregated. Hence, focusing on the minimization of one impact might merely produce local optimization, which is not the goal of environmental management. The impact assessment explicitly demonstrated trade-offs based on scenario analysis, providing a better understanding of the environmental characteristics of ReNOx technology.
To uncover the critical processes for the total environmental impacts, a contribution analysis was conducted. Figure 4 presents the contribution of each process to each impact category of ReNOx in the optimized scenario. The impact category of climate change for ReNOx was mainly attributed to carbon dioxide emissions in the conversion process (48%) and the waste treatment process (25%). The most critical process for ozone layer destruction was waste treatment, which contributed 75% to the total. Evidently, acidification and urban area air pollution were both dominated by the NOx emissions in the system that entered the environment. The contribution rates reached more than 90%. This indicates that the reduction rate would be critical for the mitigation of acidification and urban area air pollution. Photochemical ozone mainly stemmed from the methane production process (40%). As for toxic chemicals and toxicity, catalyst production was identified as a critical process. Eutrophication mainly resulted from the adsorption material production process (88%), which was also a critical process for resource consumption. The second-most critical process for resource consumption was catalyst production, contributing 46% to the total. The results suggested that the optimization of catalyst production and usage can substantially reduce the impacts of toxic chemicals and aquatic and biological toxicity. The optimization of adsorption material production and usage can be a potential measure to reduce eutrophication and resource consumption effectively.
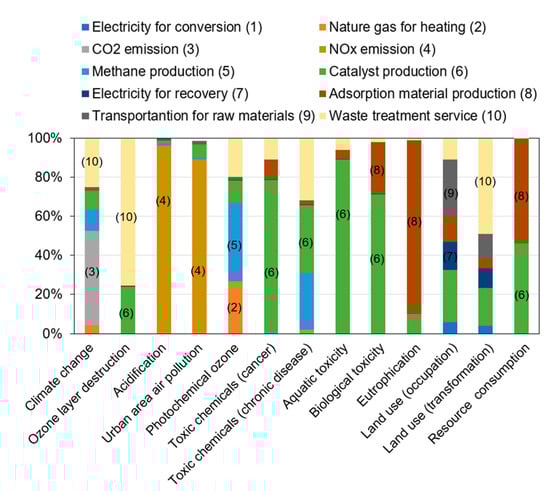
Figure 4.
The contribution of processes to the total environmental impacts of ReNOx technology.
The impact assessment exhibited trade-offs among a dozen environmental burdens. At times it is too complicated to support decision-making in a straightforward manner. To evaluate the consequences of those environmental burdens, the amount of damages for each common endpoint were quantified. Figure 5 presents the results of damages to human health, social assets, biodiversity, and primary production. When the conversion rate was decreased at a lower reaction temperature (S2), human health damage greatly increased. One important reason for this is the deterioration of urban area pollution, which was revealed in the impact assessment. The damage to biodiversity slightly decreased. In the case of changing the feedstock to carbon monoxide and hydrogen (S3), the damages to human health, social assets, biodiversity, and primary production increased, but the increments were minor. When ammonia was released into the environment (S4), damages to social assets and primary production both increased remarkably. The environmental impacts of eutrophication and acidification brought about major damages to social assets and primary production. As for halving the capacity and reuse times of adsorption materials (S5), biodiversity damage evidently increased. If the recovery rate was decreased (S6), damages to biodiversity and primary production increased the most. In the optimized scenario (S7), all damages were decreased. The damage to human health was decreased the most, with a value of 40%. Figure 6 presents the contribution of various processes to the damages of the ReNOx in the optimized scenario. It was seen that NOx emissions contributed 39% to human health damage. As for the damage to social assets, NOx emission, methane production, catalyst production, and waste treatment service contributed 36%, 19%, 16%, and 16%, respectively. Biodiversity damage was mainly derived from catalyst production (57%), followed by adsorption material production (23%), among others. In addition, catalyst production and waste treatment are critical processes for primary production damages.
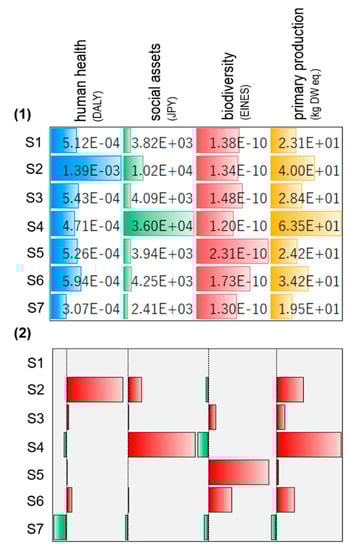
Figure 5.
Damages of ReNOx technology: (1) data bar; (2) rate of change compared with S1.
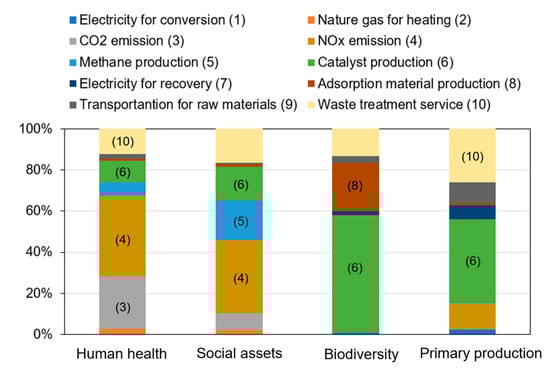
Figure 6.
The contribution of processes to human health, social assets, biodiversity, and primary production damages of ReNOx technology.
Figure 7 presents the eco-index of ReNOx technology. Four damages were integrated into the eco-index in line with their importance among the endpoints. The eco-index indicates the total environmental performance of the technology. Compared with the eco-index in the condition of 200 °C with a conversion rate of 95% (S1), it would increase by 1.3 times in the condition of 160 °C with a conversion rate of 80% (S2). If the NH3 was not treated soundly (S4), the eco-index would increase by 2.6 times. The fate of ammonia was reported as a crucial factor for SNCR [24]. This is also applicable to the results in this study. Feedstock format change (S3), adsorption material performance deterioration (S5), and recovery rate decline (S6) would increase the eco-index by 8%, 12%, and 18%, respectively. In the case of increased conversion rate and with renewable energy source (S7), the eco-index was decreased by 31%. The eco-index of the optimized scenario was broken down by processes, as shown in Figure 8. It indicated that the critical processes for the eco-index were catalyst production (28%), NOx emission (26%), waste treatment service (14%), CO2 emission (14%), methane production (7%), and adsorption material production (5%). The identification of key processes through contribution analysis serves as the starting point for the development of improvement measures. Monetary valuation plays an important role in solving trade-offs in life cycle assessment [33]. The eco-index achieved by monetary valuation enables technology developers to make comparisons with other technologies comprehensively and facilitates decision making in a more straightforward manner.
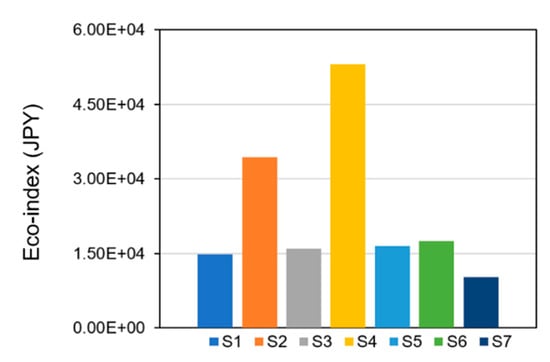
Figure 7.
The eco-index of ReNOx technology.
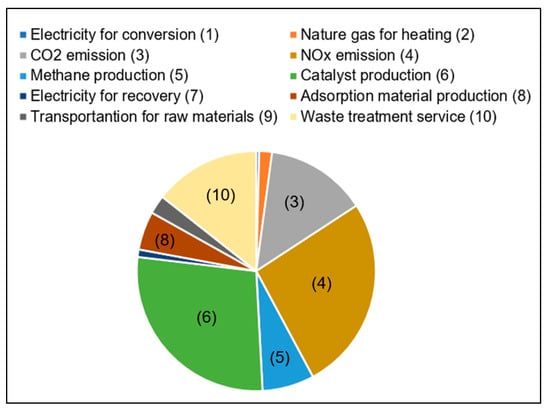
Figure 8.
The contribution of processes to the eco-index of ReNOx technology.
3.2. Comparison with Traditional Methods
The life cycle assessment result of ReNOx was further compared with that of the traditional methods reported in the literature with inventory data [23]. Figure 9 shows the comparison results of ReNOx (S1) with SNCR and SCR, which were marked by color scales. At the environmental impact level, SNCR had a maximum value in terms of acidification, urban area air pollution, and eutrophication. This can be attributed to the lowest NOx reduction rate. However, despite this, it is relatively simple and consumes less energy and materials. As a result, nine impacts, among which climate change, were at the minimum. Differing from SNCR, SCR can achieve a higher NOx reduction rate. Nevertheless, large amounts of catalysts are needed, accompanied by higher energy consumption. The impacts of climate change, toxic chemicals, toxicity, and land use are at the maximum; however, other impact categories are in the middle. For ReNOx, maximum values were observed in ozone layer destruction, photochemical ozone, and resource consumption. In contrast, it had minimum values in impacts such as acidification, urban area air pollution, and eutrophication. At the damage level, SNCR had the largest value for damages to human health, social assets, and primary production. SCR had the largest value regarding damage to biodiversity, and was in the middle for three other damages. ReNOx had the smallest value with respect to human health, social assets, and primary production. At the eco-index level, ReNOx ranked first, followed by SCR and SNCR. Although life cycle assessment has been recognized as a useful tool to evaluate the environmental impacts of emerging technologies, there are still many challenges for making comparisons. The choice of system boundary may have an influence on the results. Moreover, lab scale processes cannot reflect the complexity of industrial scale ones [34]. Those issues should be kept in mind when analyzing comparison results.
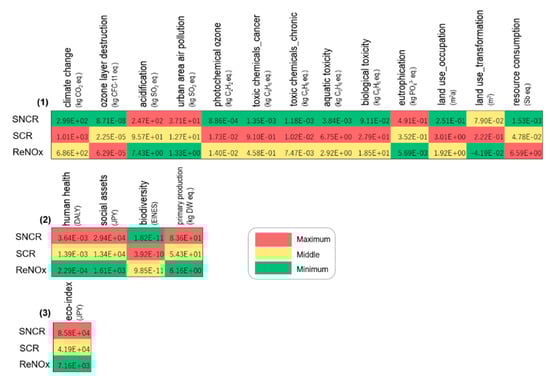
Figure 9.
Comparison results at (1) impact, (2) damage, and (3) eco-index levels.
Quite large reduction rate ranges were reported for both SNCR [35] and SCR [36], which brought about a high uncertainty in their environmental impacts. In this context, a general reduction rate of 80% ranging from 60–90% [23] for SCR and a reduction rate of 40% ranging from 30–60% [26] for SNCR were calculated for the uncertainty analysis, as shown in Figure 10. It is worth noting that the high reduction rate was often accompanied by a high ammonia slip. The catalyst type and energy consumption were very different in different situations. There was even a higher reduction rate reported, but it was not calculated here due to lacking corresponding energy, catalyst, and ammonia slip information. It was found that when the reduction rate of SCR reached 90%, its eco-index was smaller than ReNOx in the case of a lower conversion rate (S2) and in the case without ammonia treatment (S4). But it was still larger than ReNOx in S1, S3, S5, S6, and S7. When the reduction rate of SNCR reached 60%, its eco-index was smaller than that of SCR with a reduction rate of 60%. There are evident overlaps for the eco-index of three techniques, which suggests that the reduction rate has a significant effect on their environmental performance.
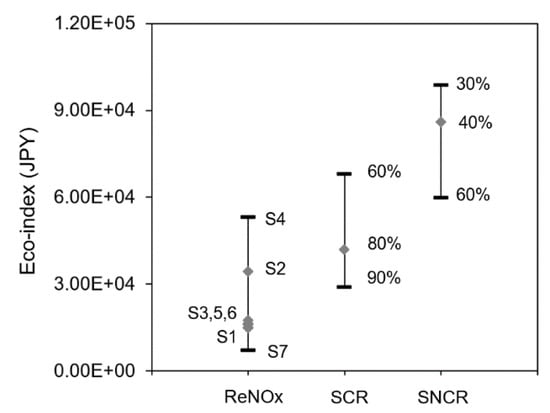
Figure 10.
Uncertainty of the comparison with different reduction rates for traditional methods. The percentage represents the reduction rate.
It is worth noting that ReNOx has some unique features. First, the reaction temperature was relatively lower than that of the traditional methods. The configuration of the waste treatment system is a key technology consideration. Flue gas often has a complex composition, while dust or other chemicals have a toxic effect on the catalysts [37]. The temperature of the flue gas decreased gradually from the upstream to the downstream processes. ReNOx can be deployed in the downstream to reduce the potential negative effects of other pollutants. The energy consumption for flue gas reheating can also be avoided. Second, as NOx is seen as a resource rather than waste in this context, NOx suppression through combustion control might be liberated, provided that the treatment technology can bring about environmental performance improvement. There could be an externality in terms of the promotion of power generation efficiency. Third, ReNOx can be regarded as part of the nitrogen circular economy by converting waste reactive nitrogen to useful ones. It would be informative to quantify its broad environmental impacts, economic effectiveness, and social effects.
4. Conclusions
The present study conducted a life cycle assessment of ReNOx for the first time. The results revealed that various trade-offs existed for the environmental impacts of ReNOx under different conditions. The carbon dioxide emissions in the conversion stage contributed 48% to the climate change. The most critical process for ozone layer destruction was waste treatment service, which contributed 75% to the total. The emissions of NOx contributed more than 90% to both acidification and urban area air pollution. Photochemical ozone mainly stemmed from methane production (40%). Catalyst production was identified as a critical process for toxic chemicals and aquatic and biological toxicity. The results suggested that the optimization of catalyst production and usage can substantially reduce the impacts of toxic chemicals and aquatic and biological toxicity. The optimization of adsorption material production and usage can be a potential measure to reduce eutrophication and resource consumption effectively. The catalyst production (28%), NOx emission (26%), waste treatment service (14%), CO2 emission (14%), methane production (7%), and adsorption material production (5%) were critical for the eco-index. The results can serve as an evaluation criterion for both technology developers and environmental policy makers. This study demonstrated the usefulness of life cycle assessment for new industrial technology evaluation, which features in the analysis at the impact, damage, and eco-index levels. Critical processes can be identified to support future improvements. It can be an important reference for the preliminary assessment of other new industrial technologies.
Author Contributions
Conceptualization, M.X.; methodology, M.X., B.-L.L. and K.T.; formal analysis, M.X. and B.-L.L.; investigation, M.X., B.-L.L., K.T., K.M., T.N. and T.K.; resources, M.X., B.-L.L., K.T., K.M., T.N. and T.K.; writing—original draft preparation, M.X.; writing—review and editing, M.X., B.-L.L., K.T. and T.K.; project administration, T.K. All authors have read and agreed to the published version of the manuscript.
Funding
This research was funded by the New Energy and Industrial Technology Development Organization (NEDO), JPNP18016.
Institutional Review Board Statement
Not applicable.
Informed Consent Statement
Not applicable.
Conflicts of Interest
The authors declare that they have no known competing financial interests or personal relationships that could have appeared to influence the work reported in this paper.
References
- Sutton, M.; Raghuram, N.; Adhya, T.K.; Baron, J.; Cox, C.; de Vries, W.; Winiwarter, W. The Nitrogen Fix: From Nitrogen Cycle Pollution to Nitrogen Circular Economy; United Nations Environment Programme: Nairobi, Kenya, 2019; pp. 52–64. [Google Scholar]
- Ackerman, D.; Millet, D.B.; Chen, X. Global Estimates of Inorganic Nitrogen Deposition Across Four Decades. Glob. Biogeochem. Cycles 2019, 33, 100–107. [Google Scholar] [CrossRef] [Green Version]
- Melillo, J.M. Disruption of the global nitrogen cycle: A grand challenge for the twenty-first century This article belongs to Ambio’s 50th Anniversary Collection. Theme: Eutrophication. Ambio 2021, 50, 759–763. [Google Scholar] [CrossRef] [PubMed]
- Fowler, D.; Steadman, C.E.; Stevenson, D.; Coyle, M.; Rees, R.M.; Skiba, U.M.; Sutton, M.A.; Cape, J.N.; Dore, A.J.; Vieno, M.; et al. Effects of global change during the 21st century on the nitrogen cycle. Atmos. Chem. Phys. 2015, 15, 13849–13893. [Google Scholar] [CrossRef] [Green Version]
- Zong, Z.; Wang, X.; Tian, C.; Chen, Y.; Fang, Y.; Zhang, F.; Li, C.; Sun, J.; Li, J.; Zhang, G. First Assessment of NOx Sources at a Regional Background Site in North China Using Isotopic Analysis Linked with Modeling. Environ. Sci. Technol. 2017, 51, 5923–5931. [Google Scholar] [CrossRef] [PubMed]
- Huang, T.; Zhu, X.; Zhong, Q.; Yun, X.; Meng, W.; Li, B.; Ma, J.; Zeng, E.Y.; Tao, S. Spatial and Temporal Trends in Global Emissions of Nitrogen Oxides from 1960 to 2014. Environ. Sci. Technol. 2017, 51, 7992–8000. [Google Scholar] [CrossRef]
- Tayyeb Javed, M.; Irfan, N.; Gibbs, B.M. Control of combustion-generated nitrogen oxides by selective non-catalytic reduction. J. Environ. Manag. 2007, 83, 251–289. [Google Scholar] [CrossRef] [PubMed]
- Fu, S.; Song, Q.; Yao, Q. Study on the catalysis of CaCO3 in the SNCR deNOx process for cement kilns. Chem. Eng. J. 2015, 262, 9–17. [Google Scholar] [CrossRef]
- Abul Hossain, K.; Nazri Mohd Jaafar, M.; Mustafa, A.; Babu Appalanidu, K.; Nasir Ani, F. Application of selective non-catalytic reduction of NOx in small-scale combustion systems. Atmos. Environ. 2004, 38, 6823–6828. [Google Scholar] [CrossRef] [Green Version]
- Muzio, L.J.; Quartucy, G.C. Implementing NOx control: Research to application. Prog. Energy Combust. Sci. 1997, 23, 233–266. [Google Scholar] [CrossRef]
- Li, J.; Chang, H.; Ma, L.; Hao, J.; Yang, R.T. Low-temperature selective catalytic reduction of NOx with NH3 over metal oxide and zeolite catalysts—A review. Catal. Today 2011, 175, 147–156. [Google Scholar] [CrossRef]
- Hong, Z.; Wang, Z.; Li, X. Catalytic oxidation of nitric oxide (NO) over different catalysts: An overview. Catal. Sci. Technol. 2017, 7, 3440–3452. [Google Scholar] [CrossRef]
- Haber, F. The Synthesis of Ammonia from Its Elements. Nobel Lecture. 2 June 1920. Available online: https://www.nobelprize.org/prizes/chemistry/1918/haber/lecture/ (accessed on 15 June 2020).
- Nanba, T.; Meunier, F.; Hardacre, C.; Breen, J.; Burch, R.; Masukawa, S.; Uchisawa, J.; Obuchi, A. Formation of ammonia during the NO−H2 reaction over Pt/ZrO2. J. Phys. Chem. C 2008, 112. [Google Scholar] [CrossRef]
- Takahashi, A.; Tanaka, H.; Parajuli, D.; Nakamura, T.; Minami, K.; Sugiyama, Y.; Hakuta, Y.; Ohkoshi, S.; Kawamoto, T. Historical pigment exhibiting ammonia gas capture beyond standard adsorbents with adsorption sites of two kinds. J. Am. Chem. Soc. 2016, 138, 6376–6379. [Google Scholar] [CrossRef] [PubMed]
- Kobayashi, K.; Atsumi, R.; Manaka, Y.; Matsumoto, H.; Nanba, T. Effect of the TiO2 crystal structure on the activity of TiO2-supported platinum catalysts for ammonia synthesis via the NO–CO–H2O reaction. Catal. Sci. Technol. 2019, 9, 2898–2905. [Google Scholar] [CrossRef]
- Kobayashi, H.; Hayakawa, A.; Somarathne, K.D.K.A.; Okafor, E.C. Science and technology of ammonia combustion. Proc. Combust. Inst. 2019, 37, 109–133. [Google Scholar] [CrossRef]
- Xue, M.; Wang, Q.; Ling, B.-L.; Tsunemi, K. Assessment of ammonia as an energy carrier from the perspective of carbon and nitrogen footprints. ACS Sustain. Chem. Eng. 2019, 7, 12494–12500. [Google Scholar] [CrossRef]
- McDougall, F.; White, P.; Franke, M.; Hindle, P. Integrated solid waste management: A life cycle inventory. Int. J. Life Cycle Assess. 2001, 6. [Google Scholar] [CrossRef]
- Cui, L.; Ba, K.; Li, F.; Wang, Q.; Ma, Q.; Yuan, X.; Mu, R.; Hong, J.; Zuo, J. Life cycle assessment of ultra-low treatment for steel industry sintering flue gas emissions. Sci. Total Environ. 2020, 725, 138292. [Google Scholar] [CrossRef]
- Kim, J.; Lee, J.; Cho, H.; Ahn, Y. Life-cycle assessment of SO2 removal from flue gas using carbonate melt. J. Ind. Eng. Chem. 2021, 100, 270–279. [Google Scholar] [CrossRef]
- Van Caneghem, J.; De Greef, J.; Block, C.; Vandecasteele, C. NOx reduction in waste incinerators by selective catalytic reduction (SCR) instead of selective non catalytic reduction (SNCR) compared from a life cycle perspective: A case study. J. Clean. Prod. 2016, 112, 4452–4460. [Google Scholar] [CrossRef]
- Liang, Z.; Ma, X.; Lin, H.; Tang, Y. The energy consumption and environmental impacts of SCR technology in China. Appl. Energy 2011, 88, 1120–1129. [Google Scholar] [CrossRef]
- Møller, J.; Munk, B.; Crillesen, K.; Christensen, T.H. Life cycle assessment of selective non-catalytic reduction (SNCR) of nitrous oxides in a full-scale municipal solid waste incinerator. Waste Manag. 2011, 31, 1184–1193. [Google Scholar] [CrossRef]
- Wu, X.; Wu, K.; Zhang, Y.; Hong, Q.; Zheng, C.; Gao, X.; Cen, K. Comparative life cycle assessment and economic analysis of typical flue-gas cleaning processes of coal-fired power plants in China. J. Clean. Prod. 2017, 142, 3236–3242. [Google Scholar] [CrossRef]
- Stasiulaitiene, I.; Martuzevicius, D.; Abromaitis, V.; Tichonovas, M.; Baltrusaitis, J.; Brandenburg, R.; Pawelec, A.; Schwock, A. Comparative life cycle assessment of plasma-based and traditional exhaust gas treatment technologies. J. Clean. Prod. 2016, 112, 1804–1812. [Google Scholar] [CrossRef]
- Wen, Z.; Di, J.; Liu, S.; Han, J.; Lee, J.C.K. Evaluation of flue-gas treatment technologies for municipal waste incineration: A case study in Changzhou, China. J. Clean. Prod. 2018, 184, 912–920. [Google Scholar] [CrossRef]
- ISO 14040. Environmental Management—Life Cycle Assessment—Principles and Framework; International Standards Organization: Geneva, Switzerland, 2006. [Google Scholar]
- ISO 14040. Environmental Management—Life Cycle Assessment—Requirements and Guidelines; International Standards Organization: Geneva, Switzerland, 2006. [Google Scholar]
- IDEA Inventory Database for Environmental Analysis (IDEA). Available online: http://www.idea-lca.jp/ja/index.html (accessed on 15 June 2020).
- Itsubo, A.; Inaba, N. LIME2: Life-Cycle Impact Assessment Method Based on Endpoint Modeling; Maruzen Publisher: Tokyo, Japan, 2010. [Google Scholar]
- Santos, A.; Barbosa-Póvoa, A.; Carvalho, A. Life cycle assessment in chemical industry—A review. Curr. Opin. Chem. Eng. 2019, 26, 139–147. [Google Scholar] [CrossRef]
- Pizzol, M.; Weidema, B.; Brandão, M.; Osset, P. Monetary valuation in Life Cycle Assessment: A review. J. Clean. Prod. 2015, 86, 170–179. [Google Scholar] [CrossRef]
- Moni, S.M.; Mahmud, R.; High, K.; Carbajales-Dale, M. Life cycle assessment of emerging technologies: A review. J. Ind. Ecol. 2020, 24. [Google Scholar] [CrossRef]
- Locci, C.; Vervisch, L.; Farcy, B.; Domingo, P.; Perret, N. Selective non-catalytic reduction (SNCR) of nitrogen oxide emissions: A perspective from numerical modeling. Flow Turbul. Combust. 2018, 100, 301–340. [Google Scholar] [CrossRef]
- Wang, D.; Chen, Q.; Zhang, X.; Gao, C.; Wang, B.; Huang, X.; Peng, Y.; Li, J.; Lu, C.; Crittenden, J. Multipollutant control (MPC) of flue gas from stationary sources using SCR technology: A critical review. Environ. Sci. Technol. 2021, 55, 2743–2766. [Google Scholar] [CrossRef]
- Wang, D.; Luo, J.; Yang, Q.; Yan, J.; Zhang, K.; Zhang, W.; Peng, Y.; Li, J.; Crittenden, J. Deactivation Mechanism of Multipoisons in Cement Furnace Flue Gas on Selective Catalytic Reduction Catalysts. Environ. Sci. Technol. 2019, 53, 6937–6944. [Google Scholar] [CrossRef] [PubMed]
Publisher’s Note: MDPI stays neutral with regard to jurisdictional claims in published maps and institutional affiliations. |
© 2021 by the authors. Licensee MDPI, Basel, Switzerland. This article is an open access article distributed under the terms and conditions of the Creative Commons Attribution (CC BY) license (https://creativecommons.org/licenses/by/4.0/).