Article

Quality Analysis of Some Spray Parameters When Performing Treatments in Vineyards in Order to Reduce Environment Pollution

1
Department of Technical Sciences and Soil Sciences, University of Agricultural Sciences and Veterinary Medicine Cluj-Napoca, Calea Mănăștur Street, No. 3-5, 400372 Cluj-Napoca, Romania
2
SC RITTNER TRADING SRL, Cerbului Street No. 5A, 410563 Oradea, Romania
*
Author to whom correspondence should be addressed.
Sustainability 2021, 13(14), 7780; https://doi.org/10.3390/su13147780
Submission received: 20 April 2021 / Revised: 1 July 2021 / Accepted: 9 July 2021 / Published: 12 July 2021
(This article belongs to the Section Sustainable Agriculture)

Abstract

:
There is a worldwide trend that supports the rational use of chemicals in agriculture. It has become common knowledge that irresponsible application of pesticides can cause food security issues, by endangering human and animal health while also having negative environmental consequences. The aim of this experiment was to assess the qualitative parameters of spraying treatments in vineyards. To achieve this, a vineyard and orchard sprayer machine was used for the application of treatments under a gradient of pressures (3, 5, 7, 9 bar). Water-sensitive collectors were placed at three heights (0.8 m, 1.5 m, 2.5 m). Following spraying was determined using DepositScan: the volume median diameter characterization of droplets (DV 1, DV 5, DV 9), and coverage degrees of sprayings. Results indicated that best coverage degree and larger droplets tend to be deposited 1.5 m from the ground, which corresponds with the highest proximity to the positioning of the nozzles of the machine during application, and lowest coverage is found at the top, where droplets deposited also tend to be smaller. For the anti-drift nozzle model used in the study, the best coverage was obtained at a pressure of 5 bar. For sustainability of agricultural practices and rational use of pesticides, more research is required for optimization of increased precision spraying that could ensure high coverage at lower doses of chemicals and coarse droplets. In this way the quantity of product sprayed is expected to be reduced, due to minimization of off-target losses and increased efficiency. This can ensure that negative environmental impacts are lowered. Improved treatment application at higher positioning of the canopy remains a challenge and shall receive more attention.

1. Introduction

Plant protection is one of the most important branches of crop production, which makes it possible to prevent crop losses resulting from threats connected to the harmful activity of pests and diseases. One of the methods against diseases and pests that harm the culturing of plants is the chemical method, which makes it necessary to use powder or liquid chemicals called pesticides. Phytosanitary treatments applied in vineyards and orchards differ from those applied in field culture in terms of the method of application of active substances. Thus, if in the case of field crops the method of pulverization of the solution is hydraulic, in the case of application of plant protection treatments in vineyards the method is hydropneumatic. This method uses an installation that raises the pressure of the spray solution up to around 20 bar and inserts it into a high-speed air current for additional fragmentation of the jet, resulting in small droplets.
The optimal application of crop protection products is determined by a complexity of factors such as: application equipment, tank mix parameters, operational characteristics, canopy as well as environmental particularities such as meteorological factors. All these influence on- and off-target deposition and the overall effectiveness of an agrochemical treatment [1,2]. Spray formulations as well as droplet size have been determined to play a significant role on successful aerial applications [3]. At the same time, in order to reduce environmental pollution, the characteristics of the droplets proved to be extremely important, because their size and weight are the most used factors taken into account in reducing the drift [4,5,6,7], for drift monitoring with high precision, Lidar sensors have also been used successfully [8,9].
Spraying equipment and techniques have been comprehensively overviewed by Furness [10].
Farmers often find themselves needing to balance constant challenges related to pesticide application. Firstly, they are under constraints to reduce chemical residues, and demanded to decrease environmental impact of pesticide treatments due to negative cascading consequences for agroecosystems. At the same time, they are pressured by increasing cost of chemicals, while also aiming to ensure healthy crops and maximizing yields. These challenges can find their answer in increasing the “precision” of spraying, that might be able to provide maximum effective coverage while applying lower chemical doses. From economic and environmental standpoints this can be considered the most viable approach. For this purpose, air injection nozzles can be used, capable of reducing drift [11,12], and thus implicitly pollution while keeping the degree of coverage similar to the classic nozzles, hydraulic, disc–core nozzles [13].
The common definitions of spray droplet deposition are deposit rate, chemical formulation, droplet size distribution, droplet spread density and area covered by the droplets stains.
Several new definitions were added to the ASAE standard S327.2 [14] to define effective coverage:
  • Effective radial distance (ERD): the distance from a chemical droplet-stain on a target at which a pest is controlled by the chemical. The ERD of each crop and pest under different conditions should be defined by the chemical manufacturers on the labels.
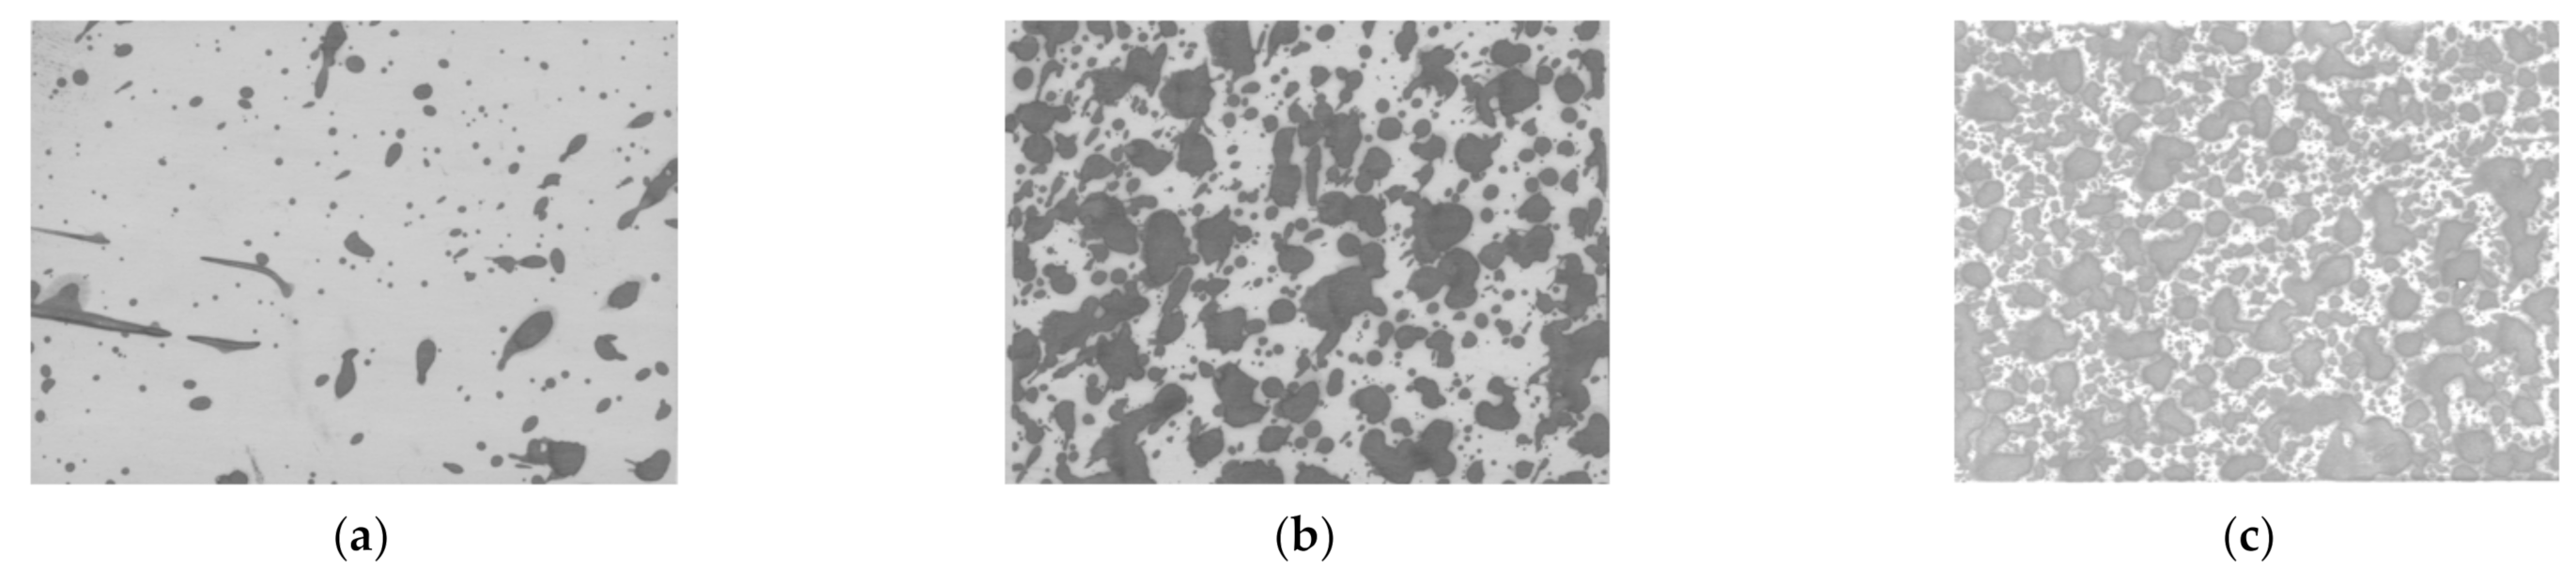
  • Spray coverage efficiency: percentage of area affected by the droplets on a target, relative to total target area; affected by spray rate, droplet-stain size distribution, droplet-stain spread, the effective radial distance (ERD) of the chemical on the pest, and target surface characteristics.
  • Affected area by a chemical droplet-stain on a target: the area around the chemical droplet-stain on a target at which the pest is fully controlled. Its boundaries are at the effective radial distance (ERD) from the droplet-stains on the target.
Hoffmann and Hewitt [15] studied three measuring systems for assessing the common definitions of droplet size parameters determined from water-sensitive papers (WSP) placed horizontally, in order to evaluate the droplet spectra generated by five types of nozzles.
Other studies explored the relationship between spray application characteristics such as pesticide concentration or droplet density, and the efficiency of treatments under either field or laboratory conditions. In a laboratory experiment, Fisher and Menzies [16] studied droplet density to identify the effects of exposure to carbaryl residues of hatched larvae of Grapholitha molesta (Busck).
The spray application quality in the field is normally measured by collectors represented by water sensitive paper or the leaves. The collectors are placed at certain determined target areas and inspected after treatment application [17,18]. Various imaging or scanning systems can be used to determine and analyze the spots obtained on collectors and finally to calculate certain parameters such as: area covered, the size distribution of spots or other spray-coverage quality measurements.
Frequently, the coverage obtained on WSP is larger than expected, so this is not an issue [19].
Water-sensitive paper is a stiff paper that presents a special coating. The surface is yellow and following deposition of droplets will stain dark blue. This paper was designed by Syngenta to be used in the field, for a facile evaluation of low volume sprays (LV). Thus, to measure and evaluate the sprayed droplets, there is no need to use dye in the solution [20].
Currently, there are no spray coverage quality standards given for a certain disease or pest. Coverage quality of the target area depends on several spraying parameters. Among these are: extent of coverage and number of deposits as well as droplet size. For increased effectiveness, it is considered that a higher number of droplets per unit area will also mean an increased probability of reaching the critical limit for pest control. According to recommendations given by Syngenta Crop Protection AG, for satisfactory results the thresholds are: minimum 50–70 droplets/cm2 for fungicide, minimum 20–30 droplets/cm2 for insecticide or preemergence herbicides and minimum 30–40 droplets/cm2 for contact post-emergence herbicides [20,21,22].
The aim of this study was to comparatively assess the parameters of spraying and to measure spray quality at different heights and pressures. These results could be important for evaluation of spray deposits on collectors, and provide an improved base of knowledge on the factors influencing spray coverage quality necessary for effective control of pests and disease while minimize off-target losses not only in vineyards.

2. Materials and Methods

Experiment Design

Field experiments were conducted during 2015–2017 in a vineyard near the city of Oradea, Bihor County, Romania. For this paper nozzle, a Lechler ITR 80-015 (Figure 1) [23] nozzle with an air injector was used, with reduced drift of up to 50% [23,24,25]. This nozzle was used in combination with four pressures (3, 5, 7, 9 bar).
According to Figure 1, the liquid is sent into the nozzle through the ceramic tip. When the liquid passes the side suction hole, the air is drawn into the nozzle. It is mixed with the liquid, and when it comes out through the ceramic spray hole it results in larger drops, filled with air [26,27]. This system is specially designed to reduce the droplet drift effect.
WSP (water sensitive paper) that was scanned using a CANON scanner after application of spraying was used in this study. The sensitive paper was placed at three heights from the ground in a vineyard row: bottom (80 cm), middle (1.5 m) and top (2.5 m) (Figure 2).
Imaging software used was DepositScan for ImageJ [28]. DepositScan has the ability to quantify spray deposit distribution on any paper-type collector that can display visual differences between background and spray deposits. Through activation of the software, the program first opens ImageJ and then the user is required to scan the collector (in this case the water sensitive paper). Finally, the image is converted into an 8-bit gray scale image (Figure 3).
The next step is performed using the ANALYSIS feature in ImageJ, to activate the command “count black and white pixels” and select the area chosen for analysis. Following the measurements, the number of spots and the area of each spot in the selection is determined. The results are displayed as total number of spots and the percentage area covered by the spots. At the end, the program calculates DV 1 (10% of the volume sprayed is in droplets smaller than the expressed value), DV 5 (half of the volume of spray is in droplets either smaller or higher) and DV 9 (indicates that 90% of the volume of spray is in droplets smaller than the given values).
The program has two further paths for selection of determined limits to adjust quality of the image detection. The first one enables the system to select a detection threshold based on the image contrast. The second one is a threshold defined by the user that allows selection of the image detection quality to match the actual deposit patterns [21]. Based on volume median diameter expressed in microns, the droplets can be classified into eight categories as follows: extremely fine (<60 μm), very fine (60–145 μm), fine (146–225 μm), medium (226–325 μm), coarse (326–400 μm), very coarse (401–500 μm), extremely coarse (501–650 μm) and ultra-coarse (>650 μm) [29]. Using DepositScan in this study we determined the following parameters: DV 1; DV 5; DV 9 and coverage degree (%).
Experimental variants were established in complete randomized design with three repetitions and had had the following factors:
Factor 1—pressure: 3, 5, 7, 9 bar.
Factor 2—position of WSP: lower—at 0.8 m from the ground, middle—at 1.5 m from the ground and upper height—at 2.5 m from the ground.
Lechler ITR 80-015 (an air injector nozzle) can deliver the solution at 3, 10 and 30 bar. Although it seems a low pressure to work with, these nozzles were tried for these pressures to assure that the degree of coverage was good. Pressure was determined at nozzle tip with a Herbst handheld computer.
We used ATOM 300 machines, mounted on a TUBER 40 tractor. ATOM 300 has the following characteristics: a tank with a 300 L capacity, 8 nozzles (4 on each side), a membrane piston pump and a 550 mm fan with an air flowrate of 26,000 m3/h [30]. The quantity of water per hectare was 600 L and the driving speed was adjusted to maintain a constant volume of application.
To assure that the machine was working fine, it was tested with a single nozzle measuring device, ED 20/900EL, manufactured by Herbst Pflanzenschutztechnik [31].
The software used to analyze data was Statistica 10, and the test used was Fisher least significance difference (LSD). For pairwise differences in Table 1 and Table 2, the p values representing the measure of probability associated with significance level are presented [32].

3. Results

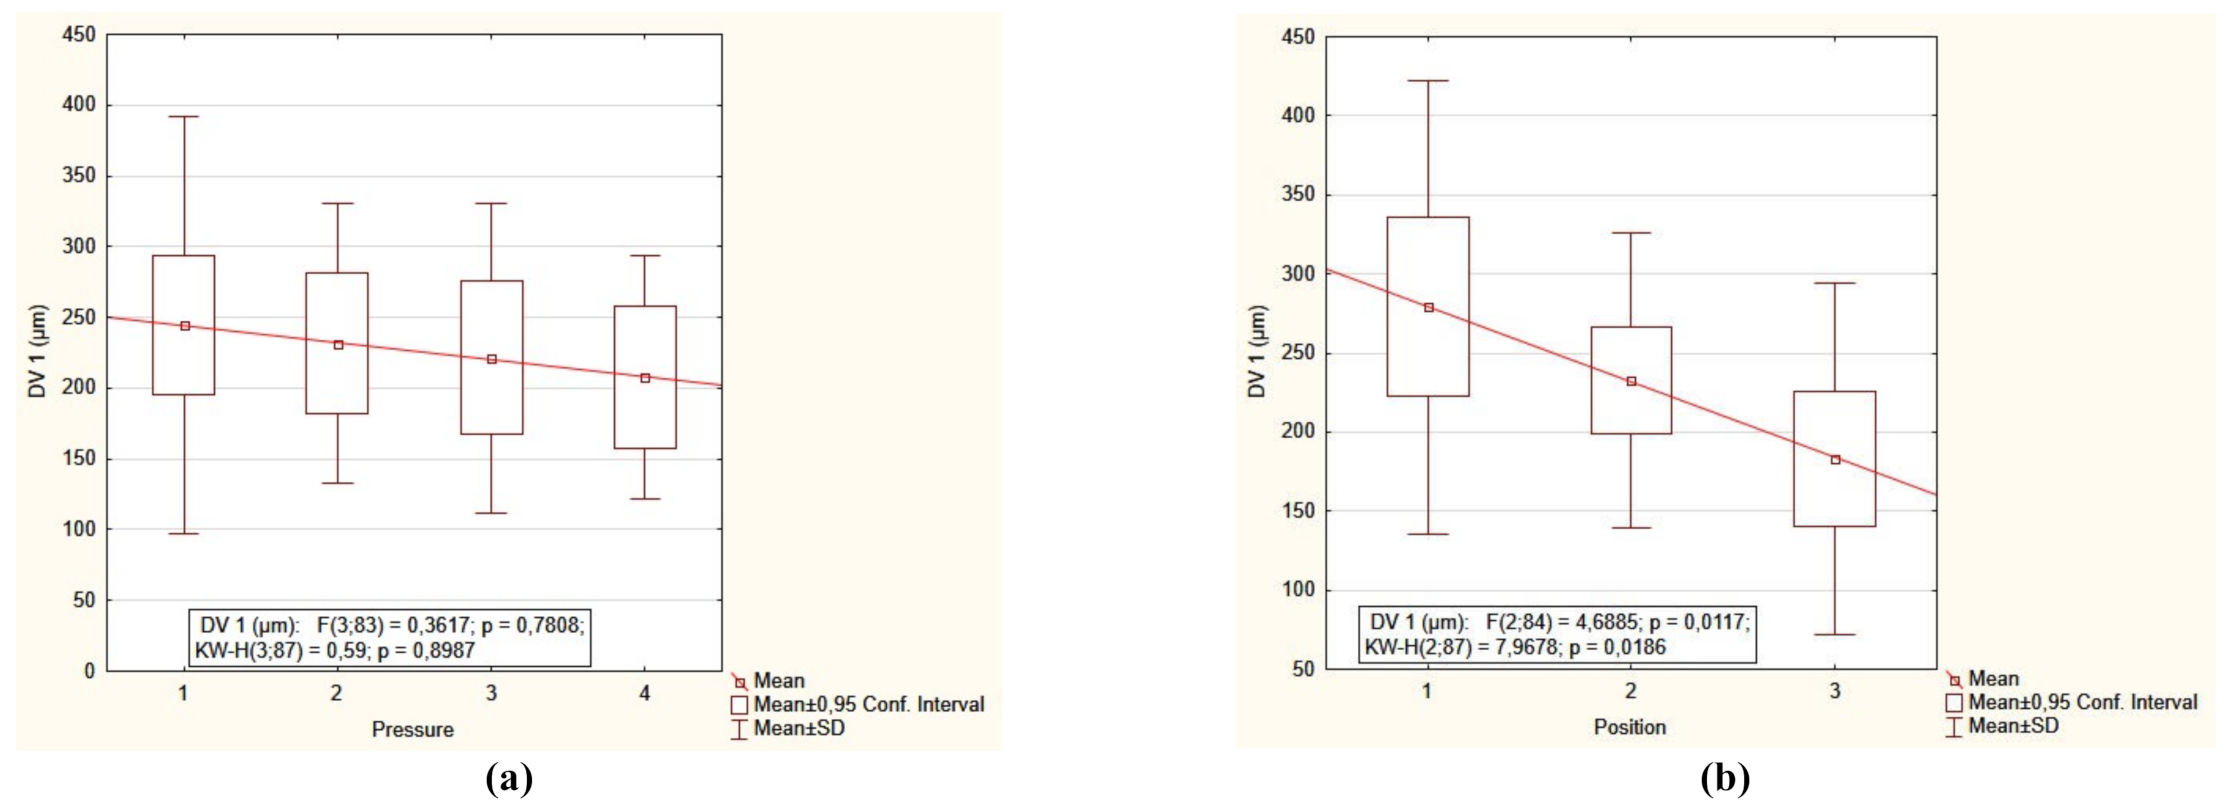
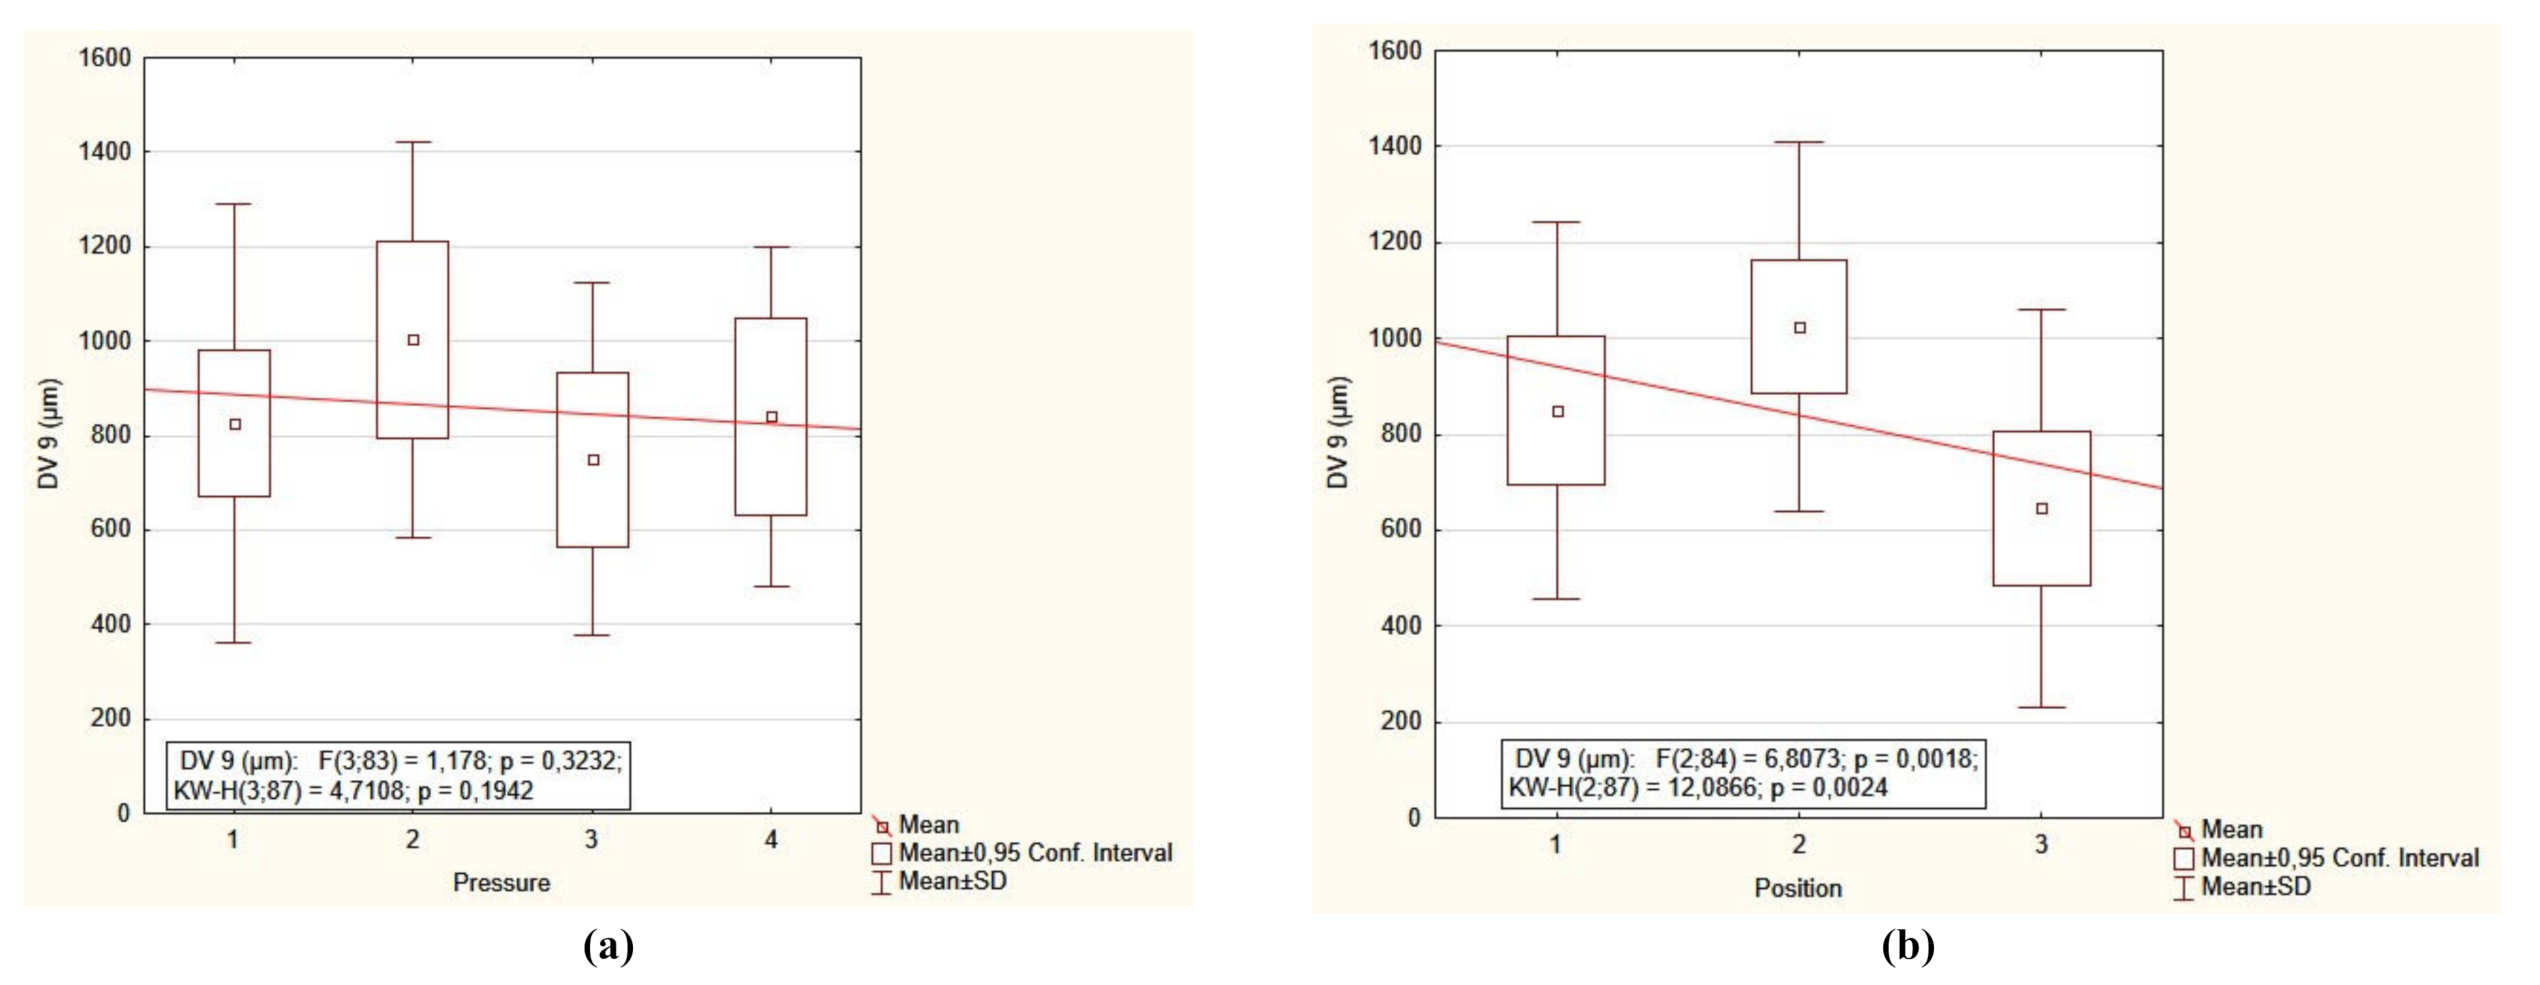
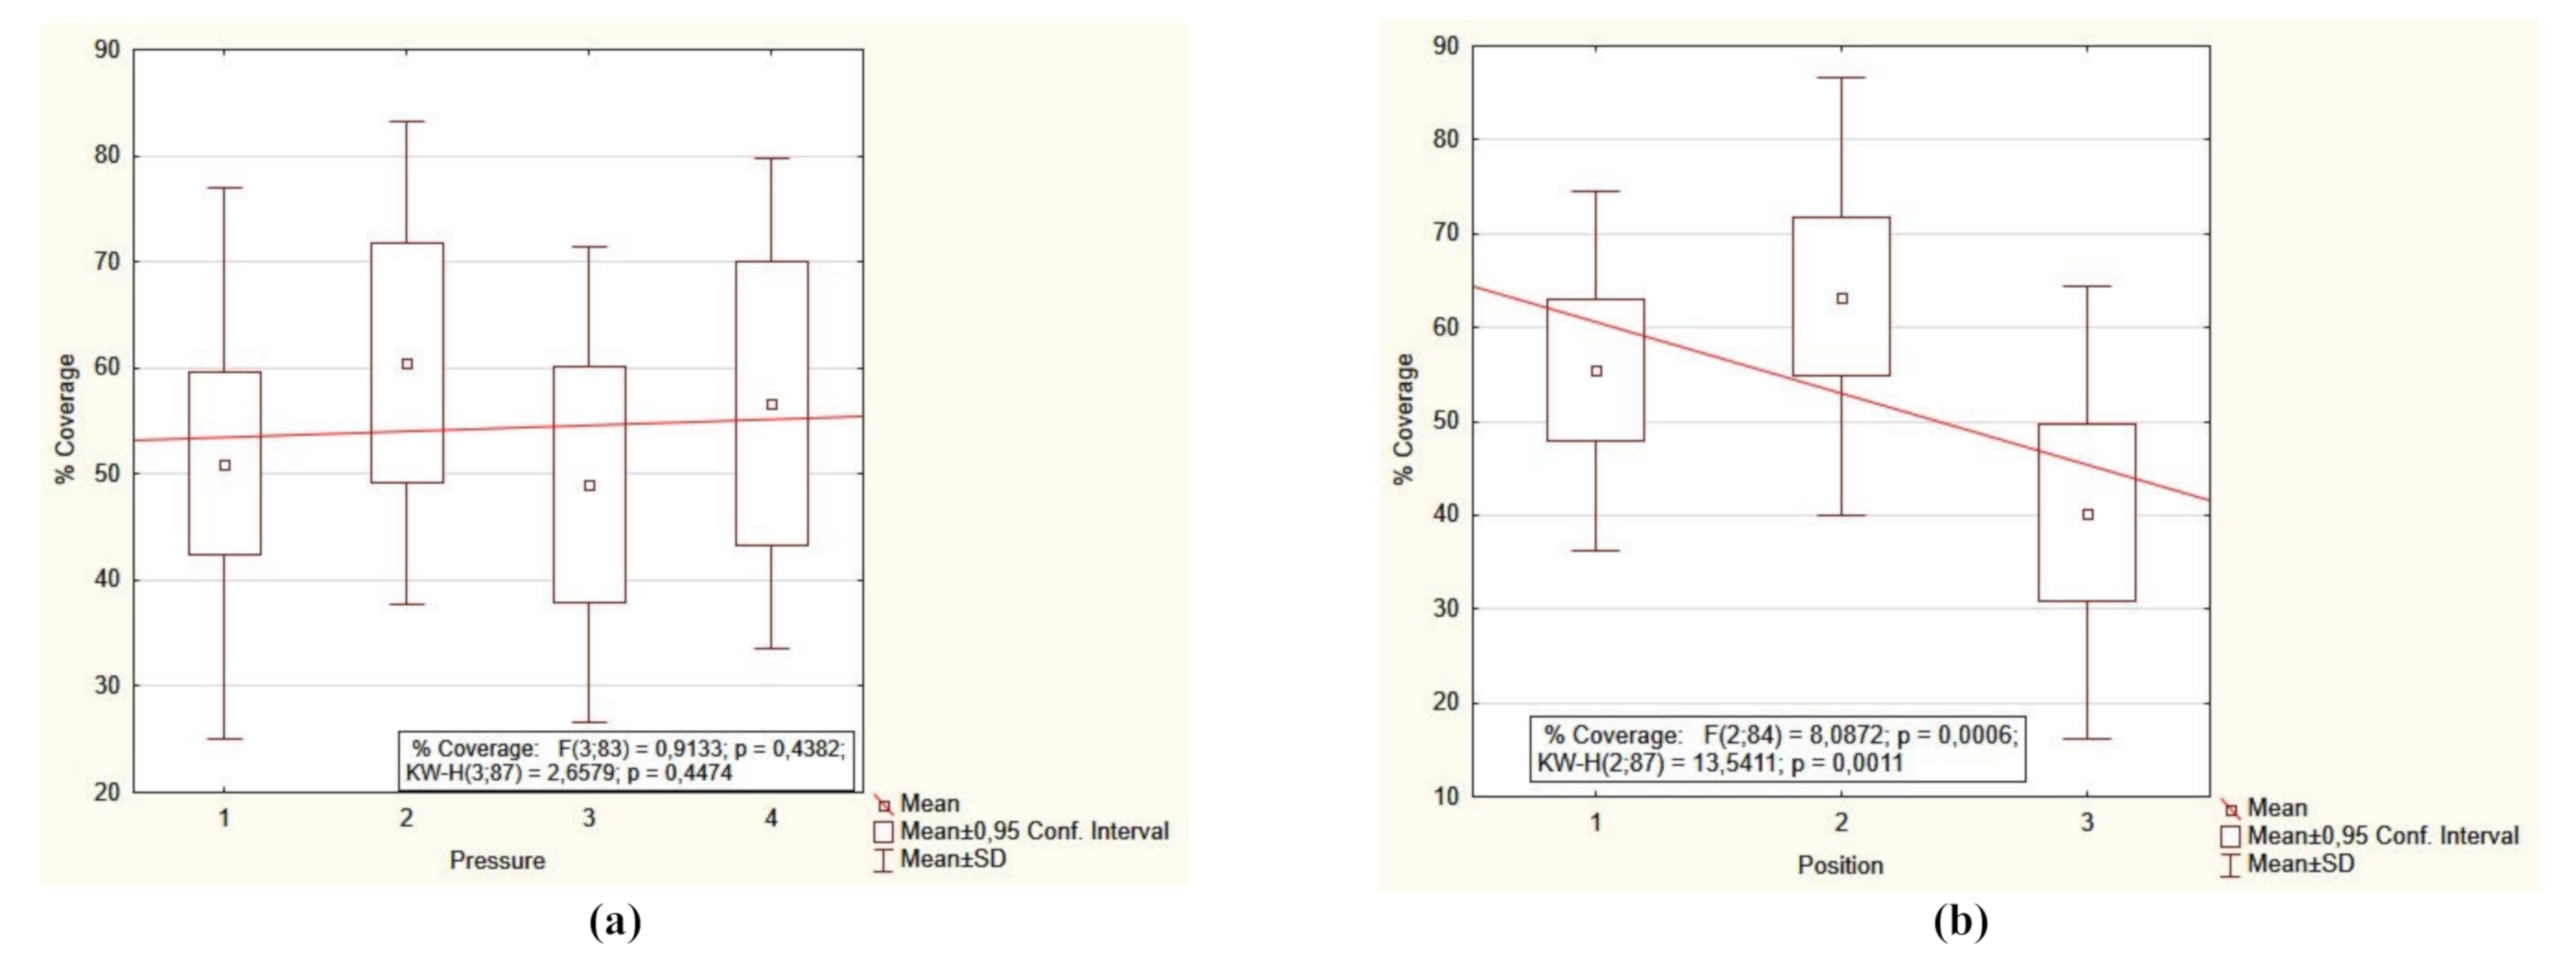
3.1. Influence of Pressure on Droplets Size Parameters and Spraying Coverage

The relationship between droplet size and pressure is presented in Table 1.
Overall, 10% of the sprayed volume was in fine and very fine droplets having sizes less than 207.67–244.65 μm, half of the sprayed volume was in droplets smaller or larger than 497.66–640.71 μm and only 10% of the volume sprayed was of ultra-coarse droplets larger than 749.16–1003.5 μm, depending on the pressure gradient.
More specifically, as can be observed, at pressure of 3 bar, 10% of the sprayed volume had droplets smaller than 244.65 μm, half were either smaller or larger than 533.18 μm and 10% were larger than 825.06 μm. At the pressure of 9 bar, 10% of the sprayed volume had droplets smaller than 207.67 μm, 50% were smaller or larger than 528.29 μm and 10% were larger than 840.24 μm.
As can be observed from Table 1, for DV 1 droplet size decreased progressively from 3 bar with increased pressure until the pressure of 9 bar. This trend can be explained by the fact that under increased pressure the droplets tend to decrease in size, a fact that determines that only a small percentage of droplets have larger size at highest pressure. By comparison, for DV 5 and DV 9, the largest average droplets were found at 5 bar pressure and lowest average droplet size at a pressure of 7 bar. The overall trend is similar for DV 5 and DV 9, displaying increased average droplet size from 3 to 5 bar, followed by a decrease at 7 bar pressure and increase again at 9 bar pressure. Pairwise comparison revealed that within each volume median diameter range (either DV 1, DV 5 or DV 9) the pressure gradient induces differences in droplet size values, these differences are not statistically significant.
As for coverage, it can be observed that highest coverage was obtained at pressure of 5 bar when the degree of coverage reached 60.45%, followed secondly by the highest-pressure level of 9 bar when the coverage was 56.63%. Under 3 bar pressure the coverage was 50.98% and at 7 bar pressure the coverage dropped below 50%.

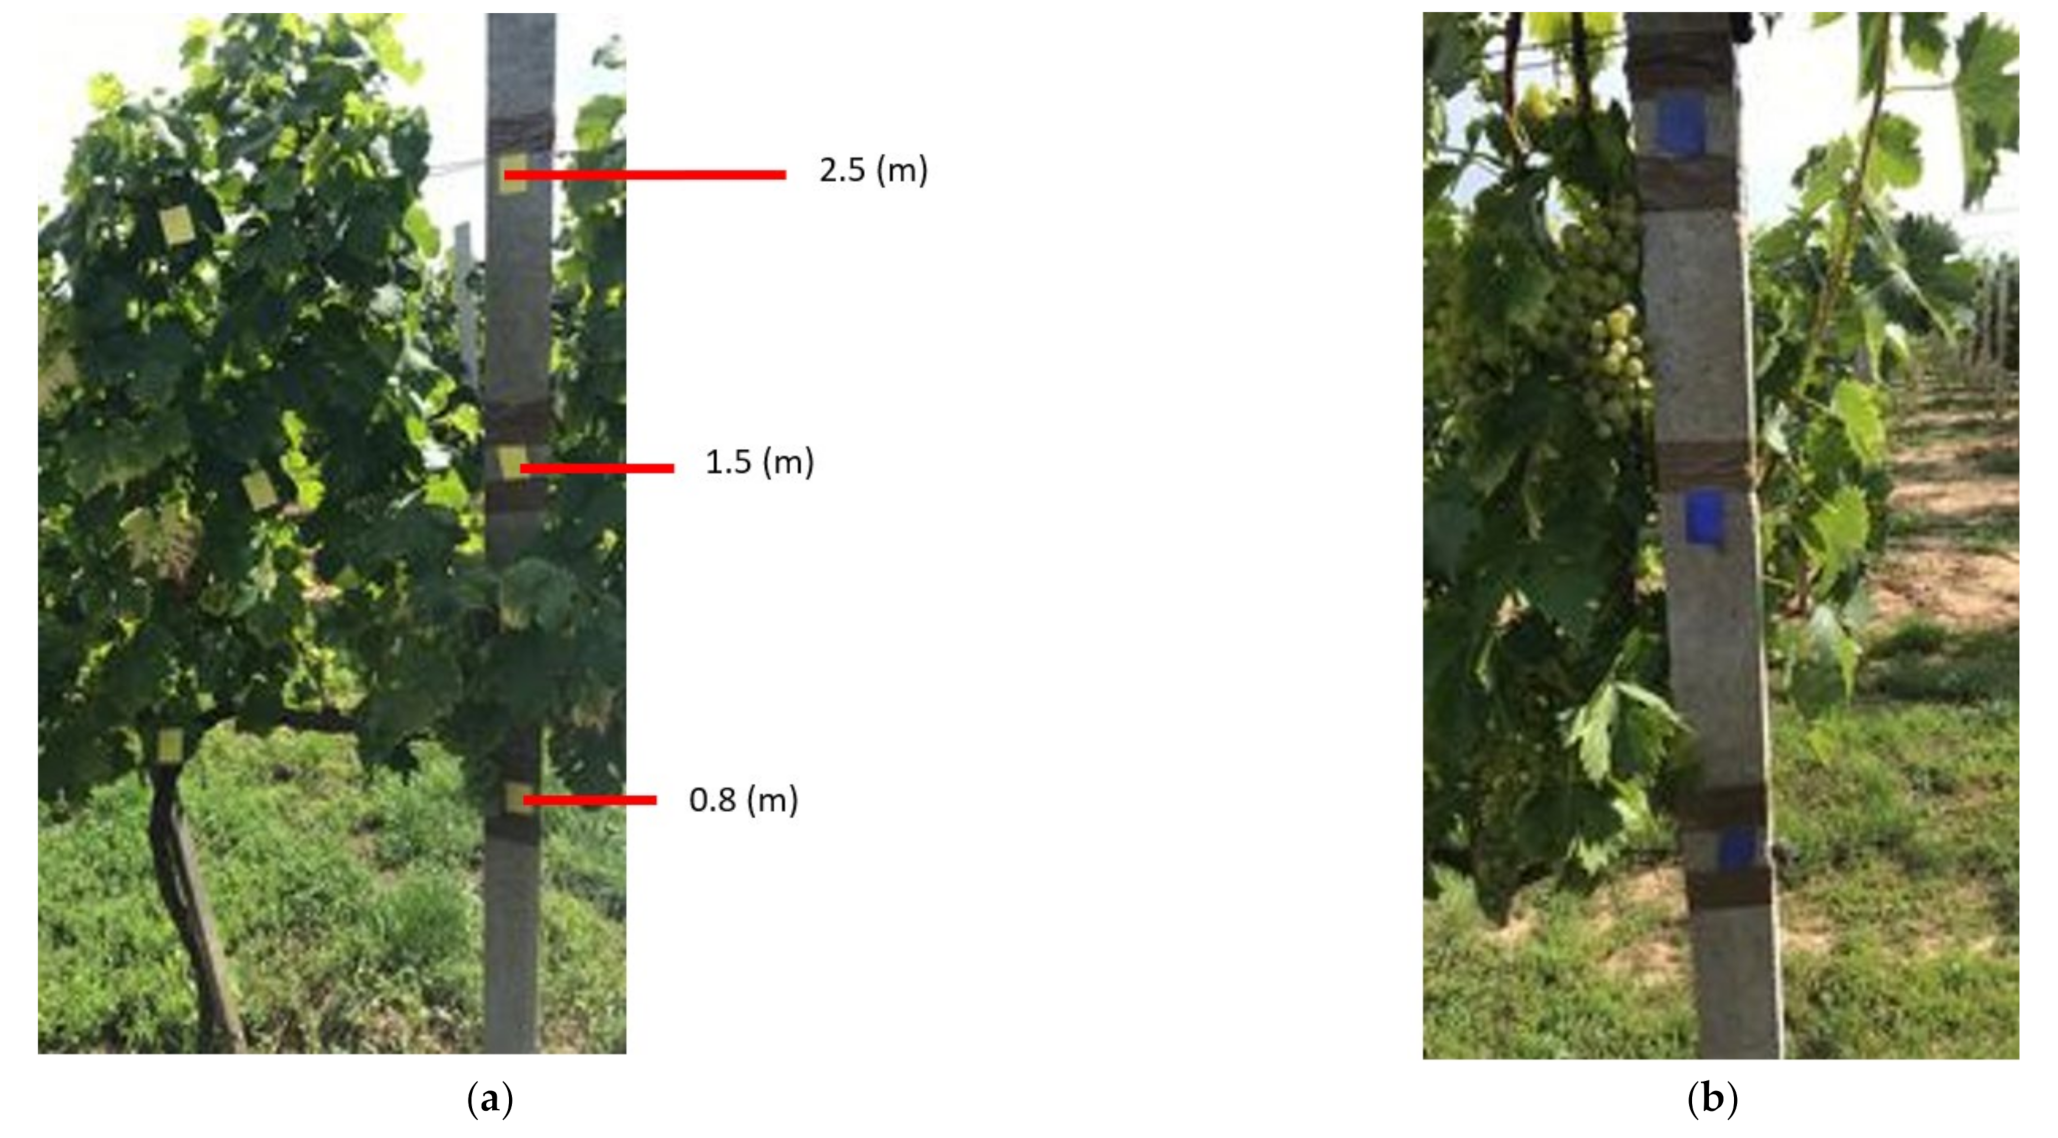
3.2. Influence of Height from the Ground on Droplets Size Parameters and Spraying Coverage

At 0.8 m from the ground the sprayed volume had 10% less droplets than 278.94 μm, while at 2.5 m from the ground 10% of droplets were less than 183.05 μm (Table 2). In the case of DV 1 the average droplet size decreased progressively with incremental height from the ground, a fact that can be explained by the gravitational effect that causes the heavier droplets to not reach as high.
For DV 5 and DV 9 the average droplet size increased from the lower part to the middle part and decreases again at the highest position. Thus, at 1.5 m from the ground, half of the droplets were more or less 638.48 μm in size, and 10% were over 1025.40 μm in size. The coverage was also the highest at the middle position and lowest at the top.
Pairwise comparison showed that the average droplets size at DV 1 was distinctly and significantly different between the lower part and the upper position. Furthermore, for DV 5 the average droplet size was significantly different between the upper part and the middle part, and statistically significantly different between the upper part and the lower part. For DV 9 the average droplet size was significantly different between the middle and upper part. These could be explained by the fact that the best spraying application corresponds to the middle part represented by the height from the ground of 1.5 m, where the trajectory distance of the droplets from spraying nozzles to canopy is shortest, thus ensuring maximum reach at this height range. This is further highlighted by the highest coverage that was also observed to occur at a height of 1.5 m from the ground. At height of 2.5 m the coverage degree was less than 50%.

3.3. Dynamic of Volumetric Median Diameter of Droplets and of the Spraying Coverage under Pressure and Position Gradients

The droplet size dynamic for DV 1, displayed a descending trend associated with increased pressure. Furthermore, a wider droplet size range spectrum was observed at pressures of 3 bar and 7 bar, indicated by higher standard deviation values (Figure 4a).
Average values suggests that 10% of the droplets were less than 250–200 μm regardless of pressure, this roughly representing the interval where all means were situated. At all pressure levels there were droplets within the fine range, represented by droplets with sizes below 200 μm (Figure 4a).
Regarding the influence of position for DV 1, there was a decreasing trend determined for average values with increasing height from the ground. The span range of droplets spectra was wider at 0.8 m from the ground, also indicated by higher standard deviation values registered at lower part. The average volumetric median diameter of droplets decreases with height, a fact that indicates that heavier droplets do not reach as high. At 2.5 m from the ground there were droplets of less than 150 μm and situated in the very fine range. Although small drops can reach higher these are most prone to be blown away by the wind and could result in poor deposition and thus less efficient control of the pests and diseases (Figure 4b).
It can be observed that although the pressure gradient does not exert a significant influence on the average volume median diameter of droplets within the finer range, the position exerts a significant influence (p = 0.0117 *) (Figure 4).
Because DV 1 is representative of the finer droplets out of the sprayed volume spectra of the treatments are applied, these typically have the highest proclivity for drifting. The finer particles once drifting away can deposit on non-target areas and could represent a biodiversity as well as human health hazard. Thus, reducing the volume sprayed as droplets within extremely fine, ultra-fine and fine sized ranges is important not only for target-precision and efficient application but from other, wider considerations as well, and this was achieved at lower pressure levels.
Figure 5 presents the dynamic of DV 5 under a gradient of pressures and positions. By comparison to DV 1, the average value trend does not follow the same linear pattern. Although the range remains wider at lower pressure, the average values increased from 3 to 5-bar pressure and then decrease again under 7 bar.
DV 5 is representative of the bulk of droplets out of the volume sprayed. Results indicate that half of the droplets were more or less 650–450 μm, which situates these within the coarse-very coarse and extremely coarse categories. This dynamic is representative of the main tendency and best characterizes the overall droplet spectra. This suggests that a high percentage of droplets could efficiently reach the target while also being at lower risk of drifting.
The height from the ground was exerting a distinctly significant influence over droplet size (p = 0.0040 **). Notably, the range for droplet size remained wide at all canopy positions: low, middle and upper. However, of the volume sprayed, a larger majority of coarser droplets were deposited at the middle part, followed by the lower part and to a lesser extent at the upper part (Figure 5b).
Figure 6 presents the dynamic of droplet characteristics under different pressures (Figure 6a) or at different heights from the ground (Figure 6b). The general trend observed for DV 5 is somewhat similar to the one observed for DV 9. Thus, there is an increase of average values from 3 to 5 bar and a decrease again at 7 bar followed by a slight increase at 9 bar.
The DV 9 trend is representative of the coarser fraction of sprayed volume of droplets. Ultra-coarse droplets exceeding 800 μm were present in the sprayed volumes at all pressure levels and particularly at the bottom and middle positions. The position in this case exercised a distinctly significant influence on the coarser fraction of droplets (p = 0.0018 **), with a decrease of coarseness at the highest positions (Figure 6).
Figure 7 presents the dynamic of coverage degree under different pressures (Figure 7a) or at different heights from the ground (Figure 7b).
Degree of coverage represents one the most important indicators that can be directly associated with efficiency of the treatments. Thus, a higher coverage is the desired outcome. Regardless of pressure level, the average coverage of sprayed droplets was roughly between 40 and 65%. The trend observed was an increase from 3 to 5 bar pressure and then a decrease again under 7 bar pressure. The influence of pressure was not significant but the influence of height from the ground was highly significant (p = 0.0006 ***).
Often, farmers might tend to consider that coverage degree is solely responsible for success of phytosanitary treatments. Yet, droplet size spectra of the sprayed volume are just as important. The experiment carried out in this study took place in field conditions, in an attempt to add a contribution to the understanding of efficiency in real-life conditions of spraying application in vineyards. Even though application of the plant protection products is advised to be avoided during strong winds and high temperatures that can negatively influence the success of the treatments, variables associated with field conditions that farmers face must be better determined and studied. Optimal pressures to compensate for strength of air currents, larger droplets that have lower risks of drifting, use of less toxic substances and overall improved precision are current directions that receive increased attention. This research attempts to add some aspects to the body of research that might help to critically address efficiency approaches to high-canopy crops.

4. Discussion

Efficacity of plant protection products (PPP) applied to the crop are controlled to a high degree by the efficiency parameters dependent on the equipment used. Thus, optimization of application is of crucial importance for the success of crop protection and the cascading impact on the yield. The shift to new trends and approaches in plant protection highlights the importance of sprayers while also identifying these as main areas for future research for optimization. Among the new trends in agriculture, the shift from broad-spectrum products to specific formulations that narrowly target certain life-stages of pests (such as eggs or juvenile), implicitly require very good coverage degree to ensure an expected and effective control of the pests [33]. Other shifts related to precision spraying, address site-specific control of spraying or spray rates adapted to a range of canopy densities and volumes [34]. Among the challenges that remain to be addressed for pesticide application is the precision of spraying, especially in regards with high-positioned canopies such as vineyards and orchards, where reduction of the volume fraction representing off-target losses is still difficult to achieve [33,35]. In this regard, research conducted in citrus orchards indicated that only 46% of the sprayed volume reached the intended target [35]. For increased precision it is considered that droplet size is an important variable that could be managed accordingly in order to reduce the drift effect, with larger and heavier droplets being considered more optimal. By reducing drift, the quantity of product volume sprayed is also expected to be reduced, due to minimization of off-target losses. In this regard, nozzle type has received the most attention, since this controls the droplet characteristics [4,36,37,38]. However, many drift control methods were found not to ensure best coverage, especially in high-canopy crops. Thus, some novel approaches proposed such as the backstop system that seems to ensure higher success at reducing drift could also be optimized and considered an option [33].
Often, less experienced farmers might tend to think that increased pressure that results in small size droplets is the most sought approach. However, in fact, spray drift due to wind of the fine droplets means that the smaller the droplets the higher the risk of these being lifted by air currents and carried away over large distances, while the target vegetation has received little to no deposition. Such events could cause ineffective treatments and as consequence yield losses, investment loss for farmers since the products bought failed to deposit and perform plant protection, environmental and human health hazard when the fine pesticide droplets are being carried far away from their target and ending up contaminating air, water and soil in non-target areas. Due to these risks, the research for the optimal use of pesticides in agriculture must always consider the efficiency as well as potential non-indented impacts on the environment [33,39,40].
Stringent necessity to decrease the risks and impacts of plant protection products on environment and human health was recognized by policy makers, and at the EU level, the Directive 2009/128/EC [41] of the European Parliament was laid down for this purpose as a framework for joint action that aims at sustainable use of pesticides. The Directive 2009/128/EC “establishes a framework to achieve a sustainable use of pesticides by reducing the risks and impacts of pesticide use on human health and the environment and promoting the use of integrated pest management and of alternative approaches or techniques such as non-chemical alternatives to pesticides” [41]. Furthermore, a project founded by EU and ECPA (European Crop Protection Association) defines a series of drift sources and mitigation methods in order to reduce pollution [42]. In Romania, in accordance with the provisions of Directive 2009/128/EC, the National Phytosanitary Authority (NPA) as public institution oversees the implementation of the National Action Plan that aims to reduce risk and impact of pesticides. Among these measures, NPA offices in the territory are the only entity that has been designated to perform regular inspection and controls of equipment in professional use in the country territories. Current national legislation stipulates that starting with 2020, an inventory of the equipment used for the application of PPP on professional farms should be carried out no less than every three years. Besides inspection of PPP application equipment found in use, training and awareness appraisal actions among farmers are also considered in nation-wide initiatives, with an annual target, according to Decision no. 135/12.03.2019 [43]. Such measures are more than welcome and are expected to have a significant impact. Particularly, regular control of PPP application equipment is estimated to amount to PPP use reduction of 5–10% [44]. However, it should not be omitted that given the high amount of equipment in use at national level, and only one phytosanitary office per county authorized to carry the inspections in Romania, it is foreseen that some hindrances in implementation will prompt the need for improved solutions in the near future. One also has to remark that EU ambition for sustainable PPP use in the future can be achieved through technological advances related to machines and equipment that are being used for the application of plant protection products [34], this is why research on aspects such as those addressed through this paper are of the uttermost importance, and future efforts should be directed toward finding optimization opportunities and identifying draw-backs in regards with functionality and performance of the current practices and existing equipment. Improving the knowledge base through experimental approaches could certainly contribute to the identification of optimization prospects for reducing environmental impact of PPP and achieve a sustainable pest and disease control of crops.

5. Conclusions

This research conducted in field conditions, screened the qualitative parameters of the spraying treatments in vineyards, under a gradient of pressures (3, 5, 7, 9 bar) and height positions (0.8 m, 1.5 m, 2.5 m) using water-sensitive paper.
Based on volume median diameter characterization of droplets (DV 1, DV 5, DV 9), and coverage degrees of sprayings, it was determined that best coverage degree (63.306%) and larger droplets (232.96–1025.40 μm) tend to be deposited at 1.5 m from the ground.
For the anti-drift nozzle model used in the study, the best coverage (60.457%) and larger droplets (231.72–1003.50 μm) were obtained at pressure of 5 bar. By reducing drift, the quantity of product sprayed is also expected to be reduced, due to minimization of off-target losses. This can ensure that negative environmental impact is lowered.
At higher pressure, the droplet size and coverage show less satisfactory results.
For sustainability of agricultural practices and rational use of pesticides, further research for achieving increased precision of spraying that could ensure both high coverage and coarser droplets is still required.
Furthermore, improved treatment application at higher positioning of canopy remains a challenge that must be addressed. In this regard, this research attempts to bring a contribution to the body of research addressing some aspects that might help to critically address efficiency approaches for high-canopy crops.

Author Contributions

Conceptualization, O.R., O.M. and A.B.G.; methodology, O.R., A.M., S.S. and T.R.; software, O.M., S.S. and V.C.; validation, T.R., S.S., O.M. and A.B.G.; formal analysis, A.M., V.C. and M.V.M.; investigation, O.M., T.R., V.C. and M.V.M.; resources, A.B.G., O.R. and A.M.; data curation, A.B.G., A.M., S.S. and V.C.; writing—original draft preparation, O.R., O.M. and A.B.G.; writing—review and editing, V.C., M.V.M. and S.S.; visualization, A.M., O.M. and S.S., supervision, O.R., O.M., A.B.G. and T.R. All authors have read and agreed to the published version of the manuscript.

Funding

This research received no external funding.

Institutional Review Board Statement

Not applicable.

Informed Consent Statement

Not applicable.

Data Availability Statement

Data is contained within the article.

Conflicts of Interest

The authors declare no conflict of interest.

References

  1. Kirk, I.W.; Bouse, L.F.; Carlton, J.B.; Franz, E.; Stermer, R.A. Aerial Spray Deposition in Cotton. Trans. ASAE 1992, 35, 1393–1399. [Google Scholar] [CrossRef]
  2. Salyani, M.; Cromwell, R.P. Spray Drift From Ground and Aerial Applications. Trans. ASAE 1992, 35, 1113–1120. [Google Scholar] [CrossRef]
  3. Yates, W.E.; Akesson, N.B.; Cowden, R.E. Criteria for Minimizing Drift Residues on Crops Downwind from Aerial Applications. Trans. ASAE 1974, 17, 0627–0632. [Google Scholar] [CrossRef]
  4. Grella, M.; Miranda-Fuentes, A.; Marucco, P.; Balsari, P.; Gioelli, F. Development of Drift-Reducing Spouts For Vineyard Pneumatic Sprayers: Measurement of Droplet Size Spectra Generated and Their Classification. Appl. Sci. 2020, 10, 7826. [Google Scholar] [CrossRef]
  5. Grella, M.; Gallart, M.; Marucco, P.; Balsari, P.; Gil, E. Ground Deposition and Airborne Spray Drift Assessment in Vineyard and Orchard: The Influence of Environmental Variables and Sprayer Settings. Sustainability 2017, 9, 728. [Google Scholar] [CrossRef] [Green Version]
  6. Arvidsson, T.; Bergström, L.; Kreuger, J. Spray Drift as Influenced by Meteorological and Technical Factors. Pest Manag. Sci. 2011, 67, 586–598. [Google Scholar] [CrossRef]
  7. Grella, M.; Marucco, P.; Balafoutis, A.T.; Balsari, P. Spray Drift Generated in Vineyard during Under-Row Weed Control and Suckering: Evaluation of Direct and Indirect Drift-Reducing Techniques. Sustainability 2020, 12, 5068. [Google Scholar] [CrossRef]
  8. Gil, E.; Llorens, J.; Llop, J.; Fàbregas, X.; Gallart, M. Use of a Terrestrial LIDAR Sensor for Drift Detection in Vineyard Spraying. Sensors 2013, 13, 516–534. [Google Scholar] [CrossRef] [PubMed] [Green Version]
  9. Gregorio, E.; Rosell-Polo, J.R.; Sanz, R.; Rocadenbosch, F.; Solanelles, F.; Garcerá, C.; Chueca, P.; Arnó, J.; del Moral, I.; Masip, J.; et al. LIDAR as an Alternative to Passive Collectors to Measure Pesticide Spray Drift. Atmos. Environ. 2014, 82, 83–93. [Google Scholar] [CrossRef] [Green Version]
  10. Furness, G. Spraying for Pest and Diseases: An Overview of Equipment and Techniques. Aust. N. Zealand Wine Ind. J. 1993, 8, 250. [Google Scholar]
  11. van de Zande, J.; Holterman, H.; Wenneker, M. Nozzle Classification for Drift Reduction in Orchard Spraying: Identification of Drift Reduction Class Threshold Nozzles. Agric. Eng. Int. 2008, 10, 1–12. [Google Scholar]
  12. Nuyttens, D.; Schampheleire, M.D.; Steurbaut, W.; Baetens, K.; Nicolaï, B.; Ramon, H.; Sonck, B. Experimental Study of Factors Influencing the Risk of Drift from Field Sprayers, Part 2: Spray Application Technique. Asp. Appl. Biol. 2006, 77, 331–339. [Google Scholar]
  13. Derksen, R.; Zhu, H.; Fox, R.D.; Brazee, R.D.; Krause, C.R. Coverage and Drift Produced by Air Induction and Conventional Hydraulic Nozzles Used for Orchard Applications. Trans. ASABE 2000, 50. [Google Scholar] [CrossRef]
  14. ASAE. Standard S 327.2. Dec. 2001. Terminology & Definitions for Agricultural Chemical Application; American Society of Agricultural Engineers: St. Joseph, MI, USA, 2001. [Google Scholar]
  15. Hoffmann, C.; Hewitt, A. Comparison of Three Imaging Systems for Water-Sensitive Papers. Appl. Eng. Agric. 2005, 21. [Google Scholar] [CrossRef]
  16. Fisher, R.W.; Menzies, D.R. Effect of Spray Droplet Density and Exposure Time on the Immobilization of Newly-Hatched Oriental Fruit Moth Larvae1. J. Econ. Entomol. 1976, 69, 438–440. [Google Scholar] [CrossRef]
  17. Sundaram, K.M.S.; de Groot, P.; Sundaram, A. Permethrin Deposits and Airborne Concentrations Downwind from a Single Swath Application Using a Back Pack Mist Blower. J. Environ. Sci. Health Part B 1987, 22, 171–193. [Google Scholar] [CrossRef]
  18. Thériault, R.; Salyani, M.; Panneton, B. Spray Distribution and Recovery in Citrus Application with a Recycling Sprayer. Trans. ASAE 2001, 44. [Google Scholar] [CrossRef]
  19. Fox, R.; Derksen, R.; Zhu, H.; Brazee, R.; Svensson, S. A History of Air-Blast Sprayer Development and Future Prospects. Trans. Am. Soc. Agric. Biol. Eng. 2008, 51. [Google Scholar] [CrossRef]
  20. Water-Sensitive Paper|Check Your Spray Coverage. Available online: https://www.syngenta.com.au/awri (accessed on 19 April 2021).
  21. Zhu, H.; Salyani, M.; Fox, R.D. A Portable Scanning System for Evaluation of Spray Deposit Distribution. Comput. Electron. Agric. 2011, 76, 38–43. [Google Scholar] [CrossRef]
  22. Wang, G.; Lan, Y.; Yuan, H.; Qi, H.; Chen, P.; Ouyang, F.; Han, Y. Comparison of Spray Deposition, Control Efficacy on Wheat Aphids and Working Efficiency in the Wheat Field of the Unmanned Aerial Vehicle with Boom Sprayer and Two Conventional Knapsack Sprayers. Appl. Sci. 2019, 9, 218. [Google Scholar] [CrossRef] [Green Version]
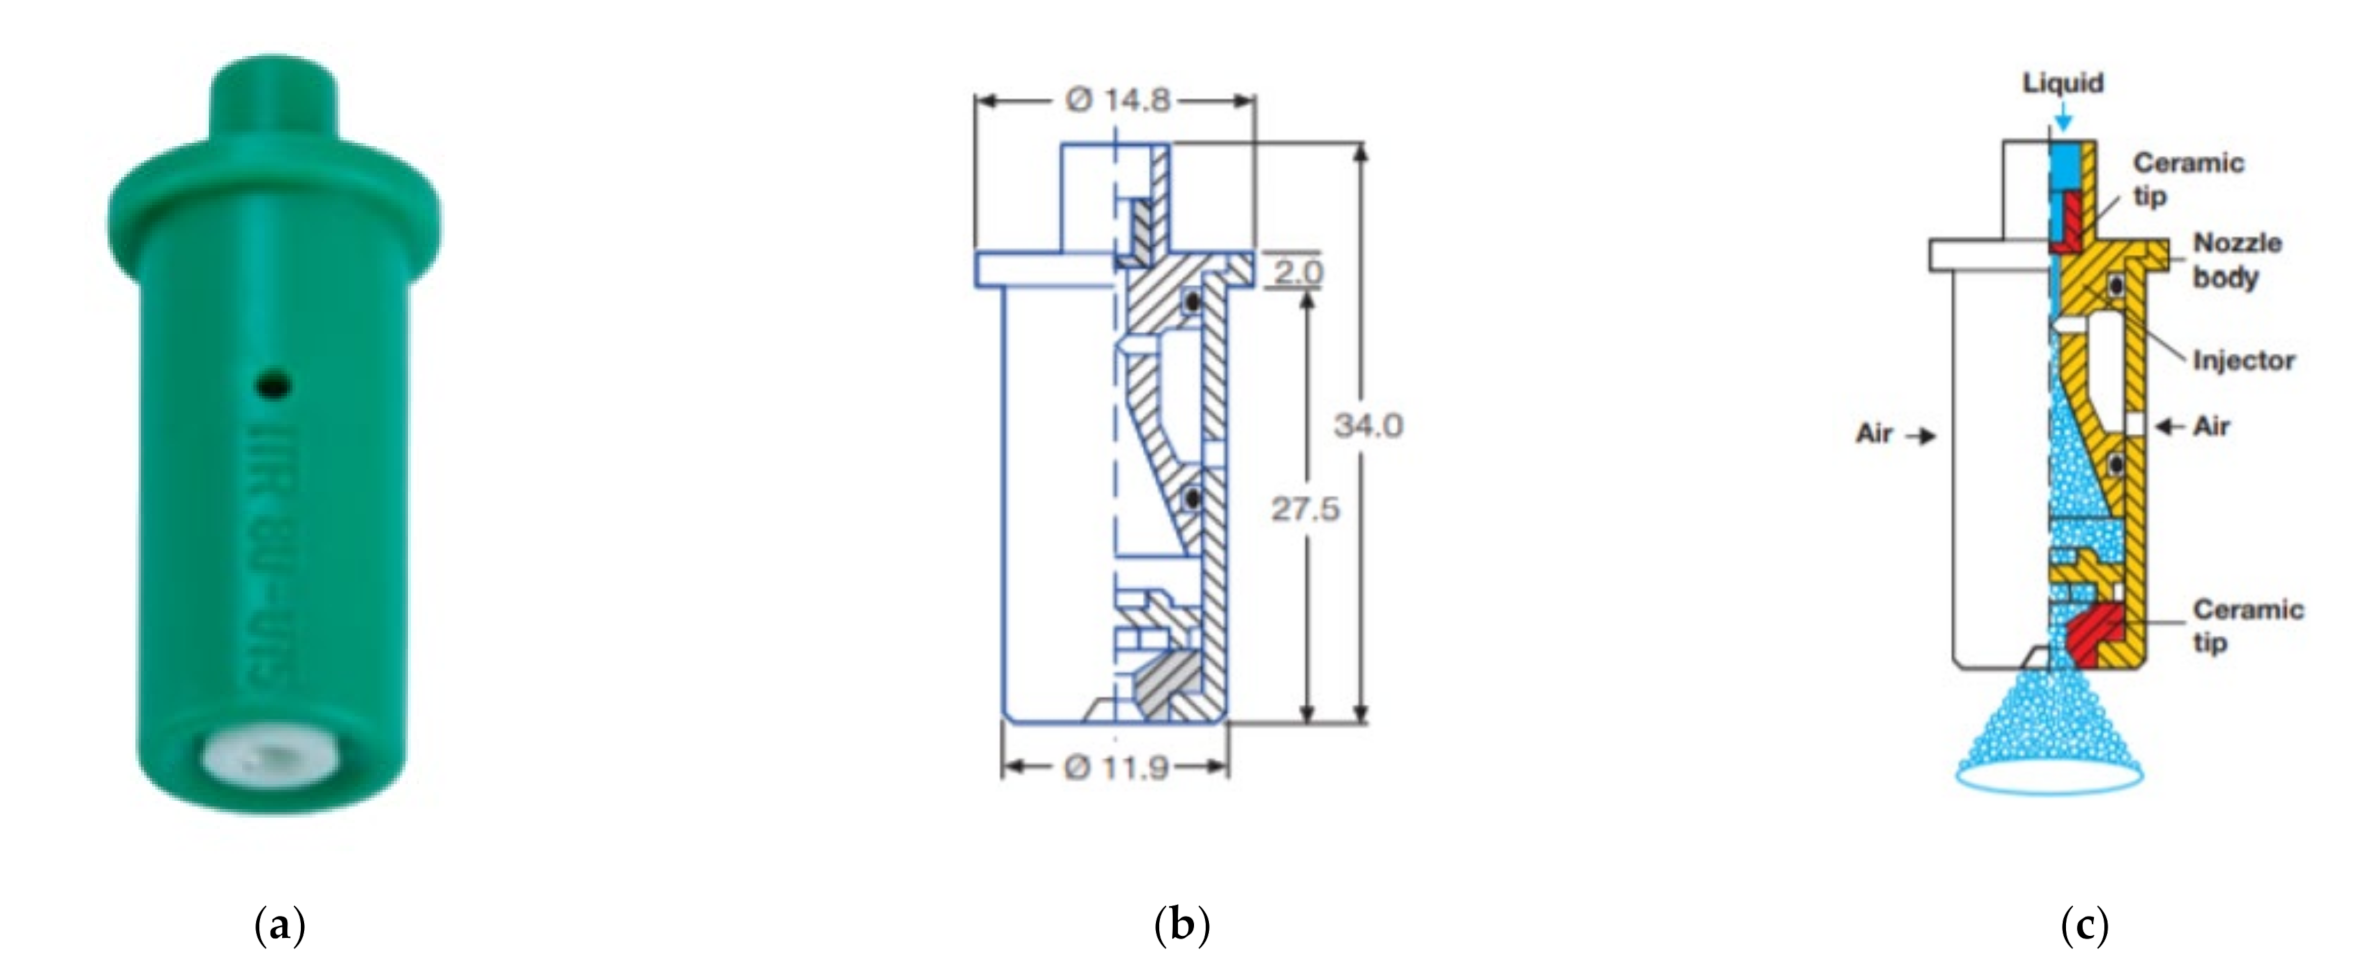
  23. Lechler Agrar. Available online: https://www.Lechler.Com/Fileadmin/Media/Datenblaetter/Agrar/EN/Lechler_agrar_datenblatt_itr80_en.Pdf (accessed on 6 March 2021).
  24. Griesang, F.; Decaro, R.A.; dos Santos, C.A.M.; Santos, E.S.; Roque, N.H. de L.; Ferreira, M. da C. How Much Do Adjuvant and Nozzles Models Reduce the Spraying Drift? Drift in Agricultural Spraying. Am. J. Plant Sci. 2017, 8, 2785–2794. [Google Scholar] [CrossRef] [Green Version]
  25. Ferguson, J.C.; O’Donnell, C.C.; Chauhan, B.S.; Adkins, S.W.; Kruger, G.R.; Wang, R.; Urach Ferreira, P.H.; Hewitt, A.J. Determining the Uniformity and Consistency of Droplet Size across Spray Drift Reducing Nozzles in a Wind Tunnel. Crop Prot. 2015, 76, 1–6. [Google Scholar] [CrossRef]
  26. Vallet, A.; Tinet, C. Characteristics of Droplets from Single and Twin Jet Air Induction Nozzles: A Preliminary Investigation. Crop Prot. 2013, 48, 63–68. [Google Scholar] [CrossRef]
  27. McArtney, S.J.; Obermiller, J.D. Comparative Performance of Air-Induction and Conventional Nozzles on an Axial Fan Sprayer in Medium Density Apple Orchards. HortTechnology 2008, 18, 365–371. [Google Scholar] [CrossRef] [Green Version]
  28. DepositScan: USDA ARS. Available online: https://www.ars.usda.gov/midwest-area/wooster-oh/application-technology-research/docs/depositscan/ (accessed on 19 April 2021).
  29. Understanding Droplet Size—Pesticide Environmental Stewardship. Available online: https://pesticidestewardship.org/pesticide-drift/understanding-droplet-size/ (accessed on 4 June 2021).
  30. ATOM 300 (400)—Tehnofavorit. Available online: http://tehnofavorit.ro/produse/atom-300-400/ (accessed on 2 June 2021).
  31. Herbst-Pflanzenschutztechnik. Available online: http://www.herbst-pflanzenschutztechnik.de/index-Dateien/ED20_900_A4Englisch.pdf (accessed on 6 April 2021).
  32. Nahm, F.S. What the P Values Really Tell Us. Korean J. Pain 2017, 30, 241–242. [Google Scholar] [CrossRef] [PubMed]
  33. Pourreza, A.; Moghimi, A.; Niederholzer, F.J.A.; Larbi, P.A.; Zuniga-Ramirez, G.; Cheung, K.H.; Khorsandi, F. Spray Backstop: A Method to Reduce Orchard Spray Drift Potential without Limiting the Spray and Air Delivery. Sustainability 2020, 12, 8862. [Google Scholar] [CrossRef]
  34. Tona, E.; Calcante, A.; Oberti, R. The Profitability of Precision Spraying on Specialty Crops: A Technical–Economic Analysis of Protection Equipment at Increasing Technological Levels. Precis. Agric. 2018, 19, 606–629. [Google Scholar] [CrossRef] [Green Version]
  35. Garcerá, C.; Moltó, E.; Chueca, P. Spray Pesticide Applications in Mediterranean Citrus Orchards: Canopy Deposition and off-Target Losses. Sci. Total Environ. 2017, 599–600, 1344–1362. [Google Scholar] [CrossRef]
  36. Nuyttens, D.; Baetens, K.; De Schampheleire, M.; Sonck, B. Effect of Nozzle Type, Size and Pressure on Spray Droplet Characteristics. Biosyst. Eng. 2007, 97, 333–345. [Google Scholar] [CrossRef]
  37. Nuyttens, D.; De Schampheleire, M.; Verboven, P.; Brusselman, E.; Dekeyser, D. Droplet Size and Velocity Characteristics of Agricultural Sprays. Trans. ASABE 2009, 52, 1471–1480. [Google Scholar] [CrossRef]
  38. Torrent, X.; Garcera, C.; Molto, E.; Chueca, P.; Abad Moyano, R.; Grafulla, C.; Román, C.; Planas de Martí, S. Comparison between Standard and Drift Reducing Nozzles for Pesticide Application in Citrus: Part I. Effects on Wind Tunnel and Field Spray Drift. Crop Prot. 2017, 96, 130–143. [Google Scholar] [CrossRef] [Green Version]
  39. Bayat, A.; Ulusoy, M.; Karaca, Ý.; Uygun, N. Spray Coverage and Citrus Pest Control Efficiency with Different Types of Orchard Sprayers. AMA Agric. Mech. Asia Afr. Lat. Am. 2000, 31, 45–51. [Google Scholar]
  40. Kasner, E.J.; Fenske, R.A.; Hoheisel, G.A.; Galvin, K.; Blanco, M.N.; Seto, E.Y.W.; Yost, M.G. Spray Drift from Three Airblast Sprayer Technologies in a Modern Orchard Work Environment. Ann. Work Expo. Health 2020, 64, 25–37. [Google Scholar] [CrossRef] [PubMed]
  41. Directive 2009/128/EC of the European Parliament and of the Council of 21 October 2009. Available online: https://eur-lex.europa.eu/legal-content/EN/ALL/?uri=celex%3A32009L0128 (accessed on 19 April 2021).
  42. Best Management Practices to Reduce Spray Drift. Available online: http://www.topps-life.org/uploads/8/0/0/3/8003583/ansicht_drift_book_englisch.pdf (accessed on 3 June 2021).
  43. Decision No. 135/12.03.2019 for the Approval of National Action Plan Regarding Reduction of Risks Associated with the Use of Plant Protection Products. Available online: https://www.madr.ro/docs/fitosanitar/legislatie-nationala/hotarare-135-2019-plan-nat-diminuare-riscuri-prod-protectie-plate.pdf (accessed on 19 April 2021).
  44. Gil, E. Inspection of Sprayers in Use: A European Sustainable Strategy to Reduce Pesticide Use in Fruit Crops. Appl. Eng. Agric. 2007, 23, 49–56. [Google Scholar] [CrossRef]
Figure 1. Lechler ITR nozzle 80-015, with dimensions and component parts used in the present research: (a) outside view of the nozzle; (b) longitudinal section showing the structural inner design; (c) schematic representation of parts and principle of functioning, reprinted with permission from ref. [23]. Copyright Year 2021, Owner’s Name—Lechler -Agri.
Sustainability 13 07780 g001
Figure 2. Positioning water sensitive paper in the vineyard: (a) before and (b) after treatment.
Sustainability 13 07780 g002
Figure 3. Water-sensitive paper with varying degrees of coverage (a) low, (b) average, (c) high.
Sustainability 13 07780 g003
Figure 4. Dynamic of DV 1 at: (a) different pressure levels (1 = 3 bar, 2 = 5 bar, 3 = 7 bar, 4 = 9 bar) and (b) at different heights from the ground (1 = 0.8 m, 2 = 1.5 m, 3 = 2.5 m).
Sustainability 13 07780 g004
Figure 5. Dynamic of DV 5 at (a) different pressure levels (1 = 3 bar, 2 = 5 bar, 3 = 7 bar, 4 = 9 bar) and (b) at different heights from the ground (1 = 0.8 m, 2 = 1.5 m, 3 = 2.5 m).
Sustainability 13 07780 g005
Figure 6. Dynamic of DV 9 at: (a) different pressure levels (1 = 3 bar, 2 = 5 bar, 3 = 7 bar, 4 = 9 bar) and (b) at different heights from the ground (1 = 0.8 m, 2 = 1.5 m, 3 = 2.5 m).
Sustainability 13 07780 g006
Figure 7. Spraying coverage degree (%) at: (a) different pressure levels (1 = 3 bar, 2 = 5 bar, 3 = 7 bar, 4 = 9 bar) and (b) at different heights from the ground (1 = 0.8 m, 2 = 1.5 m, 3 = 2.5 m).
Sustainability 13 07780 g007
Table 1. Influence of pressure on droplets size and coverage during spraying.
VariablesPressure3 bar5 bar7 bar9 barAverage
DV 13 bar-p = 0.714006p = 0.506333p = 0.338471244.65 μm
5 barp = 0.714006-p = 0.796744p = 0.582995231.72 μm
7 barp = 0.506333p = 0.796744-p = 0.757739221.17 μm
9 barp = 0.338471p = 0.582995p = 0.757739-207.67 μm
DV 53 bar-p = 0.136953p = 0.621155p = 0.950223533.18 μm
5 barp = 0.136953-p = 0.088728p = 0.20898640.71 μm
7 barp = 0.621155p = 0.088728-p = 0.731031497.66 μm
9 barp = 0.950223p = 0.20898p = 0.731031-528.29 μm
DV 93 bar-p = 0.145618p = 0.533702p = 0.909157825.06 μm
5 barp = 0.145618-p = 0.074665p = 0.2815661003.50 μm
7 barp = 0.533702p = 0.074665-p = 0.546975749.16 μm
9 barp = 0.909157p = 0.281566p = 0.546975-840.24 μm
Coverage degree3 bar-p = 0.176285p = 0.780247p = 0.45860550.982%
5 barp = 0.176285-p = 0.160181p = 0.65802560.457%
7 barp = 0.780247p = 0.160181-p = 0.38065449.038%
9 barp = 0.458605p = 0.658025p = 0.380654-56.630%
Least significant difference (LSD) pairwise tests comparing volumetric median diameter or coverage of sprayed droplets at different pressures (3–9 bar).
Table 2. Influence of height from the ground on droplets size and coverage during spraying.
VariablesPositionLower PartMiddle PartUpper PartAverage
DV 1Lower part-p = 0.133562p = 0.002969 **278.94 μm
Middle partp = 0.133562-p = 0.100652232.96 μm
Upper partp = 0.002969 **p = 0.100652-183.05 μm
DV 5Lower part-p = 0.217061p = 0.041396 *561.56 μm
Middle partp = 0.217061-p = 0.000985 ***638.48 μm
Upper partp = 0.041396 *p = 0.000985 ***-429.33 μm
DV 9Lower part-p = 0.095264p = 0.060166849.99 μm
Middle partp = 0.095264-p = 0.000398 ***1025.40 μm
Upper partp = 0.060166p = 0.000398 ***-645.51 μm
Coverage degreeLower part-p = 0.182296p = 0.01369755.447%
Middle partp = 0.182296-p = 0.00014463.306%
Upper partp = 0.013697p = 0.000144-40.257%
Least significant difference (LSD) pairwise tests comparing volumetric median diameter or coverage of sprayed droplets at different heights from the ground (0.8–2.5 m) * -significant, ** -distinctly significant, *** -very significant.
Publisher’s Note: MDPI stays neutral with regard to jurisdictional claims in published maps and institutional affiliations.

