Article

Analysis of the Impact of Soil Compaction on the Environment and Agricultural Economic Losses in Lithuania and Ukraine

by
Andrii Zabrodskyi
1,*,
Egidijus Šarauskis
1,
Savelii Kukharets
2,
Antanas Juostas
1,
Gediminas Vasiliauskas
1 and
Albinas Andriušis
3
1
Agriculture Academy, Institute of Agricultural Engineering and Safety, Vytautas Magnus University, 44248 Kaunas, Lithuania
2
Department of Mechanical and Engineering Agroecosystems, Polissia National University, 10002 Zhytomyr, Ukraine
3
Agriculture Academy, Institute of Power and Transport Machinery Engineering, Vytautas Magnus University, 44248 Kaunas, Lithuania
*
Author to whom correspondence should be addressed.
Sustainability 2021, 13(14), 7762; https://doi.org/10.3390/su13147762
Submission received: 11 June 2021 / Revised: 6 July 2021 / Accepted: 7 July 2021 / Published: 12 July 2021

Abstract

:
Soil compaction (SC) is one of the most damaging degradation processes. The effects of compaction are closely related to crop losses and GHG emissions due to additional fuel use. It is therefore important not only to correctly monitor the condition of the soil and the restoration of damaged soil but also to understand the costs of excessive exploitation of soil and individual risks in different countries and continents. A model of equations has been developed to assess the effects of compaction that can be used on a national or even single farm scale. However, for its further application, more data should be collected. Based on the data available in the public domain, the damage caused by compaction was compared between Ukrainian (UA) and Lithuanian (LT) scenarios as these countries have a similar situation but different levels of soil resource management. Soil characteristics, such as soil types and predisposition to compaction, depending on its type, were assessed in both countries. The main parameters used to estimate the damage due to SC were: yield loss; additional fuel consumption; losses of N, P, K fertilizers, water pollution, and flooding; erosion; and GHG emissions. The results reveal potential annual losses due to compaction of around EUR 27 million for Lithuania and around EUR 1.6 billion for Ukraine. Expected potential average losses per hectare of arable land are about EUR 49 ha−1 y−1 for Ukraine (33.9 million ha or 56.76% of the total area) and about EUR 13 ha−1 y−1 for Lithuania (2.11 million ha or 33.77%). Potential crop losses are one of the costliest consequences of compaction. They could cost about EUR 1 billion annually for Ukraine and about EUR 10.7 million for Lithuania. Moreover, the additional use of fuel and the associated GHG emissions can probably take away EUR 180 million (UA) and about EUR 4 million (LT) each year.

1. Introduction

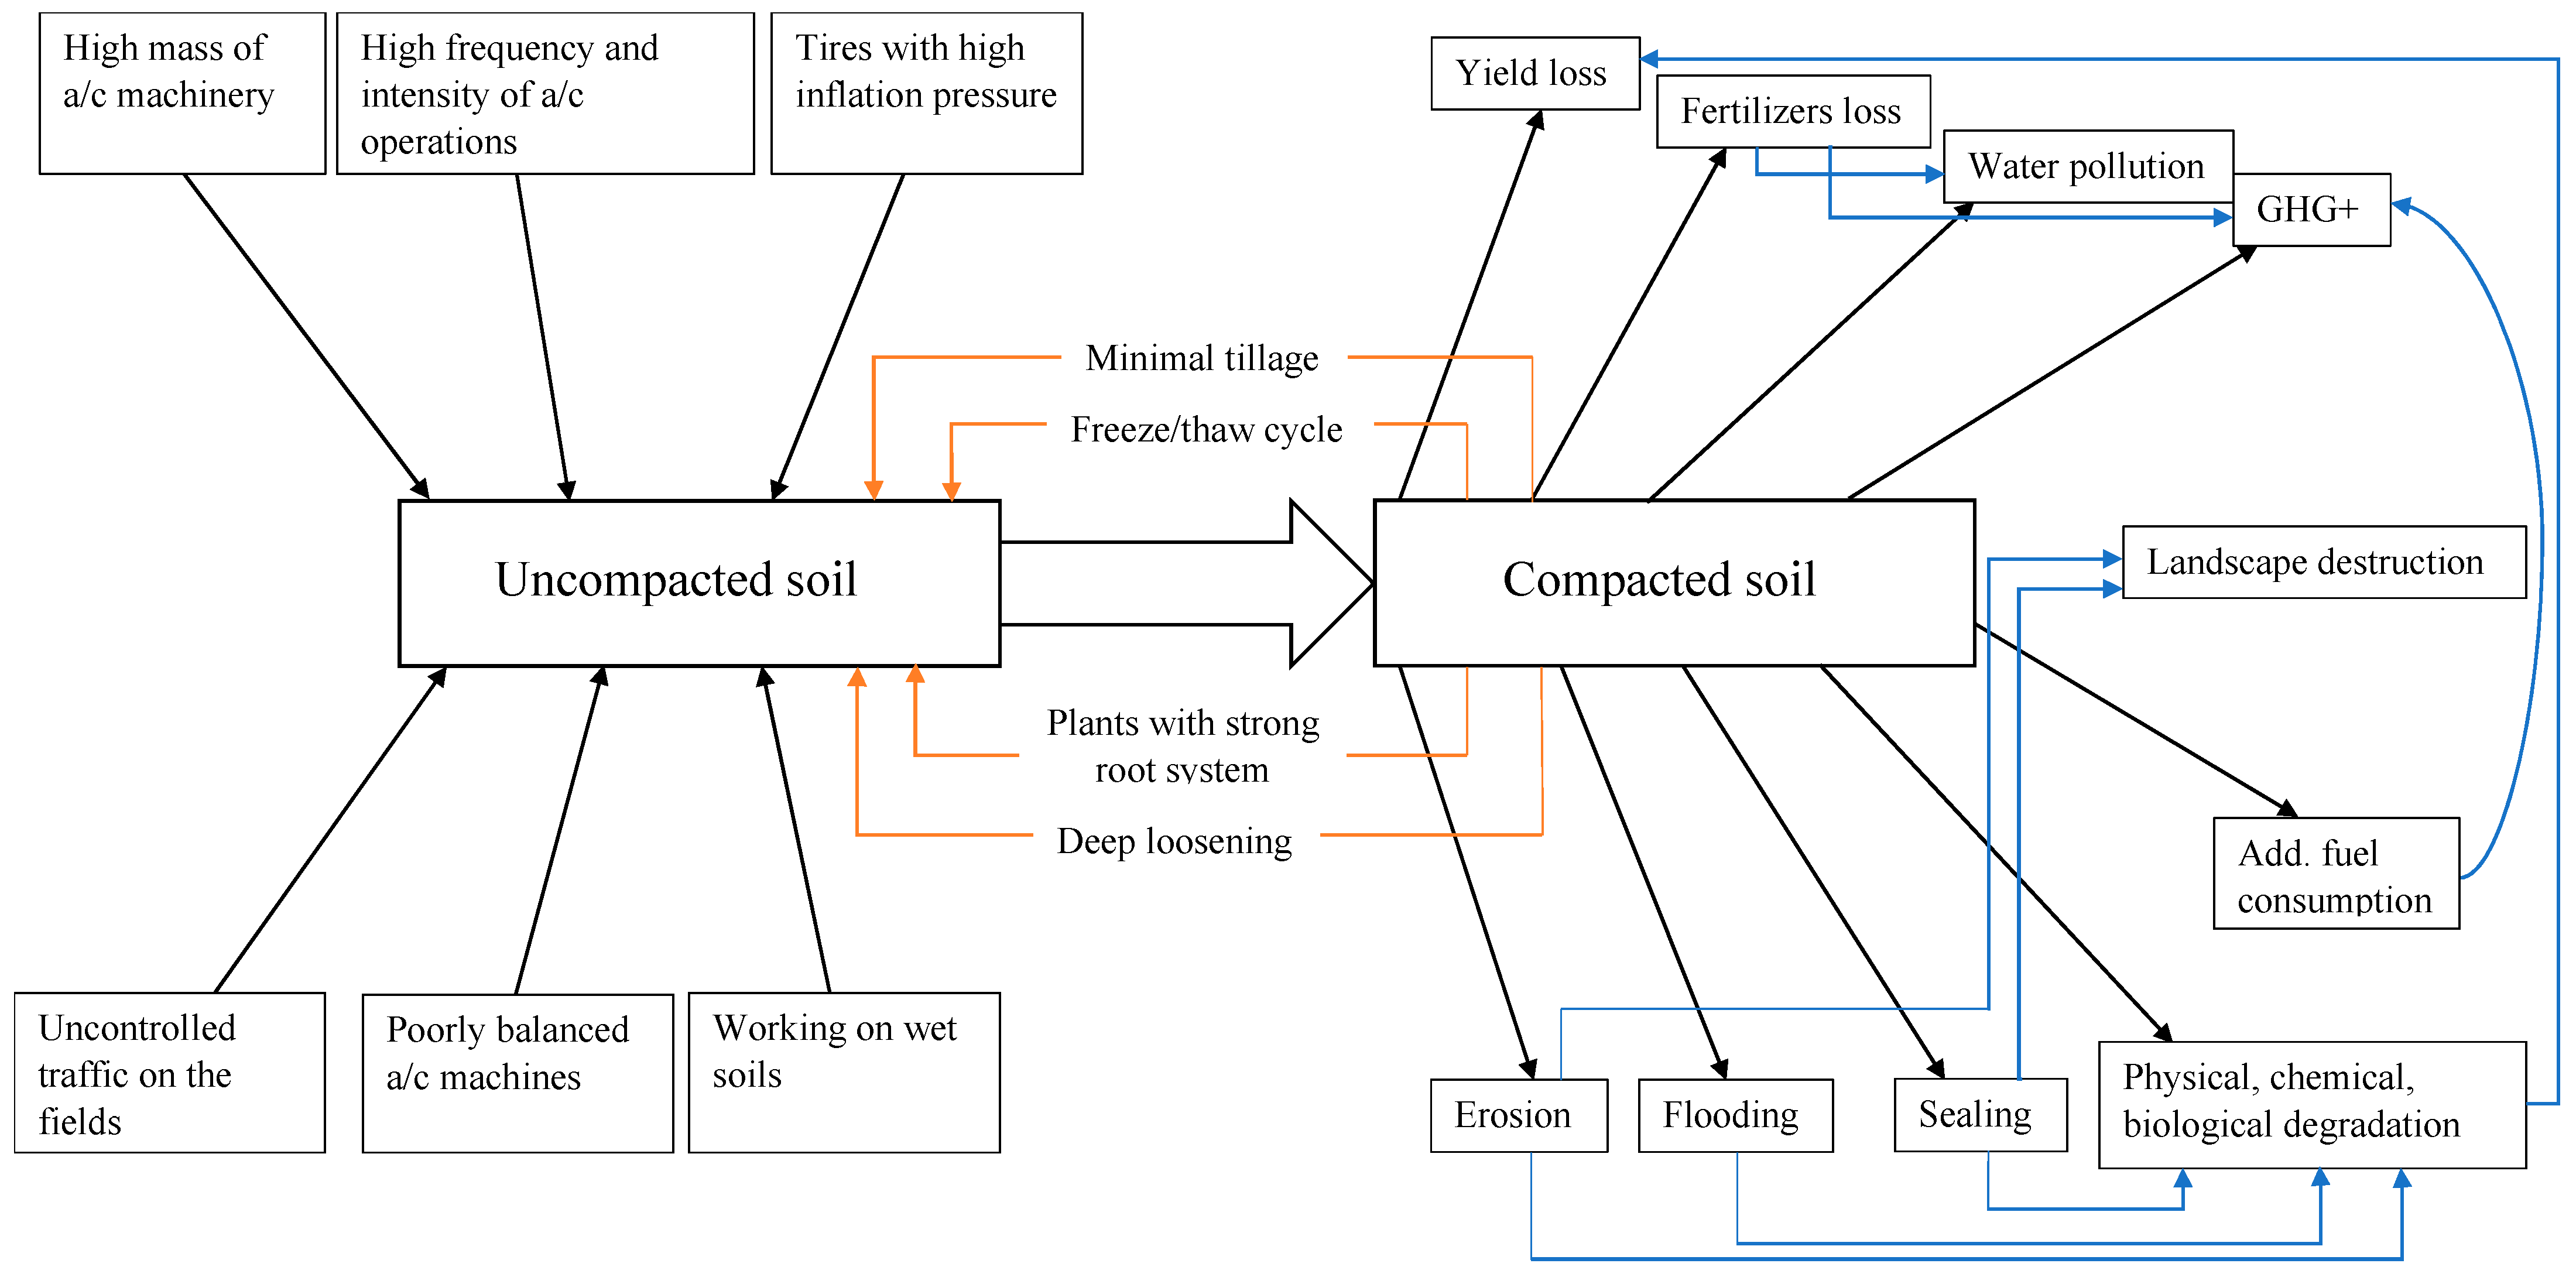
1.1. Awareness of the Damage from Soil Compaction

According to Pravalie et al. [1], there are 1,497,907.8 km2 of agricultural soil in Europe. This represents 20% of the total European area and 13.8% of the total agricultural area (14,234,399.4 km2). Given that 99% of food is produced on land and only 1% in aquatic systems [2], together with an increase in the world’s population to 9 billion (or even more) by 2050 (the UN), it can be concluded that soil safety is the key to food security. It is therefore necessary to increase the global land capability, and for this, the decrease in soil quality should be controlled. In addition, the formation of fertile soil is a very long process, based on various estimates, taking several thousand years. Specific conditions are needed for soil formation as well [3]. This leads to the conclusion that soil is not a renewable resource, and it is strategically just and economically profitable to maintain soil productivity. For example, Sartori et al. [4] reported that 24% (3.4 million km2) of soil worldwide suffers from severe erosion since severe erosion is considered when soil losses are more than 11 t ha−1 y−1. Thus, the losses of soil in heavily eroded lands around the world are 3.74 million t y−1. Crop productivity and production losses in England and Wales are GBP 161.67 million per year [5]. Given that the area of soil at risk of compaction is 3,858,670 ha, the direct costs of crop losses per hectare would be GBP 41.89 and the total annual damage per hectare would be GBP 121.9599 (EUR 142.4). This is just an aspect, albeit quite significant, of the economic losses due to compaction. Very high losses are also associated with additional fuel consumption, additional fertilizers, pesticides, herbicides, insecticides, fungicides, and so on. Compaction may reduce the ability of the soil to filter out various substances that result from the decomposition of pesticides and other chemicals applied, and the microbial decomposition of pesticides may also be reduced [6]. Leaching of pesticides into ground water was established as a serious menace to water quality in some areas already in the last century [7]. Cultivation of already compacted soil requires more energy [8,9,10,11], and restoring compacted soil is very difficult [12]. In addition, compacted soil has several negative effects on the environment [6]:
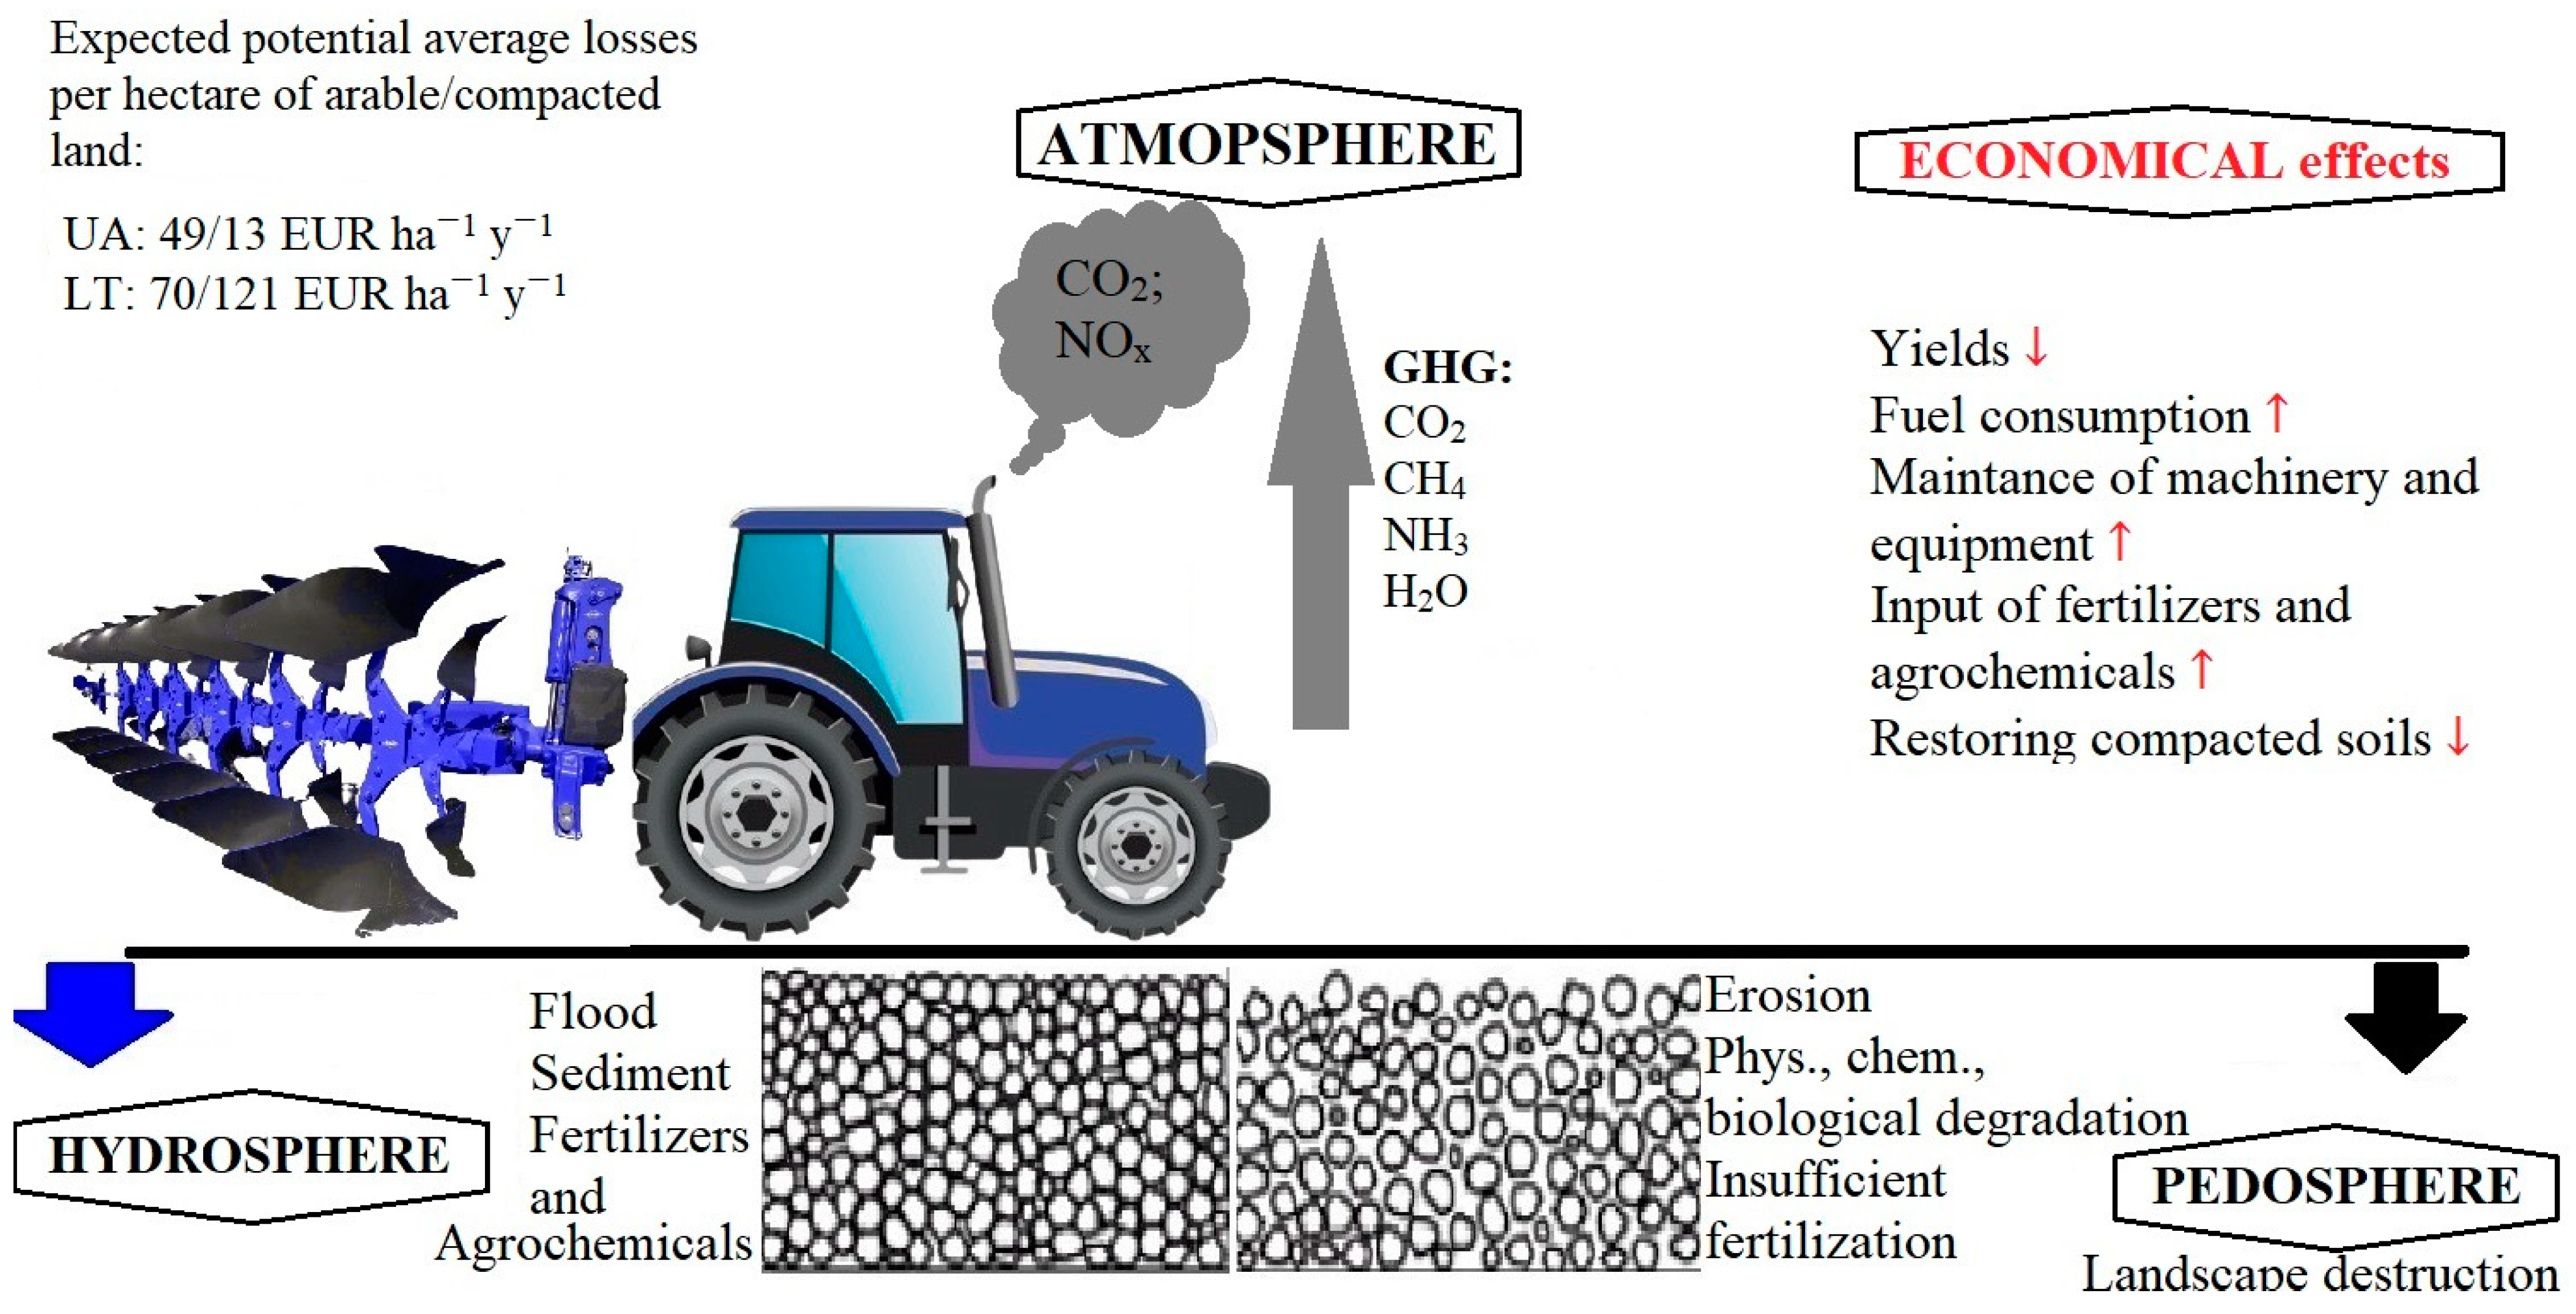
  • Additional greenhouse gas emissions due to a longer time of soil cultivation and other technological operations (CO2, NH3, CH4, NOx);
  • Possibility for pesticides, herbicides, insecticides, fungicides, and fertilizers getting into ground and surface waters;
  • Increased likelihood of erosion and various types of soil degradation, sometimes even landscape destruction.
When considering the damage from compaction, attention should be paid to the soil cultivation system, particularly, growing peculiarities of different crops. The novelty of this study lies in the developed model in the form of an equation for calculating the potential damage due to compaction. There is only very poor information on the potential costs of damage due to soil compaction, especially for Ukraine, although, for example, FAO speaks about very significant potential losses due to soil degradation. Moreover, soil is, without exaggeration, a strategic resource, and taking into account the UN forecasts that the population of the Earth will be about 9.5 billion people by 2050, soil preservation and restoration of degraded soil are a guarantee of human food security.

1.2. Potential Costs of Damage from Soil Compaction

Despite the importance of this topic, since compaction can lead to significant economic costs [5], there are only a few studies on the potential costs due to soil compaction damage. This may be due to the fact that some of the damage is difficult to quantify [13,14]. It is estimated that up to 45% of agricultural soil is subject to compaction [14,15]. According to [5], a very high proportion of the cost of compaction damage is indirect. For example, soil compaction can increase the frequency and severity of floods [13], cause erosion [16], or increase greenhouse gas emissions [17]. Figure 1 shows the main causes and effects of soil compaction. Some possible methods of soil restoration are also presented. Among the most significant causes of soil compaction are an increase in the weight of agricultural machines [18], high inflationary pressures [19,20,21], and uncontrolled traffic of agricultural machinery [22,23]. The use of rubber tracks or tandem wheels can reduce the risks of compaction [19]. In addition, almost any agricultural wheeled equipment can be retrofitted to rubber tracks [24] or retrofitted with additional wheels, not to mention the fact that all major manufacturers today already provide out-of-the-box samples of such equipment. However, with regard to four and six wheels on the axle, it is necessary to assess the cost-effectiveness of such technique for a particular farm, as the dimensions of the equipment increase significantly and the technical characteristics, in particular the turning angle, change. Moving on public roads can cause many difficulties. In addition, according to [25,26], a tillage system is very important and may pose higher risks of soil compaction, but minimal tillage can be a good addition to the restoration of compacted soil. In addition, velocity of agricultural machinery and its repeated passes in the same places in the fields have a significant effect on compaction [27], and even the tire tread pattern can be a significant component of compaction [28]. As reported in [29], strengthening the plant root system will not only reduce direct crop losses but will also be a key factor in restoring compacted soil. Deep soil loosening has a positive economic effect as well [30], but, at the same time, loosening requires significant initial costs. It is also very important to keep organic matter in the soil. Organic matter is, mostly, organic carbon, which plays an important role in retaining moisture in the soil, ensuring erosion resistance, soil fertility, and biodiversity. Four out of a thousand initiatives report that even small changes in carbon count can have far-reaching consequences for GHG balance and agricultural productivity [31].
Soil erosion is one of the most common forms of soil degradation. Erosion not only results in the losses of soil with fertilizers and makes the soil less fertile but also increases GHG emissions [32]. According to the data of [33], erosion has affected 17% of Ukraine’s arable soil. Annual soil losses due to erosion can vary from 2.7 t ha−1 y−1 to 7.7 t ha−1 y−1 in some regions of Ukraine [34]. The situation is underestimated as large agricultural corporations do not always use the soil properly. In agricultural areas, nutrients and N, P, K are lost along with the soil, which has a detrimental effect on soil productivity, especially the yield. Since soil prices are difficult to determine accurately, estimates of erosion damage vary.
According to the data provided by the Organization for Economic Co-operation and Development (OECD) [35], today agriculture is responsible for at least 14% of global greenhouse gas emissions. Global agricultural activity is increasing emissions faster than transport and is approaching industry figures. It should also be borne in mind that a large share of agricultural products is transported by trucks, planes, and trains, delaying its impact on agriculture. In the case of soil compaction, additional treatment, both seasonal and renewable, is required, increasing the number of machineries in the fields as well as the operating time of the internal combustion engines, which in turn leads to higher GHG emissions. According to the OECD, in 2018, agricultural GHG emissions in Lithuania amounted to 4280.66 thousand tonnes of CO2eq, in the UK, 41,821.19 thousand tonnes of CO2eq, in Sweden, 6885.93 thousand tonnes of CO2eq, and in Ukraine, 98 million tonnes of CO2eq, which is 29% of all GHG emissions in Ukraine (M. Shlapak from the TNA project during the V International Congress “Organic Ukraine 2021”). A big share of these emissions is related to soil degradation, including compaction. Losses of fertilizers entail an increase in their artificial application, which increases GHG emissions. Moreover, partially lost fertilizers can become autonomous GHG agents.

1.3. Potential SC Damage to the Environment

The environmental damage caused by the soil compaction can be conveniently evaluated as a sum of the damage caused to the individual environmental components involved:
  • Damage to the atmosphere (additional GHG emissions and their additional formation related to the losses of fertilizers);
  • Damage to the hydrosphere (pollution of surface and ground waters, entry of substances from fertilizers, pesticides, and other agrochemicals; increased risk of floods, etc.);
  • Damage to the pedosphere (erosion, physical, chemical, and biological soil degradation, soil sealing, landscape destruction);
  • Damage to the biosphere (losses of biodiversity).
This study aimed to assess the consequences of soil compaction, in particular potential damage to the environment (including the biosphere, pedosphere, hydrosphere, and atmosphere), lack of harvest, and wasteful use of soil resources, and tried to estimate the costs of such damage as accurately as possible. The objective of this study was to provide a model for a quantitative approach to economic and environmental costs associated with soil compaction. For this, an algorithm was developed that, taking pre-existing models as a reference, incorporates agronomic, economic, and environmental parameters. The presented model provides an objective basis for a correct assessment of the environmental risks of soil compaction, based on the fact that such risks are generally underestimated.

2. Materials and Methods

Assessing the damage due to soil compaction is not a simple task. It may be less difficult to calculate the yield losses (comparing the field with the same or close soil type and climate conditions, tillage system, crop rotation, etc., with and without compaction), additional fuel consumption, and fertilization. However, assessing the consequences of compaction, such as water and air pollution, as well as biodiversity loss and chemical and physical pollution of the soil, is a much more difficult task. Following the articles by [5] and [19], which are extremely rare examples of economic and environmental assessment of damage due to compaction, an analysis of existing data was carried out to assess the potential environmental damage and economic losses due to soil compaction in Ukraine and Lithuania. These are both agricultural countries with a high crop production index [36]. The climate of these countries is very similar as both are located mostly in the temperate climatic zone. However, Lithuania is characterized by more developed agriculture and an upward trend in agriculture-related research, and Ukraine is lagging behind in this regard. That is why it is interesting to evaluate the results of compaction for these countries as one of the most widespread and destructive impacts on the soil.
According to the World Bank [37], Ukraine has 32,888,000 ha of agricultural area and Lithuania 2,115,000 ha (56.76% and 33.77% of the country’s total land area, respectively). The main soil types in Ukraine are Chernozems, Phaeozems, and Albeluvisols [38] and in Lithuania, Albeluvisols, Luvisols, Cambisols, Arenosols, Podzols, Gleysols, and Histosols [39].
It is first worth assessing the natural susceptibility of the soil to compaction. It is clear that with other conditions, such as temperature, humidity, processing conditions (weight, speed, wheel or track, tire pressure, other machine parameters), traffic intensity of agricultural machinery, and tillage system remaining the same, soil type will be the decisive factor. Consequently, the risk of compaction and the economic damage from it will be higher. It is easy to assess the susceptibility of soil to compaction using the map “The natural susceptibility of soil to compaction”, created by [40] for European soil to show the background of soil susceptibility in terms of soil type and texture. Following this map, most European soil has initially low or moderate preconditions for compaction. The relatively insignificant part has very high preconditions for compaction. Ukrainian soil, according to a local source [41], has high or very high preconditions for compaction.
According to [14], in Sweden, 35% (or 140–280 thousand hectares) of arable land is affected by light, moderate, and severe compaction or is located in the areas particularly prone to compaction. In the United Kingdom, according to [5], the area of such soil is 3.86 million hectares, in Ukraine, 23.05 million hectares, and in Lithuania, 222 thousand hectares [42].
If the other conditions are not very different from the UK conditions, additional fuel consumption in compacted soil can be observed (Table 1). Probably the most significant economic losses due to soil compaction are caused by a qualitative and quantitative decrease in yields. According to the report by [43], quantitative yield losses due to compaction can reach 15% and even more, and qualitative losses are very difficult to assess. Some studies have reported yield losses of 2.5–27% [18].
A very interesting indicator is the number of tractors per 100 km2. It allows estimating the minimum greenhouse gas emissions from internal combustion engines. However, unfortunately, the last accurate indicators of this characteristic date back to 2009, for example, 591.51 units for Sweden, 102.69 units for Ukraine, and 631.64 units for Lithuania [37].
Annual revenue losses due to soil compaction are proposed to be calculated using Equation (1). This equation was adapted from [5,46]:
L = k 1 k 2 S cs tN ( o = 1 n c · p 1 + e · p 2 ) + Y y + E p e k e k ec + W p wp K wp + F p fl K fl + F wa p wa K wa + A dd
where L—all losses due to compaction, EUR; k1—coefficient of predisposition to compaction; k2—coefficient of the tillage system; Scs—soil area as a subject of compaction, ha; t—total agricultural machinery working time, h; N—agricultural machinery productivity, ha h−1; o—number of agricultural operations (sowing, fertilizing, harvesting, etc.); c—fuel consumption, L ha−1; p1—fuel price, EUR L−1; e—GHG emission, m3 ha−1; p2—GHG emission price, EUR m−3; Y—the amount of unharvested crop, t ha−1; y—price of crop, EUR t−1; E—area of eroded soil, ha; p e —price of erosion, EUR ha−1; k e —coefficient of soil erosion resistance (depends on climate, relief, human activity, etc.); k ec —part of the erosion due to compaction (if possible to separate); W—water pollution, m3; pwp—price for water purification, EUR m−3; Kwp—part of water pollution due to compaction (if possible to separate); F—fertilizer loss, t; pfl—price of fertilizer loss, EUR t−1; Kfl—part of fertilizer losses due to compaction (if possible to separate); Fwa—fertilizer as water and air pollutant, t; pwa—price of fertilizer pollution, EUR t−1; Kwa—part of air and water pollution by fertilizers due to compaction (if possible to separate); Add—additional costs (for example, flooding, soil restoration, etc.), EUR.
The equation is designed to estimate the annual costs, including crop losses, additional fuel consumption and associated GHG emissions, soil losses due to erosion, surface water pollution, losses of fertilizers and agrochemicals, and so on. The equation consists of the components responsible for these parameters, and if necessary, some of the constituent parts could be excluded or use the result obtained in a different way than that proposed by the equation. Soil area under influence of compaction may vary, with FAO and other similar organizations publishing open statistics from time to time. FAO data were also used in this study [42], and additional sources are indicated in Table 2. Crop losses are the most obvious consequence of compaction. In this study, yield losses were assessed separately based on theoretical data [18], but in the future, it is recommended to collect more information on the physical, chemical, and biological state of the soil over a long time frame in order to maximize the separation of yield losses due to compaction from other factors. It is known that the effect of compaction on yield will be the greatest for clays and the lowest for silts [5]. Graves [5] also reported that the additional fuel consumption on compacted soils was the highest for clays (+87%) and the lowest for peat (+29%). Please see Table 2.
Agricultural fuel consumption depends on many factors: technological operation (planting, harvesting, cultivation, soil preparation, etc.), the weight and power of the tractor or combine harvester, the skills of the operator, and others. For example, for a tractor with a capacity of 60 horsepower, with a rotavator, fuel consumption will be about 7–8 L h−1, with a loaded trailer 5–7 L h−1, and in static mode 6–7 L h−1 (straw harvester). Different tillage systems would have different fuel consumption; for example, conventional tillage requires approximately 59.3 L ha−1, reduced tillage approximately 29.7 L ha−1, and no-tillage 4.3 L ha−1 [47].
The losses of fertilizers N, P, K are significant because they have direct economic losses due to additional fertilization, and some of the lost fertilizers can enter water and air as greenhouse gases. Depending on the area subject to compaction, susceptibility to soil compaction due to soil type and other conditions, the following losses of fertilizers are expected for Ukraine: N 221,208.34 t y−1, P 56.30 t y−1, K 10,456.1 t y−1. The losses for Lithuania are estimated at: N 2130.5 t y−1, P 56.30 t y−1, K 100.7 t y−1 (adapted for the World Bank’s data and [5]).
Indirect damage and, moreover, its costs are much more difficult to correctly and accurately assess than direct damage. Significant indirect water damage is caused by compaction and re-fertilization and pollutants, in particular, fertilizers, entering the water of rivers, lakes, and even reservoirs. Purification of these waters is not cheap. Unfortunately, it is not possible to obtain accurate information on pollution of water resources due to compaction. According to the State Agency of Water Resources of Ukraine, UAH 4.9 billion (almost EUR 135 million) were received to reduce water pollution, improve its environmental status, and meet the needs of the economy for water resources in 2020. Some researchers report that the damage from the aftermath of the floods in Lithuania from 1991 to 2014 did not cost anything [48].
Soil erosion is one of the most destructive processes because the soil simply disappears from the field along with organic matter, humus, fertilizers, and more. Soil erosion is not a new problem; in 1995, it was known that more than 10 billion hectares a year are lost worldwide due to erosion [49]. This problem is very acute for Ukraine, which loses up to 500 million tonnes of soil each year and 24 million tonnes of humus, 0.96 million tonnes of nitrogen, 0.68 million tonnes of phosphorus, and 9.4 million tonnes of potassium along with it. In addition, the annual growth of eroded soil reaches 80–90 thousand hectares [41].
The main indirect costs are pollution of rivers, lakes, and sources of drinking water due to additional input of fertilizers; floods due to complete or partial sealing of the soil; and damage to the atmosphere due to additional greenhouse gas emissions from the use of internal combustion engines in agricultural machinery.
With regard to floods caused by agricultural soil compaction, it is not easy to quantify the damage. However, part of the public expenditure on the prevention and moderation of floods can be considered as the costs of soil compaction if such expenditure is budgeted or calculated as the costs of restoring the flooded soil.

3. Results and Discussion

The potential annual costs of soil compaction are conveniently divided into direct and indirect. Direct losses are those that are lost directly in the fields as a result of agricultural work. These include losses of crops, fertilizers, and additional fuel consumption. Indirect costs occur over time with an accumulation of compaction. They are associated with soil pollution, flooding, erosion, soil sealing, and an increase in GHG emissions. Moreover, additional use of fuel increases the GHG emissions due to the losses of N, P, K. The combined data and calculation results are summarized in Table 3. It reveals the main environmental consequences of compaction. Economic costs are also provided in Figure 2.
Depending on country conditions, agricultural management, availability and quality of soil condition monitoring, its competent and consistent restoration, ability to prevent the risks of degradation, and other country-specific factors, losses may vary greatly at a similar level of compaction. Additional fuel consumption can be estimated as the fuel consumption on compacted soils above the known one. Most of it will be associated with compaction, and it is enough to understand the scale of this effect. However, there is no such data available in the public domain. Therefore, a local upscaling experiment using this idea is planned to be conducted in the future. It is also possible to estimate the losses of crops, fertilizers, and agrochemicals. A study by [5] showed that the consumption of additional diesel fuel on compacted soil is EUR 20.27 million each year. If there were similar conditions in Ukraine, additional diesel consumption would cost about EUR 121 million y−1, and in Lithuania, EUR 1.47 million y−1. However, due to the intensity of agricultural activity, the characteristics of soil types from Ukraine and Lithuania suggest that additional fuel consumption, and, therefore, costs, may be higher, especially for Ukraine. The same applies to direct losses and costs, in particular the losses of yields and fertilizers applied as well as other agrochemicals. Under Ukrainian conditions, yield losses due to compaction can cost about EUR 1 billion per year, under Lithuanian, EUR 11 million per year. The losses of fertilizers and the costs of reapplying them can be very high. The total losses of N, P, K, fertilizers could cost EUR 168.145 million for Ukraine and almost EUR 1.62 million y−1 for Lithuania. The total direct costs are presented in Table 3. Lower costs indicated are for Lithuania (EUR 13.8 million y−1) and higher for Ukraine (EUR 1315.23 million y−1).
Although indirect annual losses appear to be relatively cheaper, this should not be misleading. Especially considering the fact that soil compaction tends to accumulate [51]. According to the European Commission, soil erosion could cost the EU farmers EUR 1.25 billion per year [52]. According to the FAO’s data, soil erosion in Ukraine could cost UAH 20 billion or EUR 59.684 million in crop and agricultural productivity losses per year, compared to previously reported—EUR 8.2 million. Of course, soil erosion in Ukraine is not only a consequence of compaction, but it is a very important factor as well. If we apply the prices of soil erosion in Ukraine for Lithuanian soil, considering the characteristics of Lithuanian soil, the average erosion costs per year would be under EUR 9.18 million.
It should be borne in mind that excessive use of diesel also releases additional greenhouse gases into the atmosphere. According to [5], such emissions could cost the United Kingdom EUR 7.7 million per year (or close to EUR 2 per ha of compacted soil). For Ukraine, this value is expected to be more than EUR 5 ha−1 of compacted soil. Given the area of soil subject to compaction and the general trend towards compaction, these costs could reach up to EUR 45 million per year in Ukraine and close to EUR 2.7 million in Lithuania (extrapolated from [5]).
The costs of greenhouse gases due to increased nitrogen, phosphorus, and potassium losses, according to calculations, would also be higher for Ukraine, EUR 60.8 million, and relatively modest for Lithuania, EUR 3.91 million.
Thus, the average annual losses for Ukraine are about EUR 1.6 billion and for Lithuania, close to EUR 27 million. However, more high-quality research and information are needed to understand the extent of losses and to improve the quality of their assessment.
Recalculating the data from [5] allows concluding that the total compaction damage in the UK is actually estimated at GBP 121.96 ha−1 y−1 or around EUR 158.54 ha−1 y−1 (if taking into account exchange rate fluctuations in 2021, EUR 142.4 ha−1 y−1). Recalculating the losses per unit of area, we can conclude that the average consequences of soil compaction can cost EUR 49.13 ha−1 y−1 for Ukraine and EUR 12.714 ha−1 y−1 for Lithuania. In addition to all of the above, soil compaction tends to accumulate and, at one point, may result in yield and other losses of 50% or more [51]. Data that could not be found in the public domain were obtained by the method of extrapolation and adaptation of existing works [2,5,18,51].
Using open-source data and adapting data from rare case studies on the economic and environmental impact of soil compaction, such as [5], the potential costs of soil compaction were estimated for Ukraine and Lithuania (other sources are presented in Table 2). The main quantitative costs were direct, and the potential damage was mostly caused by the losses of crops, equal to around EUR 1 billion for Ukraine and EUR 10.7 million for Lithuania. These results compare well with the United Kingdom—EUR 187.53 million (GBP 161.67 million). Additional fuel consumption and losses of fertilizers are very close for Lithuania, EUR 1.47 million and EUR 1.52, respectively, while for Ukraine the losses of fertilizers are more than EUR 30 million higher than the probable additional fuel consumption on compacted soils and equal to EUR 157.22 million.
Indirect costs are much more difficult to estimate, but according to the available information for Ukraine and Lithuania, they are less direct. The most significant were water pollution, erosion, and GHG emissions. These losses were compared with the UK losses, reported by Graves [5] (Figure 3).
GHG emissions are very important for environmental damage. Given the danger of global warming and the share of agricultural GHG emissions of more than 14% [35] or 6.2 Gt CO2eq, it is worth paying special attention to this. It seems possible to reduce this value by more than half. The main sources of agricultural GHG emissions from crops are rice cultivation, direct emissions from agricultural soil, manure management, and on-field burning of crop residues, as well as some indirect sources such as manufacturing of fertilizers, pesticides, herbicides, etc. [53]. Therefore, the development and use of technologies and tillage methods that will help to minimize GHG emissions is important in order to reduce the risks of global warming as well as direct and indirect losses of farmers. Nowadays, this technology is low-carbon production.
In order to reduce carbon emissions in the cropping segment of the agricultural sector, it is recommended to strive for precise, well-organized farming and minimum tillage where possible in order to minimize the use of agricultural machines with internal combustion engines. Despite high direct emissions from soil, it is not worth re-compacting to reduce this effect. The role of manure and the production of fertilizers and agrochemicals in GHG emissions should not be forgotten. In addition, the management of agricultural production should be structured in such a way that plant residues would not be burned.
In general, correct, well-organized, low-carbon farming globally and locally is critical to reduce the risks of global warming (within the agricultural sector).
Soil compaction has far-reaching consequences that affect everyone on earth. First of all, it is an increase in the risks of global warming and, of course, a decrease in yields. The average person may not directly change the state of affairs much, but they can spread information about the dangers of compaction, as well as take into account the aspect of soil safety in political decision making.

4. Conclusions

Despite the strong focus of researchers and world-renowned organizations, soil compaction remains a very important and significant segment of crop losses and subsequent soil degradation. However, in spite of numerous studies on the effects of soil compaction, there are very few studies on the economic losses due to compaction and its consequences: it is exceptionally difficult to separate losses associated with harvesting from total losses, be it crop losses, GHG emissions, additional fuel consumption, or others. Lack of information also plays an important role in this task. The costs for the analysed countries differ significantly, since Lithuania and Ukraine have different types of soil and area of agricultural soil, in particular cultivated soil. As a result, the losses for Ukraine are greater, even per unit of area. In addition, land policy in Ukraine often leads to irrational use of soil, and little research is designated for the consequences of degradation, while the damage has a tendency to increase.
A model was developed to estimate the potential annual damage due to soil compaction in the form of Equation (1). However, due to lack of information, it was only used partially in this study for some components. Data were obtained from open sources and databases of organizations, such as the FAO and the UN, as well as the World Bank.
Analysis of the available data resulted in a possibility to describe the potential annual losses: for Ukraine, about EUR 1.6 billion; for Lithuania, about EUR 30 million. In terms of possible losses on arable soil and compacted soil, Ukraine may have about EUR 49 ha−1 y−1 and EUR 70 ha−1 y−1, respectively, and Lithuania about EUR 12 ha−1 y−1 and about EUR 120 ha−1 y−1. The most significant economic impact was the loss of the crop, which could cost Ukraine about EUR 1 billion and Lithuania about EUR 11 million each year. According to the parameters considered, the costs of environmental pollution for Ukraine may exceed EUR 100 million per year, and for Lithuania, the number is more modest at about EUR 6 million. Soil erosion in the current trend will probably cost Lithuania about EUR 9 million euros per year, and Ukraine more than EUR 59 million. However, these figures are not final since many parameters are extremely difficult to estimate accurately and correctly. In addition, the loss of soil organic matter, the loss of soil biota, the possibility of soil sealing, and other circumstances were not taken into account as data on the potential costs of these processes are extremely poor. Development and improvement of currently existing models, such as the equation model presented in this study, is a huge step to reduce soil compaction. Due to lack of data, this model was only partially used, but in the future, it could serve for better analysis and calculation of potential losses due to compaction.

Author Contributions

Conceptualization, E.Š. and A.Z.; methodology, A.Z. and G.V.; software, A.A.; validation, S.K., A.J. and A.A.; formal analysis, G.V. and S.K.; investigation, A.Z., A.J. and S.K.; writing—original draft preparation, A.Z., E.Š., S.K., A.J., G.V. and A.A.; writing—review and editing, A.Z., A.A., E.Š. and G.V.; visualization, A.J. and S.K.; supervision, E.Š. All authors have read and agreed to the published version of the manuscript.

Funding

This research received no external funding.

Institutional Review Board Statement

Not applicable.

Informed Consent Statement

Not applicable.

Data Availability Statement

The data presented in this study are available on request from the corresponding author.

Conflicts of Interest

The authors declare no conflict of interest.

References

  1. Prăvălie, R.; Patriche, C.; Borrelli, P.; Panagos, P.; Roșca, B.; Dumitraşcu, M.; Bandoc, G. Arable lands under the pressure of multiple land degradation processes. A global perspective. Environ. Res. 2021, 194, 110697. [Google Scholar] [CrossRef]
  2. Pimentel, D. Soil erosion: A food and environmental threat. Environ. Dev. Sustain. 2006, 8, 119–137. [Google Scholar] [CrossRef]
  3. Jenny, H. Factors of Soil Formation: A System of Quantitative Pedology; Courier Corporation: Chelmsford, MA, USA, 1994. [Google Scholar]
  4. Sartori, M.; Philippidis, G.; Ferrari, E.; Borrelli, P.; Lugato, E.; Montanarella, L.; Panagos, P. A linkage between the biophysical and the economic: Assessing the global market impacts of soil erosion. Land Use Policy 2019, 86, 299–312. [Google Scholar] [CrossRef]
  5. Graves, A.R.; Morris, J.; Deeks, L.K.; Rickson, R.J.; Kibblewhite, M.G.; Harris, J.A.; Farewell, T.S.; Truckle, I. The total costs of soil degradation in England and Wales. Ecol. Econ. 2015, 119, 399–413. [Google Scholar] [CrossRef]
  6. Soane, B.D.; Van Ouwerkerk, C. Implications of soil compaction in crop production for the quality of the environment. Soil. Tillage Res. 1995, 35, 5–22. [Google Scholar] [CrossRef]
  7. Conway, G.R.; Pretty, G.N. Unwelcome Harvest. Agriculture and Pollution; Earthscan Publication Ltd.: London, UK, 1991; pp. 22–23. [Google Scholar]
  8. McPhee, J.E.; Braunack, M.V.; Garside, A.L.; Reid, D.J.; Hilton, D.J. Controlled traffic for irrigated double cropping in a semiarid tropical environment: Part 2, Tillage operations and energy use. J. Agric. Eng. Res. 1995, 60, 183–189. [Google Scholar] [CrossRef]
  9. Kroulík, M.; Kvíz, Z.; Kumhála, F.; Hůla, J.; Loch, T. Procedures of soil farming allowing reduction of compaction. Precis. Agric. 2011, 12, 317–333. [Google Scholar] [CrossRef]
  10. Li, H.; Gao, H.; Chen, J.; Li, W.; Li, R. Study on controlled traffic with conservative tillage. Trans. Chin. Soc. Agric. Eng. 2000, 16, 73–77. [Google Scholar]
  11. Nannen, V.; Bover, D.; Zöbel, D.; McKenzie, B.M.; Avraham, M.B. UTOPUS: A Novel Traction Mechanism to Minimize Soil Compaction and Reduce Energy Consumption. In Proceedings of the 8th ISTVS Conference, Detroit, MI, USA, 12–14 September 2016. [Google Scholar]
  12. Batey, T. Soil compaction and soil management—A review. Soil Use Manag. 2009, 25, 335–345. [Google Scholar] [CrossRef]
  13. Alaoui, A.; Rogger, M.; Peth, S.; Blöschl, G. Does soil compaction increase floods? A review. J. Hydrol. 2018, 557, 631–642. [Google Scholar] [CrossRef]
  14. Brus, D.J.; van den Akker, J.J.H. How serious a problem is subsoil compaction in the Netherlands? A survey based on probability sampling. Soil 2018, 4, 37–45. [Google Scholar] [CrossRef] [Green Version]
  15. Schjønning, P.; van den Akker, J.J.H.; Keller, T.; Greve, M.H.; Lamandé, M.; Simojoki, A.; Stettler, M.; Arvidsson, J.; Breuning-Madsen, H. Driver-Pressure-State-Impact-Response (DPSIR) analysis and risk assessment for soil compaction—A European perspective. Adv. Agron. 2015, 133, 183–237. [Google Scholar]
  16. Horn, R.; Fleige, H.; Zimmermann, I.; Peng, X. Soil physical compaction and erosion as a threat to food production and human health. In The Nexus of Soils, Plants, Animals and Human Health; Singh, B.R., McLaughlin, M.J., Brevik, E.C., Eds.; Schweizerbart Science Publisher: Stuttgart, Germany, 2017; pp. 42–49. ISBN 978-3-510-65417-8. [Google Scholar]
  17. Ball, B.C. Soil structure and greenhouse gas emissions: A synthesis of 20 years of experimentation. Eur. J. Soil Sci. 2013, 64, 357–373. [Google Scholar] [CrossRef]
  18. Keller, T.; Sandin, M.; Colombi, T.; Horn, R.; Or, D. Historical increase in agricultural machinery weights enhanced soil stress levels and adversely affected soil functioning. Soil Tillage Res. 2019, 194, 104293. [Google Scholar] [CrossRef]
  19. Keller, T.; Arvidsson, J. Technical solutions to reduce the risk of subsoil compaction: Effects of dual wheels, tandem wheels and tyre inflation pressure on stress propagation in soil. Soil Tillage Res. 2004, 79, 191–205. [Google Scholar] [CrossRef]
  20. Lamandé, M.; Schjønning, P. Transmission of vertical stress in a real soil profile. Part II: Effect of tyre size, inflation pressure and wheel load. Soil Tillage Res. 2011, 114, 71–77. [Google Scholar] [CrossRef]
  21. Arvidsson, J.; Keller, T. Soil stress as affected by wheel load and tyre inflation pressure. Soil Tillage Res. 2007, 96, 284–291. [Google Scholar] [CrossRef]
  22. Bennett, J.M.; Roberton, S.D.; Jensen, T.A.; Antille, D.L.; Hall, J.A. comparative study of conventional and controlled traffic in irrigated cotton: I. Heavy machinery impact on the soil resource. Soil Tillage Res. 2017, 168, 143–154. [Google Scholar] [CrossRef]
  23. Pulido-Moncada, M.; Munkholm, L.J.; Schjønning, P. Wheel load, repeated wheeling, and traction effects on subsoil compaction. Soil Tillage Res. 2019, 186, 300–309. [Google Scholar] [CrossRef]
  24. Arvidsson, J.; Westlin, H.; Keller, T.; Gilbertsson, M. Rubber track systems for conventional tractors–Effects on soil compaction and traction. Soil Tillage Res. 2011, 117, 103–109. [Google Scholar] [CrossRef]
  25. Filipovic, D.; Husnjak, S.; Kosutic, S.; Gospodaric, Z. Effects of tillage systems on compaction and crop yield of Albic Luvisol in Croatia. J. Terramech. 2006, 43, 177–189. [Google Scholar] [CrossRef]
  26. Biberdzic, M.; Barac, S.; Lalevic, D.; Djikic, A.; Prodanovic, D.; Rajicic, V. Influence of soil tillage system on soil compaction and winter wheat yield. Chil. J. Agric. Res. 2020, 80, 80–89. [Google Scholar] [CrossRef]
  27. Taghavifar, H.; Mardani, A. Effect of velocity, wheel load and multipass on soil compaction. J. Saudi Soc. Agric. Sci. 2014, 13, 57–66. [Google Scholar] [CrossRef] [Green Version]
  28. Barbosa, L.A.; Magalhães, P.S. Tire tread pattern design trigger on the stress distribution over rigid surfaces and soil compaction. J. Terramech. 2015, 58, 27–38. [Google Scholar] [CrossRef]
  29. Colombi, T.; Keller, T. Developing strategies to recover crop productivity after soil compaction—A plant eco-physiological perspective. Soil Tillage Res. 2019, 191, 156–161. [Google Scholar] [CrossRef]
  30. Chamen, W.C.T.; Moxey, A.P.; Towers, W.; Balana, B.; Hallett, P.D. Mitigating arable soil compaction: A review and analysis of available cost and benefit data. Soil Tillage Res. 2015, 146, 10–25. [Google Scholar] [CrossRef]
  31. 4 in 1000 Initiative. Available online: https://www.4p1000.org (accessed on 22 June 2021).
  32. Lal, R. Soil erosion and the global carbon budget. Environ. Int. 2003, 29, 437–450. [Google Scholar] [CrossRef]
  33. Medvediev, V.M.; Titenko, H.V. The latest materials on the state of the soil cover of European countries and Ukraine. Visnyk Kharkivskoho Natsionalnoho Universytetu «Ekology» 2017, 16, 9–17. (In Ukrainian) [Google Scholar]
  34. Bulyhin, S.Y.; Antoniuk, D. Soil erosion in Ukraine. Crop Soil Sci. 2016, 235, 143–151. (In Ukrainian) [Google Scholar]
  35. The World Bank. Available online: https://stats.oecd.org/Index.aspx?DataSetCode=AIR_GHG# (accessed on 15 May 2021).
  36. The World Bank. Available online: https://data.worldbank.org/indicator/AG.PRD.CROP.XD?locations=UA-LT&view=chart (accessed on 22 June 2021).
  37. The World Bank. Available online: https://data.worldbank.org/indicator/AG.LND.ARBL.HA?end=2018&locations=LT-UA-SE-GB&start=1991 (accessed on 15 May 2021).
  38. Fileccia, T.; Guadagni, M.; Hovhera, V.; Bernoux, M. Ukraine: Soil Fertility to Strengthen Climate Resilience; World Bank Group: Bretton Woods, NH, USA, 2014. [Google Scholar]
  39. Buivydaite, V.V. Soil survey and available soil data in Lithuania. In Soil Resources of Europe, 2nd ed.; European Soil Bureau Report; European Soil Bureau Institute for Environment & Sustainability JRC: Ispra, Italy, 2005; Volume 9, pp. 211–233. [Google Scholar]
  40. European Commission. Available online: https://esdac.jrc.ec.europa.eu/content/natural-susceptibility-soil-compaction-europe (accessed on 15 May 2021).
  41. Baliuk, S.A.; Medvediev, V.V.; Miroshnychenko, M.M.; Skrylnyk, Y.V.; Tymchenko, D.O.; Fatieiev, A.I.; Tsapko, Y.L. Ecological condition of soils of Ukraine. Ukr. Geogr. J. 2012, 2, 38–42. (In Ukrainian) [Google Scholar]
  42. Van Lynden, G.W.J. Soil Degradation in Central and Eastern Europe. The Assessment of the Status of Human-Induced Degradation; FAO Report; International Soil Reference and Information Centre: Wageningen, The Netherlands, 2000; Volume 5. [Google Scholar]
  43. European Environment Agency (EEA). The European Environment—State and Outlook 2020: Knowledge for Transition to a Sustainable Europe; European Environment Agency: København, Denmark, 2019.
  44. Panagos, P.; Ballabio, C.; Lugato, E.; Jones, A.; Borrelli, P. Condition of Agricultural Soils: Factsheet on Soil Erosion; Joint Research Centre: Ispra, Italy, 2017; pp. 15–16. [Google Scholar]
  45. Climate Watch. Available online: https://www.climatewatchdata.org/ghg-emissions?end_year=2018&regions=UKR%2CLTU&sectors=agriculture&source=CAIT&start_year=2013 (accessed on 22 June 2021).
  46. Oskoui, K.E.; Voorhees, W.B. Economic consequences of soil compaction. Trans. ASAE 1991, 34, 2317–2323. [Google Scholar] [CrossRef]
  47. Akbarnia, A.; Farhani, F. Study of fuel consumption in three tillage methods. Res. Agric. Eng. 2014, 60, 142–147. [Google Scholar] [CrossRef] [Green Version]
  48. Raška, P. Flood risk perception in Central-Eastern European members states of the EU: A review. Nat. Hazards 2015, 79, 2163–2179. [Google Scholar] [CrossRef]
  49. Pimental, D.; Harvey, C.; Resosudarmo, P.; Sinclair, K.; Kurz, D.; McNair, M.; Crist, S.; Sphpritz, L.; Fitton, L.; Saffouri, R.; et al. Environmental and economic costs of soil erosion and conservation benefits. Science 1995, 267, 1117–1123. [Google Scholar] [CrossRef] [PubMed] [Green Version]
  50. FAO. Available online: http://www.fao.org/europe/news/detail-news/en/c/1195526/ (accessed on 15 May 2021).
  51. Stoessel, F.; Sondergger, T.; Bayer, P.; Hellweg, S. Assessing the environmental impacts of soil compaction in Life Cycle Assessment. Sci. Total Environ. 2018, 630, 913–921. [Google Scholar] [CrossRef] [PubMed]
  52. European Commission. Available online: https://ec.europa.eu/jrc/en/news/soil-erosion-costs-european-farmers-125-billion-year (accessed on 15 May 2021).
  53. Pathak, H.; Aggarwal, P. Low Carbon Technologies for Agriculture: A Study on Rice and Wheat Production Systems in the Indo-Gangetic Plains; Indian Agricultural Research Institute: New Delhi, India, 2012; pp. 59–65. [Google Scholar]
Figure 1. Causes and effects of soil compaction.
Sustainability 13 07762 g001
Figure 2. Environmental and economic costs of compaction (↑—increased; ↓—decreased).
Sustainability 13 07762 g002
Figure 3. Comparison of annual potential losses for different countries (UK—yellow line, UA—green, LT—blue).
Sustainability 13 07762 g003
Table 1. Short characteristics of countries.
CountryUkraine (UA)Lithuania (LT)
Total area (2018), km2 (ha)603,550
(60,355,000) *
65,290
(6,529,000) *
Arable land (2018), ha (% of land area)32,888,000
(56.76%) *
2,115,000
(33.77%) *
Main soil typesChernozems,
Phaeozems,
Albeluvisols [38]
Albeluvisols,
Luvisols, Cambisols, Arenosols, Podzols [39]
Susceptibility of soil to compactionHigh, very high [40]Medium [40]
Total area at risk of compaction, million ha (% of country area)23.05
(38.2%) [42]
0.222
(3.4%) [42]
Tractors per 100 km2 of arable land (2009)102.69 *631.64 *
Additional fuel consumption, million L y−1250–280 (extp from [5])2.4–2.7 (extp from [5])
Quantitative yield loss2.5−27% [17]
Qualitative yield lossDifficult to estimate
N fertilizer loss, t y−1
P fertilizer loss, t y−1
K fertilizer loss, t y−1
221,208.34 (extp from [5])
56.30 (extp from [5])
10,456.1 (extp from [5])
2130.5 (extp from [5])
56.30 (extp from [5])
100.7 (extp from [5])
Erosion (a/c areas and natural grassland), t ha−1 y−12.7–7.7 [34]<1 [44]
Agricultural GHG (2018), Mt CO2eq30.19 [45]4.92 [45]
*—World Bank’s open data; extp—extrapolated.
Table 2. Sources of data.
IndicatorReference
Total areaWorld Bank, 2018
Arable landWorld Bank, 2018
Main soil typesFilleccia et al., 2014; Buivydaite, 2005
Susceptibility of soil to compactionEuropean Commission, 2008
Total area at risk of compactionVan Lynden, 2000
Tractors per 100 km2 of arable landWorld Bank, 2009
GHG costs from add. diesel usingAdapted from Graves et al., 2015
Additional fuel consumption and its costAdapted from Graves et al., 2015
Losses of N, P, K fertilizers and GHG costs increasedAdapted from Graves et al., 2015
ErosionBulyhin et al., 2016; FAO, 2019;
Panagos et al., 2017
Yield losses and the costs of yield lossesAdapted from Graves et al., 2015
Water pollution (water purification, rivers and lakes, transitional waters)State Agency of Water Resources of Ukraine, 2020
Flood restoration priceRaška, 2015
Table 3. Potential annual costs of soil compaction in Ukraine and Lithuania.
CountryUALT
Direct costs (extrapolated from [5])
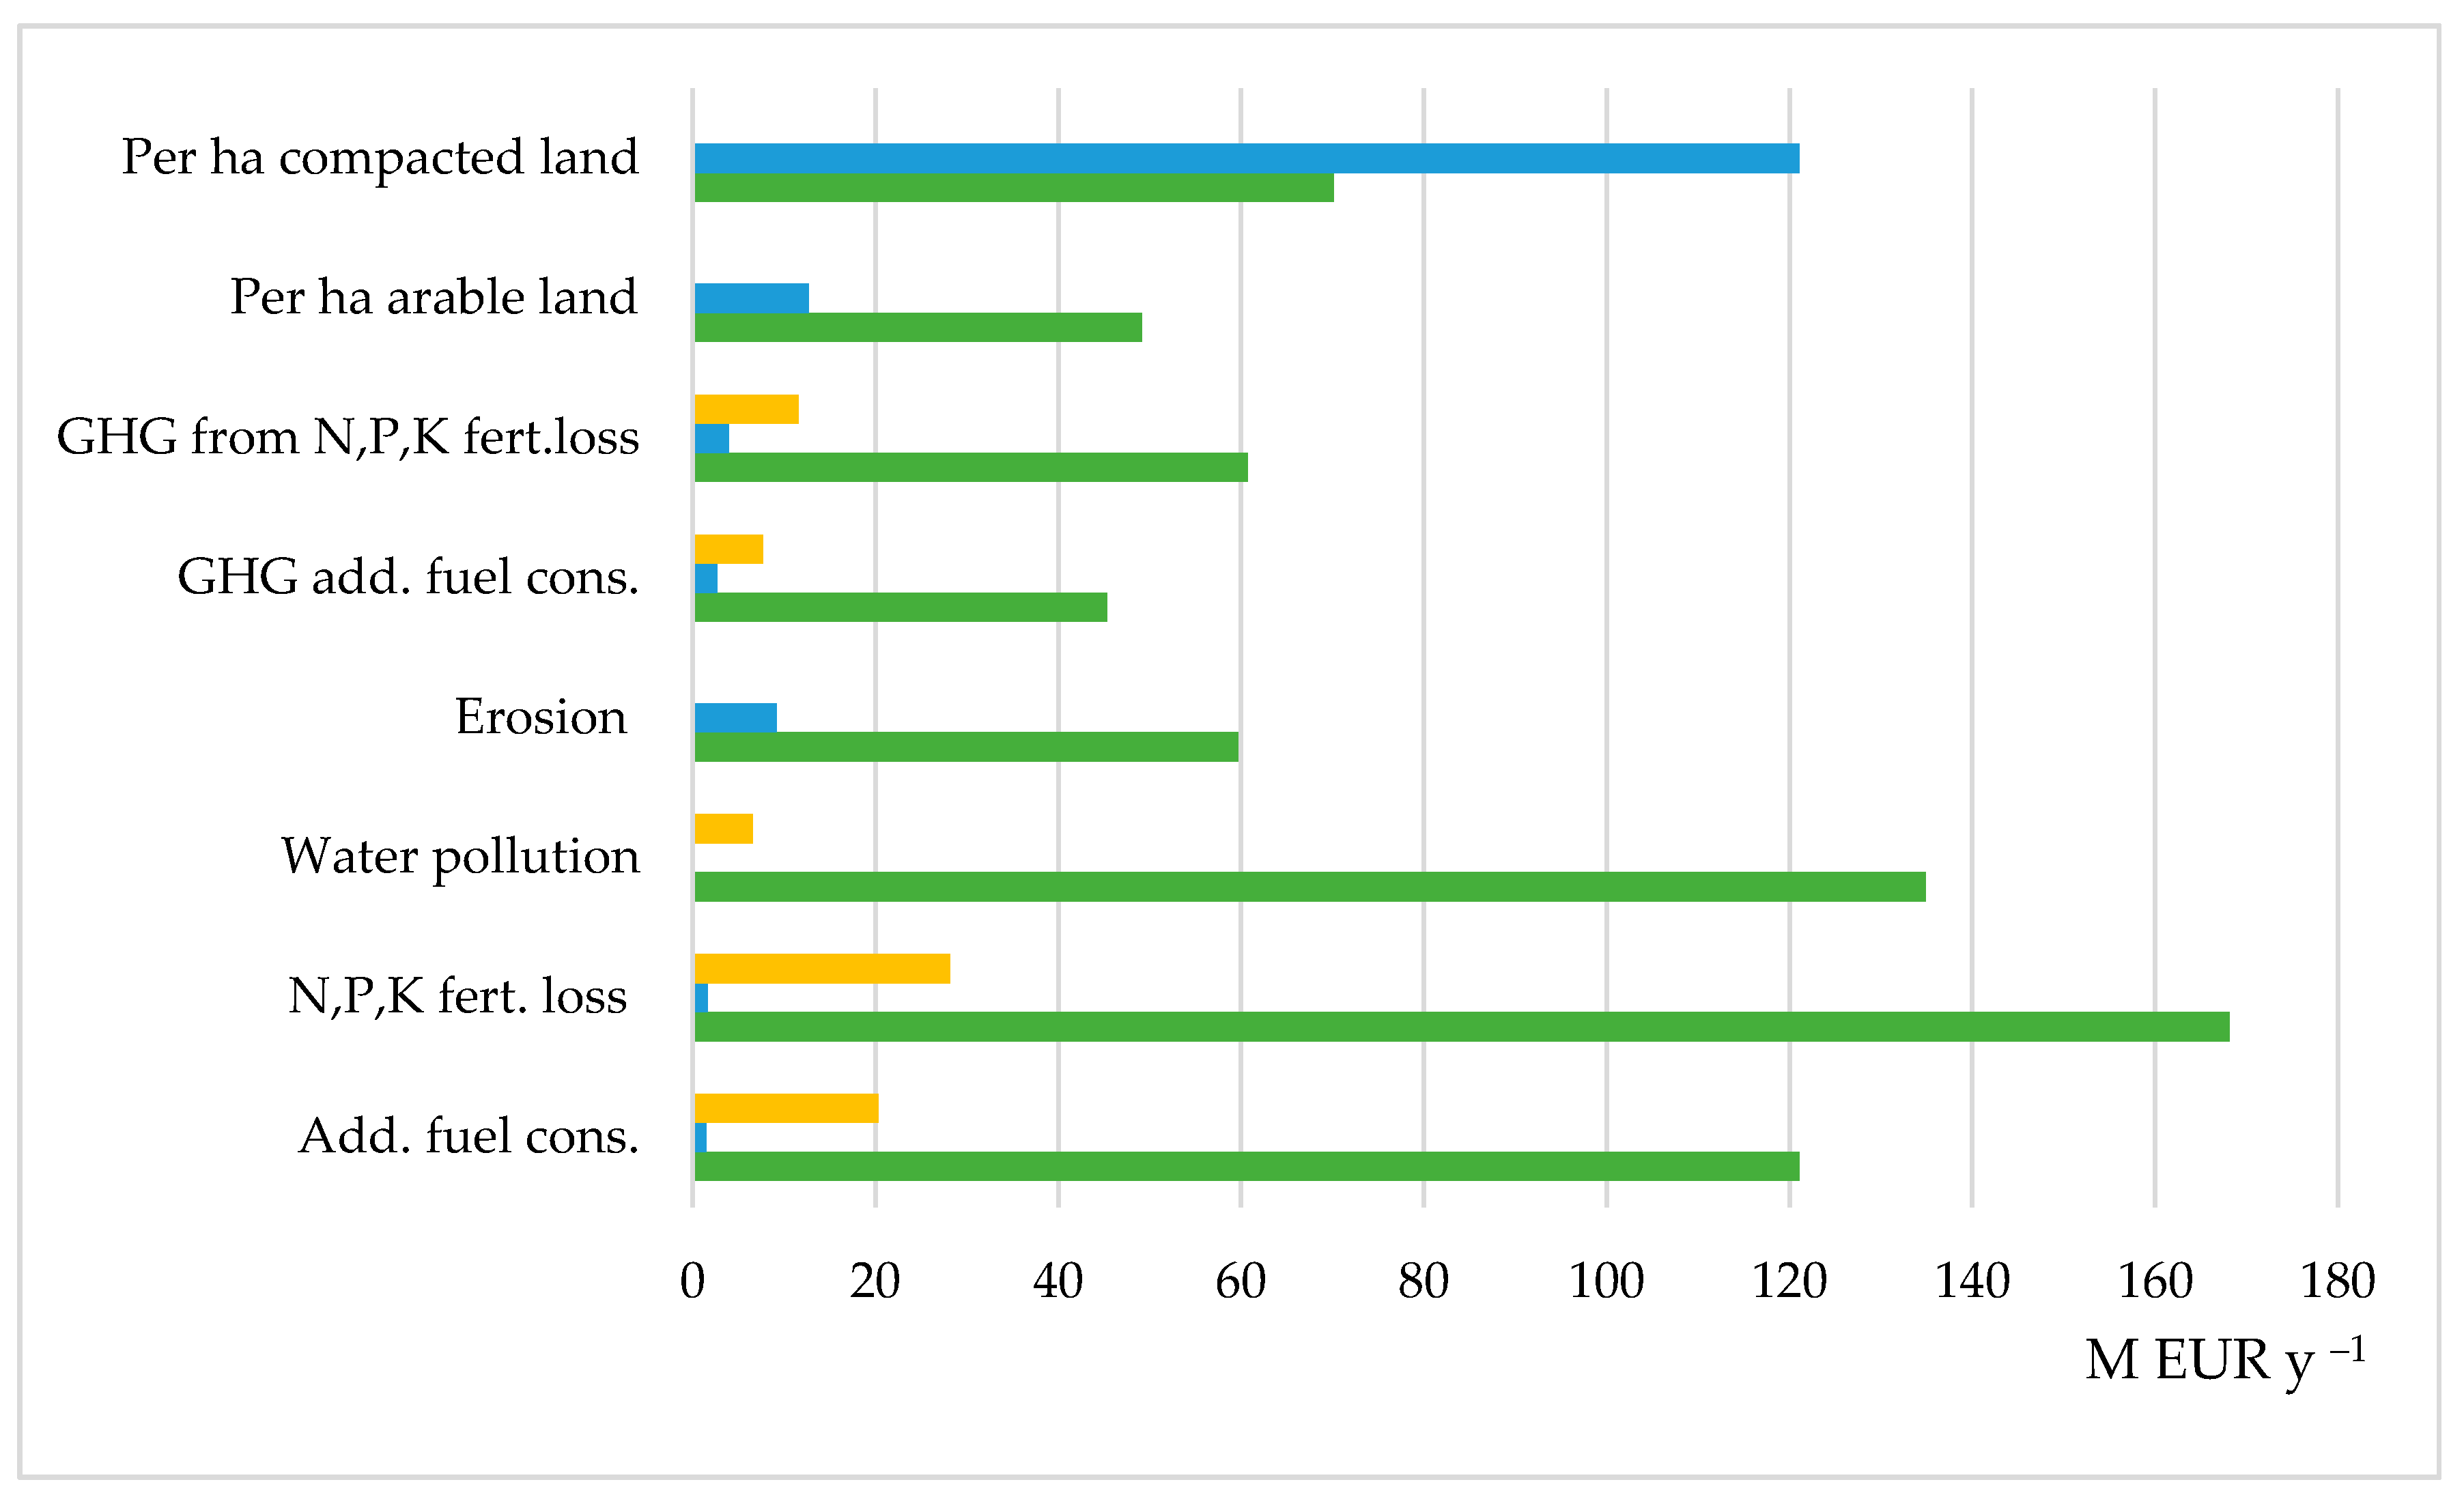
Additional fuel consumption costs,
M EUR y−1
121.071.47
Costs of yield losses, M EUR y−1965.66–1086.3710.7
Costs of N fertilizer losses, M EUR y−1
Costs of P fertilizer losses, M EUR y−1
Costs of K fertilizer losses, M EUR y−1
157.22
4.61
6.311
1.51
0.044
0.0677
Total direct costs, M EUR y−11315.2313.79
Indirect costs
Water pollution (water purification,
rivers and lakes,
transitional waters), M EUR y−1
134.93 SAWRn.d.
Flood regulation service (or restoration price),
M EUR y−1
n.d.0 [48]
Erosion costs, M EUR y−159.684 [50]9.18 U
GHG costs from add. diesel using, M EUR y−141.94–45.32.69
GHG costs of increased (extp from [5]):
N losses, M EUR y−1
P losses, M EUR y−1
K losses, M EUR y−1
 
60.19
0.32
0.21
 
3.87
0.02
0.02
Total indirect costs, M EUR y−1297.27–300.6315.78
Total potential annual losses, M EUR1615.8629.57
Losses per ha arable land, EUR ha−1 y−149.1312.71
Losses per ha compacted land, EUR ha−1 y−170.1121.1
n.d.—no data; U—adapted from data for UA, expected lower values; SAWR—State Agency of Water Resources of Ukraine; M—million; extp—extrapolated.
Publisher’s Note: MDPI stays neutral with regard to jurisdictional claims in published maps and institutional affiliations.

