1. Introduction
Atmospheric particulate matter (PM) has recently emerged as a significant environmental problem. Major cities worldwide recognize its seriousness, identify the impact of PM on the human body, and aim to lower the particulate levels in the air. Smaller particles are more likely to invade the body’s respiratory system and cause serious health problems [
1,
2]. If the amount of PM in the air (
) increases by 10 μg/m
3, the probability of asthma in children aged 1–3 y rises by 1.06% and 1.12% [
3,
4].
Trees are known to play an essential role in reducing PM pollution in the city [
5,
6]. Previous studies have shown that trees are more effective in reducing PM than buildings or surfaces because of the high air turbulence created by their complex morphology and large surface area [
7,
8,
9,
10]. There are two main mechanisms for trees to remove PM in the air. The first one is when PM is captured on the leaf surface and washed away by rainwater [
11,
12,
13,
14,
15]. The second is the mechanism by which PM is absorbed into the leaves’ stomata, transferred to the roots, and broken down by bacteria in the soil. The first mechanism involves trees’ physical characteristics, and it is known to be more efficient [
12]. Furthermore, previous studies reveal that the shape and size of leaves significantly affect PM reduction [
10,
16,
17]. Therefore, we began our study by describing the structural features of leaves that can be applied to various surfaces that make up the urban infrastructure so that urban infrastructure could affect PM reduction in the same manner as trees.
Previous studies have investigated various parameters of the leaves that affect the capturing efficiency of PM. The shape, size, orientation, and micro-morphology of the surface are found to be the effective parameters [
10,
12,
14]. It has been acknowledged that the smaller the individual leaf is, and the more complex the leaf shape is, the higher the PM capturing performance [
10,
12,
18]. Also, the more complex the micro-morphological surface of the leaf is, such as hair, trichome, and ridges, the higher PM capturing performance [
11,
12,
13,
19,
20]. Interestingly, the needle-like leaves of conifers have significantly higher PM capturing performance per unit area than the leaves of broadleaf tree species [
10,
13,
18]. The re-suspension rate of captured PM is also lower [
12]. This could be due to the differences in the patterns of coniferous trees’ leaves and how they are clustered. However, no experimental study has been conducted to see how PM capturing performance depends on the leaves’ arrangement patterns when the surface area is the same.
This study focuses on the leaf cluster pattern in which individual leaves are gathered to form the whole. When the total surface area is the same, a large, broad, flat-sided, and sparsely arranged cluster pattern and a small, dense, and volumetric cluster pattern were created to investigate how these differences affect PM capturing performance. After exposing two tree-like structures with synthetic leaves arranged in different cluster patterns to artificially generated PM in a chamber for 60 min, we recorded the levels of PM in the chamber every minute. The results confirmed that the small, dense, and volumetric cluster pattern has a more significant effect on reducing PM than the large, broad, flat-sided, and sparsely arranged cluster pattern.
Green infrastructure in the built environment has been considered as one potential urban planning solution for improving air quality as well as enhancing the sustainability of cities [
21,
22]. The aim of this study is to find a way to improve the absorption performance of architectural surfaces that form the urban infrastructure. The term architectural surfaces, in this research, refers to the surfaces that can be applied to buildings and infrastructures. Therefore, we conducted experiments to answer whether applying the physical properties of leaf cluster patterns derived from the experiments with a tree-like structure mentioned above can achieve the same results for architectural surfaces.
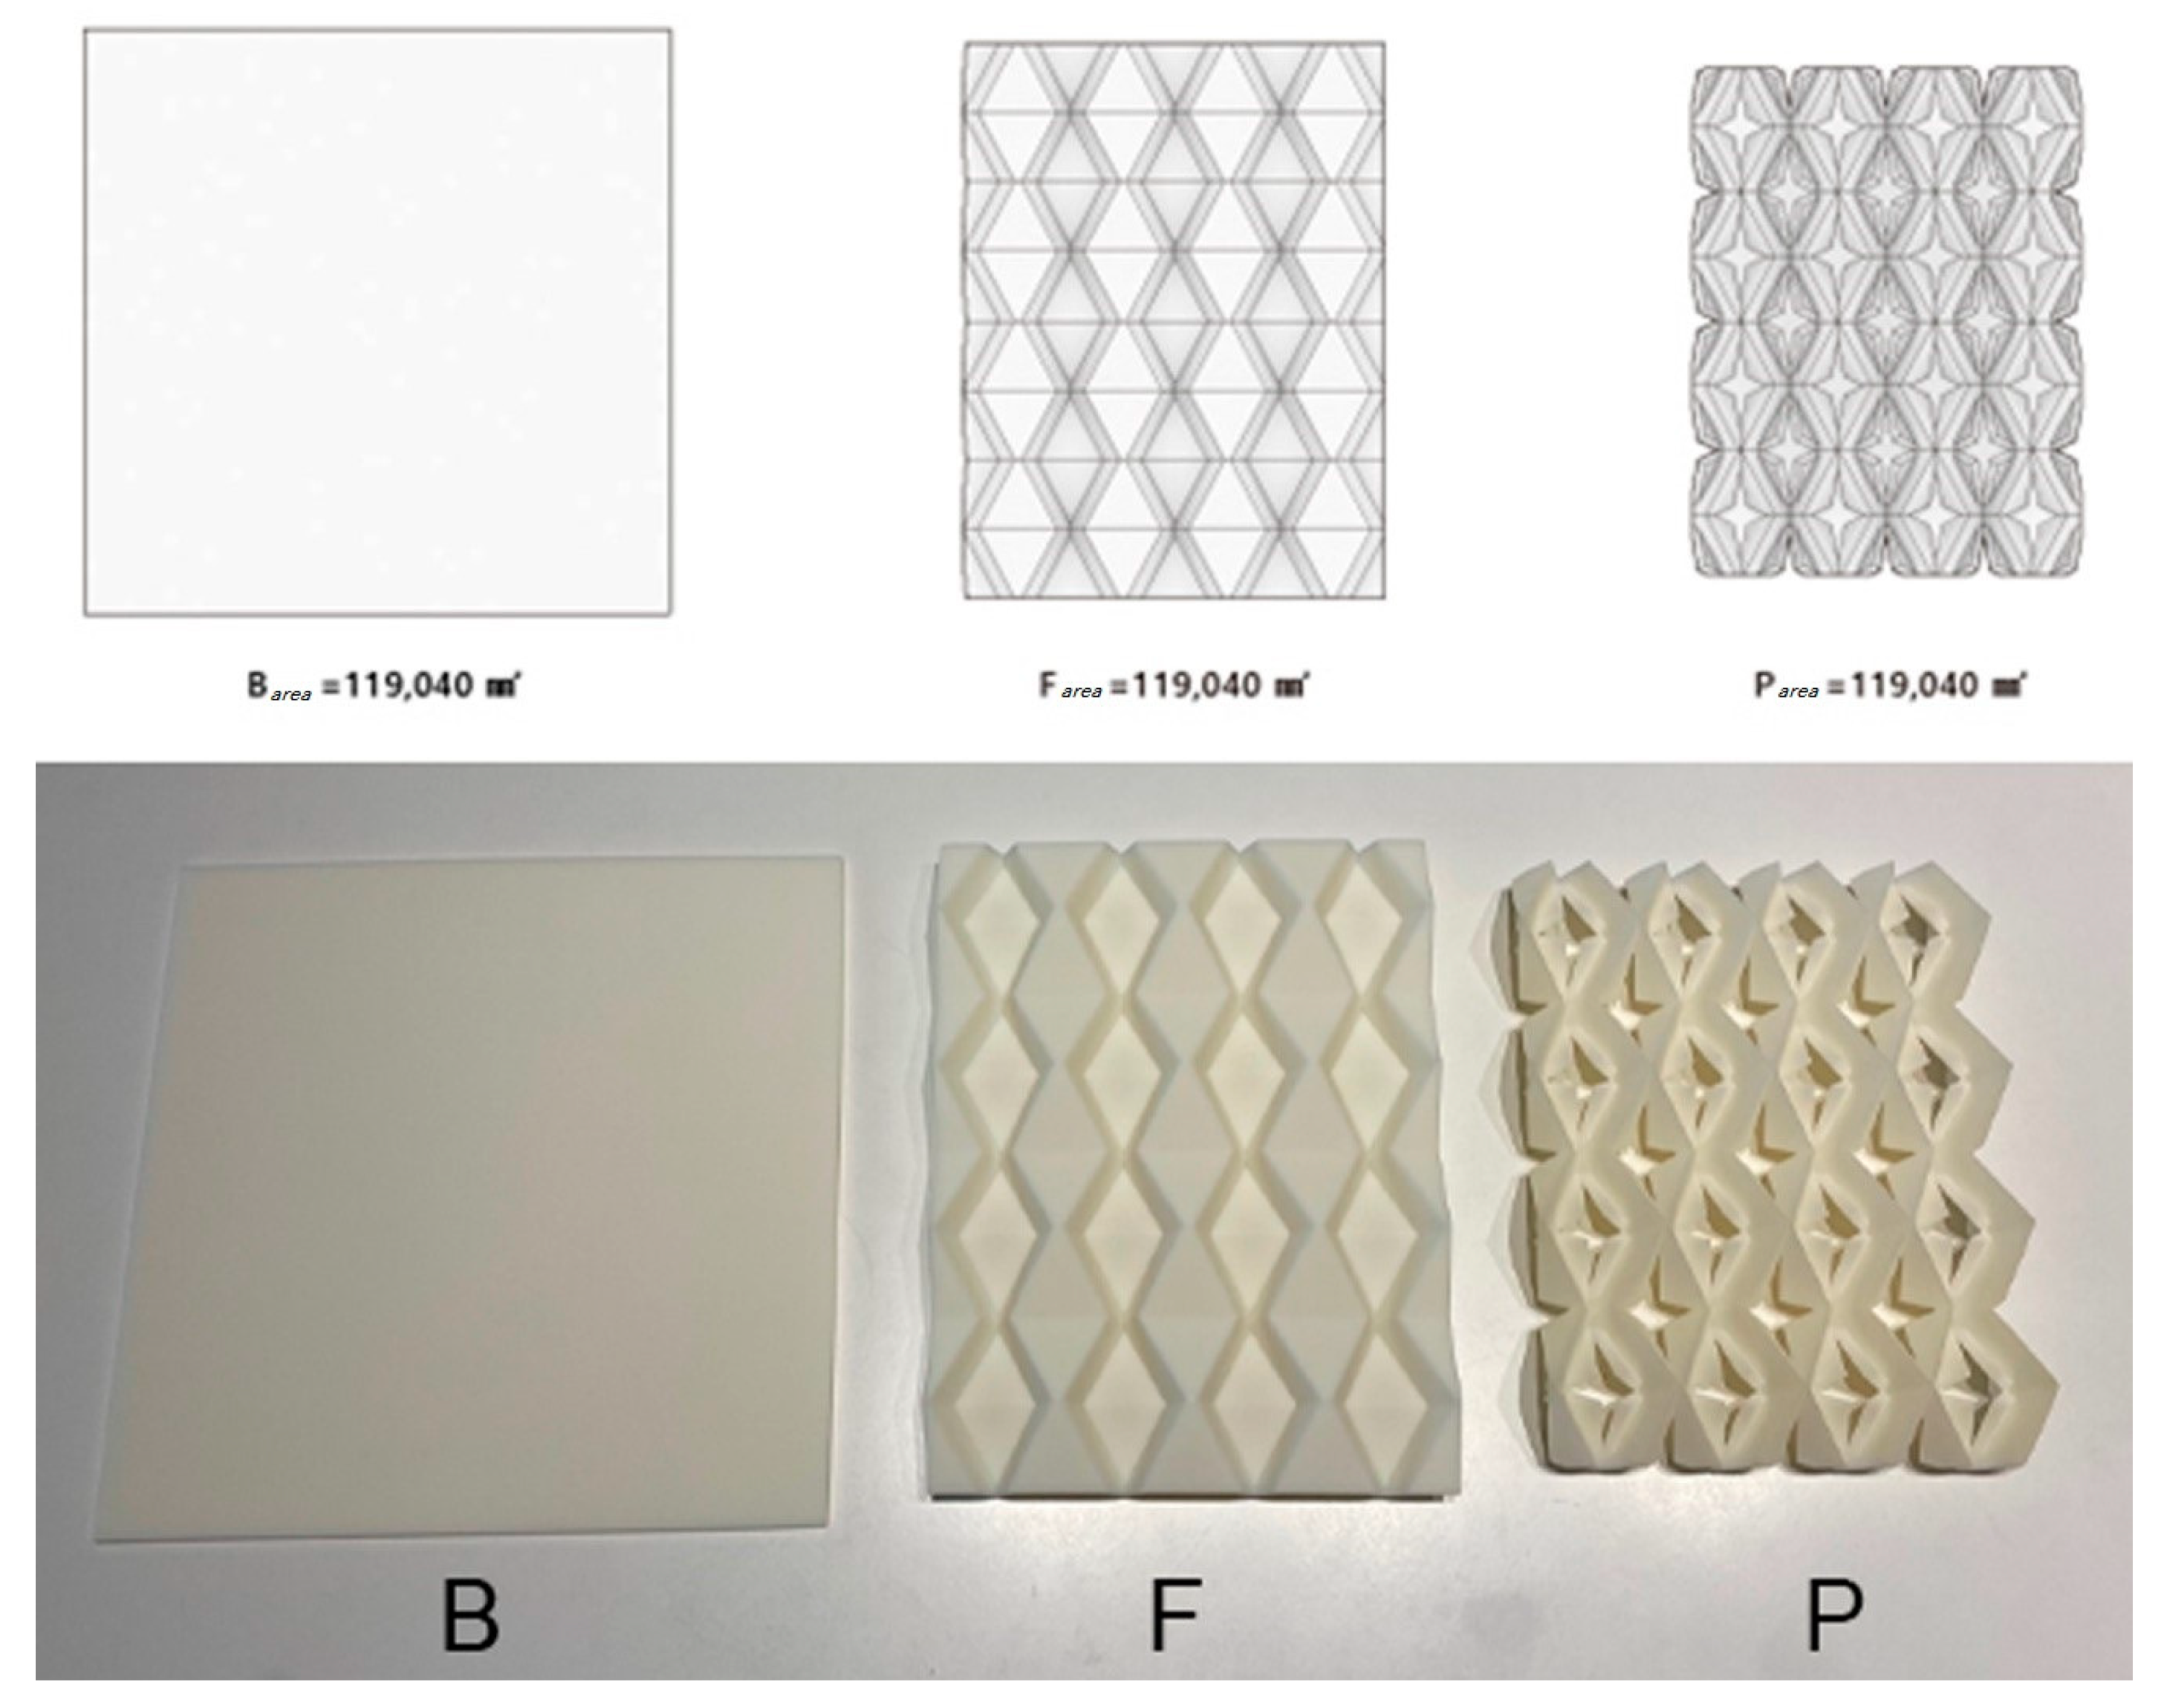
Different architectural surfaces were created based on morphological features of the sparsely arranged cluster pattern of large flat-sided leaves and the densely arranged cluster pattern of small leaves forming a three-dimensional mass. Based on the main morphological features of leaf cluster patterns as related to the volumetric degree of PM capturing and surface gaps, a base surface (B), a folded surface (F), and a folded and porous surface (P) were created. These three types of surfaces had different shapes but the same overall surface areas. We produced samples for the experiment by printing out the generated surfaces using SLA 3D printers. Chamber experiments using the samples produced were conducted in the same way as leaf experiments. Architectural surface experimental trials also yielded results in relation to leaf cluster pattern experimental trials. As a result, it was confirmed that the PM capturing performance would improve if the surfaces with the same area are split into small pieces to create more gaps (pores) and are made into three-dimensional surfaces.
2. Materials and Methods
Two series of chamber experiments were designed for this study. First, to find out whether the cluster pattern of leaves is a parameter that affect trees’ PM capturing performance or not, we created synthetic leaf structures with two different cluster patterns (a large and sparsely arranged cluster pattern and a small and densely arranged cluster pattern). Other influential variables—total surface area, and micro-morphology—were kept the same. Each synthetic leaf structure was placed in a chamber and exposed to artificially generated PM for 60 min. Changing levels of PM2.5 and PM10 inside the chamber were recorded every minute and the experiment was repeated 5 times per pattern. The experiment answers the question whether there will be difference in PM capturing performance depending on the cluster patterns.
The second series of experiments were designed to confirm, if the cluster patterns of the leaves are applied to the architectural surfaces, whether they will show the same PM capturing performance or not. Will the cluster pattern that showed superior PM capturing performance in synthetic leaf structure experiment also show superior PM capturing performance when applied to the architectural surfaces? Architectural surfaces mimicking the two different leaf cluster patterns and a base surface for comparison purpose were created whilst other variables—total surface area and micro-morphology—were kept the same. Each surface sample was placed in a chamber and exposed to artificially generated PM for 80 min. Changing levels of PM2.5 and PM10 inside the chamber were recorded every minute and the experiment was repeated 5 times per surface pattern. The changes in PM2.5 and PM10 levels of each sample were graphed, and 10 min interval records were compared with each other.
2.1. Creation of Leaf Cluster Patterns
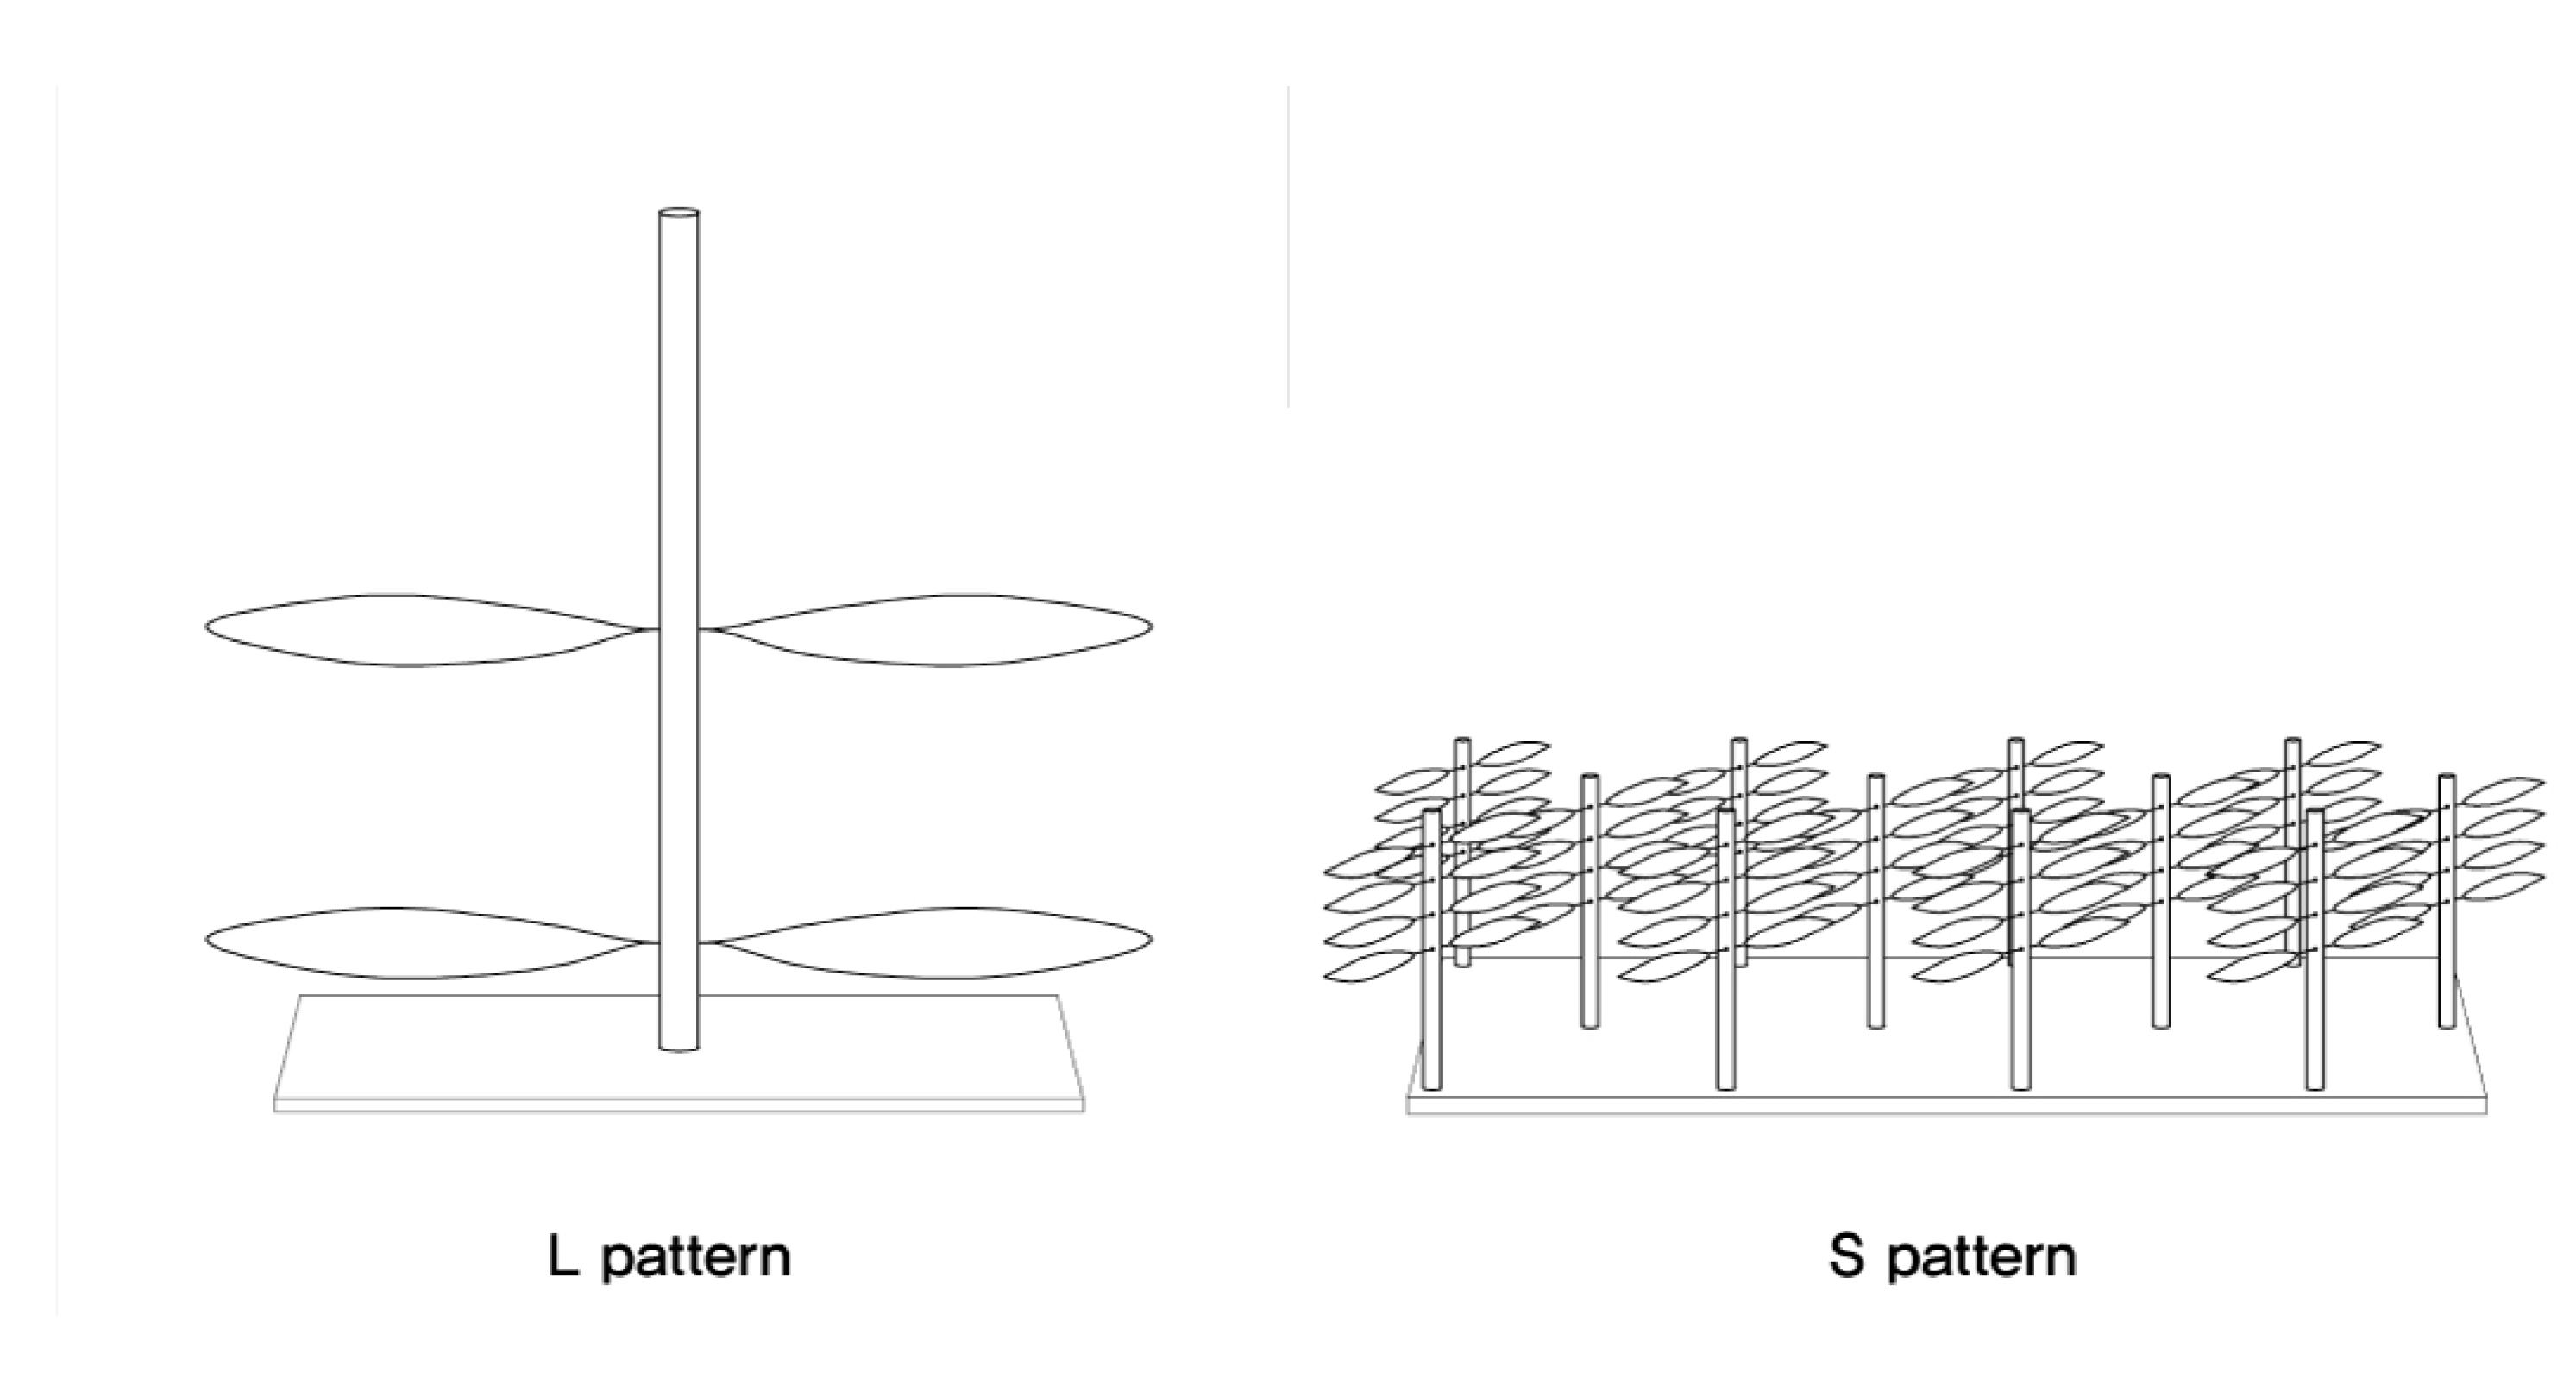
In this article, to experiment, we created two groups: tree-like structures, with identical surface areas and individual leaf shapes, and micro-morphology, but with differences in leaf sizes and clustering patterns. We created a group of 4 sparsely arranged large leaves and a group of 96 closely arranged small leaves. The overall surface areas, individual leaf shapes, and leaf micro-morphology were the same. The size and number of individual leaves differed, forming a large sparse pattern (hereafter L pattern) and a small and dense pattern (hereafter S pattern). For both patterns, the total area of the leaves was 38,552 mm
2. In the L pattern, the surface area of a single leaf was 9638 mm
2. There were four leaves per stem, and the pattern consisted of one stem with four leaves. In the S pattern, one leaf had an area of 401.583 mm
2. There were eight leaves per stem, and one pattern consisted of 12 stems. The S pattern had 96 leaves in total.
Figure 1 demonstrates the area of the L pattern and S pattern samples, and
Figure 2 demonstrates the shapes of L pattern and S pattern samples when fabricated into the tree like structures.
2.2. Synthetic Leaf Structure Fabrication Method
Previous research on the method of fabrication of synthetic leaves was surveyed for the experiment [
10]. The method used is outlined below. First, a glutinous rice glue solution (boiled with 10 g of glutinous rice powder in 1 L of water) was applied to cotton poplin to make it stiff, prevent wrinkles or folds, and the cotton poplin was cut in a shape of a leaf. Second, a commercially manufactured artificial stem (wrapped in green paper) was attached to one side of each leaf with instant glue. Small holes were made in wood dowel stems, and the leaves were inserted and secured in the stems. Third, the leaves made before the experiment were immersed in deionized water and shaken to remove the remaining particles. Finally, the leaves were dried at 35 °C for 30 min using an enclosed drying chamber to prevent contamination with the indoor particles. All the materials used in this experiment are selected to control the influence of additional variables. Using the same fabric, without any pleats or folds, produced artificial leaves with exactly the same surface characteristics and roughness [
10]. The cotton poplin stiffened with rice glue reflects the characteristics of leaves well. There was no shape deformation during the pre-treatment process, and the synthetic leaf withstood well without damage throughout the experiment. For the accuracy of the experiment, the synthetic leaves were used only once.
2.3. Chamber Experiment
The chamber experiment was conducted by putting the produced synthetic leaf structures into the chamber, artificially generating PM, and measuring the level of PM
2.5 and PM
10 inside the chamber for a particular time to compare the rates at which PM levels decreased. The experimental apparatus is shown in
Figure 3.
Experiments were conducted five times for each pattern (L pattern and S pattern) and, for the sake of comparison, for an empty chamber. The chamber was made of acrylic material with the size of 500 mm (w) × 500 mm (d) × 700 mm (h). A particle generating unit, particle mixing unit, and dehumidification unit were placed in the upstream of the main chamber, where PM tests were conducted [
16].
The PM flow was generated by burning commercially available mosquito repellents inside the particle mixing unit and using compressors and flow meters. It was then injected into the chamber at a constant rate through air mixing and dehumidification units. The main experimental chamber contained samples to be tested, PM measuring devices, and a wireless fan. Humidity, temperature, and wind speed were maintained constant in the chamber: humidity was maintained at the level of 30–35%, temperature at 18 °C–22 °C, and wind speed at about 1 m/s.
The process of the experiment was as follows. First, PM was artificially generated, and air containing PM was injected into the enclosed chamber at constant pressure. As soon as the level of PM2.5 indicated by the measuring device exceeded 450 μg/m3, the injection stopped. The PM levels inside the chamber were recorded for 60 min after the injection stopped.
To measure PM2.5 and PM10, we used the Dylos DC1700 device. The device measures the number of particles per 0.01 cubic foot using the light scattering method (>0.5 µm, >2.5 µm) and converts them to PM2.5 and PM10 (µg/m3). The device records the data by averaging the levels measured for one minute.
2.4. Creating Architectural Surfaces with Different Complexity
We found a noteworthy difference in PM capturing performance between the large and sparse pattern and a small and dense pattern. Based on these results, we established a hypothesis that if a specific area is divided into small sections to create gaps and volumetric surfaces, there will be a difference in PM capturing performance compared to the flat surface area.
Using the 3D modeling software Rhinoceros 3D, three types of surface models with the same area were created: base (B surface), folded (F surface), and folded and porous (P surface). The origami method (Japanese paper folding method) was used to make the flat base surface (B) into a more volumetric folded surface (F). The same method was used to create the folded and porous surface (P). The three surfaces were about 240 mm × 240 mm in size and had the same surface areas of 119,040 mm
2 (
Figure 4). When a planar surface is folded to form a volumetric surface, its size seems smaller from a plan view. However, all three surfaces have the same overall surface area. The samples for conducting chamber experiments were made from reinforced resin by utilizing an SLA-style 3D printer.
4. Discussion
4.1. Experiment’s Results of PM Capturing Performance of Different Leaf Cluster Patterns
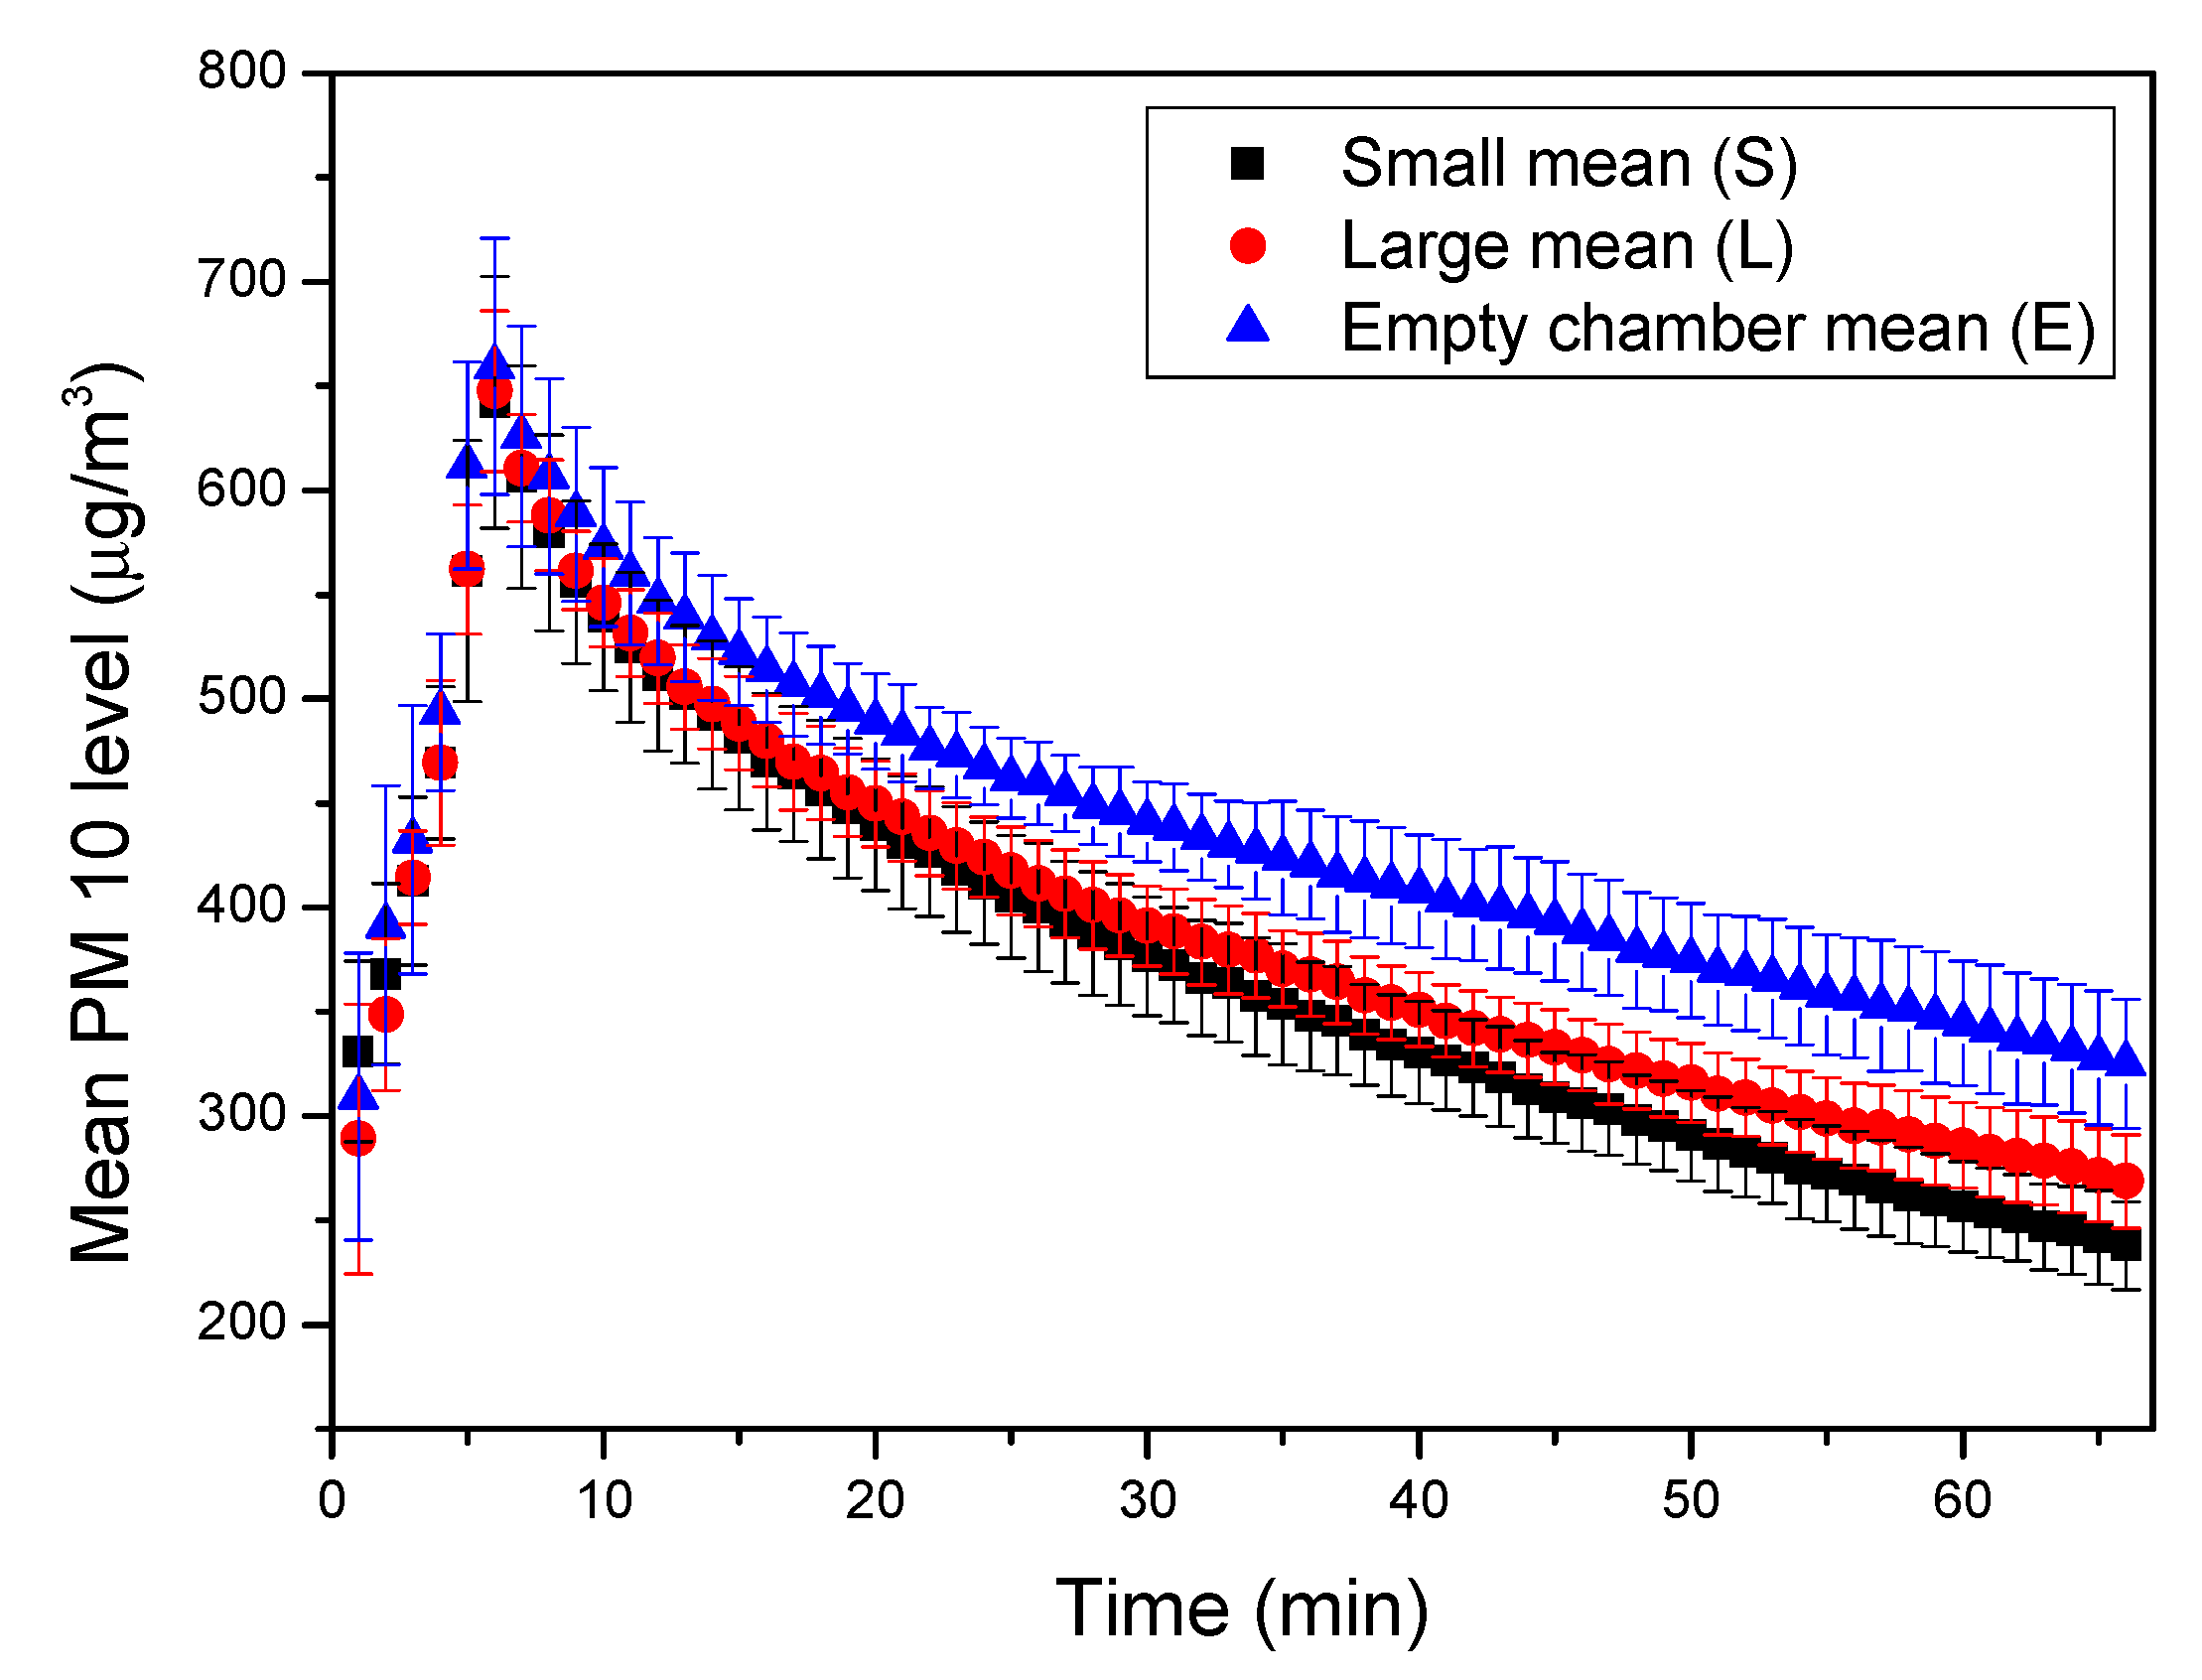
Experiments on the effect of leaf cluster patterns on the PM capturing performance confirmed that both PM2.5 and PM10 levels decreased the fastest in the case of the S pattern 60 min after the injection of PM in the chamber stopped. The results confirmed that the S pattern has a higher PM2.5 and PM10 reduction capacity than the L pattern, even for the same surface area. The difference in PM2.5 reduction rates between the patterns increased over time. When comparing the mean values of PM2.5 reduction rate 10 min after the injection of PM stopped, the difference between the S pattern and the L pattern was 0.7%, and between the L pattern and empty chamber 1.6%. After 30 min, the average reduction rate for the S pattern was 2.6% higher than for the L pattern, and the average reduction rate for the L pattern was 4.9% higher than for the empty chamber. After 60 min, the average PM reduction rate for the S pattern was 5.1% higher than for the L pattern, and the average reduction rate for the L pattern was 7.8% higher than for the empty chamber. The difference between the empty chamber and the L patterns increased steadily over time, and the difference between the L pattern and the S patterns also increased steadily.
We found that the difference in PM10 reduction rates between the patterns also grew over time. The S pattern and the L pattern recorded a 0.7% difference when the average PM10 reduction rates after 10 min were compared. The difference between the L pattern and the empty chamber was 4.2%. After 30 min, the average reduction rate for the S pattern was 2.4% higher than for the L pattern, and the average reduction rate for the L pattern was 7.3% higher than for the empty chamber. After 60 min, the average PM reduction rate for the S pattern was 4.3% higher than that for the L pattern, and the average reduction rate for the L pattern was 7.9% higher than that for the empty chamber. The reduction in PM10 also shows that the difference between the empty chamber and the L pattern increased steadily. The difference between the L and S patterns also grew steadily over time. Even for the same surface areas, the small and dense cluster pattern had a more significant effect on reducing PM2.5 and PM10 levels.
In this experimental study, PM was injected from the upper part of the chamber. The empty chamber experiment results showed a natural reduction rate in PM inside the chamber due to gravity.
Along with the shape and size of the leaves, leaf cluster patterns also affected PM capturing performance. This can be the basis for explaining the results of previous studies on coniferous trees demonstrating excellent results in capturing PM in the air. In other words, even for the surfaces with the same areas, small leaves with many small gaps between them capture PM more effectively than other leaf cluster patterns that are not three-dimensional and porous patterns.
4.2. Experiment Results of PM Capturing Performance of Architectural Surfaces with Leaf Cluster Patterns
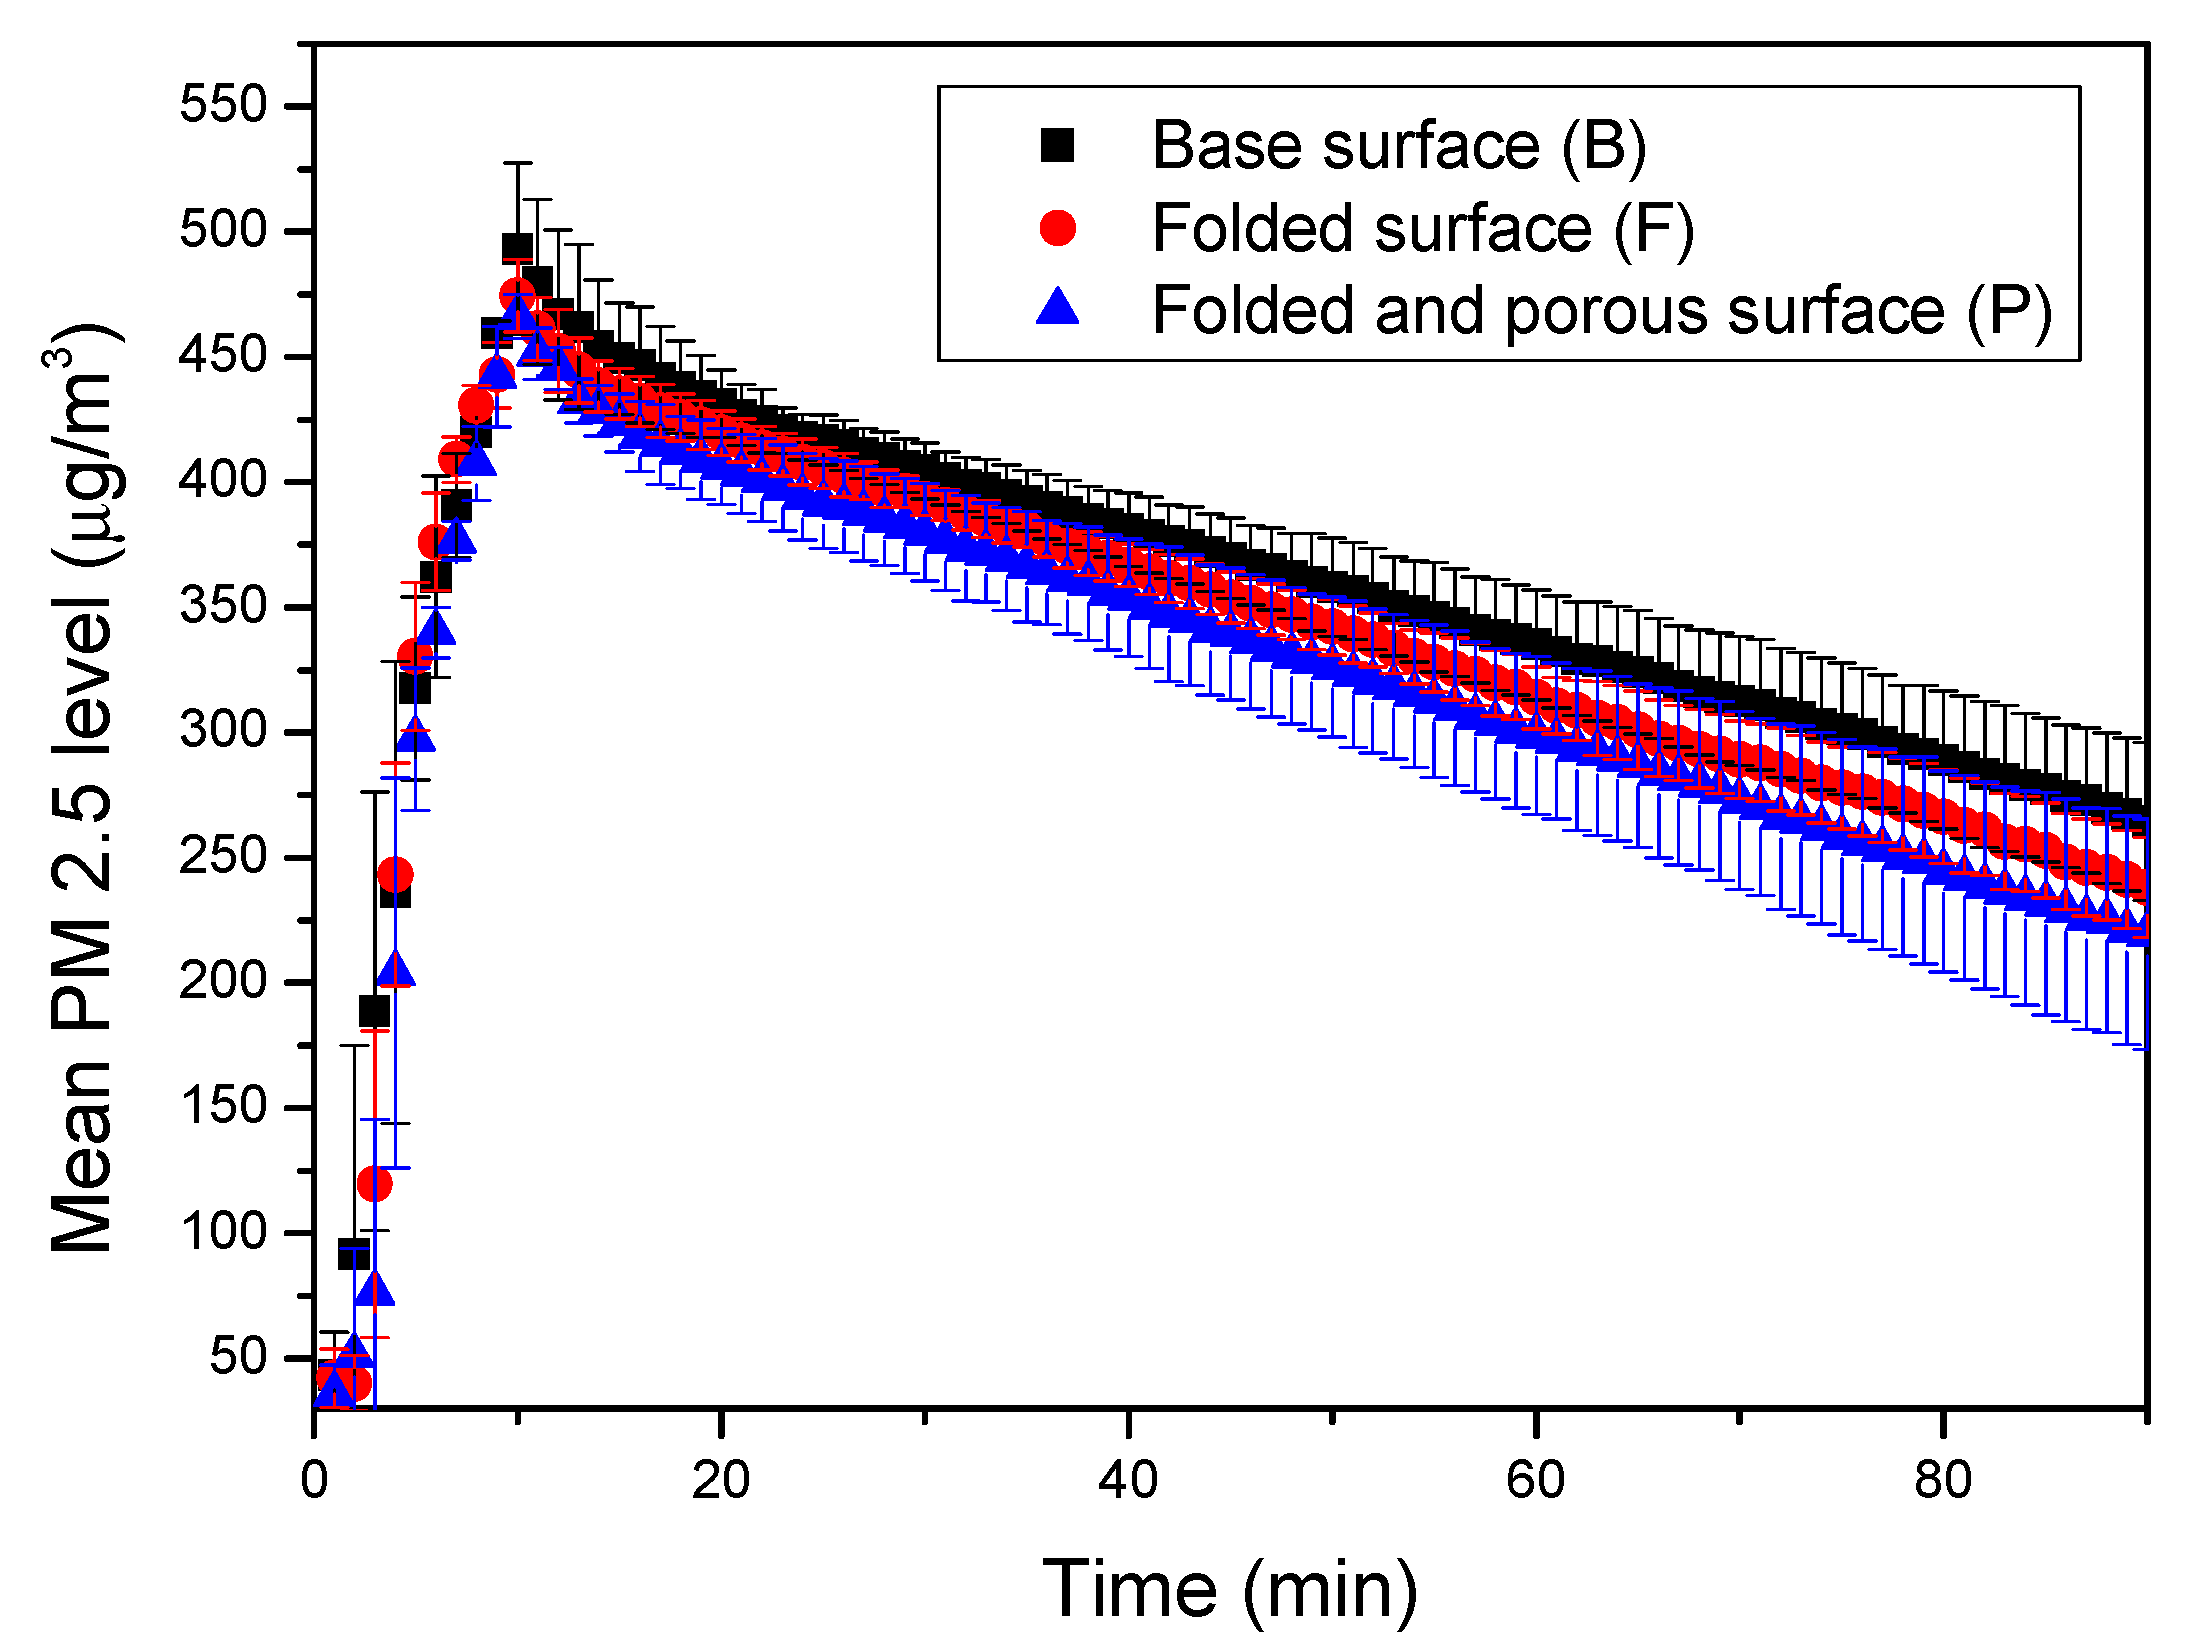
By comparing the graphs of the mean values of PM levels for the B surface, F surface, and P surface, we can see the differences based on the volumetric quality of the surface and the degree of gap formation. PM2.5 and PM10 reduction rates were the fastest in a chamber with the P surface—folded and porous surface. Both PM2.5 and PM10 demonstrated similar patterns. During the first 30 min, there was little difference between the three surfaces, and the PM2.5 and PM10 reduction rates for the B surface were more significant than those for the F surface. After 30 min, the F surface demonstrated a higher reduction rate than the B surface, and the difference between the surfaces increased. We confirmed that the degree to which the surface is volumetric and porous affected PM2.5 and PM10 reduction through the chamber experiments with the three surfaces.
Experiments on architectural surfaces with morphological principles derived from artificial leaf experiments also showed that volumetric surfaces had higher reductions in PM 2.5 and PM10 than planar ones. In addition, it was confirmed that folded and porous surfaces showed high PM reduction rates for both PM2.5 and PM10. However, it should be noted that any deviation during the experiments with the same surface structure was negligible compared to the differences in the reduction rates between surfaces with different structures. Additional experiments are needed to clarify further the fact that the folded and porous surface has the best PM reduction performance compared to other surfaces when the surface areas are the same.
5. Conclusions
The atmospheric PM is a significant environmental problem, and previous studies have investigated the effectiveness of trees in reducing PM in the city. This study aims to define morphological traits of trees that affect their PM capturing performance and to show the possibility of architecture adopting the traits of the trees to improve its PM capturing performance.
In this study, two series of chamber experiments were conducted. The synthetic leaf structure experiments confirmed that the leaf cluster pattern, along with the shape and size of leaves, affects the PM capturing performance. Experiments with a fixed total surface area but different leaf cluster patterns showed that cluster patterns with smaller leaves and smaller gaps between them were more suitable for PM capturing than the patterns made up of large leaves and with large gaps between them. That is presumably due to small gaps between the leaves and the leaves forming microscopic currents, increasing the probability that dust particles hit the leaves and are captured by them.
The second part of the study is to apply the morphological principles derived from the synthetic leaf structure experiments to architectural surfaces and to confirm that PM capturing performance of architectural surfaces can be improved. The experiments confirmed that the folded surface is more advantageous for capturing PM, and the folded and porous surface is the most advantageous for capturing PM. Findings from this study can be summarized as follows:
- (1)
Cluster pattern of leaves affect PM capturing performance of the trees.
- (2)
Smaller leaves with smaller gaps show superior PM capturing performance than the large leaves with larger gaps when the total surface area are same.
- (3)
Architectural surfaces mimicking the leaf cluster pattern that showed superior PM capturing performance also show superior PM capturing performance.
- (4)
The folded and porous architectural surface is the most advantageous for capturing PM when the total surface area is the same.
- (5)
The PM capturing performance of architectural surfaces can be improved by mimicking the cluster pattern of the leaves.
The results of this study have confirmed that it is possible to improve the PM capturing performance of the architectural surfaces by changing their morphological characteristics. This study shows the possibility to develop durable PM capturing materials and surfaces applicable to the buildings and infrastructures in urban environments. This study can initiate developing design strategies for urban infrastructure to lower the PM levels in cities. It calls for further research to investigate the traits of the trees which can be adopted for green infrastructure designs.


