Abstract
In Tarim River Basin (TRB), the retreat of glacier and snow cover reduction due to climate warming threatens the regional economy of downstream basins that critically depends on meltwater. However, the quantitative evaluation of its impact on multiple sectors of the socioeconomic system is incomplete. Based on compiled regional input–output table of the year 2012, this study developed a method to analyze the relationships between economic activities and related meltwater withdrawal, as well as sectoral transfer. The results show that the direct meltwater withdrawal intensity (DMWI) of agriculture was much higher than other sectors, reaching 2348.02 m3/10,000 CNY. Except for A01 (agriculture) and A02 (mining and washing of coal), the embodied meltwater withdrawal (EMW) driven by the final demand of other sectors was greater than direct meltwater withdrawal, and all sectors required inflows of virtual water (72.45 × 10⁸ m3, accounting for 29% of total supply from cryospheric water resources) for their production processes in 2012. For sectors with high DMWI, improving water-use efficiency is an effective way to reduce water withdrawal. To some extent, the unbalanced supply of cryospheric water resources due to geographical segregation can be regulated by virtual water flows from water-saving to water-intensive sectors. Such decisions can affect the balance between socioeconomic development and environment conservation for long-term sustainability.
1. Introduction
The cryosphere is a layer around the earth with a certain thickness, existing at temperatures below 0 °C, which mainly includes glaciers, ice sheets, ice shelves, snow cover, permafrost, and seasonally frozen ground [1]. China’s cryosphere is the birthplace of many Asian great rivers that critically support the economic development of the oasis and ensure the stability of ecosystems in arid regions [2]. Surface water from the glacier and snow cover supports the global gross domestic product (GDP), while about one-sixth of the world’s population (1.2 billion) relies on meltwater for living and economic activities such as agriculture [3,4]. These illustrate that cryospheric water resources have a significant and irreplaceable role in environmental and socioeconomic conditions, and to a greater extent, in sustainable development.
Over the last decades, global warming has caused a universal shrinking of the cryosphere, with mass loss from glaciers and reductions in snow cover [5]. The depth, extent, and duration of snow cover have declined over recent decades, especially at lower elevations [6]. Across some arid watersheds, there is a large contribution of glaciers and snowmelt to total runoff [7,8]. For instance, glacier runoff accounts for approximately 38.5% of the total river flows in the Tarim River Basin (TRB) [9]. Meltwater from seasonal snow recharges essential freshwater resources stored as surface water in rivers and lakes, soil moisture, and groundwater [10]. Declines in the extent and depth of glaciers and snow cover are of great concern because of their sensitivity to climate change [11,12] and their vital impacts on the human activities downstream [13], as well as regional water resource management [14]. This condition implies a reduction in provisioning freshwater, climate regulation, winter snow recreation, and environmental aesthetics, which are all known as cryosphere services [15,16,17].
During the past several decades, driven by rapid economic development, population growth, and expansion of cultivated land, the demand for available water resources is increasing gradually in arid regions. Agriculture expansion has resulted in an excessive water withdrawal in TRB [18]. Moreover, a decline in meltwater has a strong effect on the water supply downstream under the background of climate warming to a large extent. The tension between reduced water supply and increasing water demand is expanding [4]. Allocating limited available water resources efficaciously among competing water users becomes more and more pivotal, particularly in arid regions.
Existing studies have been devoted to evaluating the impacts of snow cover reduction [3,19,20] and other related subjects such as snowmelt runoff and flooding in western China [21], as well as the influence of declining snow resources on the recreation industry [22]. Some further assessed the glacial changes and their effect on hydrological processes [23,24,25]. However, there is a lack of a clear understanding of the overall economic implication of the decline in cryospheric water resources and its role in water consumption in the local region.
In recent years, several researchers have used the input–output (IO) analysis to study either environment pollution and resource use issues caused by human activities [26,27] or water use associated with inter-industrial activities [28,29]. The water resource in the IO model is a useful instrument to explore the relationship between economic sectors that consume significant amounts of water, both directly and indirectly [30]. Some have conducted quantitative studies on virtual water problems in different regions based on the water resource of the IO model [31,32,33]. For example, Feng applied the multiregional IO tables to assess the consumption-driven virtual water trade in the Yellow River Basin [34]. With few exceptions [35,36,37], studies in the literature on virtual water mainly focused only on water flow, without accounting for water scarcity and environmental impacts [38]. Consuming the same amount of water in water-rich and water-scarce regions would have very different impacts on local water resources and ecosystems. Furthermore, others tended to emphasize the importance of all water supply [39], and few considered the role of cryosphere meltwater separately.
These IO studies have made a significant contribution to the advancement of water resource IO modeling; however, due to the mismatch in the spatial scale of hydrological and economic data, few studies have evaluated the relationship between economic sectors and water resources on a watershed scale. From a hydrological perspective, the catchment is the appropriate study unit, whereas the IO economic data are typically published on administrative scales such as a national and provincial scale. At the same time, in the basin scale, the difference between the water resources supply, on the upstream side, and the socioeconomic demand, on the downstream side, is obvious, and the flow of meltwater in the economic system is unclear [1].
To fill this gap, this study developed a water resources IO table of TRB that enabled us to evaluate the cryospheric water resources withdrawal of each sector and virtual water transfer embodied in trade. In this study, the cryospheric water resources refer to the total amount of available water resources provided by glacier runoff and snow meltwater. We used geographic information systems (GIS) spatial analysis, combined with remote sensing and field survey data, to estimate the total water supply from the cryosphere that includes glacier and snow cover meltwater. The results can provide decision makers additional environmental economic information to manage cryospheric water resources and promote sustainable development. This is one of the very first attempts to compile such a model that encompasses economic data of regions in TRB and the meltwater data of the entire river basin.
2. Study Area and Data
2.1. Study Area
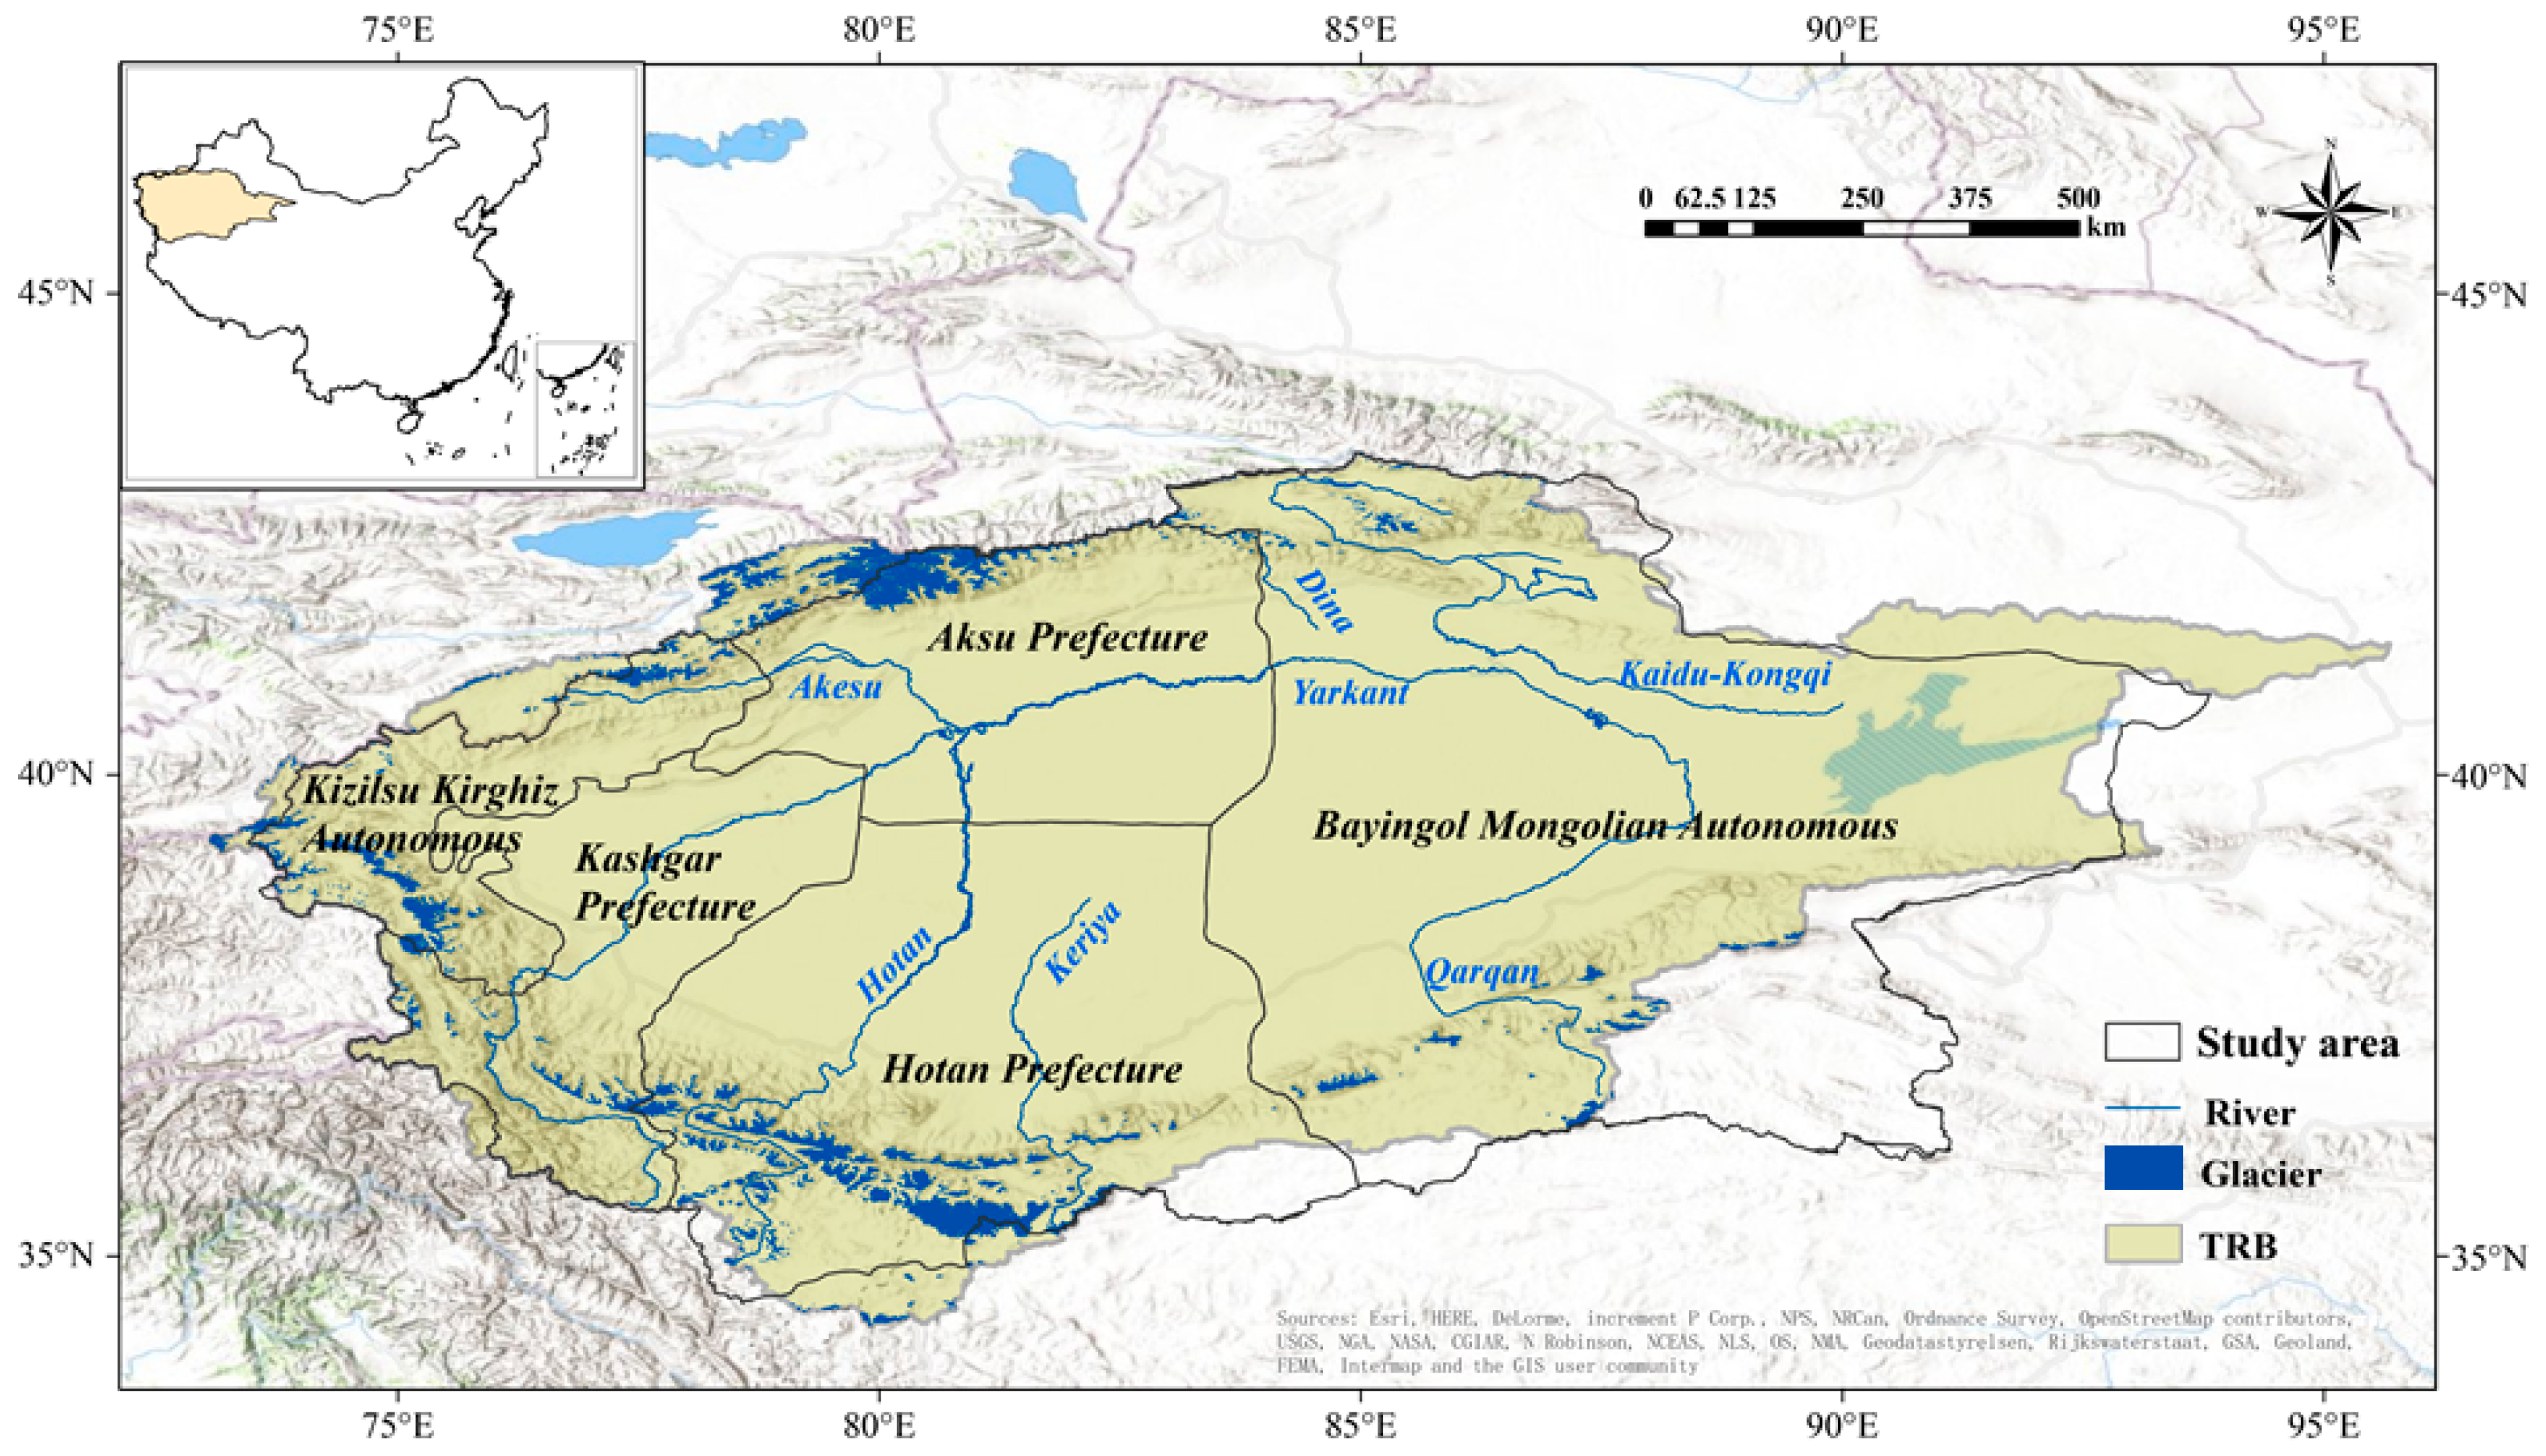
The Tarim River is the largest endorheic river of China, which originates in the northwestern corner of China. The TRB is located in the southern part of the Xinjiang Uygur Autonomous Region, with a total area of 1.02 × 10⁶ km2 (Figure 1). Scarce precipitation and strong potential evaporation are the typical terrestrial climatic features of the TRB [40].

Figure 1.
Study area and the Tarim River Basin (TRB) (the study area consists of Bayingol Mongolian Autonomous Prefecture, Aksu Prefecture, Kizilsu Kirghiz Autonomous, Kashgar Prefecture, Hotan Prefecture, formed by merging country boundaries).
The surface runoff of TRB is mainly supplied by alpine glaciers and snow meltwater; thus, the flow patterns are highly sensitive to climate change [41]. According to the Second Chinese Glacier Inventory (SCGI), there are 12,664 glaciers with a total area of 17,650 km2 and a volume of 1841 km3 surrounding the basin [42]. Under the influence of global warming, most of the glaciers in TRB have been retreating in the last few decades with a smaller portion advancing [43]. Snow cover is widespread in western and northern Xinjiang, where snowmelt is critical to river runoff, meeting the water demand in oases [1,21].
The TRB covers 64% of the total area of the Xinjiang Uygur Autonomous Region and comprises 42 cities and five autonomous prefectures. In 2012, the gross domestic product of the basin was CNY 224.53 billion, and the added value of secondary and tertiary industry was CNY 97.44 and 69.22 billion, respectively. The contribution of the primary industry was the lowest at approximately CNY 57.87 billion (Table 1).

Table 1.
The structure of gross domestic product of TRB in 2012.
2.2. Data Source
Three types of data were used in this study: regional IO tables (in monetary value units), the quantity of sectoral water withdrawal, and cryospheric water resources data.
The IO table for Xinjiang Province was taken from the National Bureau of Statistics of China [44]. China compiles the IO table every five years, and the IO table in 2012 used in this paper is the latest data in China. The IO table with 18 sectors of TRB was produced by employing a hybrid method that adjusts and balances tables, which depends on more accurate information that is introduced. The basic economic data used to compile the regional IO table were collected from the China Country Statistical Yearbook [45] and Statistical Yearbook of Xinjiang Uygur Autonomous Region in 2012 [46].
To match the sector classification of this study, we distributed the total cryospheric water resources according to the proportion of the water withdrawal. The water withdrawal data by sectors (primary, secondary, and tertiary industry) were taken from Water Resources Bulletin [47]. The subsectors’ water withdrawal is counted in terms of their proportions in the sector of production and distribution of water, excluding internal water reuse [48].
The SWE datasets are available from the GlobSnow service [49], which is the latest version released by the European Space Agency: http://www.globsnow.info/swe/archive_v3.0/L3B_monthly_SWE/ (accessed on 23 June 2021). The datasets cover the entire land surface of the NH (25° N–84° N, 168° W–192° E). A reference spatial resolution of 25 km × 25 km was adopted with daily temporal resolution. Glacial runoff simulation data are from the National Snow and Ice Data Center (NSIDC) (https://nsidc.org/data/HMA_GL_RCP/versions/1 (accessed on 23 June 2021). This dataset uses the global python glacier evolution model (PyGEM) to simulate glacier runoff in High Mountain Asia. The new datasets included geodetic mass balance observations of almost all glaciers in the region and are used to calibrate the PyGEM by Bayesian inference [50,51].
3. Methodology
3.1. Input–Output Modeling
The development of input–output (IO) tables and analysis was pioneered by Leontief (1936) [52], a work for which he received a Nobel Memorial Prize in Economics. IO analysis is a “top–down” quantitative approach that uses sectoral transaction data to represent the complex interdependencies between different industries in a certain period [53]. The basic IO model consists of a system of linear equations, each one of which describes the distribution of an industry’s goods and services throughout the economy [54]. Considering an n-sector economy, the distribution of sector i to other sectors and end users can be formulated as follows:
where xi is the total output (production) of sector I, and yi is the total final use of sector I; zij represents the inter-industry purchase of all sectors j from sector i. Having defined the technical coefficient (aij = zij/xj, means the amount of input required from sector i in order to produce a unit of production by sector j) as the ratio between inter-sector sales from i to j and the total production of sector j, the Equation (1) can be presented as follows:
In matrix notation, Equation (2) becomes X = AX + Y, and the above equation can be solved as
where X (italic type) is the vector for total output, I (italic type) is the identity matrix, and A (italic type) is the matrix of technical coefficients, which represent the inputs of each sector per unit of their output in monetary terms. (I − A) −1 is known as the Leontief inverse or the total requirements matrix [55], which indicates the output that is essential for one monetary unit of final demand Y (italic type) is the matrix of total final use. Equation (3) linked between final demand and corresponding production in a sector is thus built with the Leontief inverse matrix, which reveals the total impact of an increase in final use on all industrial sectors.
X = (I − A)−1 × Y
3.2. Compilation of Input–Output Tables of the TRB
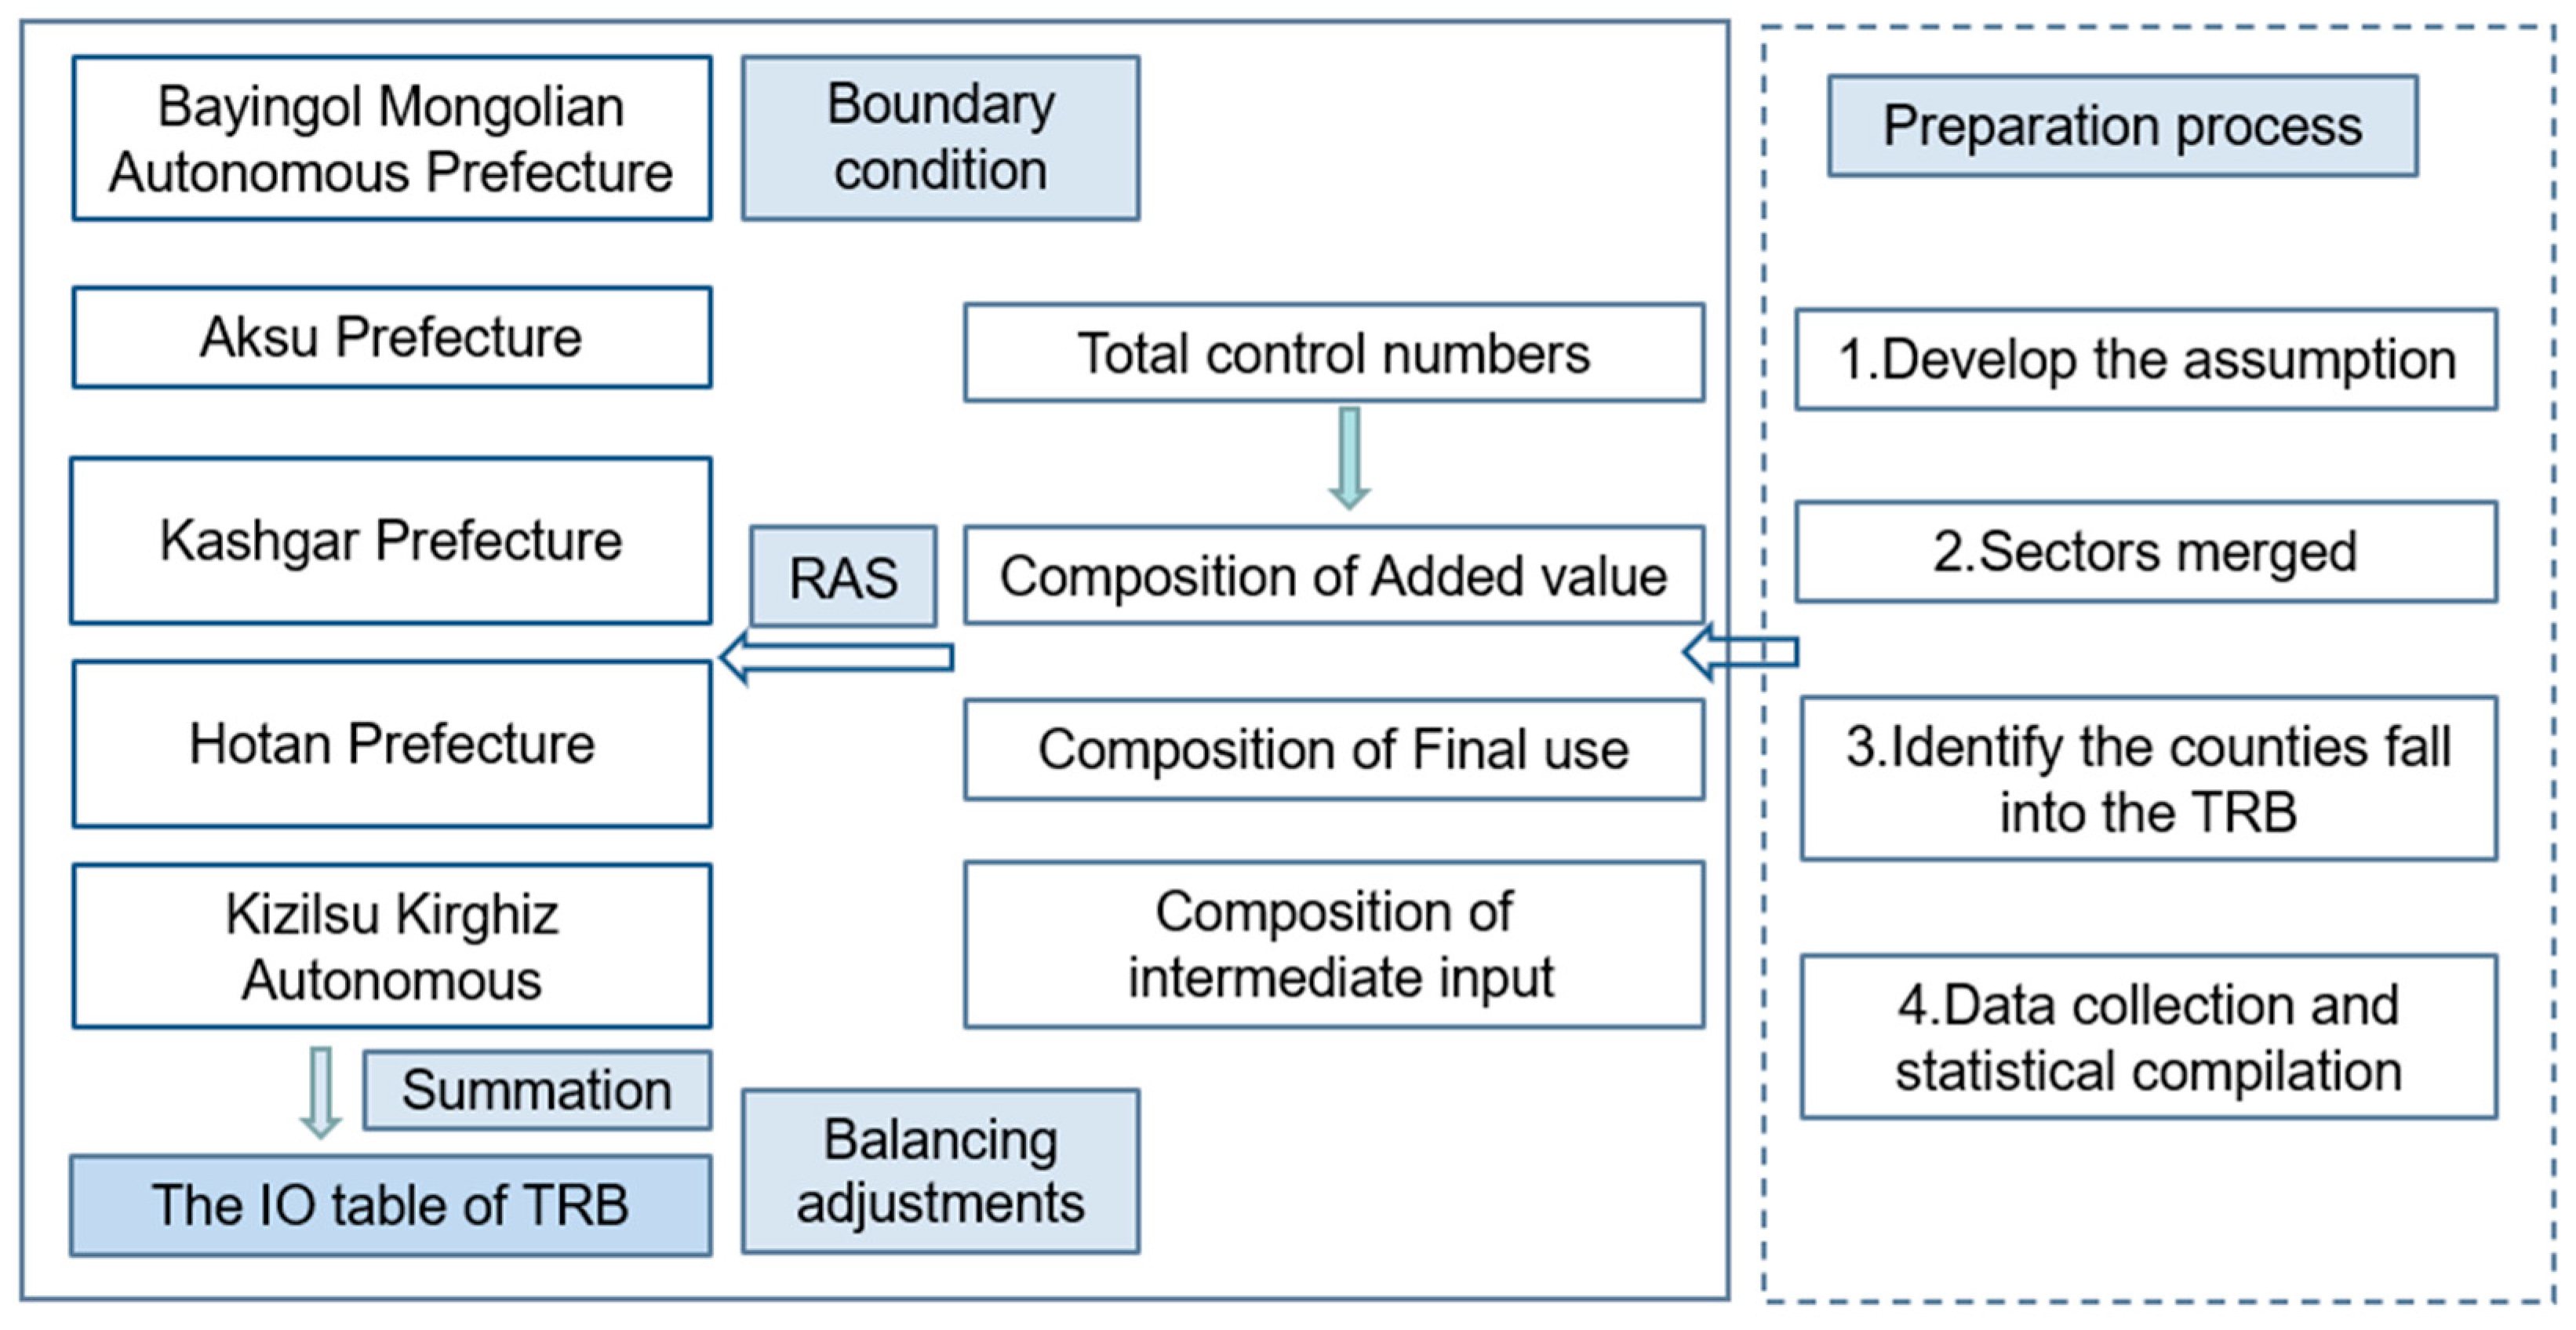
A regional IO table is the prerequisite for use of IO analysis, but an IO table of the watershed scale is always unavailable because official statistics are only provided based on the administrative unit (provincial scale) [56]. Generally, constructing a regional IO table uses two main methods, namely, survey and nonsurvey approaches [55], the former of which is generally expensive and time consuming. To address this issue, some studies have used a combination method to compile IO tables [57,58]. In this study, we used the partial survey approach to compile the IO table with 18 sectors of TRB in 2012 (Table A1). This technique requires less information than that usually obtained in survey-based IO tables. Firstly, a preparation process is needed (Figure 2, dotted box).
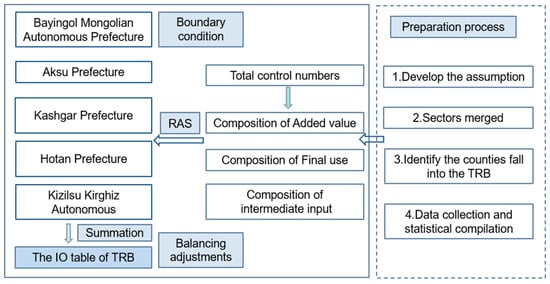
Figure 2.
The compilation procedure of 2012 TRB’s IO table.
Since there were insufficient surveys for us to ensure detailed estimates of commodity flows, the relatively strict assumption was used in the study. We supposed that intermediate input requirements are relatively stable in the analogous region (step 1). The water withdrawal data available were based on aggregated economic sectors, which differ from the sectoral classification of the provincial IO table. To eliminate this limitation, the 42 sectors presented in Xinjiang’s provincial IO table were merged into 18 sectors that can cover all the large industrial categories in the study area (step 2). Table A2 shows the comparison between the 18 sectors and the 42 sectors. The counties that fall into the TRB are identified in this paper and include five regions (step 3): Bayingol Mongolian Autonomous Prefecture, Aksu Prefecture, Kizilsu Kirghiz Autonomous, Kashgar Prefecture, and Hotan Prefecture. Although the administrative boundaries at the county level are not exactly matching the basin boundaries, they still furnish a fine proxy. Then, we collected available economic data for the sectors in five regions that aggregated at a county scale (step 4), included gross domestic product, total investment in fixed assets, and total import and export trade, known as control numbers. In this study, we chose a simplified model in which the imported products were supposed and only used to support domestic final use.
Secondly, the target adjustment method [55] was adopted to calculate the details of each quadrant (added value, final use, and intermediate input) (Figure 2). Since no statistical data were available for subsectors (except sectors of Primary, secondary, industry, construction, tertiary, transport, storage and post, wholesale, and retail), we calculated the total control numbers for each sector in regions by means of a distribution relationship between sectors in Xinjiang. The technical coefficient, which comes from the IO table of Xinjiang Province, is adjusted by using sectoral details (total control numbers) to reflect the scale of each respective sector in the study area. Afterward, we used the “RAS” method and iteration processes to balance the data to satisfy the boundary condition of each quadrant. The “RAS” method is also known as a biproportional matrix balancing technique [59,60]. The R is seen to refer to a diagonal matrix of elements modifying rows, the A to the coefficient matrix being modified, and the S to a diagonal matrix of column modifiers. In fact, it can be deemed the solution to a constrained optimization problem, such as scaling the rows and columns of the IO table in order to satisfy a set of constraints.
Finally, we merged the adjusted five regional IO tables to obtain the IO table of TRB (Figure 2).
3.3. Extension of the Water Resource Input–Output Model
The cryospheric water resources’ IO table included a standard IO transaction table that comprised the flows of goods and services among sectors and an additional row in which cryospheric water resource served as a primary input to produce the gross output of each sector.
The total snow meltwater in 2012 was calculated by aggregating the annual maximum snow water equivalent (SWE) in all grids in TRB. SWE is a comprehensive parameter that considers snow extent, density, and depth, and represents the corresponding depth of water that would result in the snow melting in place. Some studies show that the runoff coefficient of snowmelt is around 0.3–0.9 during the melting season in western China, depending on altitudes [61]. We used runoff coefficient (0.3) to calculate snowmelt runoff [20], which means that 30% of snow meltwater will be converted into surface runoff. Meanwhile, we extracted the glacier runoff simulation data in 2012 using ArcGis10.2 software and python language programming and used it to calculate glacier runoff in the entire TRB.
The Tarim River is a purely dissipation inland river in an arid region, and water resources have been developed and utilized completely. Therefore, we calculated the runoff from the glacier and snow meltwater to indicate the total quantity of meltwater withdrawal that can be applied to economic activities. Cryospheric water resources are converted into virtual water through trade and embodied in products. The term “virtual water” was first introduced by Allan as the volume of water employed in the production chain of commodities [62]. In this study, the starting point of analysis was to assess direct meltwater withdrawal intensity (DMWI) wjdc, which refers to the amount of meltwater consumed by sector j to increase its output by one monetary unit, and cwj (direct meltwater withdrawal (DMW)) denotes the amount of meltwater consumed directly by sectors j (m3) [63]. xj is the economic output of sector j in monetary units (CNY).
where cwj (direct meltwater withdrawal (DMW)) denotes the amount of meltwater consumed directly by sectors j (m3), and xj is the economic output of sector j in monetary units (CNY).
In addition to DMW, intermediate inputs are usually required by an economic sector for production processes. Consequently, cryospheric water resources are also consumed indirectly in the supply chain of producing the final products. Embodied meltwater withdrawal (EMW) represents the total meltwater consumed to produce a unit of the final products for the whole economic system. It can be calculated by multiplying the DMW by the Leontief inverse matrix [55], as shown in Equation (5).
where EMW (italic type) is the matrix of embodied meltwater withdrawal, Wd (italic type) is the matrix of DMWI, and Ydiag (italic type) is the diagonal matrix of the total final use matrix. Based on the perspective of the production end, the analysis of DMW focuses on the direct effects of various sectors in the production process, which is the assessment of producer resource responsibility, whereas the EMW indicates the influence throughout the entire production chain.
EMW = Wd × (I − A)−1 × Ydiag
4. Results
4.1. Sectoral Meltwater Withdrawal Based on Production Perspective
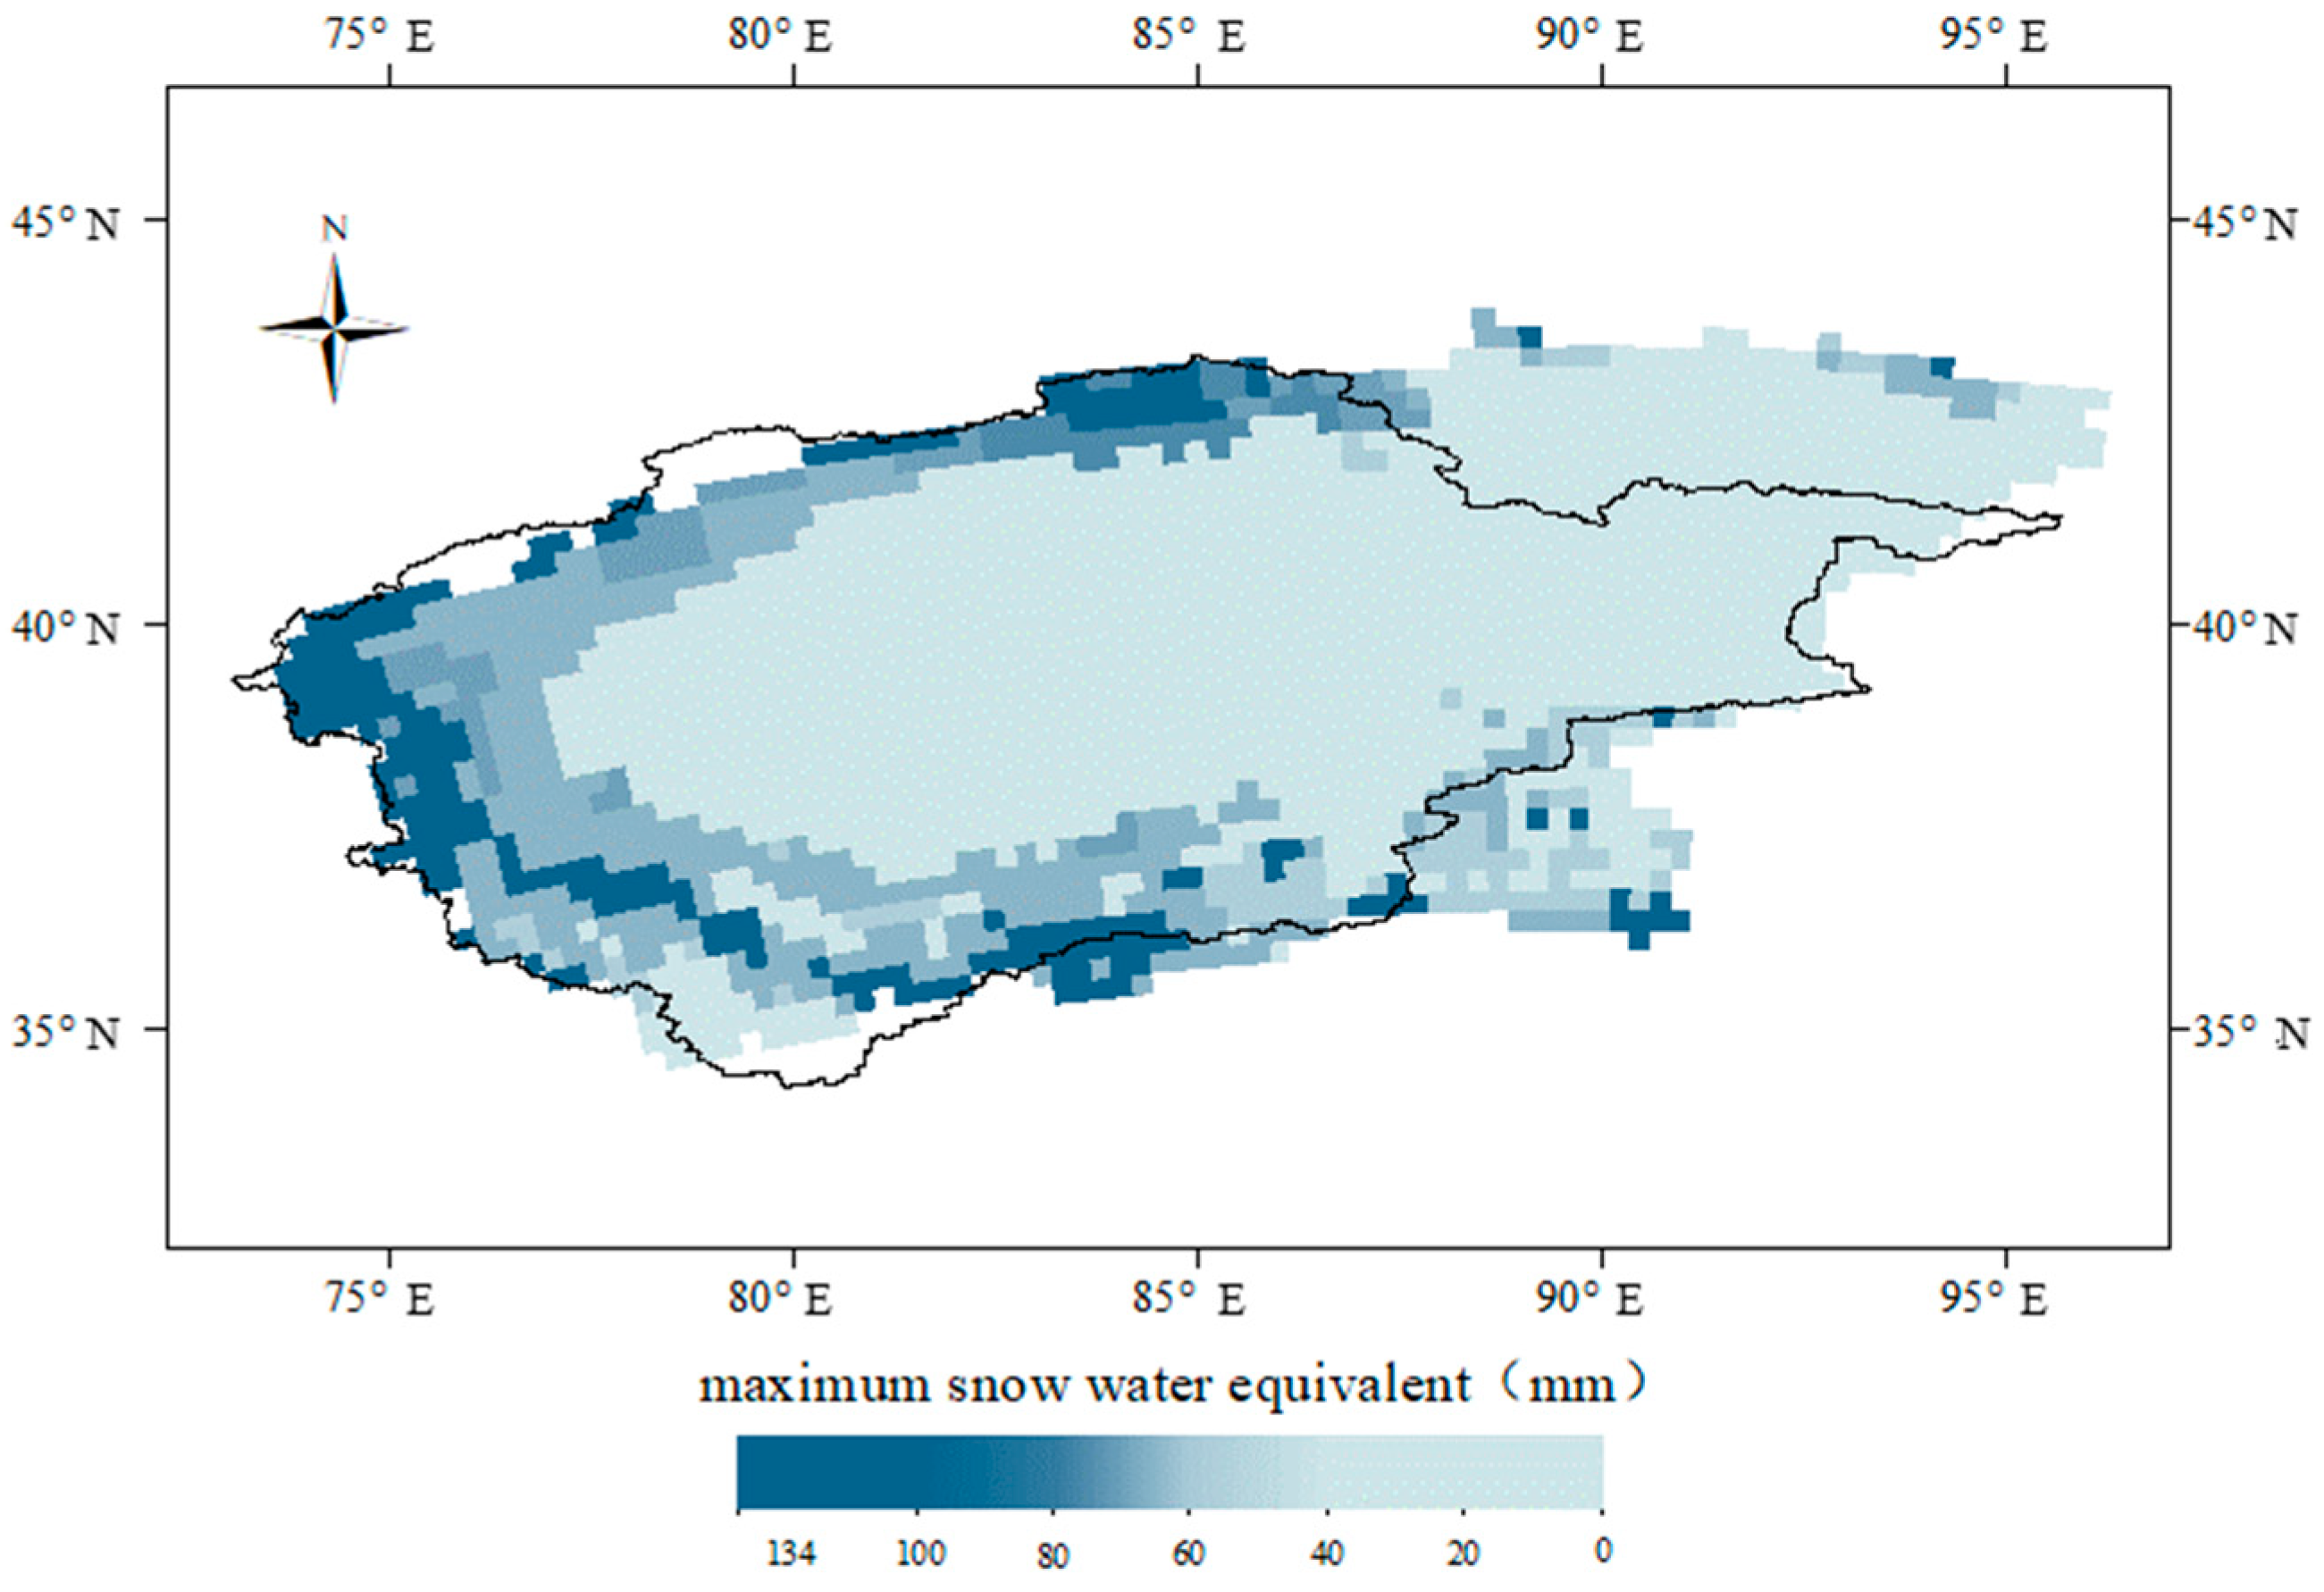
Over the whole basin, the annual total snow meltwater in 2012 (402.86 × 10⁸ m3) was calculated from the annual maximum SWE in the TRB (Figure 3). The results showed that the total amount of available water resources provided by snowmelt runoff in TRB was 120.86 × 10⁸ m3. Meanwhile, it was calculated that the total amount of available water resources provided by glacier runoff in TRB was 121 × 108 m3 in 2012.

Figure 3.
The snow water equivalent of TRB in 2012.
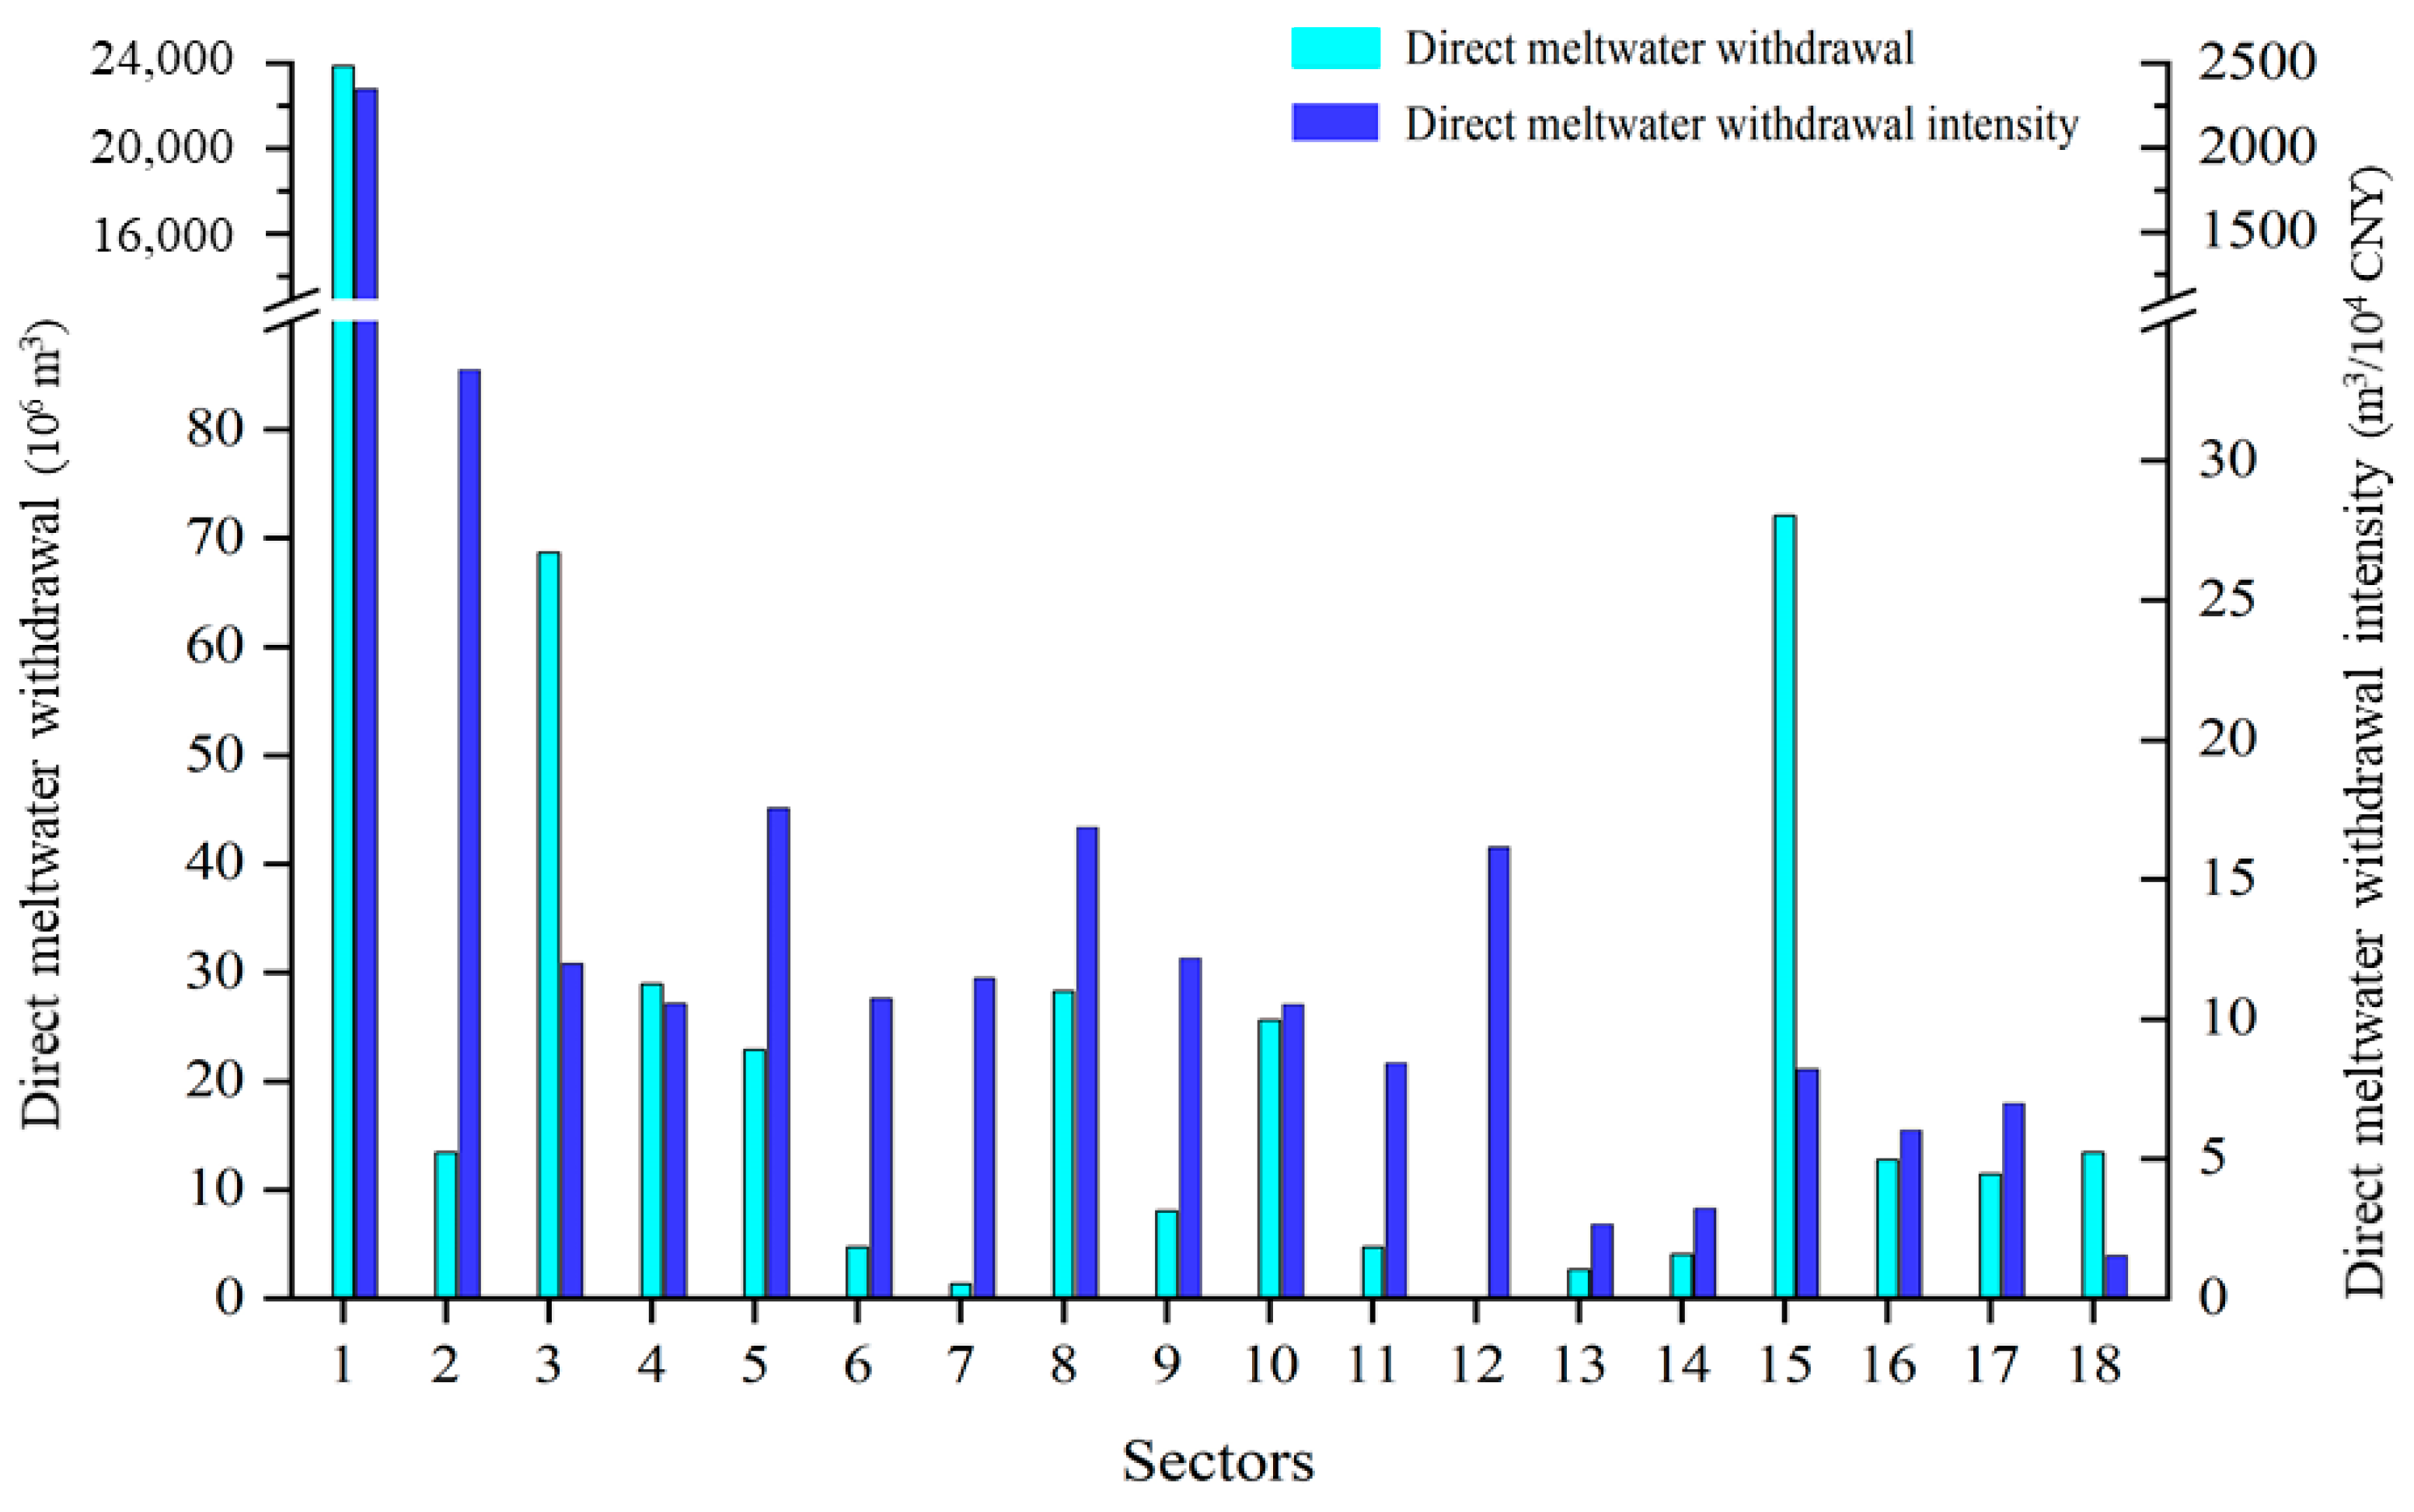
As is reflected in Figure 4, DMW of A01 (agriculture) was far more than other sectors, which was 238.62 × 10⁸ m3, accounting for 98% of total cryospheric water resources in TRB. The DMWs of A15 (construction) and A03 (extraction of petroleum and natural gas) were, respectively, 72.09 × 10⁶ m3 and 68.72 × 10⁶ m3, and DMW of other sectors was less than 40 × 106 m3. The DMWI in each sector is presented in Figure 5. The largest amount of DMWI occurred in A01 (agriculture), followed by A02 (mining and washing of coal) and A05 (processing of food). It can be found that A01 (agriculture) is significantly higher than other sectors, reaching 2348.02 m3/10,000 CNY, 70 times higher than industryA02 (mining and washing of coal).
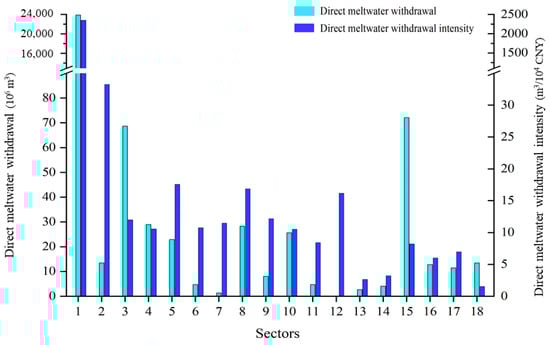
Figure 4.
Direct meltwater withdrawal and intensity of TRB’s various sectors in 2012 (the explanation of the sector code is shown in Table A1).
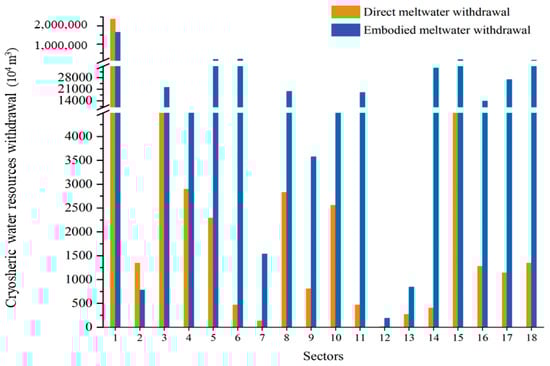
Figure 5.
The direct and embodied meltwater withdrawal of TRB’s various sectors in 2012 (the explanation of the sector code is shown in Table A1).
Based on the perspective of the production end, industry water use analysis focused on the direct effects of various sectors in the production process, i.e., the assessment of producer resource responsibility (direct withdrawal sector). It showed that the primary production sector was the main consumer of cryospheric water resources used directly in TRB. Owing to the climatic condition of the TRB, agriculture used a large volume of limited water supplies inefficiently [18]. Consequently, the increase in agricultural output had little impact on the output of other sectors, while other sectors had a greater demand for the agricultural sector, which further aggravated the pressure on local water resources because of providing “raw materials” for other industries.
4.2. Sectoral Meltwater Withdrawal Based on Consumption Perspective
The DMWI exclusively concentrates on the water intensity generated by all supply chain paths starting from this stage of production activities, whereas the EMW indicates the intensity throughout the entire production chain. Calculated by the consumption perspective, the EMWs of A01 (agriculture), A06 (manufacture of textile), A05 (processing of food), A15 (construction), and A18 (other services) were far more than other sectors (Figure 5). EMW of A01 (agriculture) was approximately 166.17 × 10⁸ m3 in 2012. This indicates that they have more intermediate demands for sectors with high water withdrawal in the manufacturing process.
Except for A01 (agriculture) and A02 (mining and washing of coal), the EMW of other sectors was greater than that of DMW. From the perspective of the consumption, direct water withdrawal pressure caused by these sectors was greater than that generated at the production end. High ratios of DMW and EMW demonstrated that the water used in production processes mainly came from the direct withdrawal of cryospheric water resources, which exacerbated the contradiction between supply and demand of water resources. Therefore, it is worth noting that the focus only on the pressure of DMW would significantly underestimate the environmental burden due to upstream production processes. This may considerably affect the decision-making processes.
4.3. Cryospheric Virtual Water Flows Embedded in Trade
Cryospheric virtual water was transferred through trade among different sectors, which significantly influenced the water use responsibility of the region. Based on our calculation (Table 2), EMW and DMW of A01 (agriculture) were 166.17 × 10⁸ m3 and 238.62 × 10⁸ m3, respectively, and net virtual water transfer (NVW) amounted to 72.45 × 10⁸ m3 in 2012, accounting for 29% of total cryospheric water resources in TRB. To identify which sectors received virtual water from A01 (agriculture), we constructed a virtual water transfer relationship (Figure 6). The results show that most virtual water resources were transferred to industries such as A06 (manufacture of textile), A05 (processing of food), A15 (construction), A18 (other services), and A14 (other manufacture).
Table 2.
The structure of gross domestic product of TRB in 2012 (million m3).
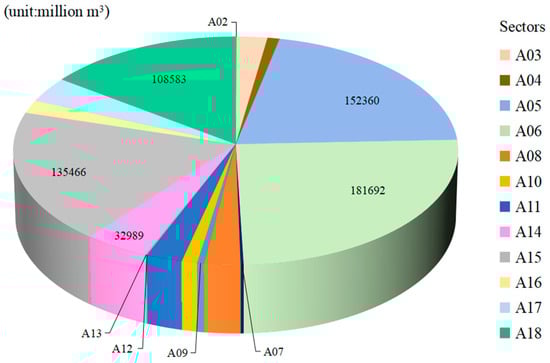
Figure 6.
The composition of each sector in virtual water transfer relationship of A01 (agriculture); the explanation of the sector code is shown in Table A1.
Meanwhile, the DMW and EMW of A02 (mining and washing of coal) were 13.47 million m3 and 7.81 million m3, respectively, which represented a total of 5.66 m3 of virtual water transferred to other sectors in the form of products (Table 2). Except for A01 (agriculture) and A02 (mining and washing of coal), the EMW of other sectors was greater than that of DMW.
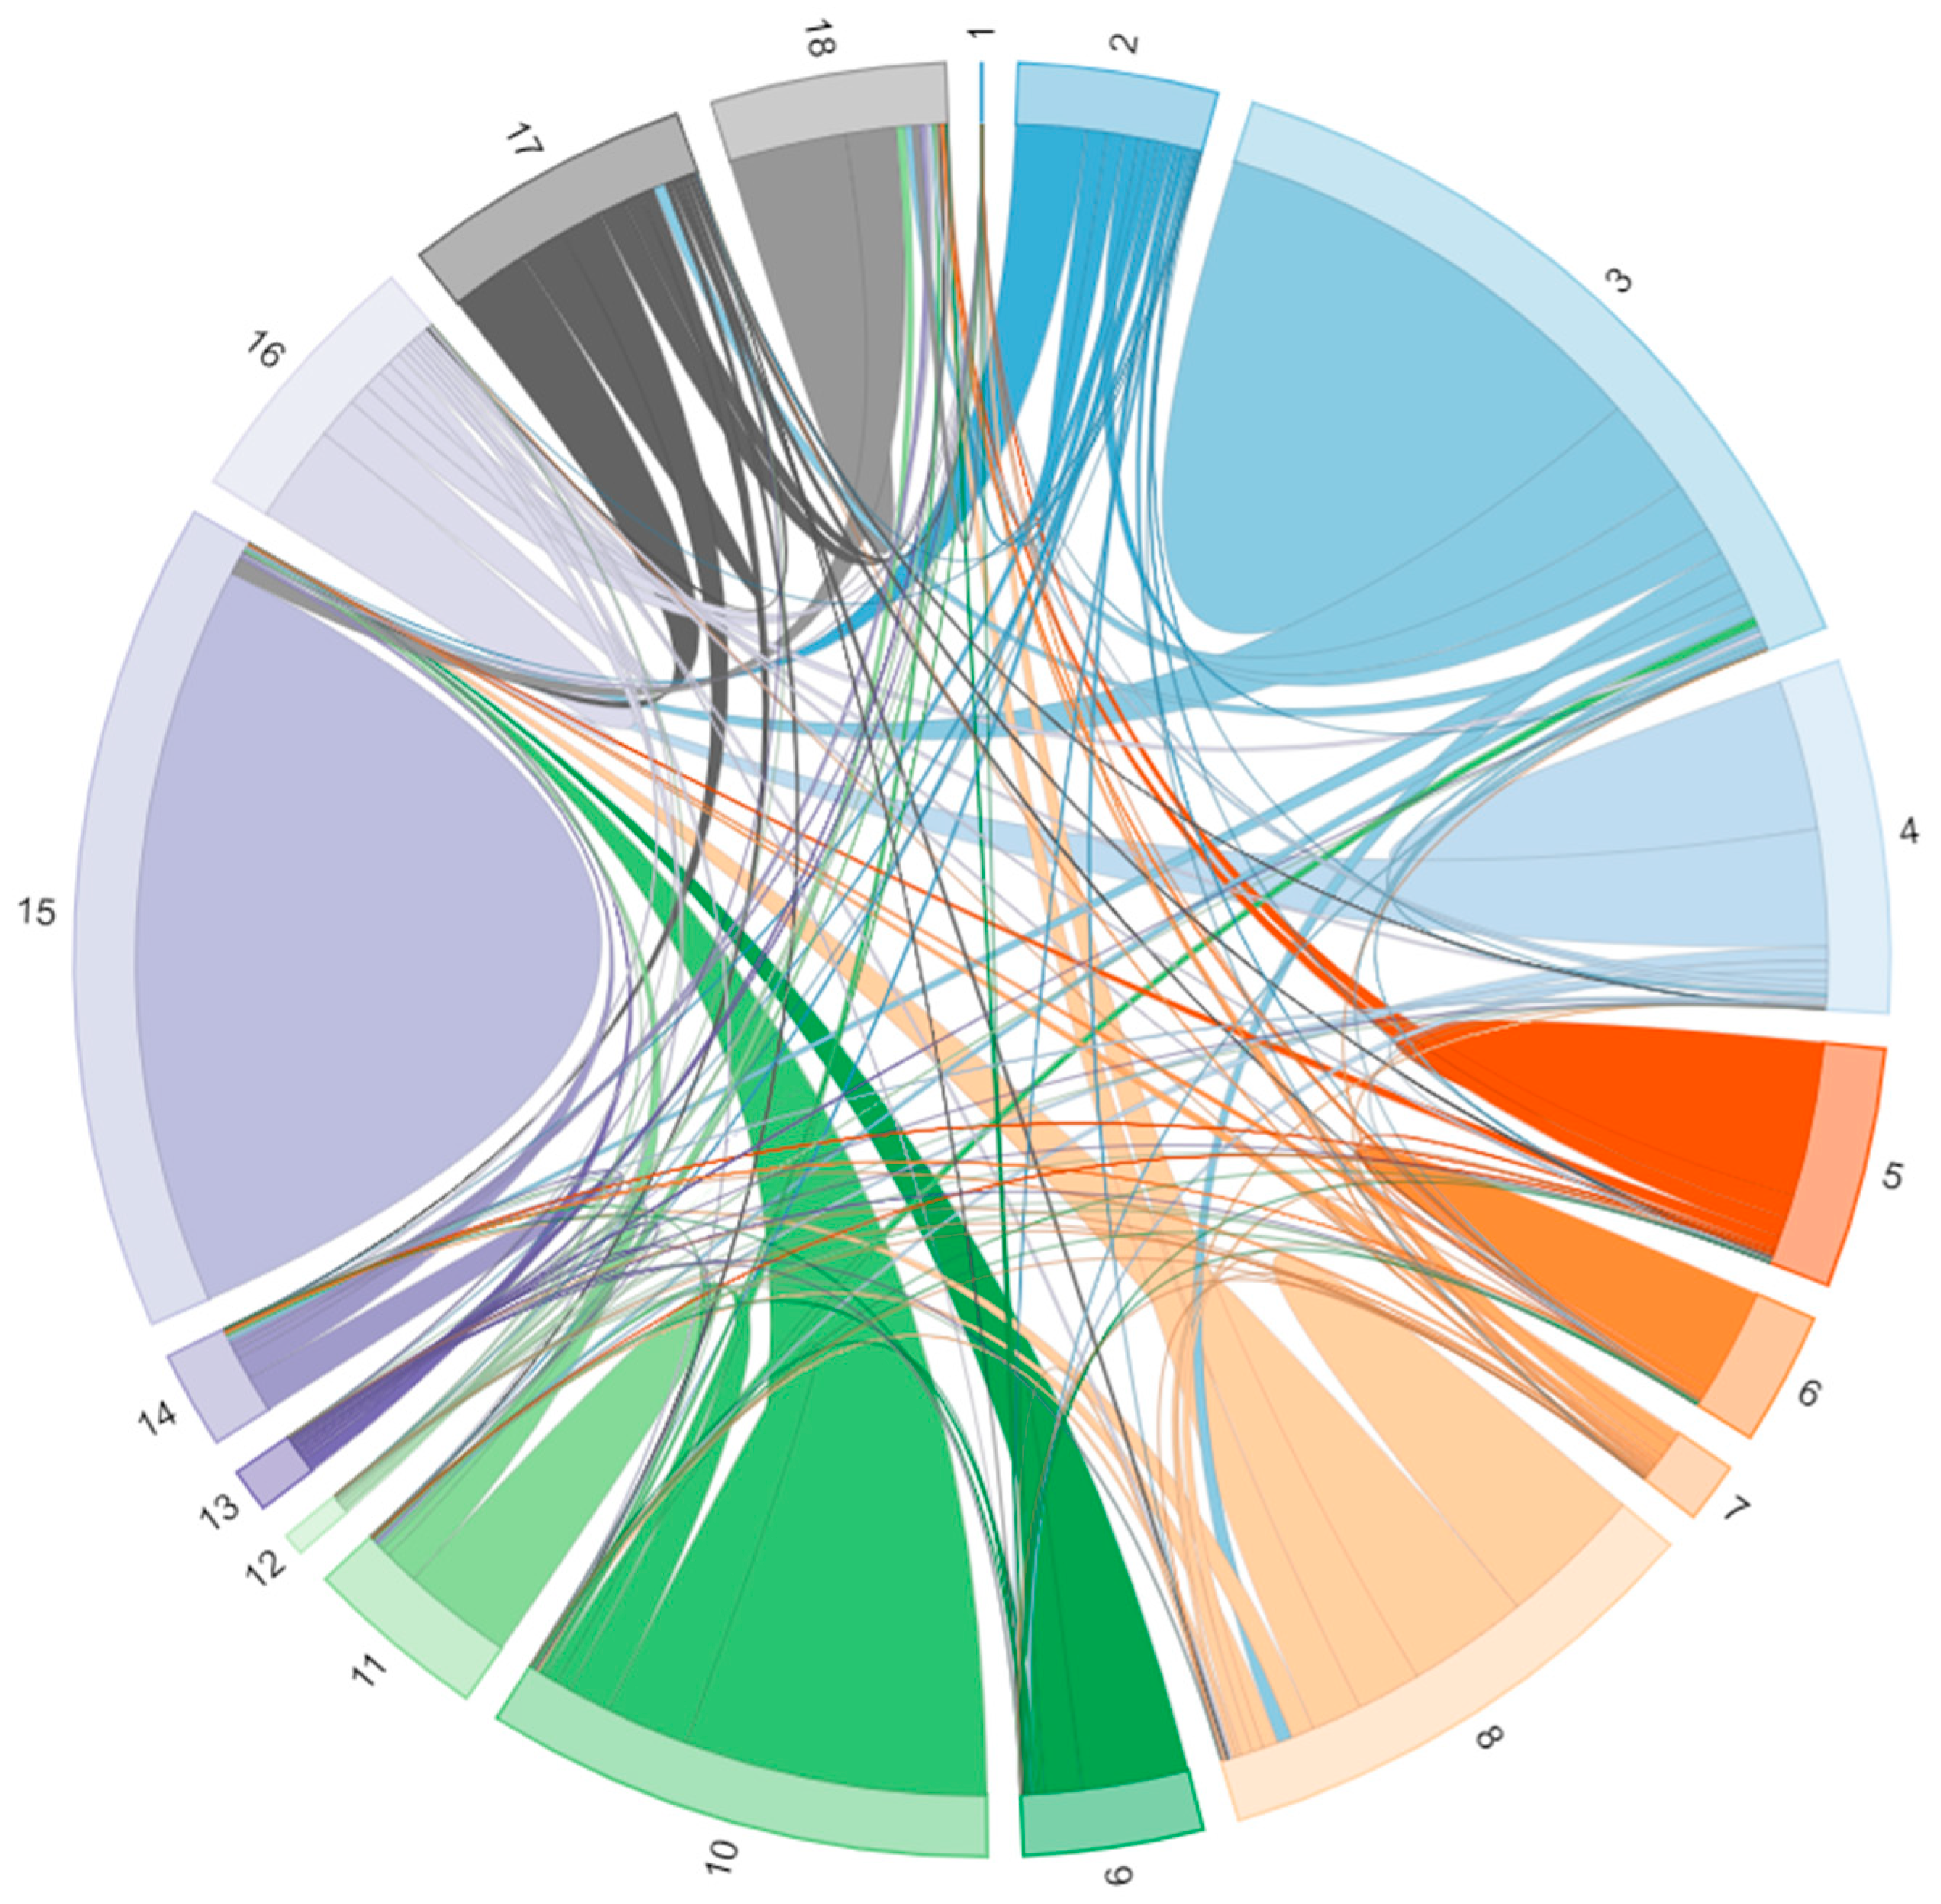
Figure 7 shows the embodied cryospheric virtual water flows and interaction between sectors in TRB (except for agriculture itself). The arc length of the outer circle represents the proportion of embodied cryospheric virtual water in total water withdrawal. Strings of the same color as the arc represent the virtual water from each sector, which indicated the pull effect between sectors. Take the virtual flows of A10 (manufacture of metal products) as an example. The width of the string represents the virtual water flow amount, and the A10′s arc is pastel green. The pastel green strings between A10 and A15 (construction) indicate that virtual water flows from A10 to A15. The results of our study showed that implicit virtual water withdrawal of some sectors mainly satisfied self-sufficiency, such as A03 (extraction of petroleum and natural gas) and A15 (construction). Particularly, the total water requirements of many secondary and tertiary sectors need a huge number of inputs from water-intensive primary sectors to produce their own products. Freely regional trade inevitably leads to virtual water flows to other sectors. To some extent, the unbalanced supply of cryospheric water resources due to geographical segregation can be regulated by virtual water flows from water-saving to water-intensive sectors.
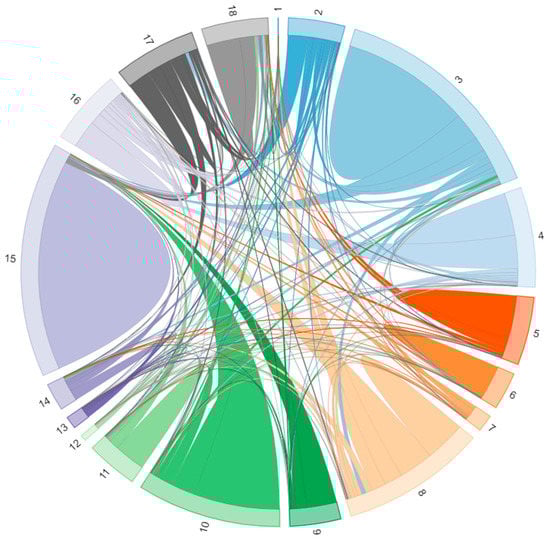
Figure 7.
The cryospheric virtual water flows and interactions between sectors in TRB (except A01, the explanation of the sector code is shown in Table A1).
5. Discussion
The cryosphere provides irreplaceable resources and services for human well-being and regional socioeconomic development [15]. As an important component of the generalized ecosystem, the function and service value of cryospheric elements have not been accounted for [1]. Cryospheric meltwater is a pivotal part of the hydrological cycle, serving as the principal source of fresh water for human beings, which guarantees to maintain the economic development of the oasis and ensure the stability of the ecosystem. The provisioning of freshwater is one of the most fundamental and important cryospheric functions. As climate change may increase the variability of hydrology in the meltwater-dominated basins, such as TRB, the non-negligible cascading effects in the interconnected climate and economic systems have to be considered.
Different from previous IO studies, our calculation considered cryospheric water resources, which are the innovation of using the IO method. We investigated cryospheric water withdrawal (direct and embodied) and virtual water transfer of sectors in 2012 based on the compiled IO table of TRB. When constructing the table, the partial-survey method, which derives the regional technical coefficients from the provincial data, was used because of the deficiency of official statistics data at the basin level. It should be acknowledged that this method is subject to uncertainties. Moreover, the aggregated sectors inevitably reduce the precision of the calculation, and the compiled IO table may not be accurate in terms of realistic economic circulation, but it still fills the gap of IO data in TRB.
Notwithstanding these limitations, this study has produced some important findings, which might help to raise the awareness of governments about cryospheric water resources management. In the next research stage, we plan to update the model data of cryospheric water resources and complete the analysis on water scarcity related to other factors, such as water price policy and employment generated by economic sectors. Given the current water imbalance and the trend for increased water demand, water management will face even greater challenges in the future.
6. Conclusions and Implications for Policy
Applying the compiled TRB IO table of the year 2012, this study established a method to analyze the relationships between economic activities and related meltwater withdrawal, as well as sectoral transfer. The hydro–economic model presented in this paper is the first attempt to compile such a model that encompasses economic data of regions in TRB and the meltwater data of the entire river basin. We quantified the sectoral meltwater withdrawals from the production-based and consumption-based perspectives, respectively, which have a significant influence on water use responsibility in TRB.
In 2012, the total amount of available water resources provided by cryospheric meltwater was 241.86 × 10⁸ m3 in TRB. Based on the production perspective, we found that the primary production sector was the main consumer of cryospheric meltwater use in TRB, and the DMW and DMWI of these sectors were also at a high level. The TRB is the principal grain-cotton- and livestock-producing area in Xinjiang, and it is more dependent on agricultural products. The results of our study showed that the DMW of the agricultural sector was far more than the industrial and services sectors, accounting for 98% of total cryospheric water resources in TRB. Especially, the DMWI was much high than other industries, reaching 2348.02 m3/10,000 CNY, with an extremely uncoordinated water withdrawal structure. However, it still transferred a large quantity of virtual water (72.45 × 10⁸ m3) to other sectors. Except for agriculture and mining and washing of coal, all sectors require inflows of virtual water for their production processes. It implies that the water use of TRB must tend toward a more water-saving direction. For sectors with high DMWI, improving resource utilization efficiency is an effective way to reduce water withdrawal.
Based on consumption perspective, high ratios of DMW and EMW demonstrated that direct water withdrawal pressure induced by sectors was greater than that generated at the production end. It highlights the importance of sectors as final producers at the end of supply chain paths. Therefore, it is worth noting that the focus only on the pressure of DMW would significantly underestimate the environmental burden due to upstream producing processes, which may considerably affect the decision-making processes.
In TRB, sectors of agriculture, manufacture of textile, processing of food, construction, and other services have more intermediate demands for sectors with high water withdrawal in the production process. For sectors with high-embodied withdrawal, raising the utilization and conversion efficiency of intermediate material input or decreasing intermediate input are the key available measures. On the contrary, some sectors’ embodied meltwater consumption mainly came from the consumption of other sectors, contributing to their downstream industries. Vigorously developing industries with high responsibility coefficient and low meltwater intensity is more conducive to the sustainable development of the regional economy, such as in the sector of transport, storage and post.
The economic development in China has been connected to the overexploitation of natural resources, especially water resources. The TRB, with its water scarcity and high reliance on cryospheric water resources, is still dedicated to producing water-intensive goods. On a deeper level, limited resources are currently highly undervalued as there are often little, or no costs associated with their withdrawal. There is a lack of understanding regarding cryospheric water resources embodied in trade, as the flow often appears indefinitely available under free supply. The results of this study reveal the non-negligible cascading effects in the interconnected sectors and urge decision makers to consider the possible economic impacts under regional supply chains.
Author Contributions
Conceptualization, Y.Y. and C.X.; Data curation, Y.Y., S.L. and C.L.; Formal analysis, Y.Y.; Funding acquisition, C.X.; Investigation, Y.Y.; Methodology, Y.Y., S.L. and C.F.; Resources, Y.Y. and C.F.; Software, Y.Y. and S.L; Supervision, C.X.; Visualization, Y.Y., S.L. and C.L.; Writing—original draft, Y.Y.; Writing—review & editing, Y.Y., S.L., C.X. and C.F. All authors have read and agreed to the published version of the manuscript.
Funding
This research was financially supported by the National Natural Science Foundation of China (Grant No. 41671058 and 41690145).
Institutional Review Board Statement
Not applicable.
Informed Consent Statement
Not applicable.
Data Availability Statement
Not applicable.
Conflicts of Interest
The authors declare no conflict of interest.
Abbreviations
| DMW | Direct meltwater withdrawal |
| EMW | Embodied meltwater withdrawal |
| NVW | net virtual water transfer |
| TII | Total intermediate input |
| TVA | Total value added |
| TI | Total input |
| TIU | Total intermediate use |
| TFU | Total final use |
| TO | Total output |
| IN | Inflow |
Appendix A
Table A1.
The 18 sectors input–output table of Tarim River Basin of 2012 Unit: 104 CNY (Data are calculated at producers’ prices in 2012).
Table A1.
The 18 sectors input–output table of Tarim River Basin of 2012 Unit: 104 CNY (Data are calculated at producers’ prices in 2012).
| I/O | A01 | A02 | A03 | A04 | A05 | A06 | A07 | A08 | A09 | A10 | A11 | A12 | A13 | A14 | A15 | A16 | A17 | A18 | TIU | TFU | IN | ER | TO |
|---|---|---|---|---|---|---|---|---|---|---|---|---|---|---|---|---|---|---|---|---|---|---|---|
| A01 | 2,695,704 | 720 | 541 | 835 | 647,585 | 232,809 | 6416 | 64,393 | 197 | 2789 | 16 | 0 | 168 | 6435 | 49,365 | 61,103 | 164,485 | 201,782 | 4,135,344 | 6,188,029 | 160,687 | 0 | 10,162,685 |
| A02 | 2542 | 4805 | 40,186 | 4938 | 2468 | 952 | 1061 | 12,191 | 19,798 | 34,284 | 249 | 7 | 153,730 | 4177 | 44,981 | 150 | 432 | 7333 | 334,283 | 76,037 | 4988 | 0 | 405,332 |
| A03 | 96,741 | 10,440 | 1,049,520 | 27,802 | 1573 | 303 | 691 | 249,685 | 12,283 | 120,876 | 3074 | 1 | 7046 | 7704 | 66,127 | 39,892 | 248,506 | 251,379 | 2,193,643 | 3,890,148 | 351,133 | 1 | 5,732,659 |
| A04 | 23703 | 24 | 313 | 456,081 | 257 | 7 | 5 | 8865 | 180,034 | 313,365 | 23 | 0 | 102 | 10,774 | 244,673 | 77,523 | 13 | 72 | 1,315,834 | 1,519,949 | 92,647 | 0 | 2,743,136 |
| A05 | 179,554 | 71 | 119 | 140 | 56,907 | 22 | 80 | 5511 | 202 | 118 | 97 | 3 | 17 | 280 | 1586 | 4986 | 11,374 | 110,178 | 371,245 | 1,064,525 | 130,383 | 0 | 1,305,386 |
| A06 | 59 | 799 | 7230 | 4586 | 1011 | 29,027 | 621 | 6824 | 2471 | 3252 | 492 | 25 | 1140 | 9232 | 27,685 | 5460 | 4065 | 39,085 | 143,062 | 1,163,775 | 867,694 | 0 | 439,144 |
| A07 | 7554 | 885 | 4423 | 2117 | 15,937 | 2041 | 29,482 | 8642 | 3501 | 973 | 709 | 30 | 1695 | 8050 | 16,434 | 5901 | 31,240 | 89,443 | 229,059 | 50,775 | 162,308 | -2 | 117,525 |
| A08 | 394,865 | 5826 | 62,551 | 16,979 | 30,848 | 6217 | 7041 | 366,184 | 14,861 | 21,142 | 14,752 | 232 | 1735 | 88,357 | 307,807 | 9366 | 3899 | 192,054 | 1,544,717 | 842,908 | 710,351 | 0 | 1,677,274 |
| A09 | 2945 | 2930 | 13,362 | 1939 | 9786 | 913 | 420 | 11,822 | 25,407 | 20,849 | 9522 | 237 | 9460 | 3640 | 748,684 | 5706 | 4925 | 23,034 | 895,583 | 372,269 | 604,582 | 0 | 663,270 |
| A10 | 367 | 8060 | 106,205 | 8721 | 1203 | 61 | 1183 | 10,188 | 5440 | 723,705 | 116,344 | 103 | 1491 | 3985 | 1,817,568 | 878 | 3381 | 17,232 | 2,826,116 | 701,053 | 1,094,291 | 0 | 2,432,878 |
| A11 | 39,116 | 7729 | 27,345 | 22,641 | 1129 | 941 | 354 | 4194 | 6967 | 10,576 | 91,122 | 150 | 12,590 | 5315 | 235,726 | 2817 | 12,312 | 81,247 | 562,272 | 1,394,600 | 1,396,933 | 0 | 559,939 |
| A12 | 321 | 708 | 9239 | 1024 | 1327 | 96 | 42 | 2209 | 559 | 665 | 1269 | 235 | 1229 | 11,964 | 5269 | 581 | 396 | 23,326 | 60,460 | 30,262 | 82,381 | 0 | 8341 |
| A13 | 110,036 | 20,446 | 60,218 | 13,314 | 14,067 | 20,437 | 4031 | 81,285 | 26,108 | 114,727 | 5770 | 122 | 131,613 | 89,372 | 65,427 | 19,555 | 12,608 | 122,758 | 911,891 | 103,316 | 2 | 0 | 1,015,205 |
| A14 | 140,385 | 12,006 | 108,888 | 8150 | 10,626 | 2604 | 3649 | 46,274 | 2506 | 132,901 | 31,438 | 431 | 23,314 | 20,891 | 216,029 | 172,682 | 10,729 | 196,541 | 1,140,045 | 1,381,182 | 1,267,713 | 0 | 1,253,515 |
| A15 | 2065 | 1050 | 2922 | 1654 | 1116 | 237 | 108 | 1373 | 732 | 2365 | 166 | 13 | 9291 | 11,351 | 571,098 | 15,686 | 50,327 | 197,160 | 868,714 | 10,730,251 | 2,811,224 | 0 | 8,787,741 |
| A16 | 312,836 | 17,083 | 236,327 | 206,143 | 57,941 | 17,227 | 7021 | 120,816 | 57,011 | 220,468 | 49,135 | 183 | 66,343 | 17,044 | 825,184 | 28,716 | 85,729 | 219,865 | 2,545,071 | 838,061 | 1,254,760 | 0 | 2,128,371 |
| A17 | 162,560 | 20,952 | 100,983 | 38,044 | 41,934 | 17,106 | 6185 | 59,444 | 20,292 | 102,633 | 30,168 | 187 | 5676 | 577,946 | 318,429 | 115,589 | 91,643 | 185,409 | 1,895,179 | 746,795 | 1,000,687 | 0 | 1,641,288 |
| A18 | 204,399 | 69,516 | 376,967 | 21,9476 | 65,973 | 15,824 | 9738 | 141,147 | 101,149 | 256,326 | 102,817 | 797 | 191,323 | 153,173 | 1,152,262 | 419,184 | 246,566 | 1,774,835 | 5,501,472 | 7,405,827 | 4,053,541 | 0 | 8,853,758 |
| TII | 4,375,753 | 184,049 | 2,207,338 | 1,034,584 | 961,686 | 346,825 | 78,129 | 1,201,047 | 479,518 | 2,082,011 | 457,165 | 2757 | 617,963 | 1,029,691 | 6,714,335 | 985,774 | 982,628 | 3,732,735 | 27,473,990 | 38,499,763 | 16,046,306 | 2 | 49,927,449 |
| VA | 5,786,932 | 221,283 | 3,525,321 | 1,708,552 | 343,700 | 92,319 | 39,396 | 476,227 | 183,752 | 350,867 | 102,774 | 5584 | 397,242 | 223,824 | 2,073,406 | 1,142,597 | 658,660 | 5,121,023 | 22,453,459 | ||||
| TI | 10,162,685 | 405,332 | 5,732,659 | 2,743,136 | 1,305,386 | 439,144 | 117,525 | 1,677,274 | 663,270 | 2,432,878 | 559,939 | 8341 | 1,015,205 | 1,253,515 | 8,787,741 | 2,128,371 | 1,641,288 | 8,853,758 | 49,927,449 |
Appendix B
Table A2.
Sector’s classification adjustment.
Table A2.
Sector’s classification adjustment.
| Code | Aggregated 18 Sectors | 42 Sectors in the Original IO Table |
|---|---|---|
| A01 | Agriculture | Agriculture, forestry, animal husbandry, and fishery |
| A02 | Mining and washing of coal | Mining and washing of coal |
| A03 | Extraction of Petroleum and Natural Gas | Extraction of crude petroleum and natural gas; Processing of refined petroleum, coking products, processing of nuclear fuel; Production and distribution of gas |
| A04 | Other Mining industry | Mining and metal ores; Mining and quarrying of nonmetal ores and other ores |
| A05 | Processing of Food | Manufacture of food and tobacco |
| A06 | Manufacture of Textile | Manufacture of textiles; Manufacture of textile wearing apparel, footwear, caps, leather, fur, feather, and its products |
| A07 | Manufacture of Paper and Paper Products | Paper making, printing, and manufacture of articles for culture, education and sports activities; |
| A08 | Manufacture of Chemical Products | Manufacture of chemicals and chemical products |
| A09 | Manufacture of Building materials | Manufacture of nonmetallic mineral products |
| A10 | Manufacture of Metal products | Manufacture of processing of metals; Manufacture of fabricated metal products, expect machinery, and equipment |
| A11 | Manufacture of Machinery and Equipment | Manufacture of general-purpose machinery; Manufacture of special-purpose machinery; Manufacture of transport equipment; Manufacture of electrical machinery and apparatus |
| A12 | Manufacture of Electron and instrument | Manufacture of communication equipment, computer, and other electronic equipment; Manufacture of measuring instruments; Repair of fabricated metal products, machinery, and equipment |
| A13 | Electric power | Production and supply of electricity and steam |
| A14 | Other Manufacture | Processing of timber and manufacture of furniture; Other manufacture; Scrap and waste; Production and distribution of water |
| A15 | Construction | Construction |
| A16 | Wholesale, Retail Trade and Hotel, Restaurants | Wholesale and retail trade |
| A17 | Transport, Storage, and Post | Transport, storage, and post |
| A18 | Other services | Information transmission, software, and information technology services; Finance; Real estate; Accommodation, food, and beverage services; Management of water conservancy, environment, and public facilities; Renting and leasing, business services; Scientific research and development, technical services; Services to households, repair, and other services; Education; Healthcare and social work activities; Culture, sports, and entertainment; Public management, social security, and social organization |
References
- Qin, D.; Ding, Y.; Xiao, C.; Kang, S.; Ren, J.; Yang, J.; Zhang, S. Cryospheric Science: Research framework and disciplinary system. Natl. Sci. Rev. 2018, 5, 255–268. [Google Scholar] [CrossRef] [Green Version]
- Qin, D.; Ding, Y. Cryospheric Changes and Their Impacts: Present, Trends and Key Issues. Adv. Clim. Chang. Res. 2009, 5, 187–195. [Google Scholar] [CrossRef]
- Barnett, T.P.; Adam, J.C.; Lettenmaier, D.P. Potential impacts of a warming climate on water availability in snow-dominated regions. Nature 2005, 438, 303–309. [Google Scholar] [CrossRef] [PubMed]
- Immerzeel, W.W.; Bierkens, M.F.P. Asia’s water balance. Nat. Geosci. 2012, 5, 841–842. [Google Scholar] [CrossRef]
- IPCC. Summary for policymakers. In IPCC Special Report on the Ocean and Cryosphere in a Changing Climate; Pörtner, H.O., Roberts, D.C., Masson-Delmotte, V., Zhai, P., Tignor, M., Poloczanska, E., Mintenbeck, K., Alegría, A., Nicolai, M., Okem, A., et al., Eds.; IPCC: Geneva, Switzerland, 2019. [Google Scholar]
- Kunkel, K.E.; Robinson, D.A.; Champion, S.; Yin, X.; Estilow, T.; Frankson, R.M. Trends and Extremes in Northern Hemisphere Snow Characteristics. Curr. Clim. Chang. Rep. 2016, 2, 65–73. [Google Scholar] [CrossRef] [Green Version]
- Brown, R.D.; Robinson, D.A. Northern Hemisphere spring snow cover variability and change over 1922–2010 including an assessment of uncertainty. Cryosphere 2011, 5, 219–229. [Google Scholar] [CrossRef] [Green Version]
- Bliss, A.; Hock, R.; Radic, V. Global response of glacier runoff to twenty-first century climate change. J. Geophys. Res. Earth Surf. 2014, 119, 717–730. [Google Scholar] [CrossRef]
- Gao, X.; Ye, B.; Zhang, S.; Qiao, C.; Zhang, X. Glacier runoff variation and its influence on river runoff during 1961–2006 in the Tarim River Basin, China. Sci. China Earth Sci. 2010, 53, 880–891. [Google Scholar] [CrossRef]
- Zhong, Z.; Li, X.; Xu, X.; Liu, X.; He, Z. Spatial-temporal variations analysis of snow cover in China from 1992–2010. Chin. Sci. Bull. 2018, 63, 2641–2654. [Google Scholar] [CrossRef] [Green Version]
- Huss, M.; Hock, R. Global-scale hydrological response to future glacier mass loss. Nat. Clim. Chang. 2018, 8, 135–140. [Google Scholar] [CrossRef] [Green Version]
- Livneh, B.; Badger, A.M. Drought less predictable under declining future snowpack. Nat. Clim. Chang. 2020, 10, 452–458. [Google Scholar] [CrossRef]
- Biemans, H.; Siderius, C.; Lutz, A.F.; Nepal, S.; Ahmad, B.; Hassan, T.; von Bloh, W.; Wijngaard, R.R.; Wester, P.; Shrestha, A.B.; et al. Importance of snow and glacier meltwater for agriculture on the Indo-Gangetic Plain. Nat. Sustain. 2019, 2, 594–601. [Google Scholar] [CrossRef]
- Qin, Y.; Abatzoglou, J.T.; Siebert, S.; Huning, L.S.; AghaKouchak, A.; Mankin, J.S.; Hong, C.; Tong, D.; Davis, S.J.; Mueller, N.D. Agricultural risks from changing snowmelt. Nat. Clim. Chang. 2020, 10, 459–465. [Google Scholar] [CrossRef]
- Cunde, X.; Bo, S.; Xiaoming, W.; Dahe, Q. Cascading risks to the deterioration in cryospheric functions and services. ChSBu. 2019, 64, 1975–1984. [Google Scholar]
- Wang, X.; Liu, S.-W.; Zhang, J.-L. A new look at roles of the cryosphere in sustainable development. Adv. Clim. Chang. Res. 2019, 10, 124–131. [Google Scholar] [CrossRef]
- Yang, Y.; Wu, X.-J.; Liu, S.-W.; Xiao, C.-D.; Wang, X. Valuating service loss of snow cover in Irtysh River Basin. Adv. Clim. Chang. Res. 2019, 10, 109–114. [Google Scholar] [CrossRef]
- Xu, Z.X.; Chen, Y.N.; Li, J.Y. Impact of climate change on water resources in the Tarim River basin. Water Resour. Manag. 2004, 18, 439–458. [Google Scholar] [CrossRef]
- Sturm, M.; Goldstein, M.A.; Parr, C. Water and life from snow: A trillion dollar science question. Water Resour. Res. 2017, 53, 3534–3544. [Google Scholar] [CrossRef]
- Wu, X.; Wang, X.; Liu, S.; Yang, Y.; Xu, G.; Xu, Y.; Jiang, T.; Xiao, C. Snow cover loss compounding the future economic vulnerability of western China. Sci. Total Environ. 2021, 755, 143025. [Google Scholar] [CrossRef]
- Xu, C.; Chen, Y.; Hamid, Y.; Tashpolat, T.; Chen, Y.; Ge, H.; Li, W. Long-term change of seasonal snow cover and its effects on river runoff in the Tarim River basin, northwestern China. Hydrol. Process 2009, 23, 2045–2055. [Google Scholar] [CrossRef]
- Burakowski, E.; Magnusson, M. Climate Impacts on the Winter Tourism Economy in the United States; University of New Hampshire: Durham, NH, USA, 2012. [Google Scholar]
- Thayyen, R.J.; Gergan, J.T. Role of glaciers in watershed hydrology: A preliminary study of a “Himalayan catchment”. Cryosphere 2010, 4, 115–128. [Google Scholar] [CrossRef] [Green Version]
- Kaser, G.; Grosshauser, M.; Marzeion, B. Contribution potential of glaciers to water availability in different climate regimes. Proc. Natl. Acad. Sci. USA 2010, 107, 20223–20227. [Google Scholar] [CrossRef] [Green Version]
- Immerzeel, W.W.; Lutz, A.F.; Andrade, M.; Bahl, A.; Biemans, H.; Bolch, T.; Hyde, S.; Brumby, S.; Davies, B.J.; Elmore, A.C.; et al. Importance and vulnerability of the world’s water towers. Nature. 2020, 577, 364. [Google Scholar] [CrossRef]
- Liang, S.; Xu, M.; Suh, S.; Tan, R. Unintended Environmental Consequences and Co-benefits of Economic Restructuring. Environ. Sci. Technol. 2013, 47, 12894–12902. [Google Scholar] [CrossRef] [PubMed]
- Yang, X.; Wang, Y.; Sun, M.; Wang, R.; Zheng, P. Exploring the environmental pressures in urban sectors: An energy-water-carbon nexus perspective. Appl Energy 2018, 228, 2298–2307. [Google Scholar] [CrossRef]
- Shan, G.; Shen, G.Q. Multiregional input-output model for China’s farm land and water use. Environ. Sci. Technol. 2014, 49, 403–414. [Google Scholar] [CrossRef]
- Liu, S.; Wu, X.; Han, M.; Zhang, J.; Chen, B.; Wu, X.; Wei, W.; Li, Z. A three-scale input-output analysis of water use in a regional economy: Hebei province in China. J. Clean Prod. 2017, 156, 962–974. [Google Scholar] [CrossRef]
- Bogra, S.; Bakshi, B.R.; Mathur, R. A Water-Withdrawal Input-Output Model of the Indian Economy. Environ. Sci. Technol. 2016, 50, 1313–1321. [Google Scholar] [CrossRef] [PubMed]
- Dalin, C.; Konar, M.; Hanasaki, N.; Rinaldo, A.; Rodriguez-Iturbe, I. Evolution of the global virtual water trade network. Proc. Natl. Acad. Sci. USA 2012, 109, 5989–5994. [Google Scholar] [CrossRef] [Green Version]
- Tian, G.; Han, X.; Zhang, C.; Li, J.; Liu, J. Virtual Water Flows Embodied in International and Interprovincial Trade of Yellow River Basin: A Multiregional Input-Output Analysis. Sustainability 2020, 12, 1251. [Google Scholar] [CrossRef] [Green Version]
- Zhao, X.; Liu, J.; Liu, Q.; Tillotson, M.R.; Guan, D.; Hubacek, K. Physical and virtual water transfers for regional water stress alleviation in China. Proc. Natl. Acad. Sci. USA 2015, 112, 1031–1035. [Google Scholar] [CrossRef] [Green Version]
- Feng, K.; Siu, Y.L.; Guan, D.; Hubacek, K. Assessing regional virtual water flows and water footprints in the Yellow River Basin, China: A consumption based approach. Appl. Geogr. 2012, 32, 691–701. [Google Scholar] [CrossRef]
- Lenzen, M.; Moran, D.; Bhaduri, A.; Kanemoto, K.; Bekchanov, M.; Geschke, A.; Foran, B. International trade of scarce water. Ecol. Econ. 2013, 94, 78–85. [Google Scholar] [CrossRef]
- Feng, K.; Hubacek, K.; Pfister, S.; Yu, Y.; Sun, L. Virtual Scarce Water in China. Environ. Sci. Technol. 2014, 48, 7704–7713. [Google Scholar] [CrossRef]
- Qu, S.; Liang, S.; Konar, M.; Zhu, Z.; Chiu, A.S.F.; Jia, X.; Xu, M. Virtual Water Scarcity Risk to the Global Trade System. Environ. Sci. Technol. 2018, 52, 673–683. [Google Scholar] [CrossRef]
- Liang, S.; Qu, S.; Xu, M. Betweenness-Based Method to Identify Critical Transmission Sectors for Supply Chain Environmental Pressure Mitigation. Environ. Sci. Technol. 2016, 50, 1330–1337. [Google Scholar] [CrossRef] [PubMed]
- Qasemipour, E.; Abbasi, A.; Tarahomi, F. Water-Saving Scenarios Based on Input-Output Analysis and Virtual Water Concept: A Case in Iran. Sustainability 2020, 12, 818. [Google Scholar] [CrossRef] [Green Version]
- Chen, Y.; Xu, C.; Hao, X.; Li, W.; Zhu, C.; Ye, Z. Fifty-year climate change and its effect on annual runoff in the Tarim River Basin, China. J. Quat. Int. 2009, 208, 53–61. [Google Scholar] [CrossRef]
- Xu, Z.; Liu, Z.; Fu, G.; Chen, Y. Trends of major hydroclimatic variables in the Tarim River basin during the past 50 years. J. Arid Environ. 2010, 74, 256–267. [Google Scholar] [CrossRef]
- Liu, S.; Yao, X.; Guo, W.; Xu, J.; Shangguan, D.; Wei, J.; Bao, W.; Wu, L. The contemporary glaciers in China based on the Second Chinese Glacier Inventory. Acta Geogr. Sin. 2015, 70, 3–16. [Google Scholar]
- Liu, S.Y.; Ding, Y.J.; Shangguan, D.H.; Zhang, Y.; Han, H.; Wang, J.; Xie, C. Glacier retreat as a result of climate warming and increased precipitation in the Tarim river basin, northwest china. Ann. Glaciol. 2006, 43, 91–96. [Google Scholar] [CrossRef] [Green Version]
- National Bureau of Statistics. Chinese Regional Input-Output Tables-2012; China Statistics Press: Beijing, China, 2012. [Google Scholar]
- Department of Rural Surveys National Bureau of Statistics. China Country Statistical Yearbook-2012; China Statistical Press: Beijing, China, 2012. [Google Scholar]
- Statistics Bureau of Xinjiang. Xinjiang Statistical Yearbook-2012; China Statistical Press: Beijing, China, 2012. [Google Scholar]
- Statistics Bureau of Xinjiang. Xinjiang Water Resources Bulletin 2012; National Tibetan Plateau Data Center: Beijing, China, 2019. [Google Scholar]
- Chen, W.; Wu, S.; Lei, Y.; Li, S. Virtual water export and import in china’s foreign trade: A quantification using input-output tables of China from 2000 to 2012. Resour. Conserv. Recycl. 2018, 132, 278–290. [Google Scholar] [CrossRef]
- Pulliainen, J.; Luojus, K.; Derksen, C.; Mudryk, L.; Lemmetyinen, J.; Salminen, M.; Ikonen, J.; Takala, M.; Cohen, J.; Smolander, T.; et al. Patterns and trends of Northern Hemisphere snow mass from 1980 to 2018. Nature 2020, 581, 294. [Google Scholar] [CrossRef]
- Rounce, D.R.; Hock, R.; Shean, D.E. Glacier Mass Change in High Mountain Asia Through 2100 Using the Open-Source Python Glacier Evolution Model (PyGEM). Front. Earth Sci. 2020, 7, 7. [Google Scholar] [CrossRef] [Green Version]
- Rounce, D.R.; Khurana, T.; Short, M.B.; Hock, R.; Shean, D.E.; Brinkerhoff, D.J. Quantifying parameter uncertainty in a large-scale glacier evolution model using Bayesian inference: Application to High Mountain Asia. J. Glaciol. 2020, 66, 175–187. [Google Scholar] [CrossRef] [Green Version]
- Leontief, W. Quantitative input-output relations in the economic system of the United States. Rev. Econ. Stat. 1936, 18, 105–125. [Google Scholar] [CrossRef] [Green Version]
- Leontief, W. The Structure of American Economy, 1919–1939; Harvard University Press: Cambridge, MA, USA, 1941. [Google Scholar] [CrossRef]
- Leontief, W. Structure of the world economy: Outline of a simple input-output formulation. Am. Econ. Rev. 1974, 64, 823–834. [Google Scholar] [CrossRef]
- Lahr, M.L. Input-output analysis: Foundations and extensions, 2nd ed. Environ. Plan. B Plan. Des. 2010, 37, 382–383. [Google Scholar]
- Eamen, L.; Brouwer, R.; Razavi, S. The economic impacts of water supply restrictions due to climate and policy change: A transboundary river basin supply-side input-output analysis. Ecol. Econ. 2020, 172, 106532. [Google Scholar] [CrossRef]
- Liu, J.; Zhao, X.; Yang, H.; Liu, Q.; Xiao, H.; Cheng, G. Assessing China’s “developing a water-saving society” policy at a river basin level: A structural decomposition analysis approach. J. Clean Prod. 2018, 190, 799–808. [Google Scholar] [CrossRef]
- Zhao, X.; Yang, H.; Yang, Z.; Chen, B.; Qin, Y. Applying the input-output method to account for water footprint and virtual water trade in the Haihe River basin in China. Environ. Sci. Technol. 2010, 44, 9150–9156. [Google Scholar] [CrossRef]
- Temurshoev, U.; Yamano, N.; Webb, C. Projection of supply and use tables: Methods and their empirical assessment. Econ. Syst. Res. 2011, 23, 91–123. [Google Scholar] [CrossRef]
- Lenzen, M.; Cecilia, P.; Geschke, A.; Kanemoto, K.; Moran, D. A cycling method for constructing input-output table time series from incomplete data. Econ. Syst. Res. 2012, 24, 413–432. [Google Scholar] [CrossRef]
- Li, H.; Li, X.; Yang, D.; Wang, J.; Gao, B.; Pan, X.; Zhang, Y.; Hao, X. Tracing Snowmelt Paths in an Integrated Hydrological Model for Understanding Seasonal Snowmelt Contribution at Basin Scale. J. Geophys. Res. Atmos. 2019, 124, 8874–8895. [Google Scholar] [CrossRef]
- Allan, J.A. Fortunately there are substitutes for water otherwise our hydro-political futures would be impossible. Priorities Water Resour. Alloc. Manag. 1993, 13, 26. [Google Scholar] [CrossRef]
- Miller, R.E.; Blair, P.D. Input-Output Analysis: Foundations and Extensions; Cambridge University Press: Cambridge, MA, USA, 2009. [Google Scholar]


Publisher’s Note: MDPI stays neutral with regard to jurisdictional claims in published maps and institutional affiliations. |
© 2021 by the authors. Licensee MDPI, Basel, Switzerland. This article is an open access article distributed under the terms and conditions of the Creative Commons Attribution (CC BY) license (https://creativecommons.org/licenses/by/4.0/).