Article

Bibliometric Analysis of SARS, MERS, and COVID-19 Studies from India and Connection to Sustainable Development Goals

1
Amrita School of Engineering, Amritapuri Campus, Amrita Vishwa Vidyapeetham, Kerala 690525, India
2
KTH Engineering Mechanics, 100 44 Stockholm, Sweden
*
Authors to whom correspondence should be addressed.
Sustainability 2021, 13(14), 7555; https://doi.org/10.3390/su13147555
Submission received: 8 June 2021 / Revised: 30 June 2021 / Accepted: 3 July 2021 / Published: 6 July 2021

Abstract

:
India is ranked fifth in the world in terms of COVID-19 publications accounting for 6.7% of the total. About 60% of the COVID-19 publications in the year 2020 are from United States, China, UK, Italy, and India. We present a bibliometric analysis of the publication trends and citation structure along with the identification of major research clusters. By performing network analysis of authors, citations, institutions, keywords, and countries, we explore semantic associations by applying visualization techniques. Our study shows lead taken by the United States, China, UK, Italy, India in COVID-19 research may be attributed to the high prevalence of COVID-19 cases in those countries witnessing the first outbreak and also due to having access to COVID-19 data, access to labs for experimental trials, immediate funding, and overall support from the govt. agencies. A large number of publications and citations from India are due to co-authored publications with countries like the United States, UK, China, and Saudi Arabia. Findings show health sciences have the highest number of publications and citations, while physical sciences and social sciences and humanities counts were low. A large proportion of publications fall into the open-access category. With India as the focus, by comparing three major pandemics—SARS, MERS, COVID-19—from a bibliometrics perspective, we observe much broader involvement of authors from multiple countries for COVID-19 studies when compared to SARS and MERS. Finally, by applying bibliometric indicators, we see an increasing number of sustainable development-related studies from the COVID-19 domain, particularly concerning the topic of good health and well-being. This study allows for a deeper understanding of how the scholarly community from a populous country like India pursued research in the midst of a major pandemic which resulted in the closure of scientific institutions for an extended time.

1. Introduction

The present COVID-19 pandemic has affected every socioeconomic sector. Globally, everything from manufacturing to entertainment has been affected. Academia is no exception. In fact, most universities globally have suspended on-campus activities and have moved online [1]. While teaching practices can to some extent be mitigated by digital interventions and online teaching, research is more complex and often requires campus collaboration and laboratory facilities [2]. While safety norms may require research to be suspended, research is also an essential first step in understanding and fighting this pandemic. Given that it is a novel virus, research regarding its characteristics is integral to developing mechanisms for fighting it. Similarly, methods of detection, isolation, protection, etc., also need to be developed at a fundamental level. In addition, given the scale of the pandemic, research on its effects on other aspects ranging from the global supply chain to mental health needs to be understood and any adverse effects mitigated [3,4]. In light of all these needs, researchers across the world have continued their work even under these challenging conditions, generating an impressive volume of research during this time [5]. In fact, during the early stages of the COVID-19 pandemic, researchers produced a significant number of publications, and the number started growing exponentially, doubling every two weeks by April 2020 [6]. Furthermore, as of early June 2021, over 167,000 papers on COVID-19 studies have been published despite the restrictions imposed by university closures, social-distancing norms, and disruptions caused by lockdowns [7]. Much of the information pertaining to the virus and the pandemic has also been made available in the public domain by the leading research institutions in the world.
Two large outbreaks of this coronavirus family had previously been documented with at least one of them receiving the official designation of “global pandemic” [8]. The first incidence of the Severe Acute Respiratory Syndrome (SARS) disease was recorded on 16 November 2002, in the Guangdong province of Southern China. By 2003, the disease had spread across continents, forcing the World Health Organization to designate it as a pandemic. In fact, SARS is dubbed “the First Pandemic of the Twenty-First Century” [9]. On 13 June 2012, the first instance of the Middle Eastern Respiratory Syndrome (MERS) was detected in Jeddah. Until COVID-19 came along, these were the two most significant coronavirus epidemics. Each of these prior epidemics, like COVID-19, had their own literature [10], although on a much lesser scale.
There has been a massive global push for open data sharing during the pandemic. For example, in January 2020, 117 research-related organizations agreed on an open-access data-sharing policy, making any research available to any researcher. The signatories included the likes of Springer and ProMed [8]. UNESCO prompted over 122 countries to implement an open access policy to combat the pandemic and set up an open-access platform for the same [9]. The European Union adopted a similar policy by March 2020 [10]. In order to accelerate the speed of publication, a number of preprint services were set up as well. Though they lack the stringency of a detailed peer review process, such approaches have aided in rapid information sharing [11,12]. When compared to other similar infections such as MERS and SARS, COVID-19 has resulted in a mass mobilization of scientific effort, with over 12,000 papers being generated in under five months. The volume of work available at present on this virus alone is greater than the number of publications generated on all coronaviruses over the last two decades [13]. Clearly, the research community has pulled its weight when it comes to achieving a deeper understanding regarding this virus and pandemic and effectively making the information available to the scientific community.
This is despite the limitations imposed by lockdowns across the world. Lockdowns and other preventive measures such as social distancing have varied in intensity from country to country. In fact, the Oxford COVID-19 Government Response Tracker (OxCGRT) [14] defines the Oxford Stringency index, which assesses the severity of lockdown restrictions. Countries such as India, Russia, and Mexico had the most stringent lockdowns globally, with India being the most populous country to impose an extremely strict lockdown (Blavatnik School of Government, n.d.). Other countries such as China, Greenland, and many European countries had a more relaxed lockdown in comparison (Blavatnik School of Government, n.d.). Meanwhile, countries such as Sweden and Japan continued to remain relatively open while adhering to social-distancing norms. For comparison, lockdown in India involved the complete suspension of rail, air, and road transport between various states and territories. Furthermore, schools, colleges, and public institutions were completely shut down and people were instructed to stay indoors except for accessing essential services [15]. Public institutions, transport, and educational institutions remained open in Japan with limited restrictions, while Sweden did not impose any major restrictions.
Most of Europe had less stringent policies than India as well [16]. All these approaches had varying degrees of success. Even within India, the success of the response varied from state to state, some faring better than others [17]. However, the overall death rates and per-capita deaths in India have been lower than those of most countries. As of 31 May 2021, India’s death per million people since the beginning of this pandemic is 252, while that of the United States is 1841 and that of Germany is 1071 [18]. The limited restrictions in Sweden, with a lack of lockdowns, have led to 1426 deaths per million, almost twice as much as the rest of the Scandinavian countries combined. While some error in these numbers is possible due to insufficient testing, it is safe to assume that the lockdown has aided in mitigating the adverse effects of COVID-19 to a significant extent in the country. While this lockdown certainly affected educational institutions from schools to higher research centers, it is interesting to note that India has contributed significantly to research regarding the pandemic. In fact, despite the stringent lockdown and continued travel restrictions, India ranks fifth in a number of publications related to COVID-19 worldwide.
This study focuses on academic literature on COVID-19 globally, and the performance of the Indian Scientific community in comparison to its counterparts. The study compares how India’s overall scientific output in the year 2020, and research specific to COVID-19 for the same period can be valued relative to global output. This is done by comparing several parameters such as publications, citations, international collaborations, journal sources, funding, etc.
According to Oxford COVID-19 Government Response Tracker (OxCGRT), India had one of the strictest lockdowns during the year 2020. The average monthly stringency score (77.9) was the highest for India for more than nine months in the year 2020. There was complete closure of educational institutions with researchers having very limited access to labs to perform experiments. The mood of the nation was also somber with spiraling cases and deaths.
Yet, against this backdrop, authors from India showed phenomenal resilience and conducted research about COVID-19 with whatever forms of data and funding were available. While we are ranked No. 2 in the world for COVID-19 cases, it is very heartening to observe that we are ranked No. 5 in the world for COVID-19 studies. It is this aspect that prompted us to analyze the scientific contribution of researchers from India. Our choice to use bibliometric methods was guided by the fact that we had to examine a large number of publications. Additionally, using Bibliometrics techniques we were able to analyze publications at author, article, journal, country level and compare with worldwide data. Something unique about our study, probably the first one to be completed at the country level, was the comparison of three major epidemics—SARS, MERS, and COVID-19—which draws interesting parallels by using bibliographic couplings and co-citation analysis. Finally, connecting the COVID-19 studies with UN Sustainable Development Goals (SDG) brings in the much-needed relevance of the research.
We have structured the paper as follows: Section 2 discusses the study methodology using bibliometrics including the search strategy. Section 3 presents the results and discussion in terms of publications, citations, institutions, and countries including the network analysis with a visual representation of bibliographic data and how COVID-19 studies are connected to sustainable development. Finally, Section 4 is about the conclusions of the study with limitations and future directions.

2. Study Methods

We followed a two-step process to cover our study objectives. In the first step, we performed the scoping review using the Arksey and O’Malley framework [19]. A scoping review is a research methodology effective for summarizing and covering broad research topics, comprising a high number of previous studies, publications, methods, theories, or evidence [20]. Most importantly, a scoping review can pinpoint research gaps without losing research robustness and rigorous quality assessments [21]. In this step, we proposed research questions; identified the data source and software mapping tools; proposed search strategies; retrieved data from the database. Then in the second step, we performed a bibliometric analysis of the data from scoping review.
Past research performance can be analyzed using qualitative and quantitative methods like literature reviews and meta-research when the quantity of publications and corresponding citations are small. Thanks to social media platforms, researchers are investigating alternative metrics, or Altmetrics, for a more comprehensive perspective of research impact beyond the traditional indicators like publications, citations, etc. [22]. Sourced from the web, Altmetrics estimate research impact through mentions on Twitter, Mendeley, Online mentions in blogs, etc. However, Altmetrics also has its own limitations: a publication can have high attention because readers are disputing its findings; researchers who are very active on social media with a large following might have higher attention compared to those who are not active on social media.
It is more appropriate and relatively easy to use bibliometric methods to examine a large number of publications which is the case with our study analyzing over 93,000 publications. Bibliometrics is a set of methods to measure scholarly impact from research publications and can easily be scaled from micro (author, article, journal) to macro (subject area, country, world) level. Additionally, with bibliometric science mapping techniques, one can examine how different research themes, author and journal-level publications and citations, institutions, and countries are linked to one another and visualize the results spatially.
Bibliometrics tools have been used in a variety of analyses [23,24], including those of authors, journal sources, and citation trends [25,26] or country [27,28,29,30,31]. Many journals have published bibliometric studies on pandemics such as SARS, MERS, and COVID-19 [13,32,33,34,35,36].
Analyzing Indian publications on SARS-CoV-2 as found in the WHO COVID-19 database [37], results showed a considerable increase in the number of publications from Indian authors on the topic as compared to SARS and MERS. Most of the authors came from government medical institutions, probably an indication of early access to COVID-19 related data. The WHO COVID-19 database included only curated publications and did not include preprint servers. The bibliometrics study [38] mainly focused on the growing contribution of the Arab world to global research on COVID-19 with a focus on Saudi Arabia which had the highest number of publications. A total of 143,975 publications reflecting the global overall COVID-19 research output, between December 2019 and March 2021 were retrieved from the Scopus database. The main research themes identified by the study were related to public health and epidemiology; immunological and pharmaceutical research; clinical diagnosis and virus detection. Another bibliometrics study [39] analyzed publications from Iranian researchers and reported that though most of the studies were related to epidemiology and public health, more collaboration with international researchers is needed.
Two other studies [40,41] compared the research work on SARS, MERS, and COVID-19 using both proprietary database and preprint servers like bioRxiv and medRxiv. Using Natural Language Processing techniques, very early COVID-19 data was collected from multiple sources. Analyzing a total of 13,945 publications and seven datasets, the study reported that the quality of research as indicated by citations were substantially higher for COVID-19 studies. COVID-19 bibliometric study [42] focusing on Latin America, used the Scientific Electronic Library Online (SciELO) database to identify authors, publications, and journals. They reported that since many of the publications were in the Spanish language, they were not adequately represented in international journals. However, the findings of this study further support the assertion that the contents of bibliometric databases have developed a definitive bias toward the English language [43].

2.1. Research Questions

  • What are the publication and citation trends of COVID-19-related articles from India and how does it compare with the rest of the world?
  • Did authors focus on a certain type of publications like journal articles, letters, reviews, etc.?
  • What major subject areas are pursued by most productive Indian institutions and how does it relate to the subject areas pursued in most productive world institutions?
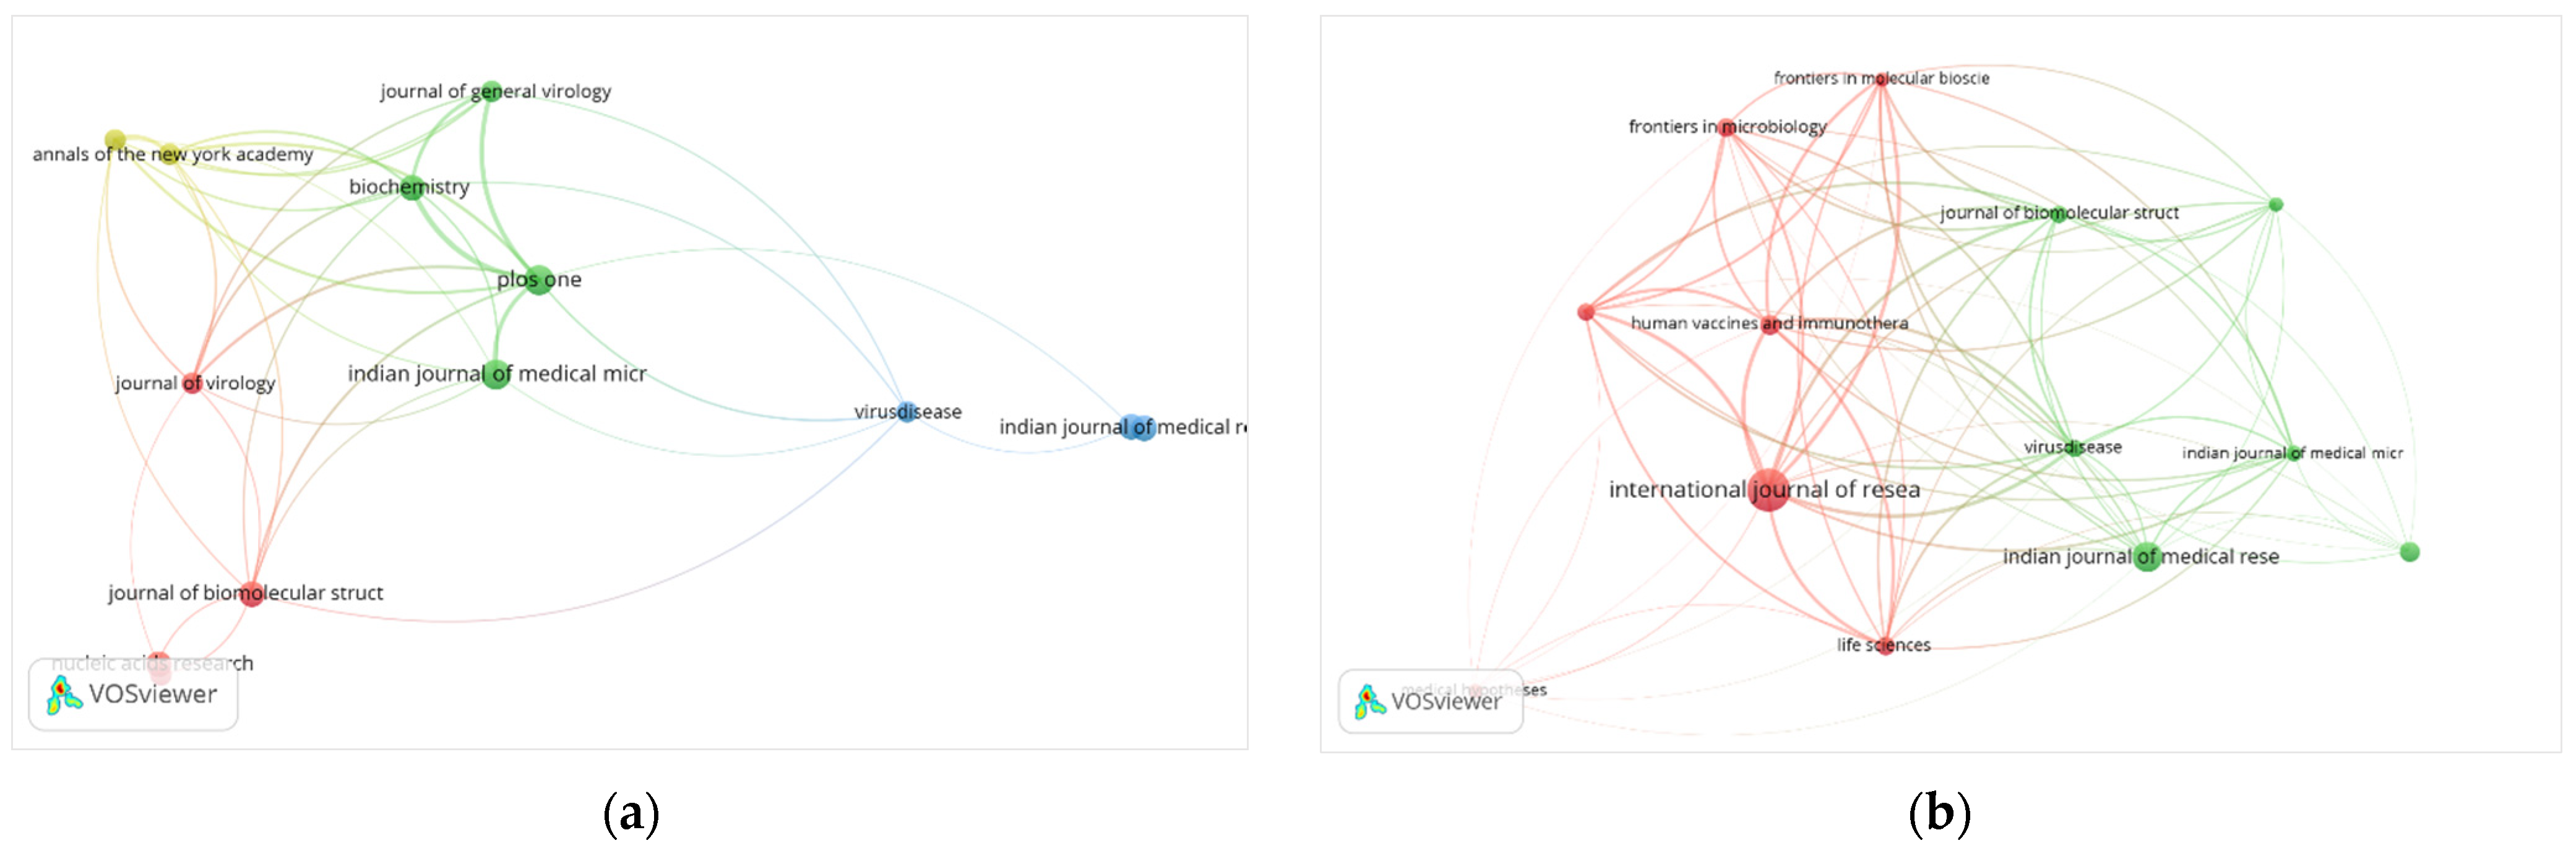
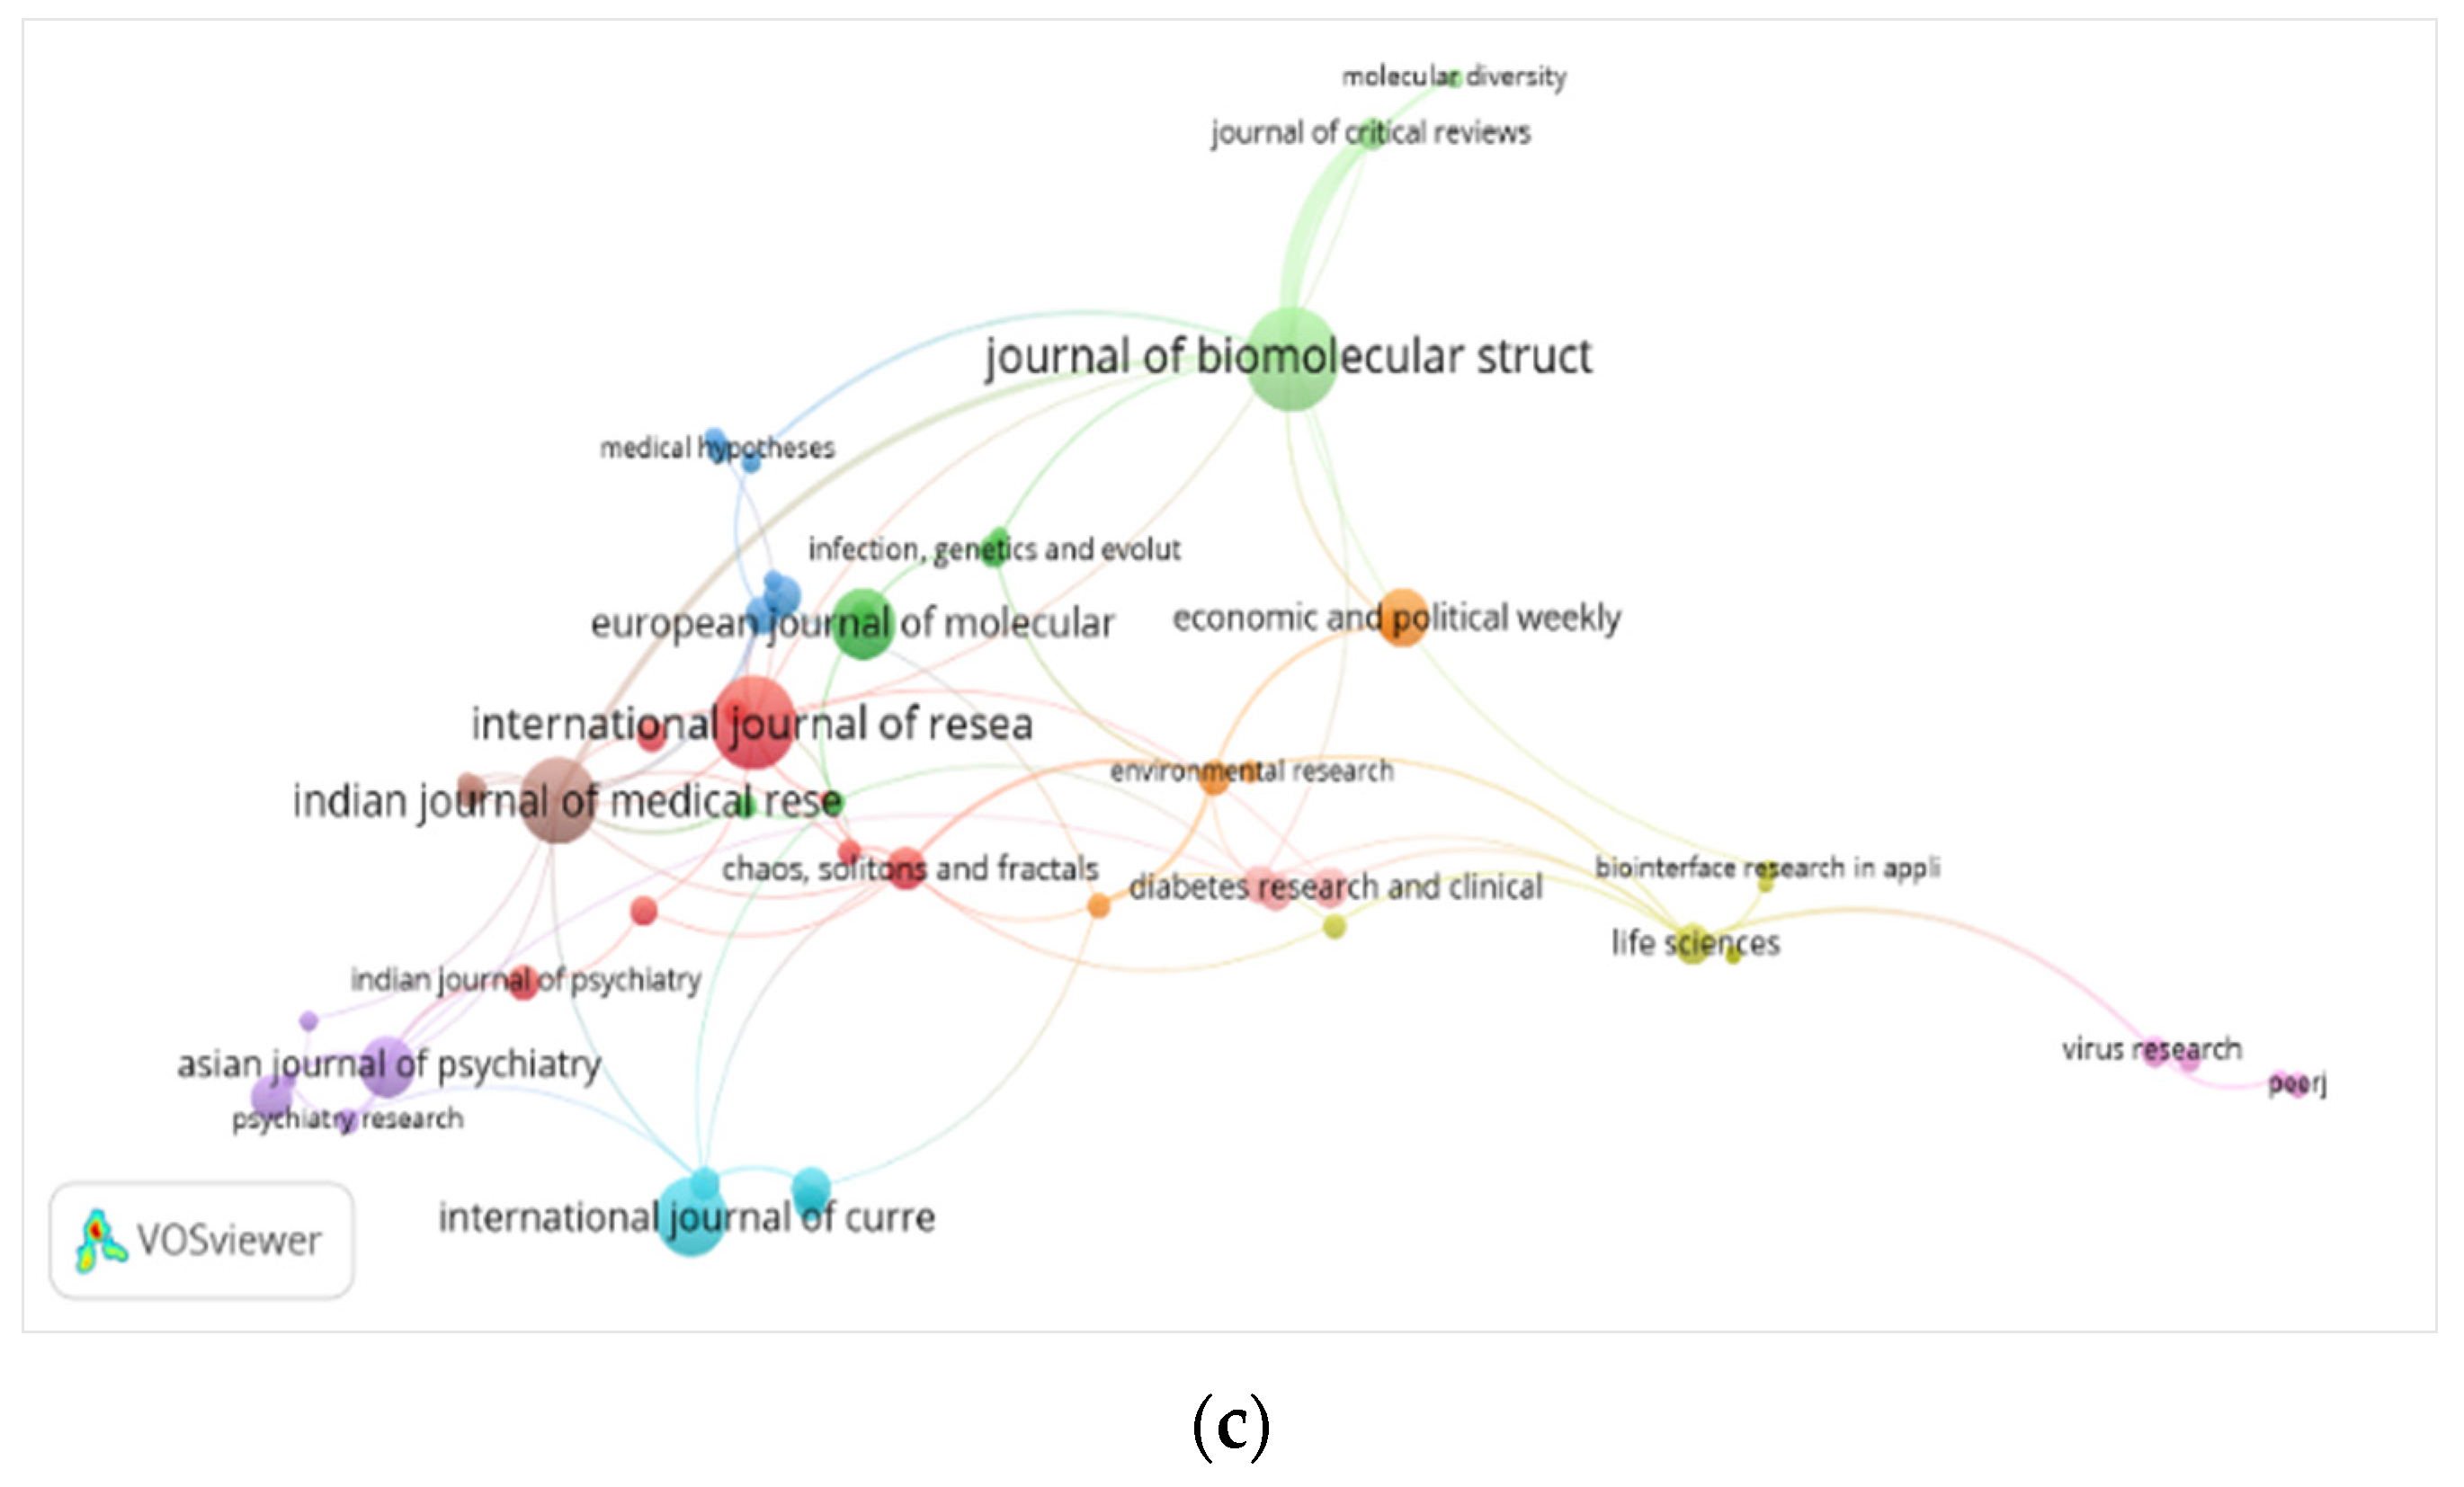
  • Which are the influential journals publishing COVID-19 related research?
  • Did Indian authors have a preference for Open -Access journals and how does such preference compare globally?
  • Did government or private agencies take the lead in funding COVID-19 studies in India and is this pattern like a global situation?
  • How does COVID-19 compare with major epidemics like SARS, MERS, and COVID-19?
  • Are there connections between COVID-19 studies and Sustainable Development as measured by UN SDG?

2.2. Data Sources and Selection of Bibliometric Software Mapping Tools

For our bibliometric analysis, we chose Scopus, which is a large abstract and citation database with over 74 million records from 23,500 peer-reviewed publications in the fields of science, technology, medicine, social sciences, and arts and humanities [43,
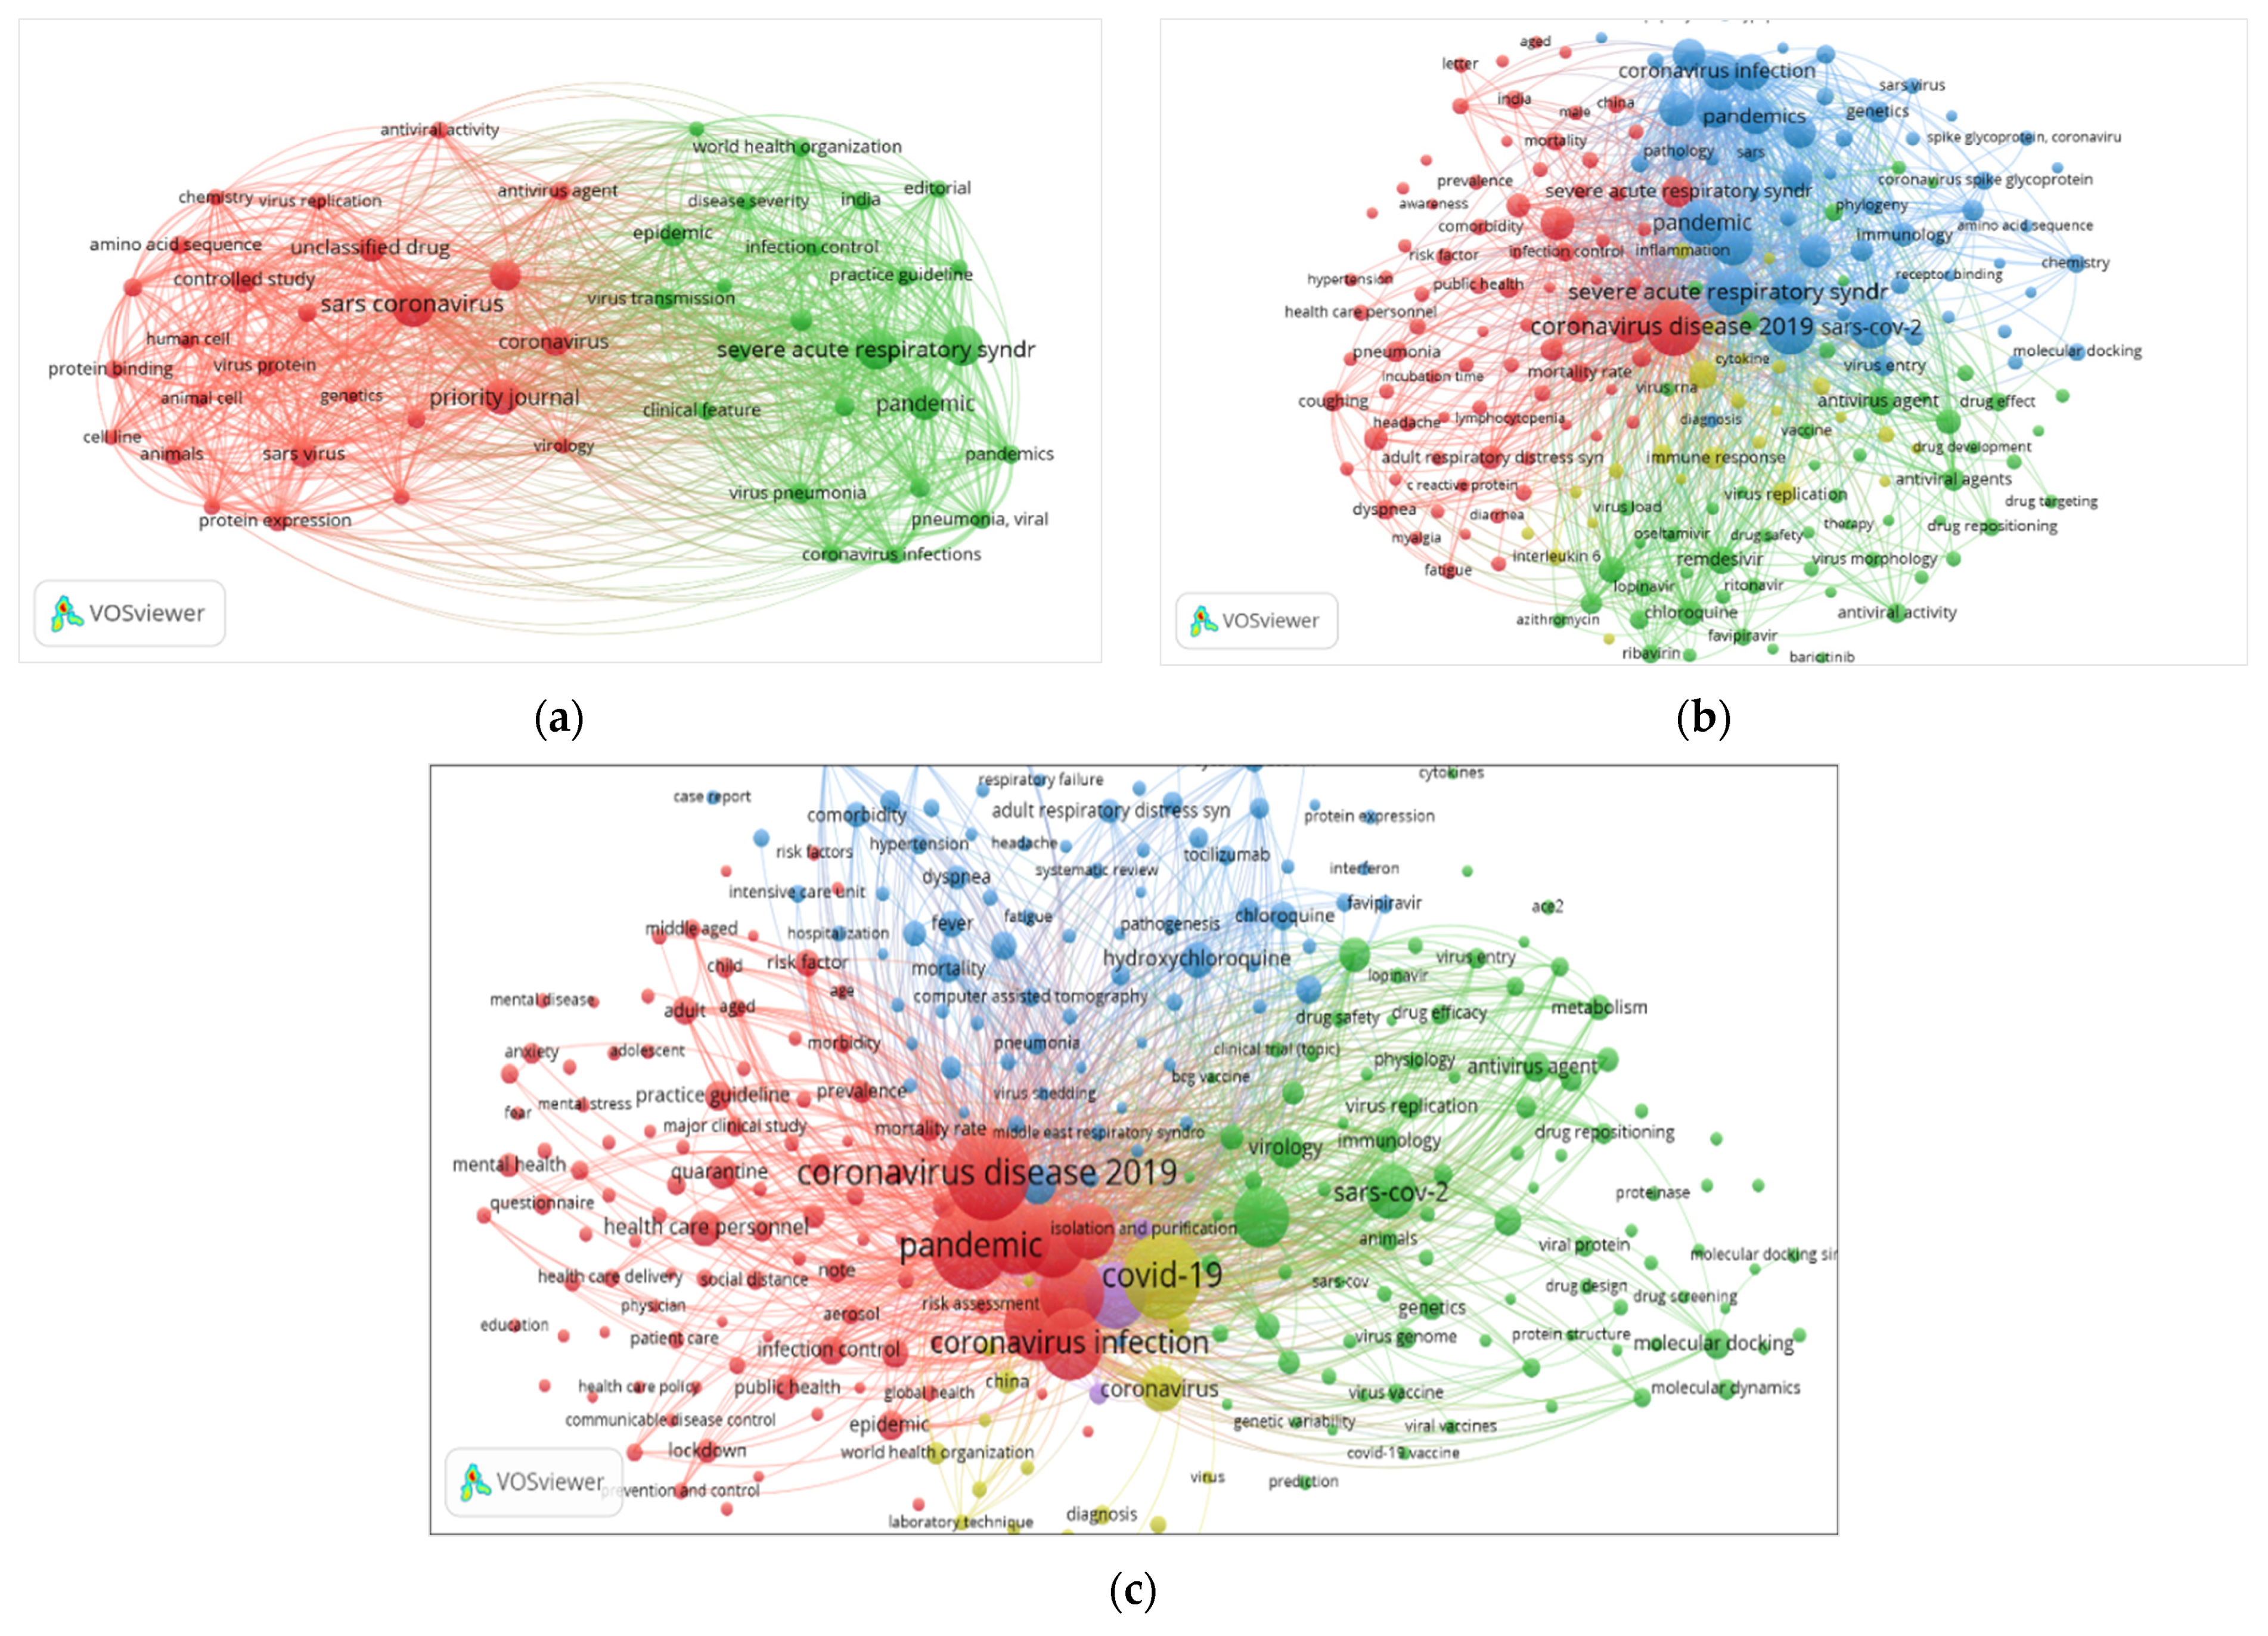
44]. The VOSviewer [
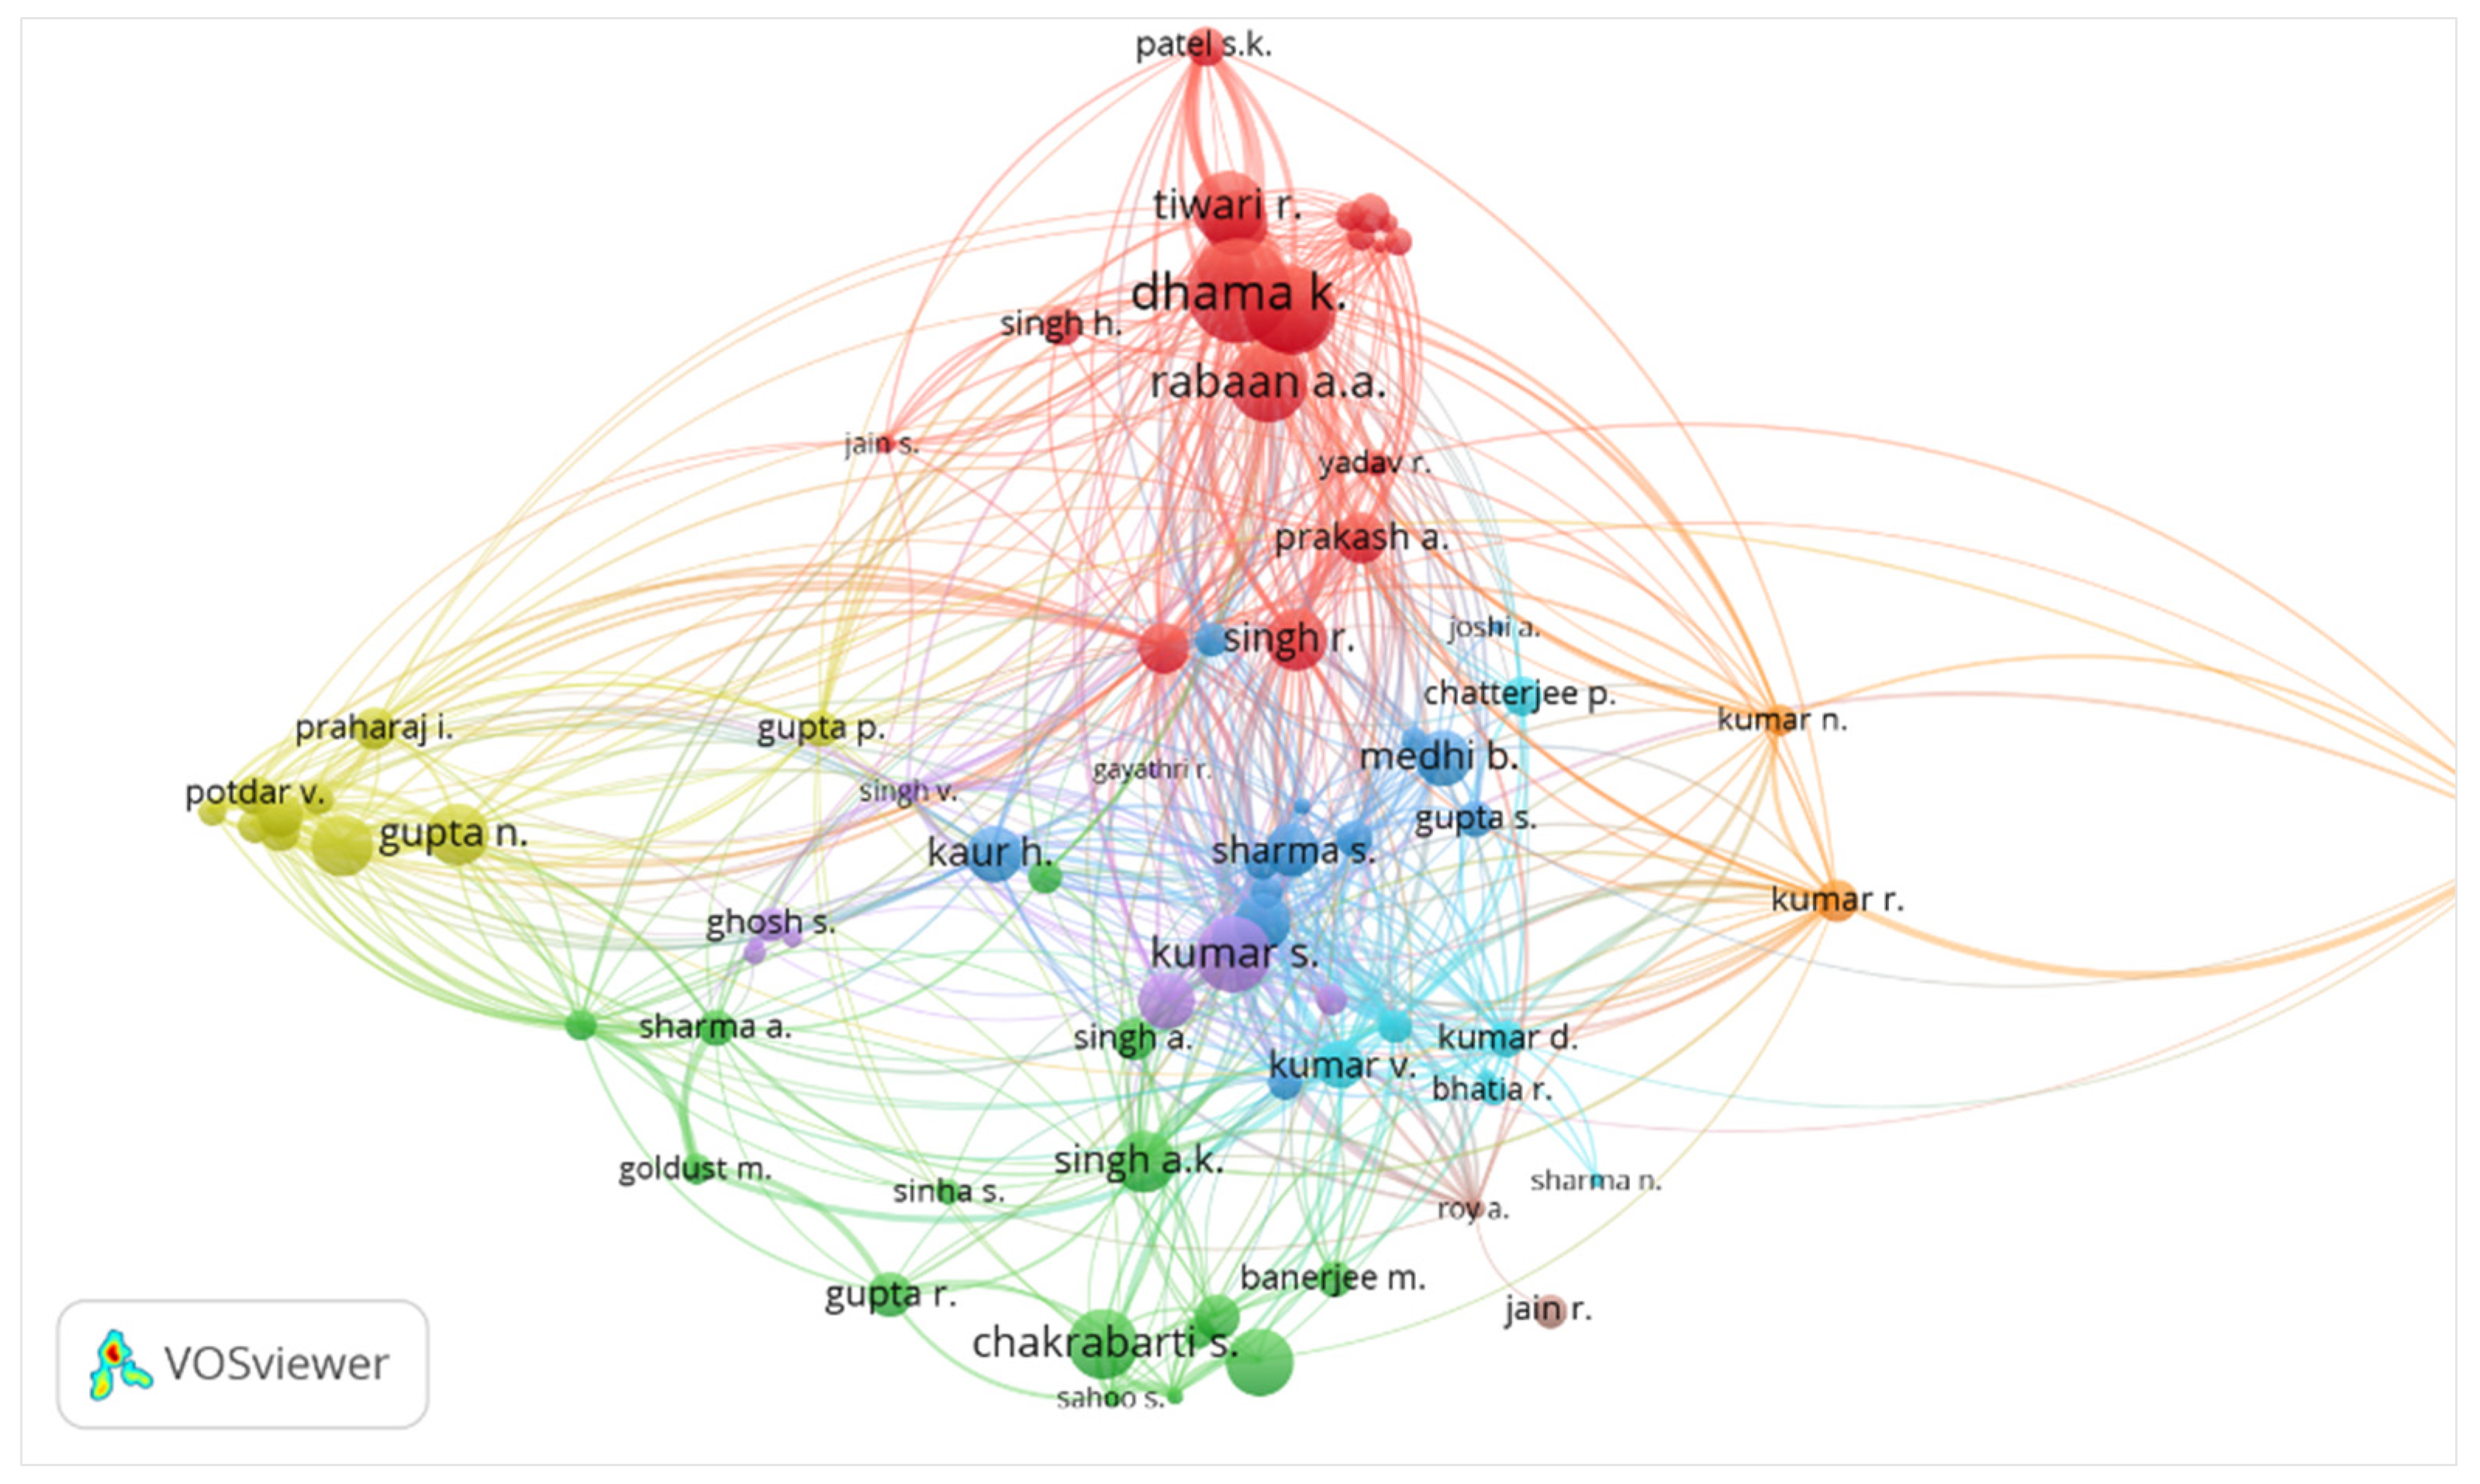
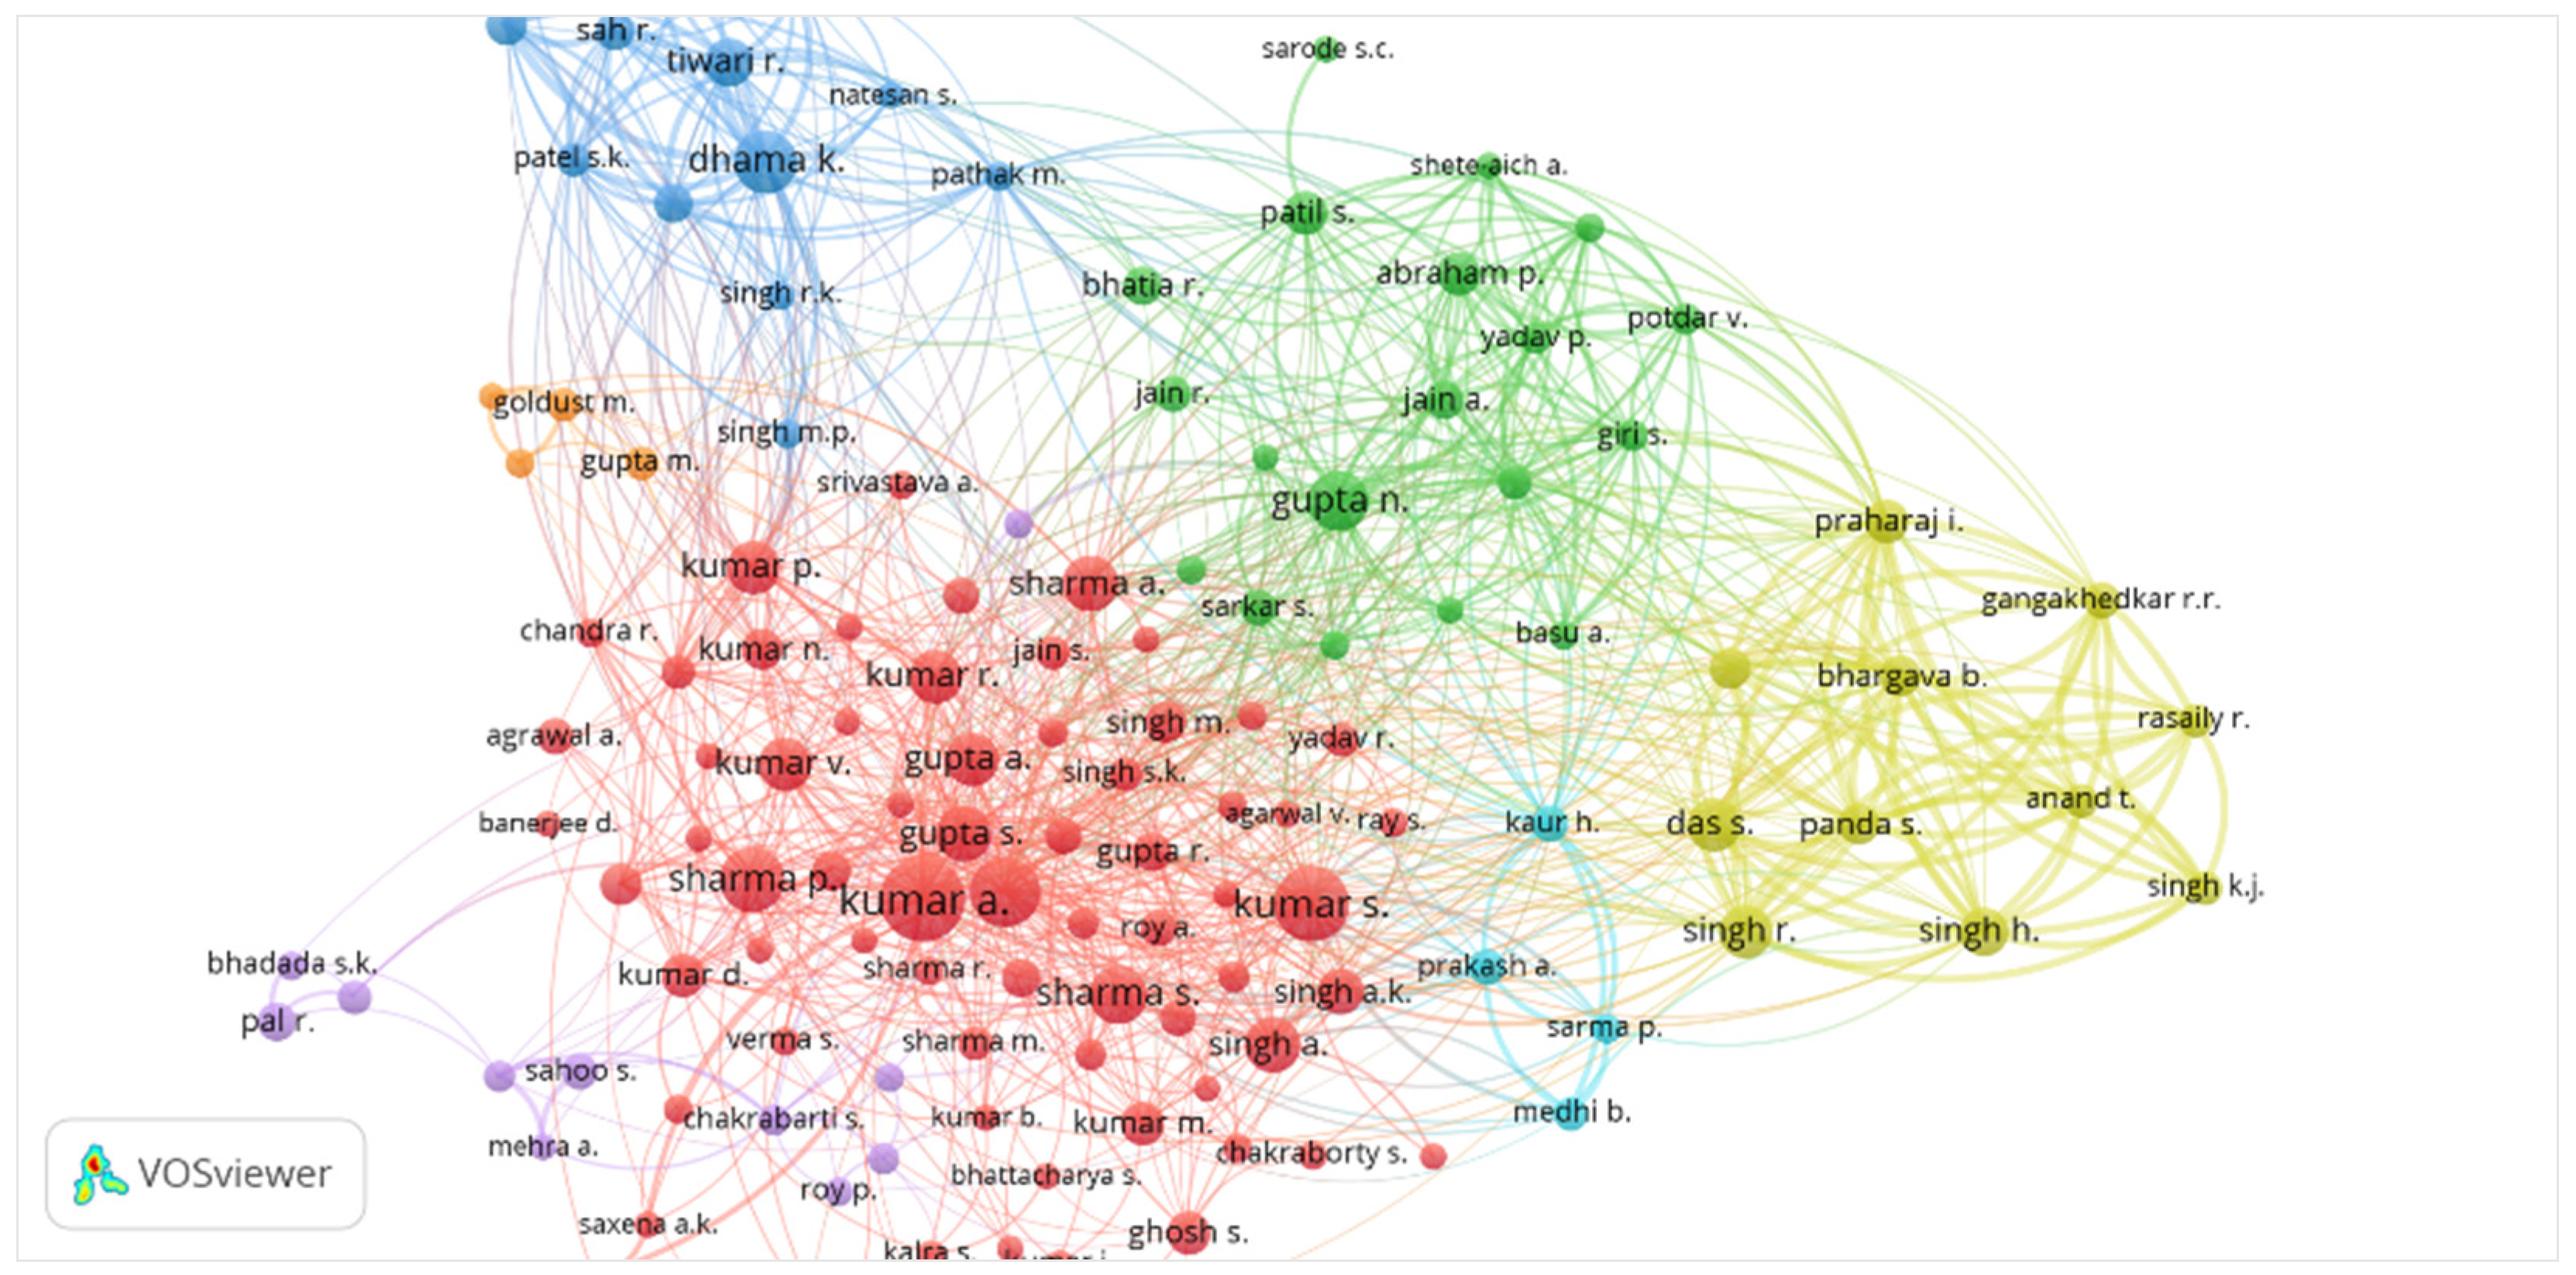
45] software was used to analyze the co-occurrence network for keywords, co-authorship network [46], citations [47], and bibliographic coupling [48]. The h-index [49] which is widely used in bibliometric studies [50] was also analyzed.
In our study, we also considered data sources, https://www.worldometers.info/coronavirus (accessed on 1 January 2021) for data on COVID-19 deaths and cases, as well as www.scimagojr.com (accessed on 1 January 2021) for Scimago Journal Rankings (SJR). The average of the daily score of the Oxford Stringency index was taken from (https://COVIDtracker.bsg.ox.ac.uk/, accessed on 1 January 2021) for the period as of 31 December 2020 with a minimum threshold of a daily score of 30 was set to account for varying dates of lockdown measures.

2.3. Search Strategy

Publications were retrieved via a topic search (title/abstract/keywords) from the Scopus database for the year 2020 as of 1 January 2021. The following search queries were created with the goal of reducing the amount of data overlap across the SARS, MERS, and COVID-19 datasets [40]. In order to eliminate overlap, relevant phrases from various literature were joined with the Boolean operator “AND NOT” in each search. The time period for each search was determined by considering the year in which each virus epidemic occurred.
  • SARS: (TITLE-ABS-KEY (((“Severe acute respiratory syndrome” OR “SARS”) AND (coronavirus*)) OR (“SARS virus” OR “SARS disease” OR “Severe acute respiratory syndrome disease” OR “Severe acute respiratory syndrome virus” OR “SARS-Cov”)) AND NOT TITLE-ABS-KEY ((“COVID” OR “nCov” OR “COVID-19” OR “COVID19” OR “SARS-Cov-2” OR “Severe acute respiratory syndrome-2” OR “MERS” OR “middle east respiratory syndrome”))) AND PUBYEAR > 2001.
  • MERS: (TITLE-ABS-KEY (((“Middle east respiratory syndrome” OR “MERS”) AND (coronavirus)) OR (“MERS-Cov” OR “MERS virus” OR “MERS disease” OR “Middle east respiratory syndrome virus” OR “Middle east respiratory syndrome disease”)) AND NOT TITLE-ABS-KEY ((“nCov” OR “COVID-19” OR “COVID19” OR “SARS-Cov” OR “SARS-Cov-2” OR “SARS” OR “Severe acute respiratory syndrome”))) AND PUBYEAR > 2011.
  • COVID-19: TITLE-ABS-KEY (“COVID-19” OR “COVID19” OR “coronavirus disease 2019” OR “2019-nCov” OR “Novel Coronavirus” OR “Novel Corona virus” OR “SARS-Cov-2”) AND PUBYEAR > 2018.

3. Results

3.1. Bibliometric Analysis

3.1.1. Publication and Citation Trends

A total of 93,485 COVID-19-related publications, between 1 January 2020, and 31 December 2020, are indexed in Scopus as of 1 January 2021, based on our search strategy. Out of this total, 58,643 (60.2%) were from United States, China, UK, Italy, and India with the United States having the highest total of 23,608 (25.4%) publications. Publications in English were 87,529 (94.1%) with 7723 (5.9%) in Spanish, German, Chinese, French. This information is summarized in Table 1.
The United States had both the highest number of cases and deaths per million population while Australia had the lowest score in the stringency index. India has the highest score of 78.7, which may provide a possible explanation for a low number of cases and deaths per million population. China had the highest number of citations per publication possibly due to the effect of the first outbreak of the COVID-19 virus and the easy availability of data among Chinese authors to write papers and cite each other’s work. A total of 6223 publications, with affiliation as India for at least one author, were found for the year 2020. These publications were written by 12,417 authors and published in 1370 sources. Out of this, 2513 (40.3%) publications had at least one citation in Scopus, providing a total of 20,816 citations. This resulted in average citations per paper of 3.3 and citations per author of 1.7.
It is seen that Indian authors have collaborated with researchers in 147 countries, with 4667 (74.9%) publications having international co-authorships. This indicates a healthy international collaboration during the pandemic. The largest number of collaborations were with the United States, followed by China, UK, Saudi Arabia, Japan, Italy, Columbia, and South Korea, as seen in Table 2. These seven collaborating countries accounted for 1866 (30.1%) publications. For publications from India, the number of citations is highest for publications from United States followed by those from China, UK, and Italy. The number of citations per publication varies from 22.7 for Nepal to 7.1 for the United States. However, given that a larger number of publications are generated in Italy, China, the US, and the UK, researchers have diverse options for citing work from these countries, thereby moderating the number of citations per publication. A very limited number of publications from Nepal and Japan (58 and 70 papers each) leads to a larger number of citations on the ones available. The quality of research work can therefore not be assessed based on the same metric.
Although the number of publications and citations related to SARS and MERS increased since the respective outbreaks took place, Indian authors took more interest in them only in the year 2020 when COVID-19 happened, as shown in Table 3. The surge in coronavirus research triggered by the COVID-19 outbreak, on the other hand, appears to be on a scale that is unprecedented in the history of coronavirus research, and probably perhaps in the history of science.

3.1.2. Structure of Publications

Analyzing the total number of COVID-19 related publications globally, it is seen that 50,865 (54%) are research “Articles”, as shown in Table 4. The trend is similar in India with 3186 (51%) publications. Furthermore, in India, “Letters and Reviews” add up to 2392 (38%), while the share of such publications is only 25,203 (27%) globally. Other publications take up 10% of the overall share in India and 19% globally. It should be noted that such a high share of non-article publications is abnormal, and generally, 71% of all publications in India were articles in the year 2020. This higher fraction of non-articles related to COVID-19 may be attributed to the time required for the peer review process as softer letters and reviews do not have to pass that hurdle.

3.1.3. Top Contributing Institutions

Globally, Harvard Medical School (USA) published the largest number of COVID-19 related publications followed by Huazhong University of Science and Technology and Tongji Medical College from China, as can be observed in Table 5. Both private and public institutions are represented well in the top-10 in the world for institutions with the most COVID-19 publications.
When comparing the publications and citations achieved by public and private institutions in India, the former has a clear upper hand, as shown in Table 6. A much larger number of publications were produced by public medical institutions such as AIIMS and PGI Chandigarh. The private medical institute with the highest number of publications is Saveetha, where the medical and dental departments together roughly match the number of publications by PGI Chandigarh. However, in terms of the number of citations, public medical institutes are far ahead of private institutes. IVRI (Veterinary) has 15 citations per publication while ICAR New Delhi has 14.4 citations per paper. Tata Memorial has a citation per publication score of 6.2. However, among private sector institutes, the highest citation per publication is 3.7 for CMC Vellore. Clearly, public medical institutes have exceeded their private counterparts in academic excellence in this area. This is partly due to government funding and ease of access enjoyed by these institutes with regard to viral samples and data for clinical studies.
When we compare the three outbreaks, we observe that the research interest from Indian institutions in conducting coronavirus studies has increased by a factor of three from 160 in SARS to 249 in MERS to 523 institutions for COVID-19. This interest is also reflected in the very large number of publications and citations related to COVID-19 studies.

3.1.4. Most Influential Journals

A list of journal sources with a number of publications, citations, Scimago Journal Rankings (SJR), and h-index are listed in Table 7. The highest citation per publication is achieved by the Journal Science of the Total Environment which is a Q1 journal with a high h-index of 224. Similarly, the Journal Diabetes Research and Clinical practice, another Q1 journal with a high h-index of 107, has over 23 citations per publication. The Journal of Biomolecular Structure and Dynamics, a Q2 journal, with a relatively moderate h-index of 32 has the highest number of COVID-19 related publications while Nature Medicine and The Lancet, the most reputed journals in the field, have a very limited number of COVID-19 related publications (four each), likely owing to the highly stringent review process and high article processing charges.
When we observe the data on studies about SARS, MERS, and COVID-19 published in journals, we see a large surge in the number of different journals where COVID-19 studies were published. While SARS studies were limited to 124 journals, MERS had 310 while COVID-19 studies were published in over 1370 journals.

3.1.5. Top Performing Subject Areas

A majority of publications related to COVID-19 are from health sciences (76,657, 82.1%), with medicine alone accounting for (64,505, 69.3%) globally. The proportion is slightly lower for India, with 4165 (67.2%) publications coming from health sciences, as indicated in Table 8. Of these, 3790 (91.4%) are from medicine. However, life sciences also contributed a healthy 43% of the total share of COVID-19-related articles, while physical sciences and social sciences made up the rest at 29% and 15% respectively. It is also interesting to note that within physical sciences, computer science and engineering which are technology-oriented constitute a higher share than that of pure sciences such as chemistry or physics. Within social sciences, art and humanities contribute the least while pure social science contributes the highest share.

3.1.6. Open Access Publications

Overall, there is a rise in the number of open-access publications, especially with those related to COVID-19. This indicates interest from the academics in increasing the availability of their work to a wider audience without the barriers of restricted access. In fact, regarding publications related to COVID-19, worldwide 75,242 (80.4%) are in open access, and in India, the trend is similar with 4841 (77.7%) in open access. This is especially relevant in India, given that only 26% of all publications from India are in open access for the entire year 2020. Essentially, a large portion of COVID-19 publications falls into the open-access category. The fraction of Open Access medical publications is especially high, with 83.8% and 82.9% of COVID-19 related medical papers being open access globally and in India, respectively.
It is important to note that, although authors have been publishing in open access for several years, only in the last few years have several of the established journals started publishing in full open access mode. This is reflected in the very high number of Open Access articles for COVID-19 studies (4841) compared with 431 for MERS and 113 for SARS.

3.1.7. Major Funding Sources

From all the COVID-19 related publications studied, 20,134 (22.5%) reported the funding sources involved. Led by the United States, National Institutes of Health, National Science Foundation, and National Institute of Allergy and Infectious Diseases funded the largest number of COVID-19 studies at 2776 (13.7%). The National Natural Science Foundation from China was second with 2111 (10.4%) funded studies, followed by the UK’s National Institute for Health Research with 459 (2.2%) and the European Commission with 236 (1.1%) funded studies. When it comes to funding by private sources, the following number of studies were funded: Wellcome Trust, 388; Pfizer, 255; Bill and Melinda Gates Foundation, 243.
Government funding was relatively lower in India with agencies Science and Engineering Review Board (SERB) Indian Council of Medical Research (ICMR), Department of Science and Technology (DST), Department of Biotechnology (DBT), and University Grants Commission (UGC) accounting for 129 (0.5%) studies. However, countries hit earlier by COVID-19 such as the United States and China are more likely to have allocated more funding to research at that stage.

3.2. Network Analysis: Co-Authorship, Co-Occurrence, and Bibliographic Couplings

3.2.1. Co-Authorship Network and Publications

In order to study the collaboration networks of authors, we used co-authorship network analysis which is a widely accepted practice in bibliometric studies [51].
In a network graph, each author is represented by a bubble and the bubble size is proportional to the number of publications attributed to the author. Two authors who have collaborated on any paper are linked by a line, with each line representing collaboration on a single paper. Colors indicate clusters of authors that are relatively strongly connected by co-authorship links and authors with a high degree of collaboration are located close to each other.
We investigated the co-authorship network in India, with authors having at least 15 COVID-19 related publications. This resulted in seven major collaboration clusters with a total of 132 authors, as can be observed in Figure 1.
The important clusters in the co-authorship network of authors shown in the following colors: red corresponds to authors “kumar a”, “kumar s”, “sharma p”; green color to author “gupta n”; yellow to author “das s” and finally blue to “dharma k”. As indicated by the size of the bubble, those are leading authors who produced the highest number of papers in collaboration with others.

3.2.2. Co-Citation Network of Authors

Similarly, we investigated the co-citation network of Indian authors with at least five citations. Note that co-citations indicate formats that contain ideas, experiments, or methods that have received peer recognition, as evidenced by their co-occurrence of citations [52].
This network analysis resulted in six clusters, where 124 out of the 12,417 authors had at least five citations, as shown in Figure 2. Each author is represented by a node whose size is proportional to the number of citations. The important clusters of citations appear in the following colors: red corresponds to author “dharma k”; green to author “chakrabarthi s”; yellow to author “gupta n” and finally blue color to “sharma s”. As indicated by the size of the bubble, those are leading authors with the highest number of citations.

3.2.3. Co-Occurrence Network of Keywords

When searching for scientific publications, a keyword search is usually the easiest way to access relevant information. Therefore, appropriate keywords that provide a reasonable description of the work allow the study to reach a wider audience. To carry out a keyword-based analysis, keywords described by at least five publications were chosen, and a co-occurrence network was constructed. The unit of analysis has also been set to all keywords (this includes both author and index keywords) and the method of counting was set to full counting.
These results are shown in Figure 3, where it can be seen that works published by Indian authors have employed a wide range of keywords, ranging from those related to virology and epidemiology to those associated with mental health, air pollution, and lockdown. This indicates that the work generated in India spans multiple disciplines and covers a diverse gamut of topics related to the pandemic.
With respect to each of the three epidemics, distinct clusters of keywords were identifiable but there were commonalities among them. All three epidemics had a cluster with terms such as a pandemic, infection control, viral, epidemic, virus transmission associated with general public health, and disease outbreak. Another cluster had terms that are generally associated with virology studies like virus protein, virus entry, chemistry, amino acid sequence, virus genome, protein binding, etc.
Figure 3c shows that the COVID-19 studies resulted in four clusters which are described below:
  • Cluster 1 (red) shows high-frequency keywords related to epidemiological and public-health studies on COVID-19, such as:
    Pandemic, coronavirus disease 2019, public health, health care personnel, infection control, mental health, quarantine, disease transmission.
  • Cluster 2 (green) includes terms associated with virus and drug treatments, including:
    Sars-cov-2, virology, immunology, drug positioning, antivirus agent, virus genome, drug design, drug repositioning.
  • Cluster 3 (blue) involves high-frequency keywords associated with clinical studies, signs, and symptoms of the disease, as well as pharmacological and nonpharmacological interventions for COVID-19, for instance:
    Hydroxychloroquine, remdesivir, azithromycin, cytokine storm, chloriquin, angiotensin enzyme, dysphea, respiratory failure, comorbidity, fever, fatigue.
  • Cluster 4 (yellow) includes terms relevant to measures of disease control and spread prevention such as:
    COVID-19, coronavirus, lockdown, air pollution, China, WHO.

3.2.4. Bibliographic Couplings among Countries

Bibliographic couplings are described by [53] which proposes that two papers referring to a third paper are highly related, so they should be grouped into a cluster solution. Figure 4 presents the bibliographic coupling among countries, where any country with a minimum of five publications with an Indian collaboration was considered. When the three maps of co-authorships are compared, a pattern of author engagement emerges from the area where each virus outbreak began. In all three epidemics, studies produced by scholars linked with Indian institutions are well represented. However, the figure also illustrates frequent coupling among other countries such as England, Germany, and the Netherlands for COVID-19 studies with United States, United Kingdom, Saudi Arabia, Japan, Italy, Columbia, and South Korea as top collaborators. Overall, the number of collaborating countries has increased from 28 for SARS to 81 for MERS and, reached a total of 154 for COVID-19.

3.2.5. Bibliographic Couplings of Journal Sources

Similarly, we studied the bibliographic couplings of journal sources for all three pandemics. We observe that the journal sources have increased dramatically from 124 journals for SARS to 310 journals for MERS, up to a large 1370 journals for COVID-19. Journal of Biomolecular structure and Indian Journal of Medical Research is found common for all three pandemics, as seen in Figure 5. We also notice that MERS studies were published in specialty journals like the Journal of Virology, Human Vaccines and Immunotherapy, and Frontiers in Microbiology.
When it comes to COVID-19 studies, we evaluated the journals with a minimum of ten publications from a total of 1370 journal sources that Indian authors had published. This resulted in 97 items divided into seven clusters, as shown in Figure 5 (bottom). As expected, most of the highly cited papers appeared in high-impact factor journals indicating their higher research quality. Most publishers followed an accelerated review process, online-first policy and provided open access to such publications.

3.3. COVID-19 Studies Connected to Sustainable Development

We also evaluated the connections between COVID-19 studies and sustainable development. In this regard, we used 17 United Nations Sustainable Development Goals (SDG), adopted in 2015, as a proxy for sustainable development. The COVID-19 pandemic has had an important impact across all the SDGs, for instance through reduced CO2 emissions because of the lockdowns [54], with clear implications on SDG 13 (on climate action). However, a number of studies [55,56] suggest that the situation may progressively return to the pre-pandemic levels, in the context instance of aviation and its impact on the environment. Several studies suggest that the symptoms associated with COVID-19 may be exacerbated due to increasing pollution levels [57], a fact that closely connects SDGs 3 (on health) and 11 (on sustainable cities). Another important aspect regarding the management of the COVID-19 has to do with the digital-contact-tracing apps, which aimed at achieving better control of the pandemic, with a positive impact on SDG 3, but could potentially exhibit challenges [58,59,60] in the context of SDGs 10 (on reduced inequalities) and 16 (on strong institutions). The connections reported above have a clear relation with the results presented in Table 9, where the number of Indian COVID-19 articles and their citations related to each of the 17 SDGs are reported. There are clearly very strong connections with SDGs 3 and 11, as well as 13 (with clear implications on pollution levels) and 16. When it comes to the latter, we would like to highlight the strong polarization in our societies, exacerbated by the algorithms used by news outlets and social media [61]; the problems associated with this polarization have become particularly dire due to the COVID-19 pandemic, creating a data crisis [62]. It is also important to note the significant number of studies documenting connections between COVID-19 and SDGs 8 (on economic growth) and 4 (on quality education), which reflect the negative impact of the COVID-19 restrictions on two very important areas of our societies. Perhaps two areas that have not received sufficient attention according to Table 9 are the negative effects on SDGs 1 (on no poverty) and 5 (on gender equality), which have undoubtedly experienced quite negative effects from COVID-19.

4. Conclusions

In the present study, the authors performed a bibliometric analysis on COVID-19 publications in India and at multiple places compared to the worldwide data. The United States is the country with the highest number of COVID-19 publications in the year 2020. This might reflect the fact that journal databases and the referencing system usually refer to US standards. Many journals, with a wide range of impact factors, exhibit publications by Indian authors. The publications are the result of collaboration both within India and on the international scene. Our results indicate that the studies on COVID-19 are published by institutions worldwide as also reported by [63], who studied bibliometric features on the COVID-19 globally. There are many publications in India, which had a rapidly increasing rate of publication after disease emerged in the country, in a pattern similar to that reported by [
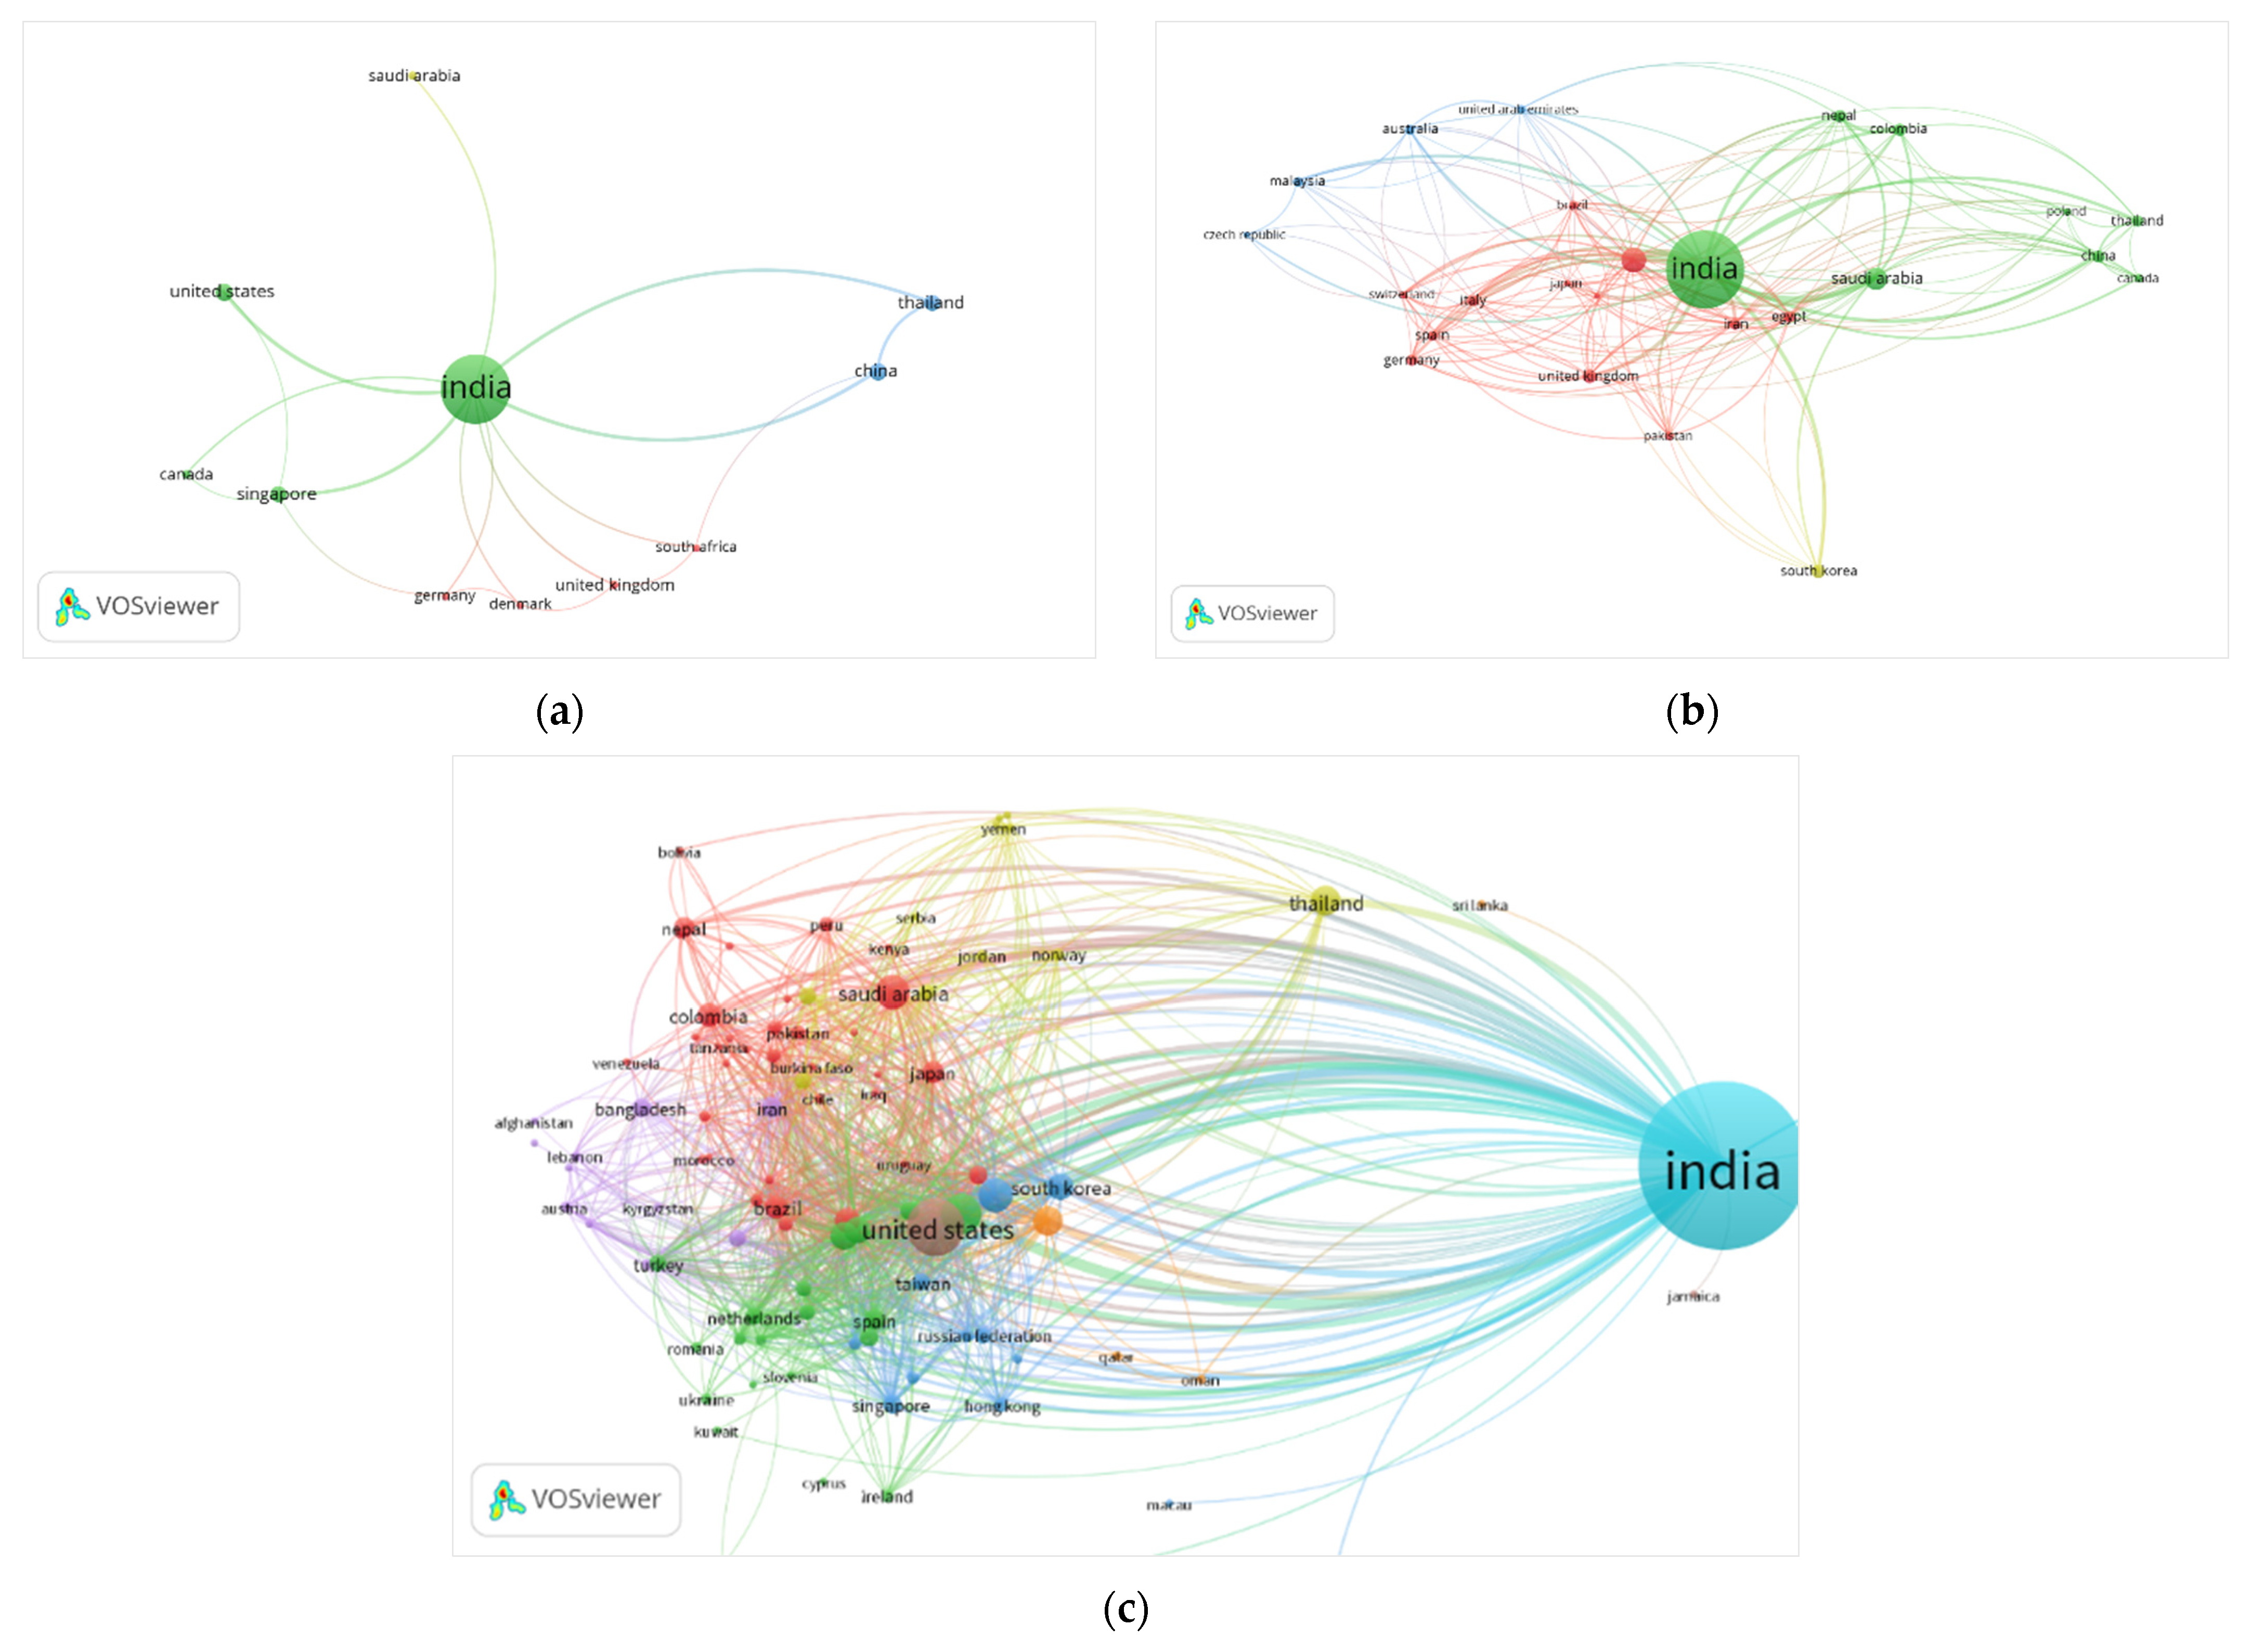
64]. This study also shows that there are many publications from both governmental and non-governmental institutes. A worldwide collaboration network can be clearly identified, and this agrees with the report by [65]. Collaboration is an excellent way to increase the visibility of the work and the generalization of the knowledge. During the early stage of disease emergence, studies in the form of short reports or viewpoints were common and become publications with high numbers of citations [66]. Such collaboration and active data-sharing policies are essential aspects to fight this pandemic and other future crises [67,68,69]. The high number of studies on COVID-19 indicates that it will be necessary to conduct active research with the emergence of new variants of the diseases [70,71,72].
We also identified important connections between COVID-19 studies at the 17 SDGs of the UN. In particular, there are clear implications on SDGs 3 (on health), 11 (on sustainable cities), and 13 (on climate action), the two latter due to the reduced emissions following the COVID-19 restrictions. Digital contact tracing must be conducted in a decentralized way in order to avoid negative effects on SDGs 10 (on reduced inequalities) and 16 (on strong institutions). Despite the obvious negative effects of COVID-19 on SDGs 8 (on economic growth) and 4 (on quality education), we would like to highlight the very important consequences of SDGs 1 (on no poverty) and 5 (on gender equality), which are not as prominently represented in the literature.
A detailed assessment of the scientific work published in reaction to the three most notable coronavirus outbreaks, namely SARS, MERS, and COVID-19, reveals striking parallelisms. Public-health and emergency-management studies are the first to appear, followed by virology studies. The volume and rate of scholarly study on COVID-19, on the other hand, remains an outlier, potentially unparalleled in the history of scientific literature.
Although India had a reasonably large number of reported COVID-19 cases, the number of publications at the time of the study still follow countries where the disease occurred earlier. However, in recent weeks, the situation has abruptly changed for the worse with India reporting a very high number of daily cases mainly attributed to the double-mutant strain. Many states have again implemented lockdowns resulting in the closure of campuses. It remains to be seen how the academic community will adapt to this new situation.
In comparison to earlier epidemic outbreaks, the publication of COVID-19 research is moving at a torrid pace. As of 23 June 2021, over 195,568 COVID-19 studies have been published in Scopus. Additionally, there are several tens and thousands in the preprint servers which are not yet peer reviewed. A similar pace is seen with Indian authors who have already published 5403 articles in the first five months of 2021, compared to 6423 articles for all of 2020. It is very possible that bibliometrics as a field is not equipped to explain such steep trajectories of publications and citations in such a short time since bibliometricians work on substantially longer timescales [28,36]. Secondly, unlike the boxed search phrases above, the description of an emerging research area is rarely as clear and understandable.

Author Contributions

Conceptualization, R.R.; methodology, P.N.; software, P.N.; validation, R.R., P.N.; data curation, R.R.; writing—original draft preparation, R.R., P.N.; writing—review and editing, R.V.; visualization, R.R. All authors have read and agreed to the published version of the manuscript.

Funding

This research received no external funding.

Institutional Review Board Statement

Not Applicable.

Informed Consent Statement

Not Applicable.

Data Availability Statement

All data is included in the manuscript itself.

Acknowledgments

This work derives direction and ideas from the Chancellor of Amrita Vishwa Vidyapeetham, Mata Amritanandamayi Devi.

Conflicts of Interest

The authors declare no conflict of interest.

References

  1. Carusi, F.T.; Di Paolantonio, M.; Hodgson, N.; Ramaekers, S. Doing academia in “COVID-19 Times”. Antistasis 2020, 10, 1–8. [Google Scholar]
  2. Omary, M.B.; Eswaraka, J.R.; Kimball, S.D.; Moghe, P.V.; Panettieri, J.R.A.; Scotto, K.W. The COVID-19 pandemic and research shutdown: Staying safe and productive. J. Clin. Investig. 2020, 130, 2745–2748. [Google Scholar] [CrossRef] [PubMed] [Green Version]
  3. Xiong, J.; Lipsitz, O.; Nasri, F.; Lui, L.M.W.; Gill, H.; Phan, L.; Chen-Li, D.; Iacobucci, M.; Ho, R.; Majeed, A.; et al. Impact of COVID-19 pandemic on mental health in the general population: A systematic review. J. Affect. Disord. 2020, 277, 55–64. [Google Scholar] [CrossRef]
  4. Ivanov, D. Predicting the impacts of epidemic outbreaks on global supply chains: A simulation-based analysis on the coronavirus outbreak (COVID-19/SARS-CoV-2) case. Transp. Res. Part E Logist. Transp. Rev. 2020, 136, 101922. [Google Scholar] [CrossRef] [PubMed]
  5. Weiner, D.L.; Balasubramaniam, V.; Shah, S.I.; Javier, J.R.; on behalf of the Pediatric Policy Council. COVID-19 impact on research, lessons learned from COVID-19 research, implications for pediatric research. Pediatr. Res. 2020, 88, 148–150. [Google Scholar] [CrossRef]
  6. Coren, M. The Number of Scientific Papers on The Novel Coronavirus Is Doubling Every 14 Days. Quartz. Available online: https://qz.com/1834521/scientific-papers-on-novel-coronavirus-doubling-every-14-days/ (accessed on 17 January 2021).
  7. Primer. COVID-19 Primer. Available online: https://COVID19primer.com/dashboard (accessed on 17 January 2021).
  8. Wang, L.; Wang, Y.; Ye, D.; Liu, Q. Review of the 2019 novel coronavirus (sars-cov-2) based on current evidence. Int. J. Antimicrob. Agents 2020, 55, 105948. [Google Scholar] [CrossRef]
  9. Cherry, J.D.; Krogstad, P. SARS: The First Pandemic of the 21st Century. Pediatr. Res. 2004, 56, 1–5. [Google Scholar] [CrossRef] [Green Version]
  10. Kostoff, R.N.; Morse, S.A. Structure and infrastructure of infectious agent research literature: SARS. Science 2010, 86, 195–209. [Google Scholar] [CrossRef]
  11. Wellcome. Statement on Data Sharing in Public Health Emergencies. Available online: https://wellcome.org/press-release/statement-data-sharing-public-health-emergencies (accessed on 17 January 2021).
  12. UNESCO. UNESCO Mobilizes 122 Countries to Promote Open Science and Reinforced Cooperation in The Face of COVID-19. Available online: https://en.unesco.org/news/unesco-mobilizes-122-countries-promote-open-science-and-reinforced-cooperation-face-COVID-19 (accessed on 17 January 2021).
  13. European Council. Joint Statement of The Members of the European Council. Available online: https://www.consilium.europa.eu/en/press/press-releases/2020/03/26/joint-statement-of-the-members-of-the-european-council-26-march-2020/ (accessed on 17 January 2021).
  14. Guterman, E.L.; Braunstein, L.Z. Preprints During the COVID-19 Pandemic: Public Health Emergencies and Medical Literature. J. Hosp. Med. 2020, 15, 634–636. [Google Scholar] [CrossRef]
  15. Johansson, M.A.; Saderi, D. Open peer-review platform for COVID-19 preprints. Nat. Cell Biol. 2020, 579, 29. [Google Scholar] [CrossRef] [PubMed] [Green Version]
  16. Haghani, M.; Bliemer, M.C. Covid-19 pandemic and the unprecedented mobilisation of scholarly efforts prompted by a health crisis: Scientometric comparisons across SARS, MERS and 2019-nCoV literature. Scientometrics 2020, 125, 2695–2726. [Google Scholar] [CrossRef]
  17. Hale, T.; Thomas, B.; Noam, A.; Cameron-Blake, E.; Hallas, L.; Kira, B.; Majumdar, S.; Petherick, A.; Phillips, T.; Tatlow, H.; et al. “Variation in Government Responses to COVID-19” Version 9.0. In Blavatnik School of Government Working Paper; University of Oxford: Oxford, UK, 2020; Available online: www.bsg.ox.ac.uk/COVIDtracker (accessed on 10 December 2020).
  18. Gettleman, J.; Schultz, K. Modi Orders 3-Week Total Lockdown for All 1.3 Billion Indians. Available online: https://www.nytimes.com/2020/03/24/world/asia/india-coronavirus-lockdown.html (accessed on 17 January 2021).
  19. Arksey, H.; O’Malley, L. Scoping studies: Towards a methodological framework. Int. J. Soc. Res. Methodol. 2005, 8, 19–32. [Google Scholar] [CrossRef] [Green Version]
  20. Daudt, H.M.; van Mossel, C.; Scott, S.J. Enhancing the scoping study methodology: A large, inter-professional team’s experience with Arksey and O’Malley’s framework. BMC Med. Res. Methodol. 2013, 13, 48. [Google Scholar] [CrossRef] [PubMed] [Green Version]
  21. Levac, D.; Colquhoun, H.; O’Brien, K.K. Scoping studies: Advancing the methodology. Implement. Sci. 2010, 5, 1–9. [Google Scholar] [CrossRef] [Green Version]
  22. Haustein, S.; Peters, I.; Bar-Ilan, J.; Priem, J.; Shema, H.; Terliesner, J. Coverage and adoption of altmetrics sources in the bibliometric community. Scientometrics 2014, 101, 1145–1163. [Google Scholar] [CrossRef] [Green Version]
  23. Ellegaard, O.; Wallin, J.A. The bibliometric analysis of scholarly production: How great is the impact? Scientometrics 2015, 105, 1809–1831. [Google Scholar] [CrossRef] [PubMed] [Green Version]
  24. Garousi, V. A bibliometric analysis of the Turkish software engineering research community. Scientometrics 2015, 105, 23–49. [Google Scholar] [CrossRef]
  25. Tang, K.-Y.; Chang, C.-Y.; Hwang, G.-J. Trends in artificial intelligence-supported e-learning: A systematic review and co-citation network analysis (1998–2019). Interact. Learn. Environ. 2021, 1–19. [Google Scholar] [CrossRef]
  26. Singh, V.K.; Uddin, A.; Pinto, D. Computer science research: The top 100 institutions in India and in the world. Scientometrics 2015, 104, 529–553. [Google Scholar] [CrossRef]
  27. El Mohadab, M.; Bouikhalene, B.; Safi, S. Bibliometric method for mapping the state of the art of scientific production in COVID-19. Chaos Solitons Fractals 2020, 139, 110052. [Google Scholar] [CrossRef]
  28. Tunger, D.; Eulerich, M. Bibliometric analysis of corporate governance research in German-speaking countries: Applying bibliometrics to business research using a custom-made database. Scientometrics 2018, 117, 2041–2059. [Google Scholar] [CrossRef]
  29. Harande, Y.I. Exploring the literature of diabetes in Nigeria: A bibliometrics study. Afr. J. Diabetes Med. 2011, 19, 8–11. [Google Scholar]
  30. Zhu, Y.; Jiang, S.; Han, X.; Gao, X.; He, G.; Zhao, Y.; Li, H. A bibliometrics review of water footprint re-search in China: 2003–2018. Sustainability 2019, 11, 5082. [Google Scholar] [CrossRef] [Green Version]
  31. Wei, J.; Liang, G.; Alex, J.; Zhang, T.; Ma, C. Research Progress of Energy Utilization of Agricultural Waste in China: Bibliometric Analysis by Citespace. Sustainability 2020, 12, 812. [Google Scholar] [CrossRef] [Green Version]
  32. Aristovnik, A.; Ravšelj, D.; Umek, L. A Bibliometric Analysis of COVID-19 across Science and Social Science Research Landscape. Sustainability 2020, 12, 9132. [Google Scholar] [CrossRef]
  33. Yan, B.; Zhang, X.; Wu, L.; Zhu, H.; Chen, B. Why Do Countries Respond Differently to COVID-19? A Comparative Study of Sweden, China, France, and Japan. Am. Rev. Public Adm. 2020, 50, 762–769. [Google Scholar] [CrossRef]
  34. Brainard, J. Scientists are drowning in COVID-19 papers. Can new tools keep them afloat? Science 2020, 1. [Google Scholar] [CrossRef]
  35. Colavizza, G.; Costas, R.; Traag, V.A.; van Eck, N.J.; van Leeuwen, T.; Waltman, L. A scientometric overview of CORD-19. PLoS ONE 2020, 16, e0244839. [Google Scholar]
  36. Gallegos, M.; Cervigni, M.; Consoli, A.J.; Caycho-Rodríguez, T.; Polanco, F.A.; Martino, P.; Pecanha, V.D.C.; Videla, C.B.; Polanco-Carrasco, R.; Cusinato, A.M. COVID-19 in Latin America: A Bibliometric Analysis of Scientific Publications in Health. Electron. J. Gen. Med. 2020, 17, em261. [Google Scholar] [CrossRef]
  37. Patil, S.B. Indian Publications on SARS-CoV-2: A bibliometric study of WHO COVID-19 database. Diabetes Metab. Syndr. Clin. Res. Rev. 2020, 14, 1171–1178. [Google Scholar]
  38. Sa’ed, H.Z. The Arab region’s contribution to global COVID-19 research: Bibliometric and visualization analysis. Glob. Health 2021, 17, 1–10. [Google Scholar]
  39. Shamsi, A.; Mansourzadeh, M.J.; Ghazbani, A.; Khalagi, K.; Fahimfar, N.; Ostovar, A. Contribution of Iran in COVID-19 studies: A bibliometrics analysis. J. Diabetes Metab. Disord. 2020, 19, 1845–1854. [Google Scholar] [CrossRef]
  40. Şenel, E.; Topal, F.E. Holistic Analysis of Coronavirus Literature: A Scientometric Study of the Global Publications Relevant to SARS-CoV-2 (COVID-19), MERS-CoV (MERS) and SARS-CoV (SARS). Disaster Med. Public Health Prep. 2020, 30, 1–8. [Google Scholar] [CrossRef]
  41. Hu, Y.; Chen, M.; Wang, Q.; Zhu, Y.; Wang, B.; Li, S.; Xu, Y.; Zhang, Y.; Liu, M.; Wang, Y.; et al. From SARS to COVID-19: A bibliometric study on emerging infectious diseases with natural language processing technologies. Res. Sq. 2020, in press. [Google Scholar]
  42. Petrushka, A.; Komova, M.; Fedushko, S. Scientific Content: Language Expansion in Bibliometric Databases. In Proceedings of the International Conference on Cyber Hygiene and Conflict Management in Global Information Networks, Kyiv, Ukraine, 30 November 2019; Volume 2654, pp. 375–389. [Google Scholar]
  43. Lancet, T. India under COVID-19 lockdown. Lancet 2020, 395, 1315. [Google Scholar] [CrossRef]
  44. Baas, J.; Schotten, M.; Plume, A.; Côté, G.; Karimi, R. Scopus as a curated, high-quality bibliometric data source for academic research in quantitative science studies. Quant. Sci. Stud. 2020, 1, 377–386. [Google Scholar] [CrossRef]
  45. Van Eck, N.J.; Waltman, L. Software survey: VOSviewer, A computer program for bibliometric mapping. Scientometrics 2010, 84, 523–538. [Google Scholar] [CrossRef] [Green Version]
  46. Small, H. Co-citation in the scientific literature: A new measure of the relationship between two documents. J. Am. Soc. Inf. Sci. 1973, 24, 265–269. [Google Scholar] [CrossRef]
  47. Kessler, M.M. Bibliographic coupling between scientific papers. Am. Doc. 1963, 14, 10–25. [Google Scholar] [CrossRef]
  48. Cobo, M.; Lopez-Herrera, A.G.; Herrera-Viedma, E.; Herrera, F. An approach for detecting, quantifying, and visualizing the evolution of a research field: A practical application to the Fuzzy Sets Theory field. J. Inf. 2011, 5, 146–166. [Google Scholar] [CrossRef]
  49. Hirsch, J.E. An index to quantify an individual’s scientific research output. Proc. Natl. Acad. Sci. USA 2005, 102, 16569–16572. [Google Scholar] [CrossRef] [Green Version]
  50. Bertoli-Barsotti, L.; Lando, T. On a formula for the h-index. J. Informetr. 2015, 9, 762–776. [Google Scholar] [CrossRef]
  51. Acedo, F.J.; Barroso, C.; Casanueva, C.; Galán, J.L. Co-Authorship in Management and Organizational Studies: An Empirical and Network Analysis. J. Manag. Stud. 2006, 43, 957–983. [Google Scholar] [CrossRef]
  52. Leydesdorff, L. Theories of citation? Scientometrics 1998, 43, 5–25. [Google Scholar] [CrossRef]
  53. Martyn, J. Bibliographic Coupling. J. Doc. 1964, 20, 236. [Google Scholar] [CrossRef]
  54. Le Quéré, C.; Jackson, R.B.; Jones, M.W.; Smith, A.; Abernethy, S.; Andrew, R.M.; De-Gol, A.J.; Willis, D.R.; Shan, Y.; Canadell, J.G.; et al. Temporary reduction in daily global CO2 emissions during the COVID-19 forced confinement. Nat. Clim. Chang. 2020, 10, 647–653. [Google Scholar] [CrossRef]
  55. Bouwer, J. Will Airline Hubs Recover from COVID-19? Available online: https://www.mckinsey.com/industries/travel-logistics-and-transport-infrastructure/our-insights/will-airline-hubs-recover-from-COVID-19#- (accessed on 17 January 2021).
  56. Liu, J.; Qiao, P.; Ding, J.; Hankinson, L.; Harriman, E.H.; Schiller, E.M.; Ramanauskaite, I.; Zhang, H. Will the Aviation Industry Have a Bright Future after the COVID-19 Outbreak? Evidence from Chinese Airport Shipping Sector. J. Risk Financial Manag. 2020, 13, 276. [Google Scholar] [CrossRef]
  57. Bourdrel, T.; Annesi-Maesano, I.; Alahmad, B.; Maesano, C.N.; Bind, M.-A. The impact of outdoor air pollution on COVID-19: A review of evidence from In Vitro, animal and human studies. Eur. Respir. Rev. 2021, 30, 200242. [Google Scholar] [CrossRef]
  58. Vinuesa, R.; Theodorou, A.; Battaglini, M.; Dignum, V. A socio-technical framework for digital contact tracing. Results Eng. 2020, 8, 100163. [Google Scholar] [CrossRef]
  59. Raman, R.; Achuthan, K.; Vinuesa, R.; Nedungadi, P. COVIDTAS COVID-19 Tracing App Scale—An Evaluation Framework. Sustainability 2021, 13, 2912. [Google Scholar] [CrossRef]
  60. Shahroz, M.; Ahmad, F.; Younis, M.S.; Ahmad, N.; Boulos, M.N.K.; Vinuesa, R.; Qadir, J. COVID-19 digital contact tracing applications and techniques: A review post initial deployments. Transp. Eng. 2021, 5, 100072. [Google Scholar] [CrossRef]
  61. Goals, R.; Vinuesa, H.; Azizpour, I.; Leite, M.; Balaam, V.; Dignum, S.; Domisch, A.; Felländer, S.D.; Langhans, M.; Tegmark, F.; et al. The role of artificial intelligence in achieving the Sustainable Development. Nat. Commun. 2020, 11, 233. [Google Scholar]
  62. Naudé, W.; Vinuesa, R. Data, global development, and COVID-19: Lessons and consequences. In Heterogeneous Informality in Costa Rica and Nicaragua; UNU-WIDER: Helsinki, Finland, 2020. [Google Scholar]
  63. Mongeon, P.; Paul-Hus, A. The journal coverage of Web of Science and Scopus: A comparative analysis. Scientometrics 2016, 106, 213–228. [Google Scholar] [CrossRef]
  64. Wang, P.; Tian, D. Bibliometric analysis of global scientific research on COVID-19. J. Biosaf. Biosecurity 2021, 3, 4–9. [Google Scholar] [CrossRef] [PubMed]
  65. Yu, Y.; Li, Y.; Zhang, Z.; Gu, Z.; Zhong, H.; Zha, Q.; Yang, L.; Zhu, C.; Chen, E. A bibliometric analysis using VOSviewer of publications on COVID-19. Ann. Transl. Med. 2020, 8, 816. [Google Scholar] [CrossRef] [PubMed]
  66. Felice., F.D.E.; Polimeni, A. Coronavirus Disease (COVID-19): A Machine Learning Bibliometric Analysis. In Vivo 2020, 34 (Suppl. 3), 1613–1617. [Google Scholar] [CrossRef]
  67. Raman, R.; Sairam, B.; Veena, G.; Vachharajani, H.; Nedungadi, P. Adoption of online proctored examinations by university students during COVID-19: Innovation diffusion study. Educ. Inf. Technol. 2021, 1–20. [Google Scholar] [CrossRef]
  68. Elhawary, H.; Salimi, A.; Diab, N.; Smith, L. Bibliometric Analysis of Early COVID-19 Research: The Top 50 Cited Papers. Infect. Dis. Res. Treat. 2020, 13, 1178633720962935. [Google Scholar] [CrossRef]
  69. Bonilla-Aldana, D.K.; Rada, K.; Montoy Posada, J.P.; Ocampo, S.R.; Mondolfi, A.P.; Rabaan, A.A.; Sah, R.; Rodríguez-Morales, A.J. SARS-CoV, MERS-CoV and now the 2019-novel CoV: Have we investigated enough about coronaviruses?—A bibliometric analysis. Travel Med. Infect. Dis. 2020, 33, 101566. [Google Scholar] [CrossRef]
  70. Roberts, M.; Covnet, A.; Driggs, D.; Thorpe, M.; Gilbey, J.; Yeung, M.; Ursprung, S.; Aviles-Rivero, A.I.; Etmann, C.; McCague, C.; et al. Common pitfalls and recommendations for using machine learning to detect and prognosticate for COVID-19 using chest radiographs and CT scans. Nat. Mach. Intell. 2021, 3, 199–217. [Google Scholar] [CrossRef]
  71. Mehta, A.A.; Haridas, N.; Belgundi, P.; Jose, W.M. A systematic review of clinical and laboratory parameters associated with increased severity among COVID-19 patients. Diabetes Metab. Syndr. Clin. Res. Rev. 2021, 15, 535–541. [Google Scholar] [CrossRef] [PubMed]
  72. McMahon, C.J.; Tretter, J.T.; Redington, A.N.; Bu’Lock, F.; Zühlke, L.; Heying, R.; Mattos, S.; Kumar, R.K.; Jacobs, J.P.; Windram, J.D. Medical education and training within congenital cardiology: Current global status and future directions in a post COVID-19 world. Cardiol. Young 2021, 12, 1–13. [Google Scholar] [CrossRef] [PubMed]
Figure 1. Co-authorship network and publications in India.
Sustainability 13 07555 g001
Figure 2. Co-authorship network and citations in India.
Sustainability 13 07555 g002
Figure 3. Keyword co-occurrences: (a) associated with SARS studies; (b) associated with MERS studies; (c) associated with COVID-19 studies.
Sustainability 13 07555 g003
Figure 4. Bibliographic couplings of countries associated with (a) SARS studies; (b) MERS studies; (c) COVID-19 studies.
Sustainability 13 07555 g004
Figure 5. Bibliographic couplings of journals associated with (a) SARS studies; (b) MERS studies; (c) COVID-19 studies.
Sustainability 13 07555 g005aSustainability 13 07555 g005b
Table 1. COVID-19 related publications and citations worldwide.
CountryNumber of Publications% PublicationsCitationsCitations/PublicationCases/1M PopulationDeaths/1M PopulationOxford Stringency Index
United States23,60825.4%194,1178.260,900105768.1
China10,35611.1%273,49326.460 13 170.5
UK10,00210.7%90,4749.037,347108969.6
Italy84549.0%74,5278.835,245123565.2
India62236.7%20,8163.3740410778.7
Spain38344.1%23,6036.241,415108767.2
Canada38184.1%31,0048.115,37141266.5
Germany35314.0%41,89511.920,92441060.6
France35263.8%36,77610.439,79698563.9
Australia34373.7%29,7728.711083565.8
1 Data about cases and deaths from China were not updated at the source of information for Table 1 but given the early outbreak of COVID-19 in China, we chose to include it in our study.
Table 2. Top collaborating countries with India for COVID-19 studies.
CountryNumber of CitationsNumber of PublicationsCitations/Publications
United States42335957.1
China252821211.9
UK24203357.2
Saudi Arabia15451758.8
Japan15177021.7
Italy13671608.5
Colombia13228715.2
South Korea132110612.5
Nepal13195822.7
Spain11266617.1
France10385718.2
Brazil10118212.3
Table 3. Comparison of Publications and Citations for SARS, MERS, and COVID-19.
OutbreaksSARSMERSCOVID-19
Publications1675586223
Citations2207710920,816
Table 4. COVID-19 publications by type.
Publication TypeIndia%World%
Article318651%50,86554%
Letters, Review239238%25,20327%
Others64510%17,41719%
Table 5. Top contributing institutions in the world for COVID-19 studies.
Institution NameNumber of PublicationsCountryOwnershipDiscipline
Harvard Medical School1552United StatesPrivateMedical
Huazhong University of Science and Technology1203ChinaPublicMultidisciplinary
Tongji Medical College1143ChinaPrivateMedical
Inserm1050FrancePublicMedical
University of Toronto999CanadaPublicMultidisciplinary
Università degli Studi di Milano851ItalyPublicMultidisciplinary
University of Oxford838United KingdomPrivateMultidisciplinary
Università degli Studi di Roma La Sapienza797ItalyPublicMultidisciplinary
University College London774United KingdomPrivateMultidisciplinary
Massachusetts General Hospital735United StatesPrivateMedical
Table 6. Top contributing institutions in India for COVID-19 studies.
Institution Name Number of PublicationsNumber of CitationsCitations/PublicationOwnershipDiscipline
AIIMS New Delhi4279422.2PublicMedical
PGI Chandigarh30912484.0PublicMedical
Saveetha (Medical)171240.1PrivateMedical
Saveetha (Dental)162400.2PrivateDental
Datta Meghe Wardha138770.6PrivateMedical
DY Patil Pune1322932.2PrivateMedical
ICMR New Delhi1095154.7PublicMedical
Manipal, MAHE1074394.1PrivateMultidisciplinary
NIMHANS Bengaluru1004464.5PublicMedical
SG PGI Lucknow973463.6PublicMedical
AIIMS Jodhpur931461.6PublicMedical
Tata Memorial915646.2PublicMedical
ICAR New Delhi90129514.4PublicAgriculture
King George Lucknow864845.6PublicMedical
IVRI (Veterinary) 87130915.0PublicMedical
University of Delhi822483.0PublicMultidisciplinary
AIIMS Rishikesh811271.6PublicMedical
Homi Bhabha Mumbai723745.2PublicMultidisciplinary
Amity University66891.3PrivateMultidisciplinary
VMMC, Safdarjang Hospital661983.0PublicMedical
CMC Vellore632323.7PrivateMedical
Jamia Millia Islamia624036.5PublicMultidisciplinary
JIPMER Pondicherry574998.8PublicMedical
Table 7. Most influential journals.
Journal TitleNumber of PublicationsNumber of CitationsCitations/PublicationSJR (Q1–Q4)h-Index
Journal of Biomolecular Structure and Dynamics274286810.5Q232
Indian Journal of Medical Research1868564.6Q281
Asian Journal of Psychiatry935175.6Q229
PLOS ONE541182.2Q1300
Chaos Solitons and Fractals473818.1Q1132
Diabetes Research and Clinical Practice 4297023.1Q1107
Life Sciences413879.4Q1156
Dermatologic Therapy411794.4Q262
Diabetes and Metabolic Syndrome382326.1Q229
Science of the Total Environment3796426.1Q1224
Indian Journal of Paediatrics2757821.4NANA
Virus Research2326211.4Q2114
JCO Global Oncology1528819.2NANA
Journal of Medical Virology1321116.2Q2111
The Lancet1217014.2Q1747
Aging and Disease1157151.9Q143
Brain Behavior and Immunity1028228.2Q1140
Travel Medicine and Infectious disease861476.8Q140
Kidney International518036Q1266
Nature Medicine48020Q1524
The Lancet Infectious Diseases45012.5Q1217
Table 8. Top-performing subject areas in India.
Subject AreaSubject Area ClassificationsNumber of Publications
Health Sciences (67%)Medicine3825
Dentistry138
Health Professions85
Nursing77
Veterinary40
Life Sciences (43%)Biochemistry, Genetics and Molecular Biology1098
Pharmacology, Toxicology and Pharmaceutics724
Immunology and Microbiology459
Agricultural and Biological Sciences208
Neuroscience190
Physical Sciences (29%)Computer Science341
Engineering296
Environmental Science284
Mathematics198
Chemistry141
Physics and Astronomy118
Chemical Engineering116
Energy103
Materials Science90
Earth and Planetary Sciences70
Decision Sciences64
Social Sciences (15%)Social Sciences452
Economics, Econometrics and Finance175
Psychology150
Business, Management and Accounting94
Arts and Humanities59
Table 9. Number of publications and citations corresponding to COVID-19 studies from India with impact on each of the 17 SDGs.
SDGPublicationsCitations
3 Good Health and Well Being223014,066
8 Decent Work and Economic Growth163256
11 Sustainable Cities and Communities1511354
4 Quality Education148553
16 Peace, Justice and Strong Institutions108247
13 Climate Action71118
7 Affordable and Clean Energy66103
2 Zero Hunger54160
10 Reduced Inequalities3897
6 Clean Water and Sanitation34222
12 Responsible Consumption and Production29248
1 No Poverty1149
15 Life on Land615
5 Gender Equality38
9 Industry, Innovation, and Infrastructure20
14 Life Below Water21
17 Partnerships for the Goals21
Publisher’s Note: MDPI stays neutral with regard to jurisdictional claims in published maps and institutional affiliations.

