Abstract
World Health Organization gives great importance to excessive alcohol consumption among the population and its negative effects. It proposes a set of measures to reduce alcohol consumption and its harmful effects. The objective of our study was to estimate the effects of excise tax on alcohol in Romania, from two perspectives. On the one hand, we analyze the effects of alcohol excise on the consumption of alcoholic beverages among the Romanian population. We also consider the relationship between alcohol consumption and the incidence of diseases and deaths caused by it. On the other hand, we analyze the effects of the excise tax on alcohol on the state budget, through the revenues from the sales of alcohol. For achieving the main purpose of the paper, we analyze secondary data using both graphical and statistical methods. The statistical methods imply testing correlation between variables and also a regression model. The obtained results highlight the fact that the excise taxes on alcohol have not a significant effect on alcohol consumption among the population. At the same time, we observed that the revenues from excise taxes in alcohol at the state budget had an increasing trend. These results highlight the fact that the increase of excise duties for alcoholic beverages, in Romania, does not reduce their consumption. So, in order to limit the effects of this harmful habit of a certain part of the Romanian population, the decision-makers must take additional measures, the fiscal ones being relatively inefficient.
1. Introduction
In a general context in which the desideratum of sustainability is approached in accordance with various aspects of the activity in society and economy, which need improvements, our paper explores the possible correlations on the line taxation—alcohol consumption—public health. At European level, alcohol is the third leading risk factor for illness and premature death, after smoking and high blood pressure [1]. The main risk factors that affect the health of people from Romania are unhealthy eating habits, smoking, alcohol consumption and low levels of physical activity [2].
Alcohol consumption is a major threat to public health, because on average, over a third of adults in Romania reported that they consumed episodic excess alcohol at least once a month. Thus, Romania is in second place in the European Union with a rate of 35% of heavy episodic drinking, significantly exceeding the EU average which is of 20%. The European Observatory on Health Systems and Policies 2019 [2] also shows significant differences between sexes, highlighting higher alcohol consumption among men compared to women.
According to the latest WHO Report [3], in Romania, alcohol consumption reported to the population aged 15 and over, was 12.6 liters per capita per year (in 2016). Alcohol consumption reported exclusively to the drinking population was 26.6 liters per year for men and 9 liters per year for women. Almost 70% of the population aged 15 and over have consumed alcohol in the last 12 months (80% of men and 54.5% of women). Only 6.5% of men and 19% of women did abstain for life. Less than one in 10 former drinkers give up alcohol. Although the level of alcohol consumption has decreased progressively (from 15 liters per capita per year in 2010 to 12.6 liters per capita per year in 2016), Romania exceeds by over 3 percentage the European averages of consumption for all years of study (2010–2016). Moreover, 14% of deaths from Romania can be attributed to alcohol consumption, which is more than twice the proportion observed at EU level.
The situation is more worrying because two out of five adolescents aged 15 and 16 in Romania said, in 2015, that they had experienced at least one episode of excessive alcohol consumption during the previous month [3]. This rate is also situated above the EU average.
According to the WHO data for 2016 [4] 1.3% of Romania′s population aged 15 and over is dependent on alcohol (2% of men and 0.6% of women). More than half (56%) of Romanians prefers beer, 28% wine and 16% spicy drinks. Half of the alcohol consumers in Romania have risky consumption, with the prevalence of episodes of excessive consumption being one of the highest in Europe (67.2% among men and 31.2% among women) [3].
The rates of avoidable mortality through prevention and mortality by treatable causes are very high in Romania. In 2016 the rate of preventable mortality through prevention was 310 per 100,000 inhabitants, being among the fourth highest in Europe, which shows the need for effective public health and prevention interventions. The main causes of preventable mortality by prevention are ischemic heart disease, lung cancer, alcohol-related deaths and accidents [2]. At the same time, health expenditures are lower in Romania than in any other EU country. Romania also spends very little on prevention, only 18 EUR per person in 2017 or 1.7% of total health spending, compared to 3.1% in the EU [2]. Thus, alcohol related deaths and accidents in Romania could be reduced by increasing the rate of preventable mortality through prevention, increasing the costs of prevention.
Also, the sustainability in alcohol consumption can be assessed by achieving responsible consumption. This can only be achieved by adopting appropriate measures and policies for increasing the responsibility in the consumption of alcoholic beverages.
The consumption of alcohol and the magnitude of the health problems due to alcohol consumption are influenced by a variety of factors that affect both individuals and society as a whole [5,6,7,8]. In this study we focus especially on the environmental factors that include the impact of the alcohol policies on alcohol consumption.
Regarding alcohol policies all European countries have a set of laws and regulations addressing alcohol. Romania has adopted measures and restrictions regarding alcohol consumption, but also alcohol marketing regulations and labelling information. For example, the legal minimum age to buy alcoholic beverages in Romania is 18 years. There are also restrictions on the places of sale of alcoholic beverages. Romania has adopted legally binding regulations on alcohol advertising, imposing hours in which advertising is restricted to alcoholic beverages on TV and radio, but has also banned advertising of alcoholic beverages on the first and last page of printed magazines. Regarding beverage labels, they must contain health warnings such as: “Excessive consumption of alcohol seriously damages health” [9,10].
Studies in the field [11,12] have shown that the norms and values specific to a particular culture and also the socioeconomic inequalities could affect alcohol consumption disparities within and between countries. In a similar way, cultural norms that stimulate or, on the contrary, prohibit alcohol consumption shape various consumer behaviors. Religion has an essential role in shaping alcohol consumption behaviors. But it seems that the level of income also has a significant influence, because especially low- and middle-income countries have higher values in alcohol use and alcohol-attributable harms [13]. In 2015, the government of Romania established a national council to coordinate policies and actions to reduce excessive alcohol consumption. However, so far no concrete measures have been taken to address this major public health issue [2].
The aim of our paper is to empirically investigate if the consumption of alcoholic beverages from Romania can be reduced by fiscal means. Our study contributes to the literature in different ways. First, this study analyzess the relationship between the excise taxes on alcoholic beverages and their prices. Secondly, we focus on the relation between the evolution of the prices on alcohol in Romania and the consumption of alcoholic beverage. After that we try to identify the relationship between alcohol consumption in Romania and deaths associated with alcohol consumption. We want to identify whether the alcohol excise tax has the expected effects on harmful alcohol consumption.
The novelty of our study lies in pointing out the essential negative role that alcohol consumption has on the population, and the need for authorities and decision makers to identify and implement appropriate policies to reduce harmful use of alcohol among the population. Although there is a policy of excise taxes on alcoholic beverages, all the reports of organizations in the field show that alcohol consumption continues to be a major health problem, but also that the percentage of diseases caused by it and deaths related to alcohol use are still at quite high levels. Our paper is structured as follows: Section 1 contains a brief review of the literature related with the theme of the paper; in Section 2 we present the data used for the empirical analysis, the methodology and the variables considered; Section 3 details the results obtained and presents discussions based on them. The final section summarizes a set of conclusions and future directions of research.
2. Literature Review
In the literature it is highlighted that increasing the price of alcohol is one of the most effective strategies for reducing the harmful use of alcohol [14]. Almost all of the responding countries (95%) from the World Health Organization Report [3] have alcohol excise taxes. A couple of studies have also associated the price of alcohol with its consumption, pointing out that increasing the price is related with a decrease of harmful use of alcohol. Thus, Wagennar et al. [15] by conducting a statistical analysis of the results obtained by different studies have shown that public policies influencing the price of alcoholic beverages would significantly affect the alcohol related diseases and injury. The authors’ findings consider that doubling the excise taxes on alcohol would reduce alcohol-related mortality by an average of 35%, traffic crash deaths by 11%, sexually transmitted disease by 6%, violence by 2%, and crime by 1.4%. Babor et al. [16] have also provided evidence that increasing the taxes on alcohol represents the most effective way for a government to reduce alcohol-related harm. More recent studies [17] pointed out that in the case of Caribbean community countries increasing the taxes on alcohol would generate a decrease of its consumption. In addition, this study also highlighted the fact that there is a substantial potential for revenue generation from increases in taxes on alcohol and tobacco.
Chaloupka et al. [18] have emphasized that excise taxes are a powerful tool for reducing excessive drinking because the demands for these products are sensitive to prices, and governments that have raised or introduced taxes have seen reductions in consumption and improved health outcomes. But the authors also mention that due to the low share in the price of excise duties for alcohol, they still have a rather small impact, sometimes perhaps insignificant on consumption.
And yet, other studies have obtained opposite results, so Nelson and McNall [19] have shown that changes in taxes and prices have selective effects on harms determined by alcohol consumption. They obtained mixed results for policy-driven natural experiments on alcohol prices and resulting effects on alcohol-related harms. Thus, major changes in alcohol prices have more nuanced effects on particular subpopulations and alcohol harms, such as older or unemployed adults, suggesting more targeted policies may be required to address some harms.
McClelland and Iselin [20] have studied the effect of alcohol excise taxes on alcohol-related fatal traffic crashes and did not nfid evidence that the tax increases led to a long-term reduction in fatal alcohol-related crashes. With similar results Angus et al. [21] realizing a comparative analysis on alcohol taxation through European Union pointed out that there is only limited evidence that alcohol taxes are designed to minimize public health harms, instead, tax rates appear to reflect national alcohol production and consumption patterns.
Moreover, the substantiation of our approach, related to the area of public finance, took into account some important works in this matter, distinctly—from the perspective of fiscal-budgetary rules and principles [22,23,24,25,26,27], of ensuring the financial resources necessary for the system public health [28,29,30] or certain difficulties that may occur here [31,32,33].
3. Materials and Methods
3.1. Data
For analyzing the evolution of the excise taxes on alcoholic beverages we used the information provided by the Fiscal Code of Romania with its application norms. The Law no. 227/2015 on the Fiscal Code, updated by Government Emergency Ordinance no. 1/2020 of 6 January 2020 [34], defines the main types of alcoholic beverages (these are defined in Appendix A, Table A1). The excise taxes for each alcoholic beverage are measured in lei per hectoliter of product (see the Appendix A, Table A2).
Regarding the prices of alcoholic beverages, we collected data on consumer price indices for main types of alcoholic beverages from the Romanian Statistical Yearbook 2019 [35] for the period 2014–2018. The consumer price index is obtained by reporting the evolution from year t to the value 100 assigned to year t-1.
In order to analyze the consumption of alcoholic beverages in Romania, the data were obtained from the National Institute of Statistics, the Annual Reports on beverage consumption [36,37,38] for the period 2014–2018. In this part of the analysis we collected data for 3 aspects: average consumption per capita per year (total population, liters); average consumption per capita per year (total population, liters of 100% alcohol); average consumption per capita per year (population 15 years and over, liters of alcohol 100%) and we took into account both the consumption of alcoholic beverages in total and broke it down by main categories of alcoholic beverages: wine, beer and Plum brandy, brandy and other alcoholic beverages. For the variables expressing the consumption of liters of pure alcohol, we took into account both the values regarding the total population and also the people of 15 years or more. Total population includes the population of all ages. We included both variables in our analysis because the consumption of alcohol, in Romania, starts from younger ages. According to the National Institute of Public Health [39], about 60% of teens say they tasted their first drink before the age of 13, and 12% experienced the first episode of intoxication at that age. Moreover, the same study [39], shows that about 6% of young people under 18 from Romania started drinking alcohol before the age of 9, 4.37% between 9 and 10 years, 8.30% between 11 and 12 years, almost 20% between 13 and 14 years, 17.39% between 15 and 16 years, and only 4.78% after the age of 17.
The amount of alcohol and the pattern of consumption vary from one individual to another. The World Health Organization considers that there is a close relationship between the level of alcohol consumption and the risk of alcohol dependence and health consequences. Thus, in order to analyze the negative effects of excessive alcohol consumption in Romania we have gathered data from the World Health Organization [40] and the Institute for Health Metrics and Evaluation [41].
3.2. Methods
To achieve the objectives proposed in this paper we use an empirical analysis. We analyze secondary data using both graphical and statistical methods. The statistical methods imply testing correlation between variables and also a regression model. We have focused our analysis in three main directions. Thus, firstly we have analyzed the relationships between excise taxes on alcoholic beverages and their prices. After that we have extended the analysis by testing the relationships between the prices and the level of consumption of alcoholic beverages but also between alcohol consumption and its harmful effects on human health. The period chosen for the analysis is 2014–2018 because we referred to the availability of data for all variables considered so that the results obtained are comparable and accurate. The above-mentioned relations (Table 1) were tested on the case of Romania.

Table 1.
Description of the relations tested and the variables considered.
Starting from those stated in the literature review above and related to our expectations the empirical investigation will focus on testing the following set of hypotheses:
Hypothesis 1 (H1).
Higher excise taxes for alcoholic beverages are related to higher prices of these beverages;
Hypothesis 2 (H2).
Higher prices of alcoholic beverages are related to lower consumption of these beverages;
Hypothesis 3 (H3).
Higher consumption of alcoholic beverages is related to increased levels of alcohol-attributable mortality.
For achieving the main purpose of this paper, we use firstly the graphical method because it helps us to realize a visual analysis of the evolution of the variables. The next step involves the statistical analysis of the variables by testing four models (see Table 1). The first step of the empirical investigation implies testing the correlations between the variables for each model to see if there are links between variables. The correlation coefficient obtained will show us the strength and meaning of the correlation between the variables. If we find statistically significant correlations between the tested variables the next step involves applying the regression analysis to identify to what extent one variable depends on the other.
The general equation of the regression models tested is presented below:
where: i represents the time; 𝑦i: is the dependent variable (see Table 1 for the dependent variable of each model); α: represents the constant or intercept and measures the value where the regression line crosses the y-axis; X𝑖: represents the independent variables (see Table 1 for the independent variable of each model); ε𝑖 is the error term.
𝑦𝑖 = α + β1X𝑖 + ε𝑖
For carrying out the statistical analyses we use the Statistical Package for Social Science (SPSS) software, Statistics Standard 22 version. In the following we present a detail of the empirical analysis performed and discuss the results obtained.
4. Results and Discussions
4.1. The Relation between Excise Taxes and Prices of Alcoholic Beverages
For analyzing the relationship between the excise taxes on alcoholic beverages from Romania and their prices we firstly focus our attention on the value of excise taxes for different types of alcoholic beverages in Romania. The alcohol excise tax has varied over the last seven years; this evolution is presented in Appendix A, Table A2.
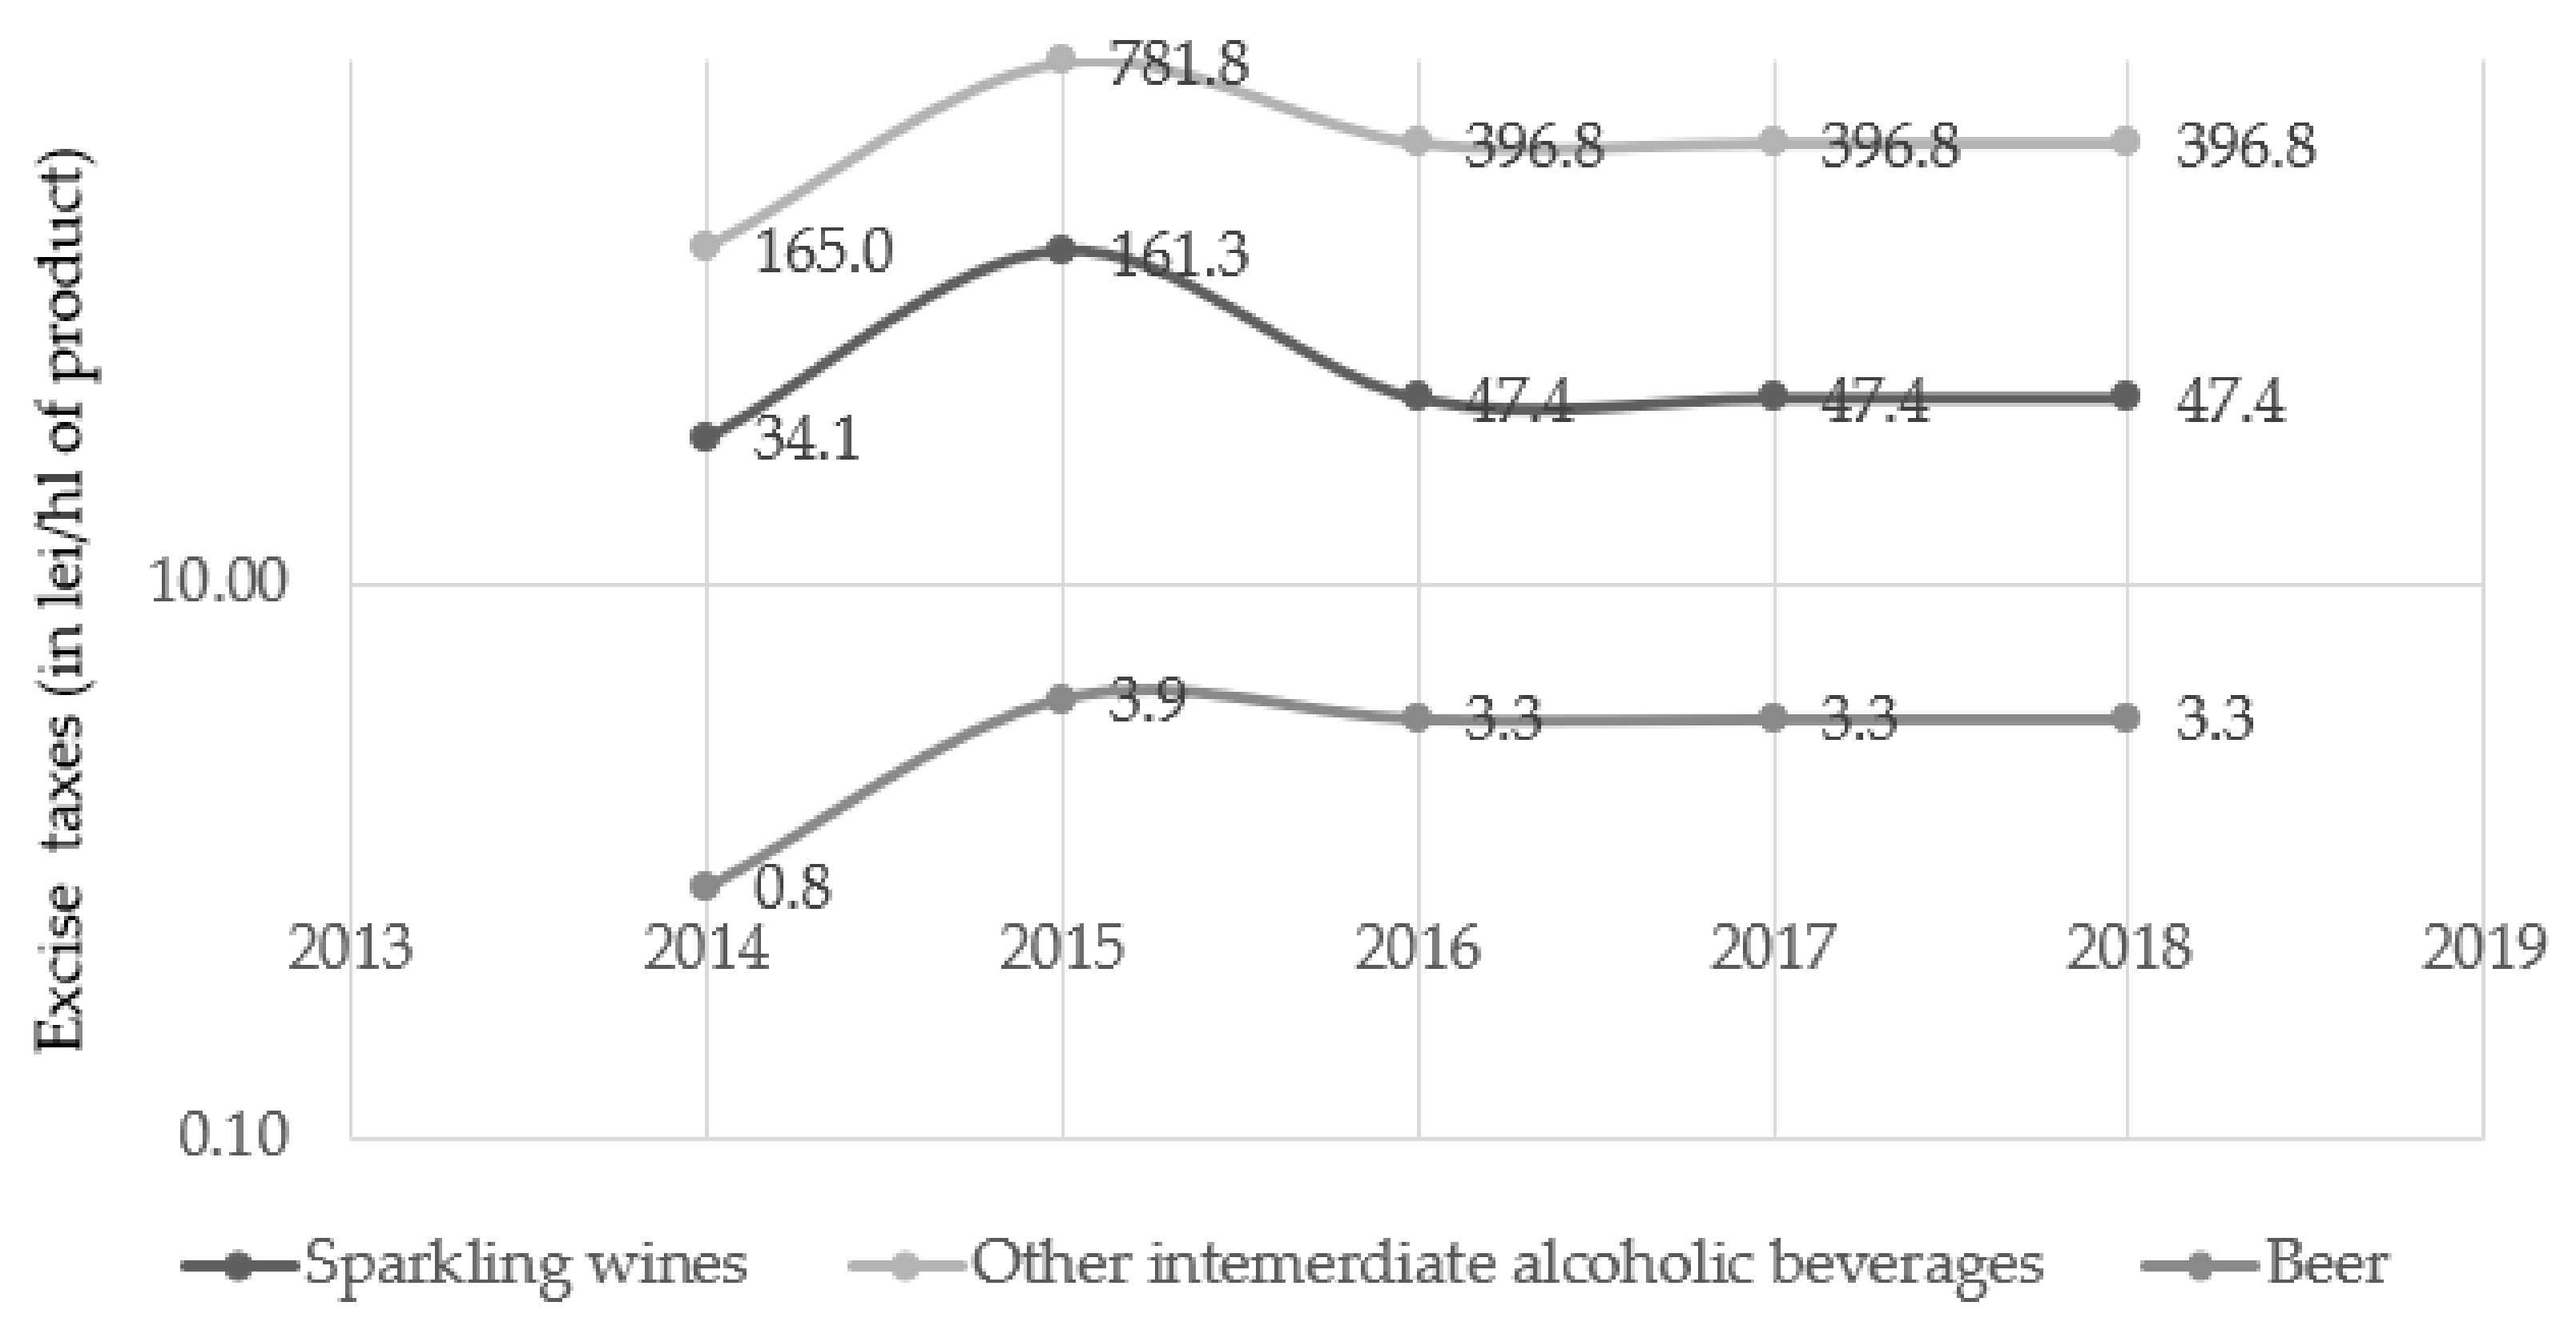
Figure 1 presents the evolution of excise tax for the main categories of alcoholic beverages taken into account by the authorities in Romania (beer, wine, and plum brandy, brandy and other alcoholic beverages).

Figure 1.
Evolution of excise taxes in Romania for the main alcoholic beverages, 2014–2018. Source: processed by the authors after the Fiscal Code of Romania with the application norms [42,43,44,45,46] and the Ministry of Public Finance [47], logarithmic scale.
The value of excise tax for all types of alcoholic beverages from Romania has decreased significantly in 2016, except for the tax on still fermented beverages, other than beer and wine, which increased from 47.38 lei per hectoliter to 396.84 lei per hectoliter of product. These reductions determined the profile taxed markets to register important decreases with a negative impact on the state budget [48]. In 2019, the excise tax for all the types of beverages has started to grow slightly, but they still remain below the values from 2015.
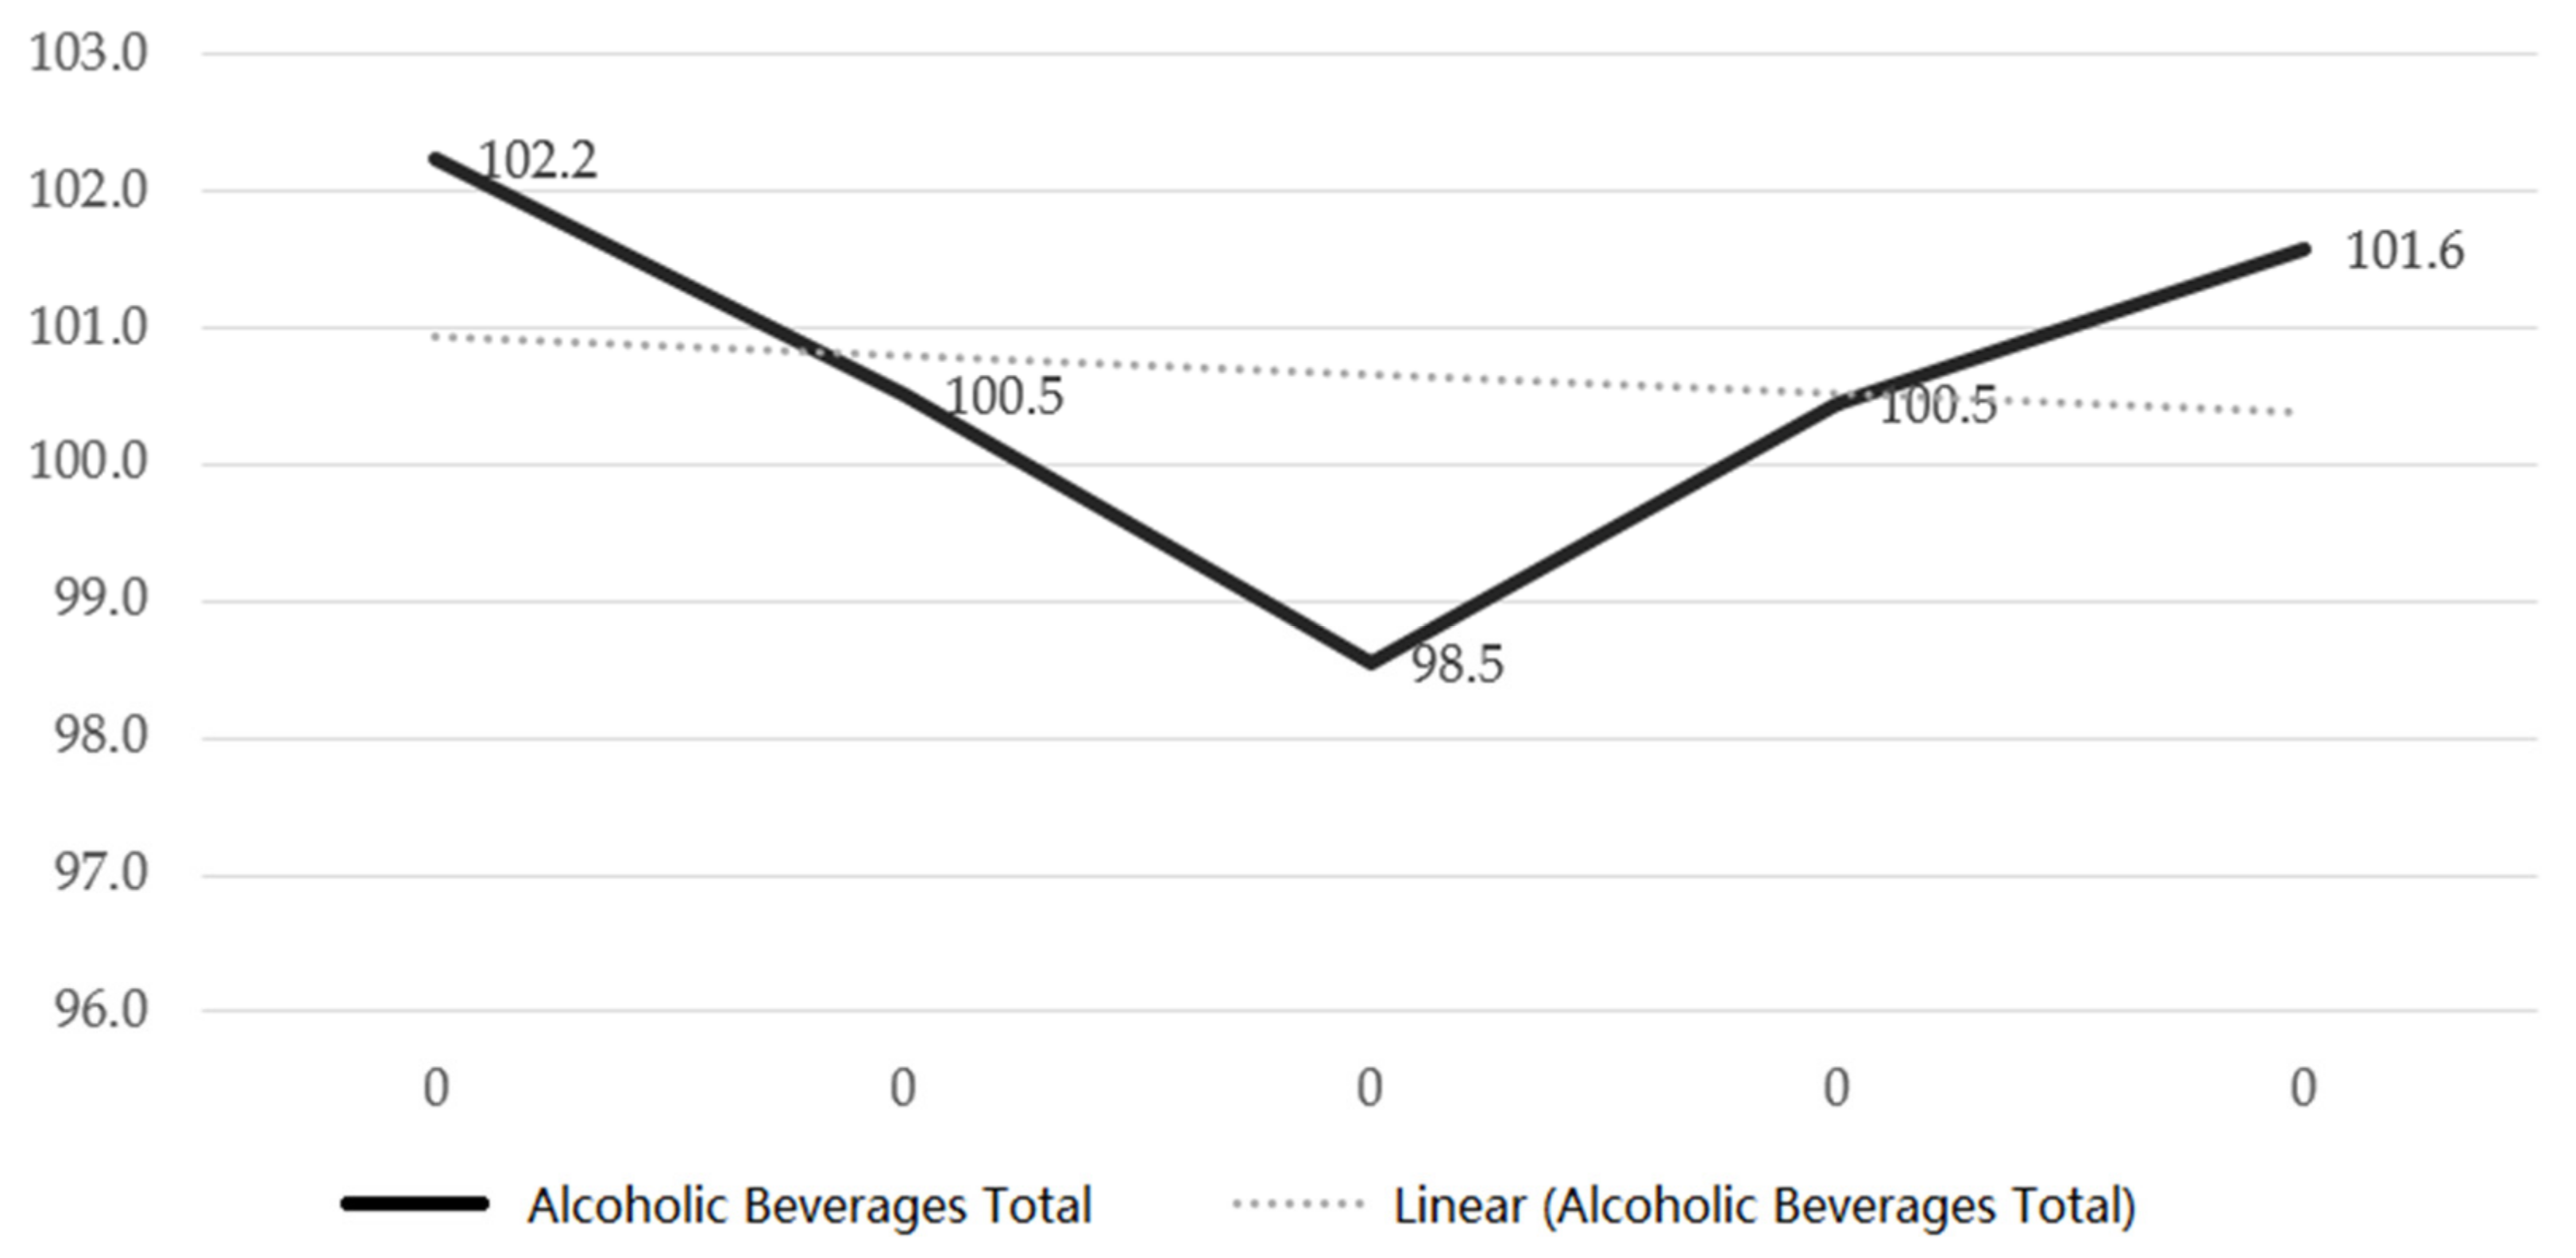
The consumer prices index for alcoholic beverages (as total) varied significantly for the period considered, having a downward trend (see Figure 2). In 2016 the consumer price index has registered a decrease of 1.46% compared to the previous year. This reduction can be associated with the decrease of excise taxes on alcoholic beverages registered in Romania in 2016 (see Table 1). In 2017 and 2018, prices have risen but at a relatively slow pace.
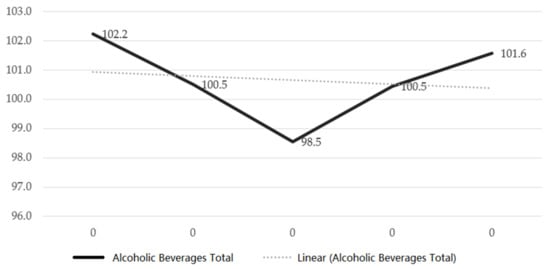
Figure 2.
Evolution of consumer price index * for alcoholic beverages, Romania, 2014–2018. * Current year/precedent year. Source: processed by the authors after data from the Romanian Statistical Yearbook [35].
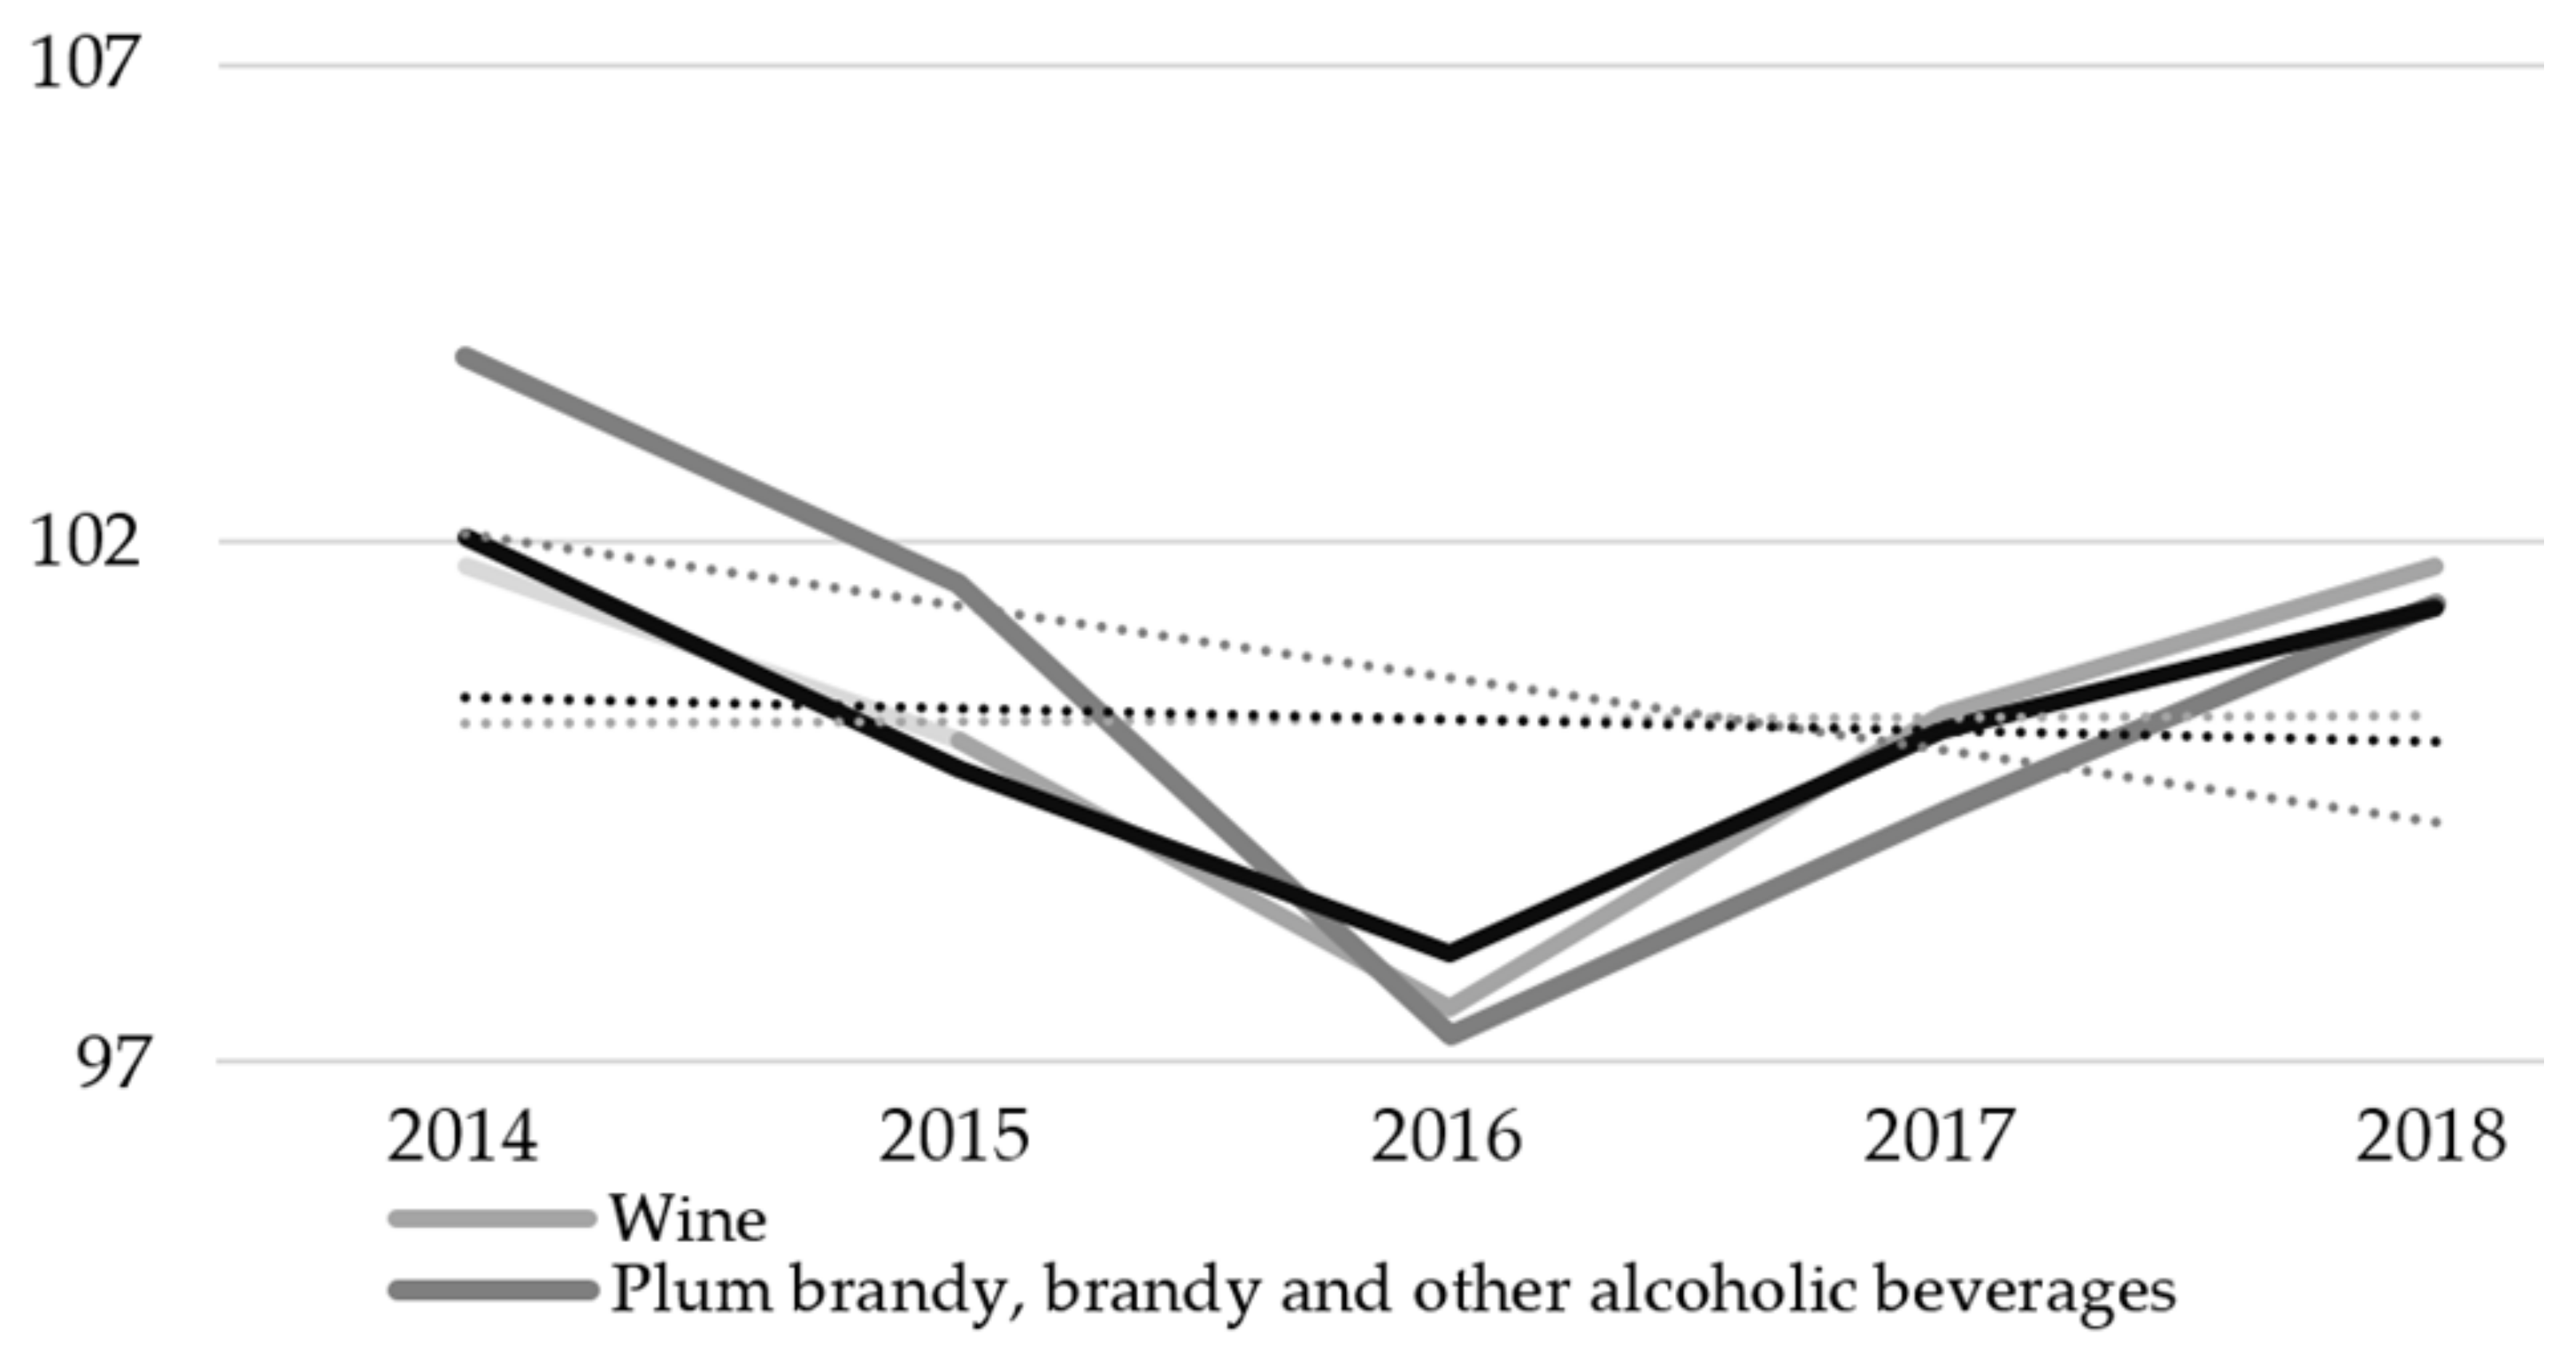
The prices of alcoholic beverages, broken down by categories, had also a downward trend in the period 2014–2018. From 2014, the prices of alcoholic beverages started to slow down their growth rates, so that in 2016 they all registered a decrease. The growth rate resumed in 2017 and continued with a slightly increasing trend in 2018. The decrease in the price of alcoholic beverages in 2016, for the three categories of beverages analyzed, can also be explained by the fact that in the same year there was a significant reduction of excise tax for all these types of alcoholic beverages (see Figure 3).
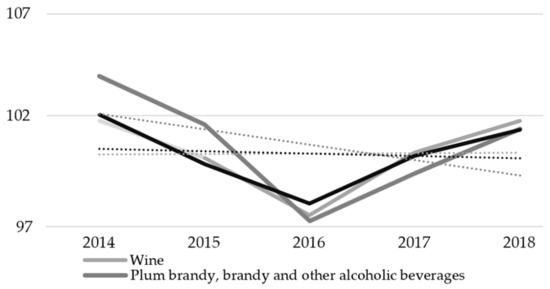
Figure 3.
Evolution of consumer price indices * for alcoholic beverages, by type of beverage, Romania, 2014–2018. * Current year/precedent year. Source: processed by the authors after data from Romanian Statistical Yearbook [35].
When testing the correlation between the excise taxes for the three main categories of alcoholic beverages (wine, beer and other alcoholic beverages such as: plum brandy, brandy and other) and the evolution of their prices, the results obtained (centralized in Table 2) show a negative low or medium correlation but are statistically insignificant.
Table 2.
The correlation between excise taxes of alcoholic beverages and their consumer price indices.
The price of alcoholic beverages is calculated taking into account several elements, including: the price at which the manufacturer sells, the distributor′s margin, the excise tax on alcohol, the discounts that suppliers pay to international retail store chains, retailers′ margins and VAT. Alcoholic beverage taxes generally account for a small share of the price, thus having little impact on the affordability of these products in most countries [18]. Thus, the change in the level of excise taxes has an influence on the price, but the price also depends on other elements.
From Figure 2 and Figure 3 we notice that the prices registered a decrease in 2016 in the context of the reduction of excise taxes. In the same time, the results of the analyzed correlations show that there is no statistically significant relationship between the changes in the level of excise tax for alcoholic beverages in Romania and the prices of these beverages. We must keep in mind that this result may be due to a small sample size. But, on the other hand, this result emphasizes that the changes in the prices of alcoholic beverages in Romania during 2014–2018 were influenced significantly by other factors not necessary by the evolution of the excise taxes. Here we can mention the effects on prices of the general VAT rate which was reduced in 2016 from 24% to 20%, and from 1 January 2017 it decreased from 20% to 19%. Therefore, we can conclude that the evolution of excise taxes for alcoholic beverages did not have a statistically significant effect on their prices, in the analyzed period, and that there are other factors with a greater influence on prices (e.g., VAT rate).
Since 2016, excise taxes for alcoholic beverages have tended to stagnate while beverage prices have continued to rise: in 2017 an increase of 0.63% for wine, 0.51% for beer, but a decrease of 0.14% for plum, brandy and other alcoholic beverages, and in 2018 an increase of 1.47% for beer, 1.80% for wine and 1.51% for other alcoholic beverages. Therefore, our first hypothesis is not sustained.
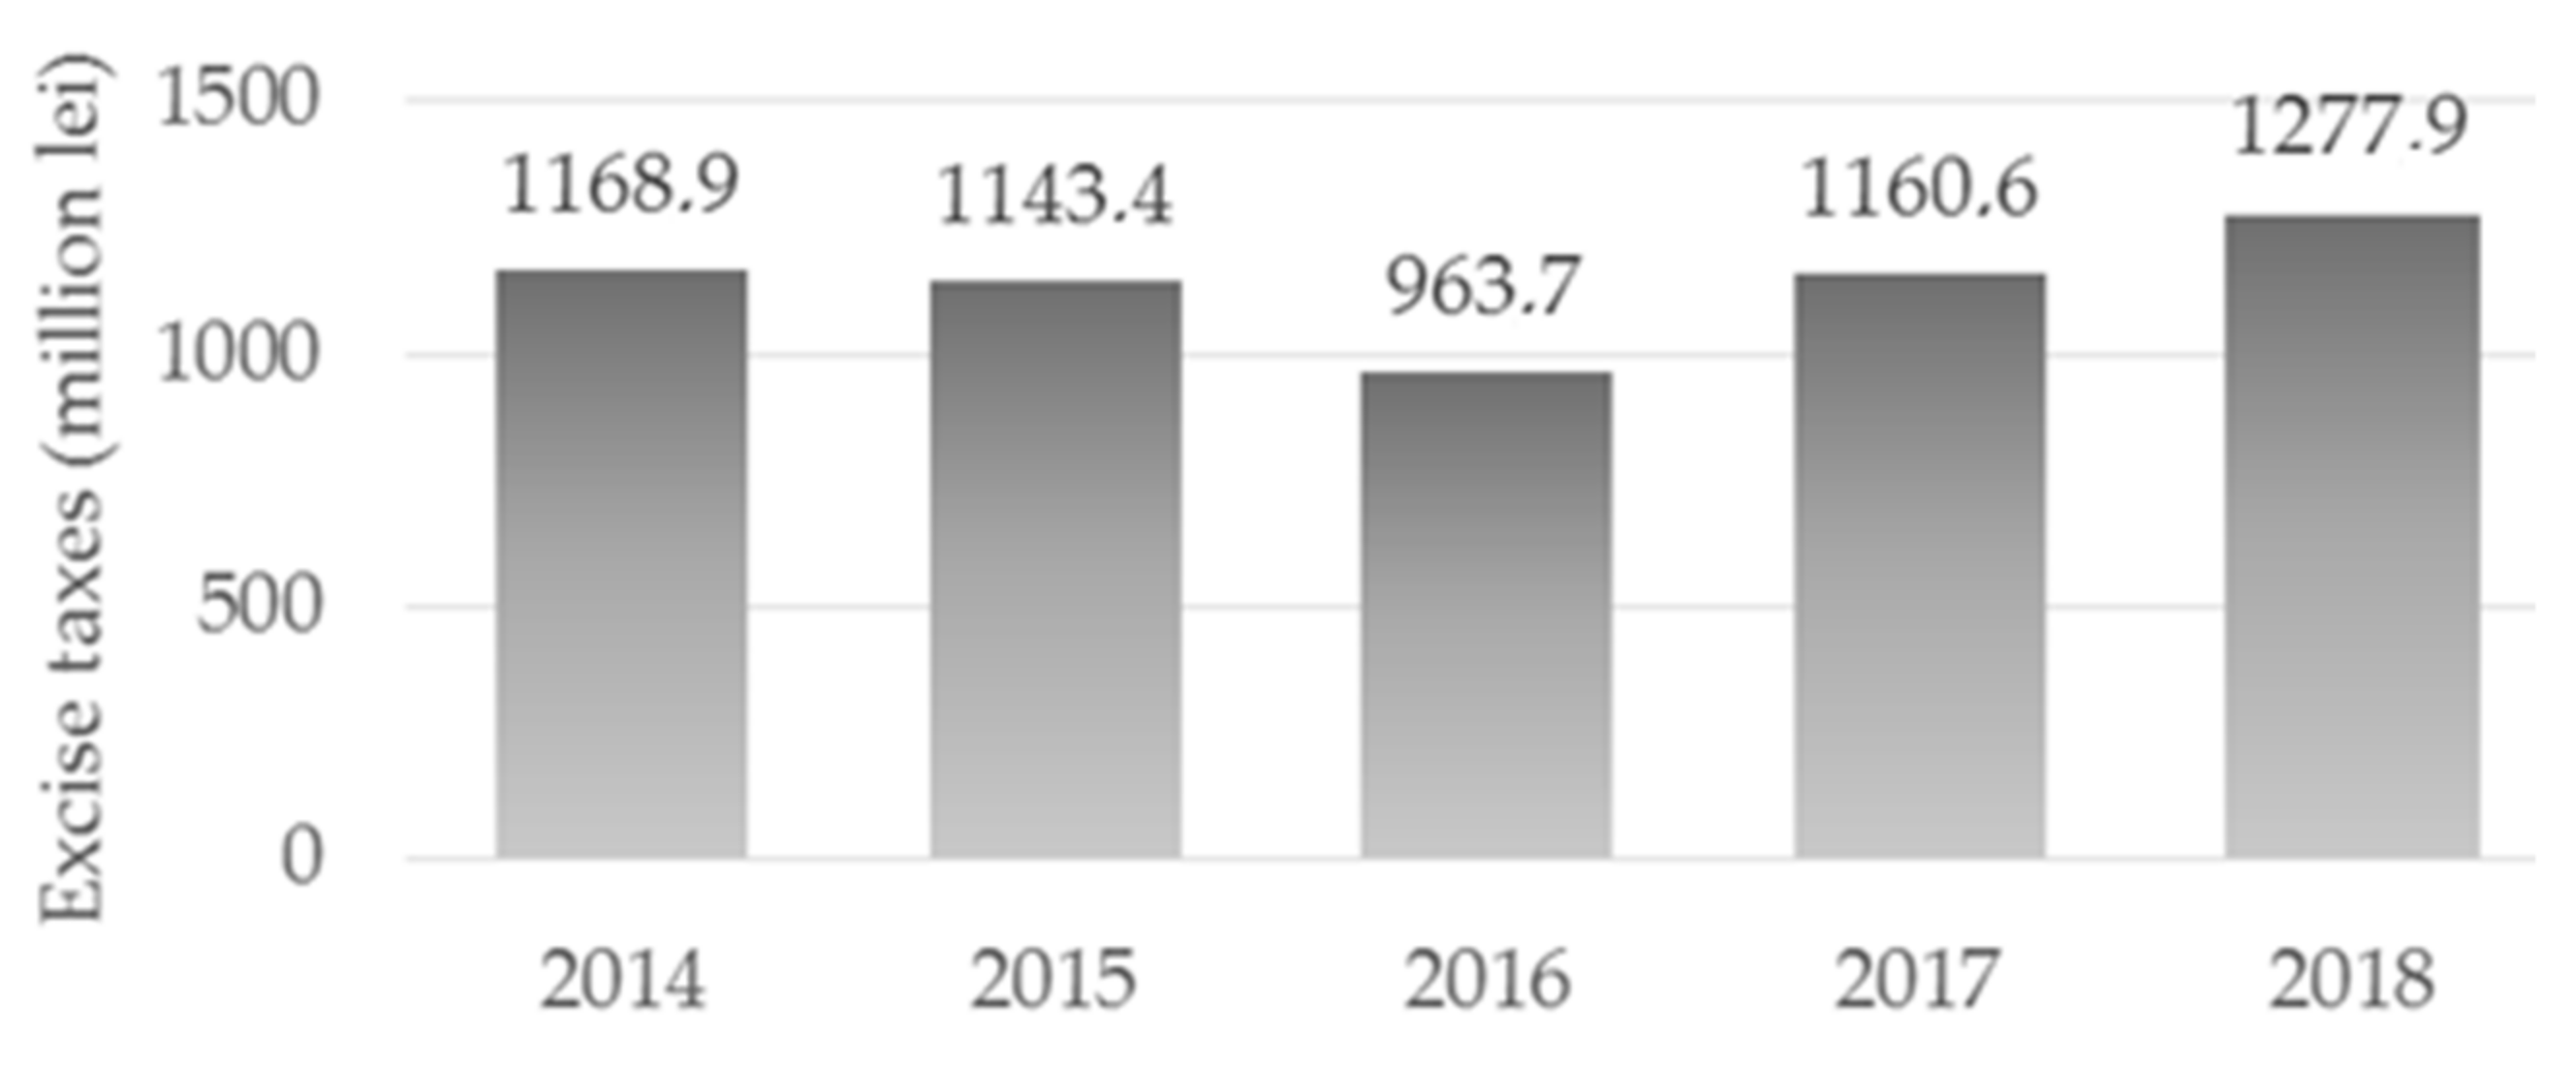
Moreover, the total amounts collected to the budget from excise taxes on alcohol, distillates and alcoholic beverages were below 5% of the total revenues from the budget during the analyzed period [49,50,51]. Even if revenues from excise duties on alcohol and alcoholic beverages are relatively small in size compared to total tax revenues, and total budget revenues in Romania, they mean secure and constant sources of revenue for the state. The role of revenues from excise taxes on alcoholic beverages depend not only on the national policy regarding the taxation of alcoholic beverages, but also on the tradition of the consumption and the total consumption of alcohol, the size of legal cross-border trade and illegal activities like smuggling and other forms of tax evasion [52].
We observe from Figure 4 that these receipts followed the same trend of the prices for alcoholic beverage, registering a slight reduction in 2015, followed by a more significant one in 2016. Starting with 2017, the amounts collected to the budget from excise taxes on alcohol increased, exceeding in 2018 the values recorded at the beginning of the period. This evolution can be explained by the evolution of prices during this period but they were also supported by a sustained consumption of alcoholic beverages.
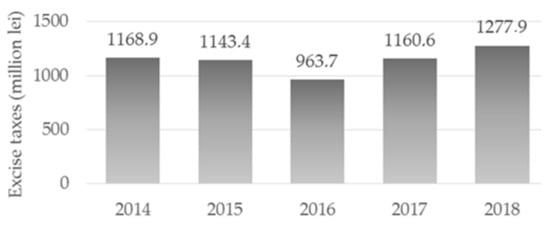
Figure 4.
Excise taxes collected to the budget from the sale of alcohol, ethyl, intermediate products, sparkling wines, fermented beverages and beer, Romania, 2014–2018. Source: processed by the authors after data on taxation provided by the European Commission [53].
The analysis of excise taxes revenues is important for our study because it gives us a clear picture of why these taxes are imposed: for health reasons or for increasing revenues. This happens in the context in which, studies from the literature [52] point out that the main reason for imposing excise taxes in the European Union countries is almost always fiscal, with the consequence of increasing public revenues.
The correlation coefficient of changes in price for alcoholic beverages and the budget revenues from excise taxes collected from the sale of alcohol and different types of alcoholic beverages is high, positive and statistically significant pointing out the existence of a significant link between the two variables (see Table 3). This shows us that the increase in the revenues to the state budget is related to the changes in the prices of alcoholic beverages.
Table 3.
The correlation between price of alcoholic beverages and the revenues from excise taxes of alcoholic beverages.
To test the extent to which one variable depends on the other we have applied linear regression. The results obtained sustain that budget revenues from excise taxes collected from the sale of different types of alcohol depend in a great extent to the level of prices established for these beverages. The level of R-squared adjusted points out that around 62% from the changes in budget revenues from alcohol excise taxes are determined by the changes in price of the alcoholic beverages (Table 4). Thus, the excise tax on alcohol can be considered as a fiscal objective of the policy makers because it increases the revenues to the budget.
Table 4.
The effects of price changes on budget revenues from excise taxes on alcohol.
The findings of this section mainly show that the application of the excise tax on alcohol is more of a fiscal objective, meant to increase the revenues to the budget. The role of excise taxes on alcoholic beverages as a public health objective aimed at reducing harmful alcohol consumption is reduced. For a more in-depth analysis in the following we will test the relationship between the price of alcohol and consumption of alcoholic beverages, but also the relationship between consumption and alcohol related deaths.
4.2. The Relation between Prices and Consumption of Alcoholic Beverages
The average level of alcohol consumption of a population is expressed in liters or grams of pure alcohol per capita per year, representing the amount of pure alcohol consumed in a year, in the form of different types of alcoholic beverages, relative to the number of the population aged 15 years and over (consumers and not consumers of alcohol). The amount of pure alcohol in each beverage varies. The notion unit of alcohol is a measure that allows the estimation of the pure alcohol content of a portion of a beverage. In Romania, by consensus, one unit of alcohol is equivalent to 12 g of pure alcohol [54]. The number of alcohol units in each serving of beverage depends on its size and concentration. Thus, one unit of alcohol represents 330 mL of beer with 5% alcohol, 125 mL of wine with 12% alcohol or 40 mL of “strength” (e.g., whiskey, brandy, vodka, gin), with 40% alcohol [39].
For our analysis we took into account both the average annual, per capita, consumption measured in liters and in liters of 100% alcohol. We also have reported the consumption to the total population and to the 15 years and older population.
Testing the correlation between prices of alcoholic beverages and the consumption of alcohol showed that these two variables are not statistically significant related (see Table 5).
Table 5.
The correlation between prices of alcoholic beverages (total) and the consumption.
The first relation tested results in a negative coefficient showing a moderate straight negative correlation between the price of total alcoholic beverages and the consumption in liters at the level of total population. This shows that an increase in the price of alcoholic beverages might determine a decrease in the total consumption of liters of alcohol of the population.
The second relation tested emphasized a moderate straight positive correlation between the price of total alcoholic beverages and the consumption in liters of pure alcohol at the level of total population.
Thus, an increase in the price of alcoholic beverages will be correlated with an increase in the total consumption of liters of pure alcohol by the population. These findings are supported by the reality from Romania. Chronic addicted consumers will continue to consume alcohol regardless of the evolution of price. Either they will prefer to spend money on alcohol by reducing their other categories of expenses, or they will even borrow money or will consume alcohol in the form of other types of beverages. In Romania, at the end of 2020 were registered cases of people who drank sanitary alcohol and died or had serious health problems. They resorted to these methods due to the fact that their financial situation does not allow them to purchase real alcoholic beverages. But their alcohol dependence determined them to resort to any method to ensure a daily consumption. So, often, they consume sanitary alcohol or counterfeit drinks even at the risk of serious complications or death. Unfortunately, this is the reality in less economically developed areas, such as villages or poor neighborhoods, from developing countries, where there are often people with low incomes but also without or with low levels of education.
The third relation tested generated similar results, pointing out a low straight positive correlation between the price of total alcoholic beverages and the consumption in liters of pure alcohol at the level of population with the age of 15 or more.
The fact that the coefficients obtained are not statistically significant actually shows us that for Romania, for the analyzed period 2014–2018 there is no significant link between the price of alcoholic beverages and their consumption among the population. This result may be influenced by the small size of the sample, but we are limited by the availability of the data. Thus, if the authorities tried through the price to reduce the harmful consumption of alcoholic beverages, this did not work during the five year analyzed period.
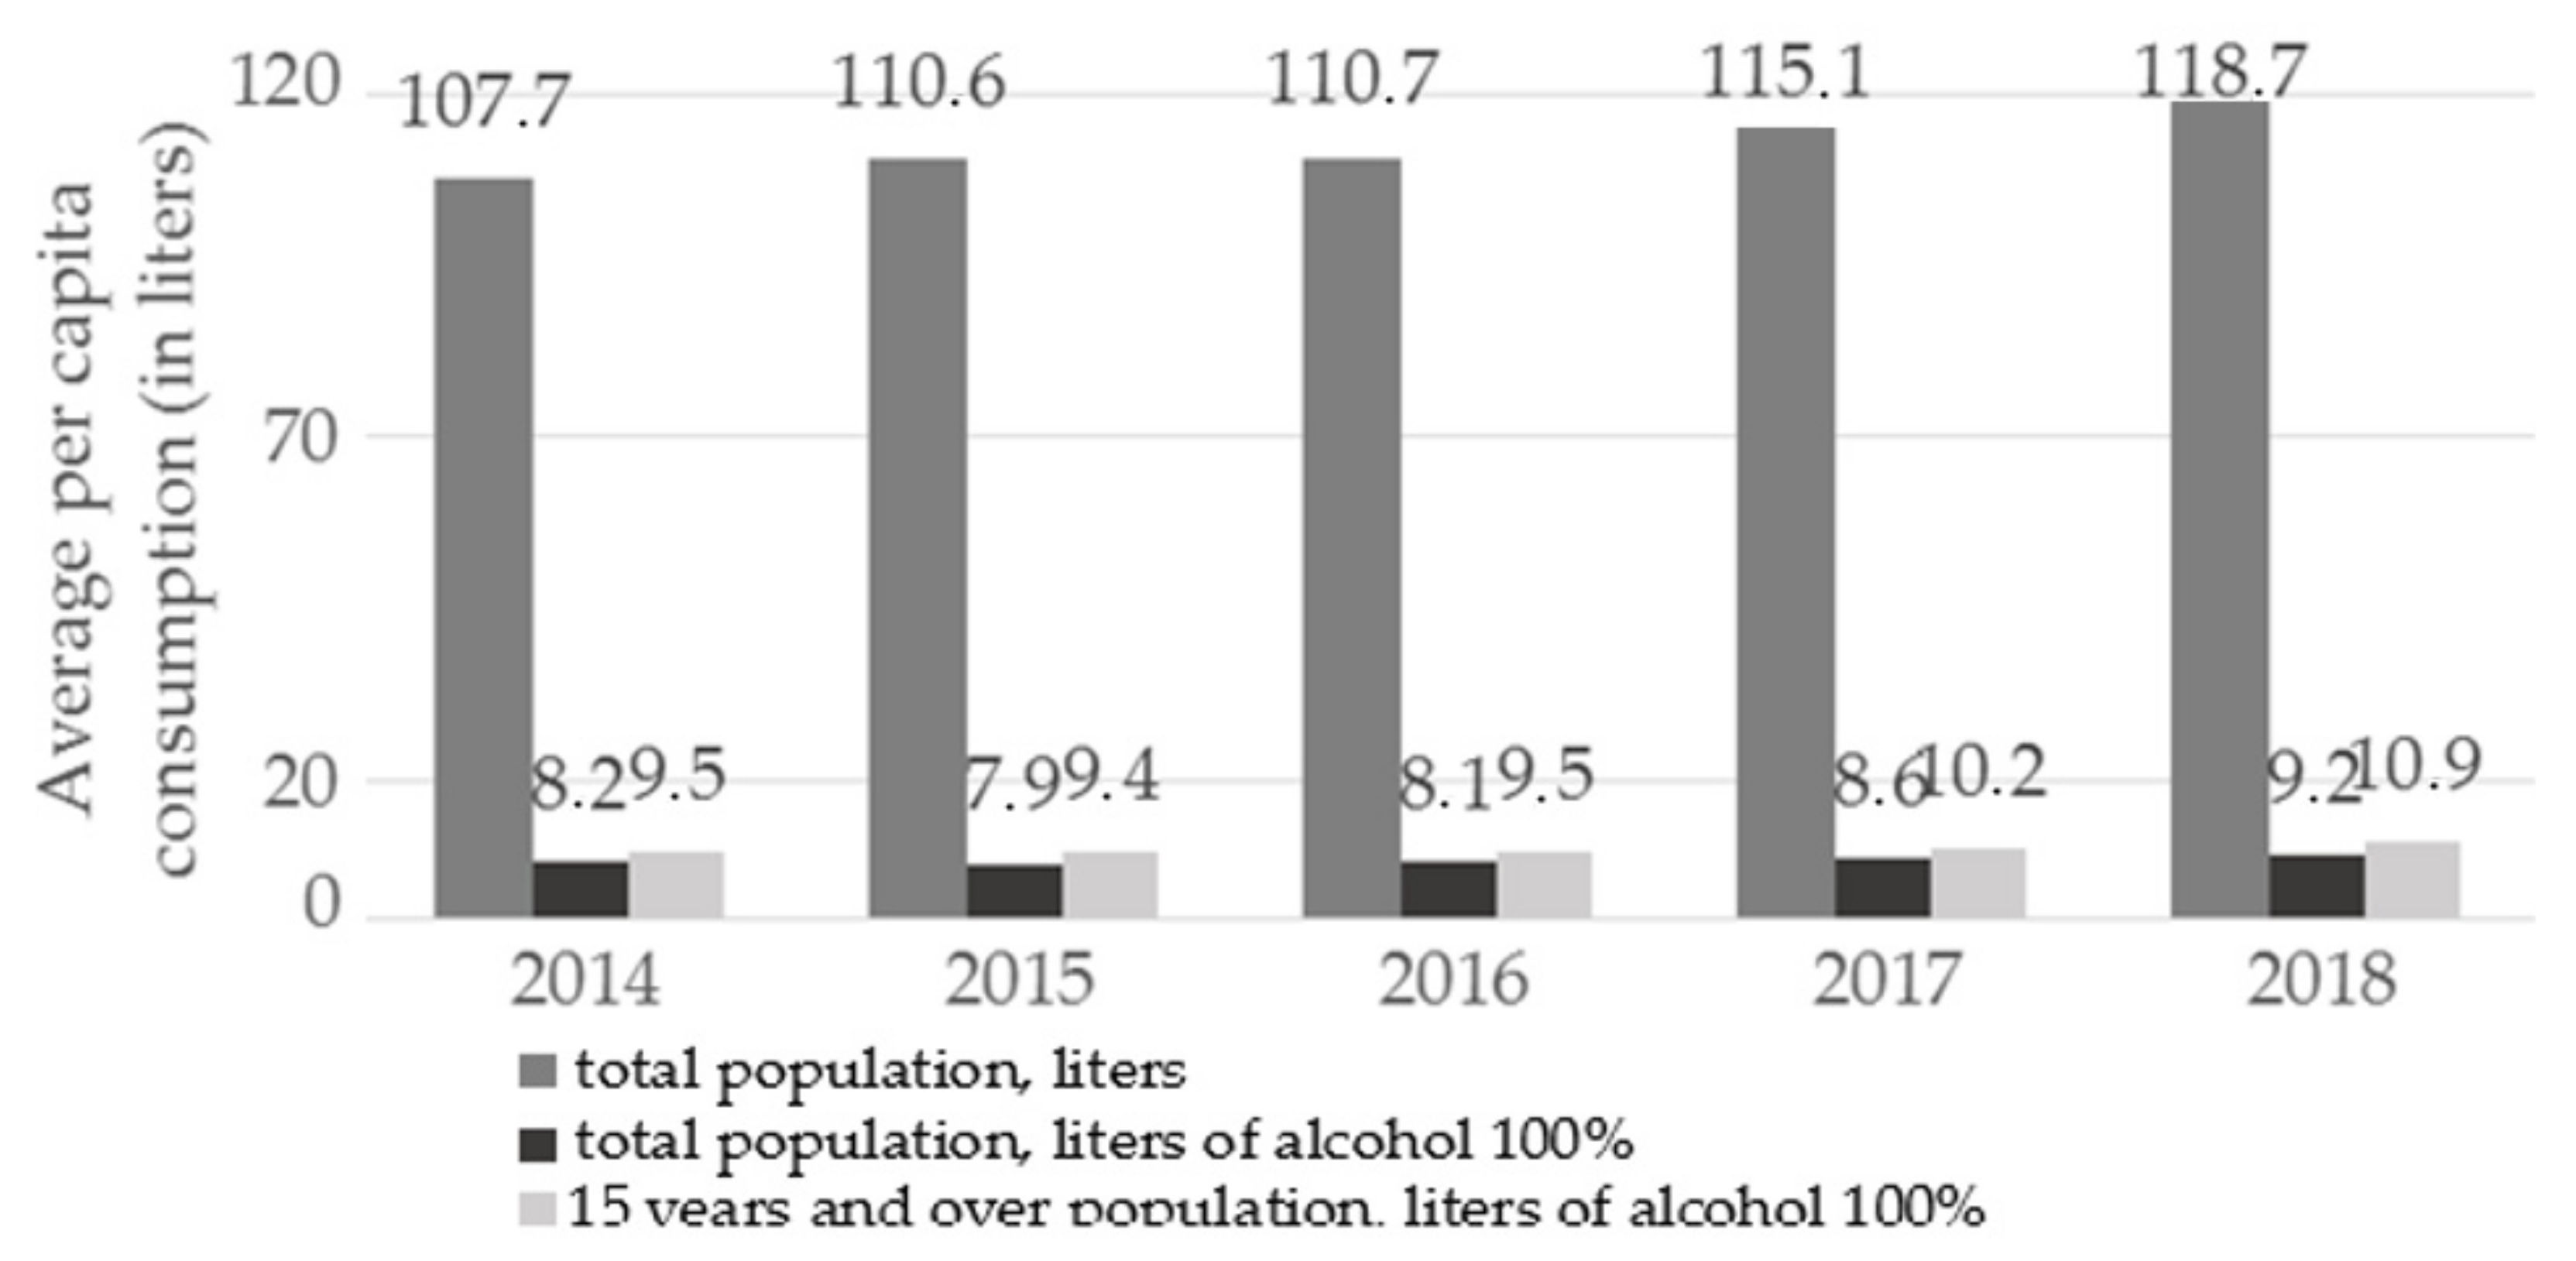
Figure 5 highlights the trend of evolution of alcohol consumption in the period 2014–2018, and actually shows an increasing trend of alcohol consumption. Indeed, 2015 observed a slight reduction of average per capita consumption, both in total population group and in the 15 years and older group, in liters of pure alcohol, but also this year the total number of liters of alcoholic beverages has increased.
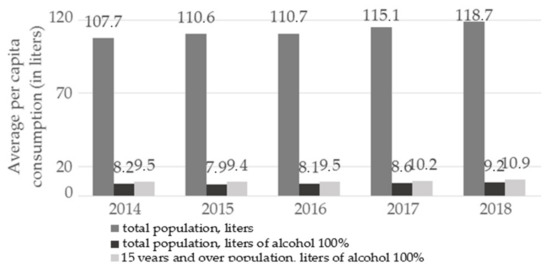
Figure 5.
The average consumption of alcohol, Romania, 2014–2018. Source: processed by the authors after data from Annual Reports on beverage consumption [36,37,38].
When we perform the analysis broken down on the main types of alcoholic beverages the results are in a similar extent as when we analyzed the total (see Table 6).
Table 6.
The correlation between prices of alcoholic beverages and the consumption, on types of alcoholic beverages.
The correlation coefficients from Table 6 point out a powerful straight positive correlation only for the case of wine. This relationship is also the only one that resulted to be statistically significant and it shows a change in the same direction of the price of wine and wine consumption. Thus, an increase in the price of wine is correlated with an increase in the total consumption of liters of wine, a relationship that can be explained by the fact that dependent, chronic consumers will continue to consume alcohol regardless of price increase. Moreover, there are areas in Romania where a lot of wine is produced by individual producers for their own consumption in the home, which is not for commercial purposes. Thus, even if the price of wine increases, it is possible to increase the total number of liters of wine consumed due to the consumption of wine from own production.
For the other categories of alcoholic beverages, such as: beer, plum brandy, brandy and other alcoholic bereaves, the relationship turned out to be negative, showing that an increase in the price would lead to a decrease in the consumption of these alcoholic beverages. But these relationships are not statistically significant. Although we would expect a change in price to influence consumption, in our case, for the period 2014–2018 in Romania it does not. Consumption had an upward trend, which continued regardless of price changes; therefore, our second hypothesis is not sustained.
Regarding the trend and pattern of alcohol consumption in Romania, which does not follow the noticeable decrease in the Central and Western EU, a wide effort is needed to raise awareness about the health risks of alcohol, awareness addressed to both the general population and vulnerable groups, such as young people. Special attention should be paid to alcohol consumption in association with driving [55].
Our results from this section show that in Romania, for the analyzed period 2014–2018 there is no significant link between the price of alcoholic beverages and their consumption among the population.
4.3. The Relation between Alcohol Related Deaths and Consumption of Alcoholic Beverages
In Romania, a risk consumption (excessive, abusive, dangerous, harmful) for health is considered to be the intake of alcohol exceeding: 2 doses per day or 14 doses per week in the case of men, one dose per day or 7 doses per week in the case of women, and more than one dose per day for people over 65 years. Exceeding these limits is associated with growing health risks [39].
Analyzing the relationship between alcohol consumption and its harmful effects on health, our results support the findings of other studies in the field [2] and point out that alcohol consumption is a serious threat to public health in Romania, being in the top three causes of death.
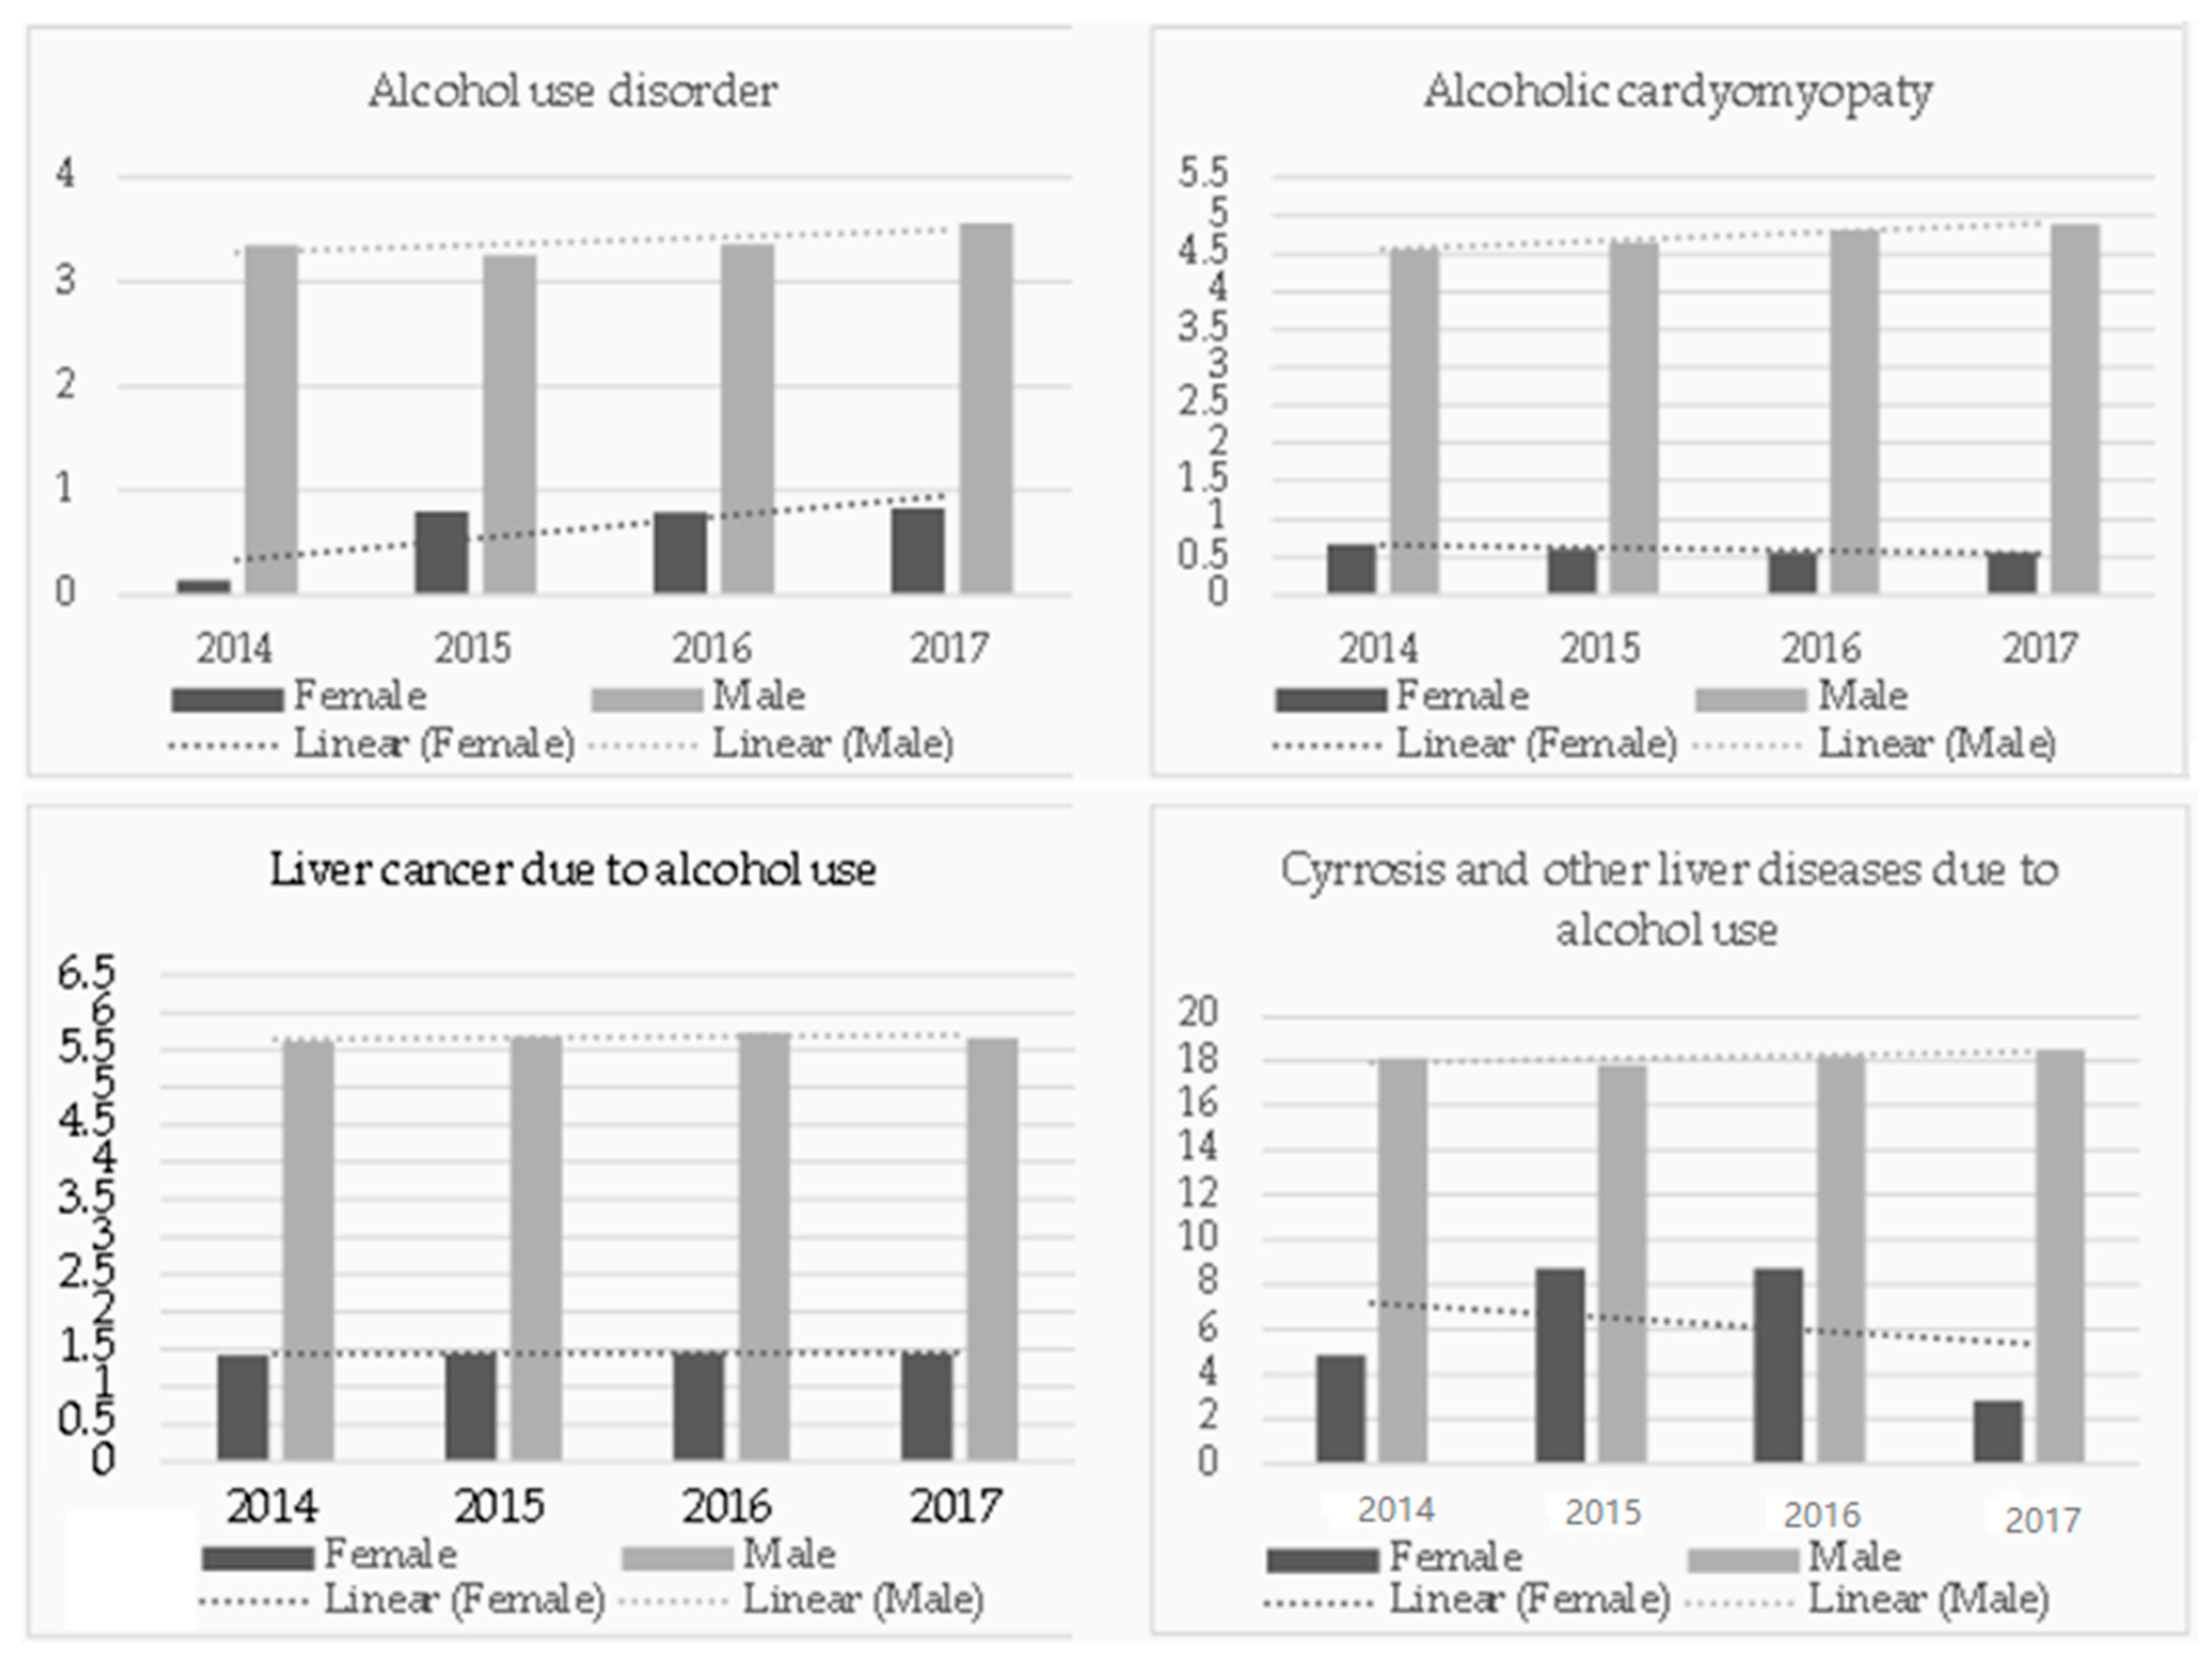
The deaths determined by the consumption of alcohol in Romania have varied differently depending on gender (see trend lines from Figure 6).

Figure 6.
Cause of death determined by the consumption of alcohol in Romania, 2014–2017 * (rate per 100,000 inhabitants). Source: processed by the authors after data from Institute for Health Metrics and Evaluation [41].
Thus, the deaths caused by alcohol use disorder increased in the period 2014–2017 both among men and women, only that the ascending trend was more pronounced in the case of women.
In the same time, both women and men who died of liver cancer due to alcohol use had relatively constant rates per 100,000 inhabitants for all the four years analyzed. In regards to alcoholic cardiomyopathy, there have been an increase in deaths among men per 100,000 inhabitants, but among women there have been reductions in deaths caused by this disease due to alcohol consumption.
Deaths caused by cirrhosis or other liver diseases determined by alcohol consumption among men increased very little in 2017 compared to 2014, while for women they increased in 2015–2016, but decreased significantly in 2017.
Also, the World Health Organization [40] calculated the years of life lost (YLL) that can be caused by alcohol consumption. This indicator takes values from 1 to 5, where 1 is the lowest percentage and 5 is the highest percentage. The YLL for Romania in 2016 had the value 4, suggesting that alcohol consumption is a public health problem in Romania and involves losses in productivity and economic costs. The policy makers should focus on improving this situation and reducing the years of life lost due to alcohol consumption, especially considering that deaths caused by various diseases caused by alcohol consumption fall into the category of those that can be prevented.
The World Health Organization have also calculated a set of indicators measuring the alcohol-attributable fraction (AAF) deaths, which denote the proportion of deaths which are caused by alcohol (i.e., that proportion which would disappear if alcohol consumption was removed). In Figure 7 we present the alcohol-attributable fractions (people 15 years or older) broken down into different causes: all cause death, road traffic crash deaths, liver cirrhosis deaths and cancer deaths. We also presented these on gender groups: male or female.
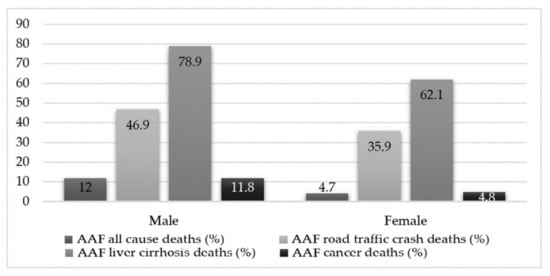
Figure 7.
Alcohol-attributable fractions (population with 15 years or older) by cause of death and gender, Romania, 2016. Source: processed by the authors after data from World Health Organization [40].
Men recorded higher proportions of alcohol attributable fractions for all four causes of death considered in the analysis. Thus, the highest share was in deaths caused by liver cirrhosis, 78% of deaths caused by liver cirrhosis among men and 62% of deaths among women were caused by alcohol consumption. In descending order of weights are car crashes, so almost 47% of deaths among men and almost 36% among women, due to car accidents are caused by alcohol consumption. Of the total deaths from cancer, almost 12% of those in men and 5% of those in women were due to alcohol consumption.
Also, based on the data provided by Eurostat [56] we analyzed the situation of deaths caused by mental and behavioral disorder due to the use of alcohol, in Romania, in 2016 (this is the most recent year with available data). Therefore, Eurostat database shows that in 2016 death due to alcoholic abuse that determined mental and behavioral disorder was 1.39 per 100,000 inhabitants. Focusing on the situation by gender we observe significant differences, a rate of 2.57 for males (per 100,000 inhabitants) and a rate of only 0.38 females (per 100,000 inhabitants) were registered in Romania in 2016.
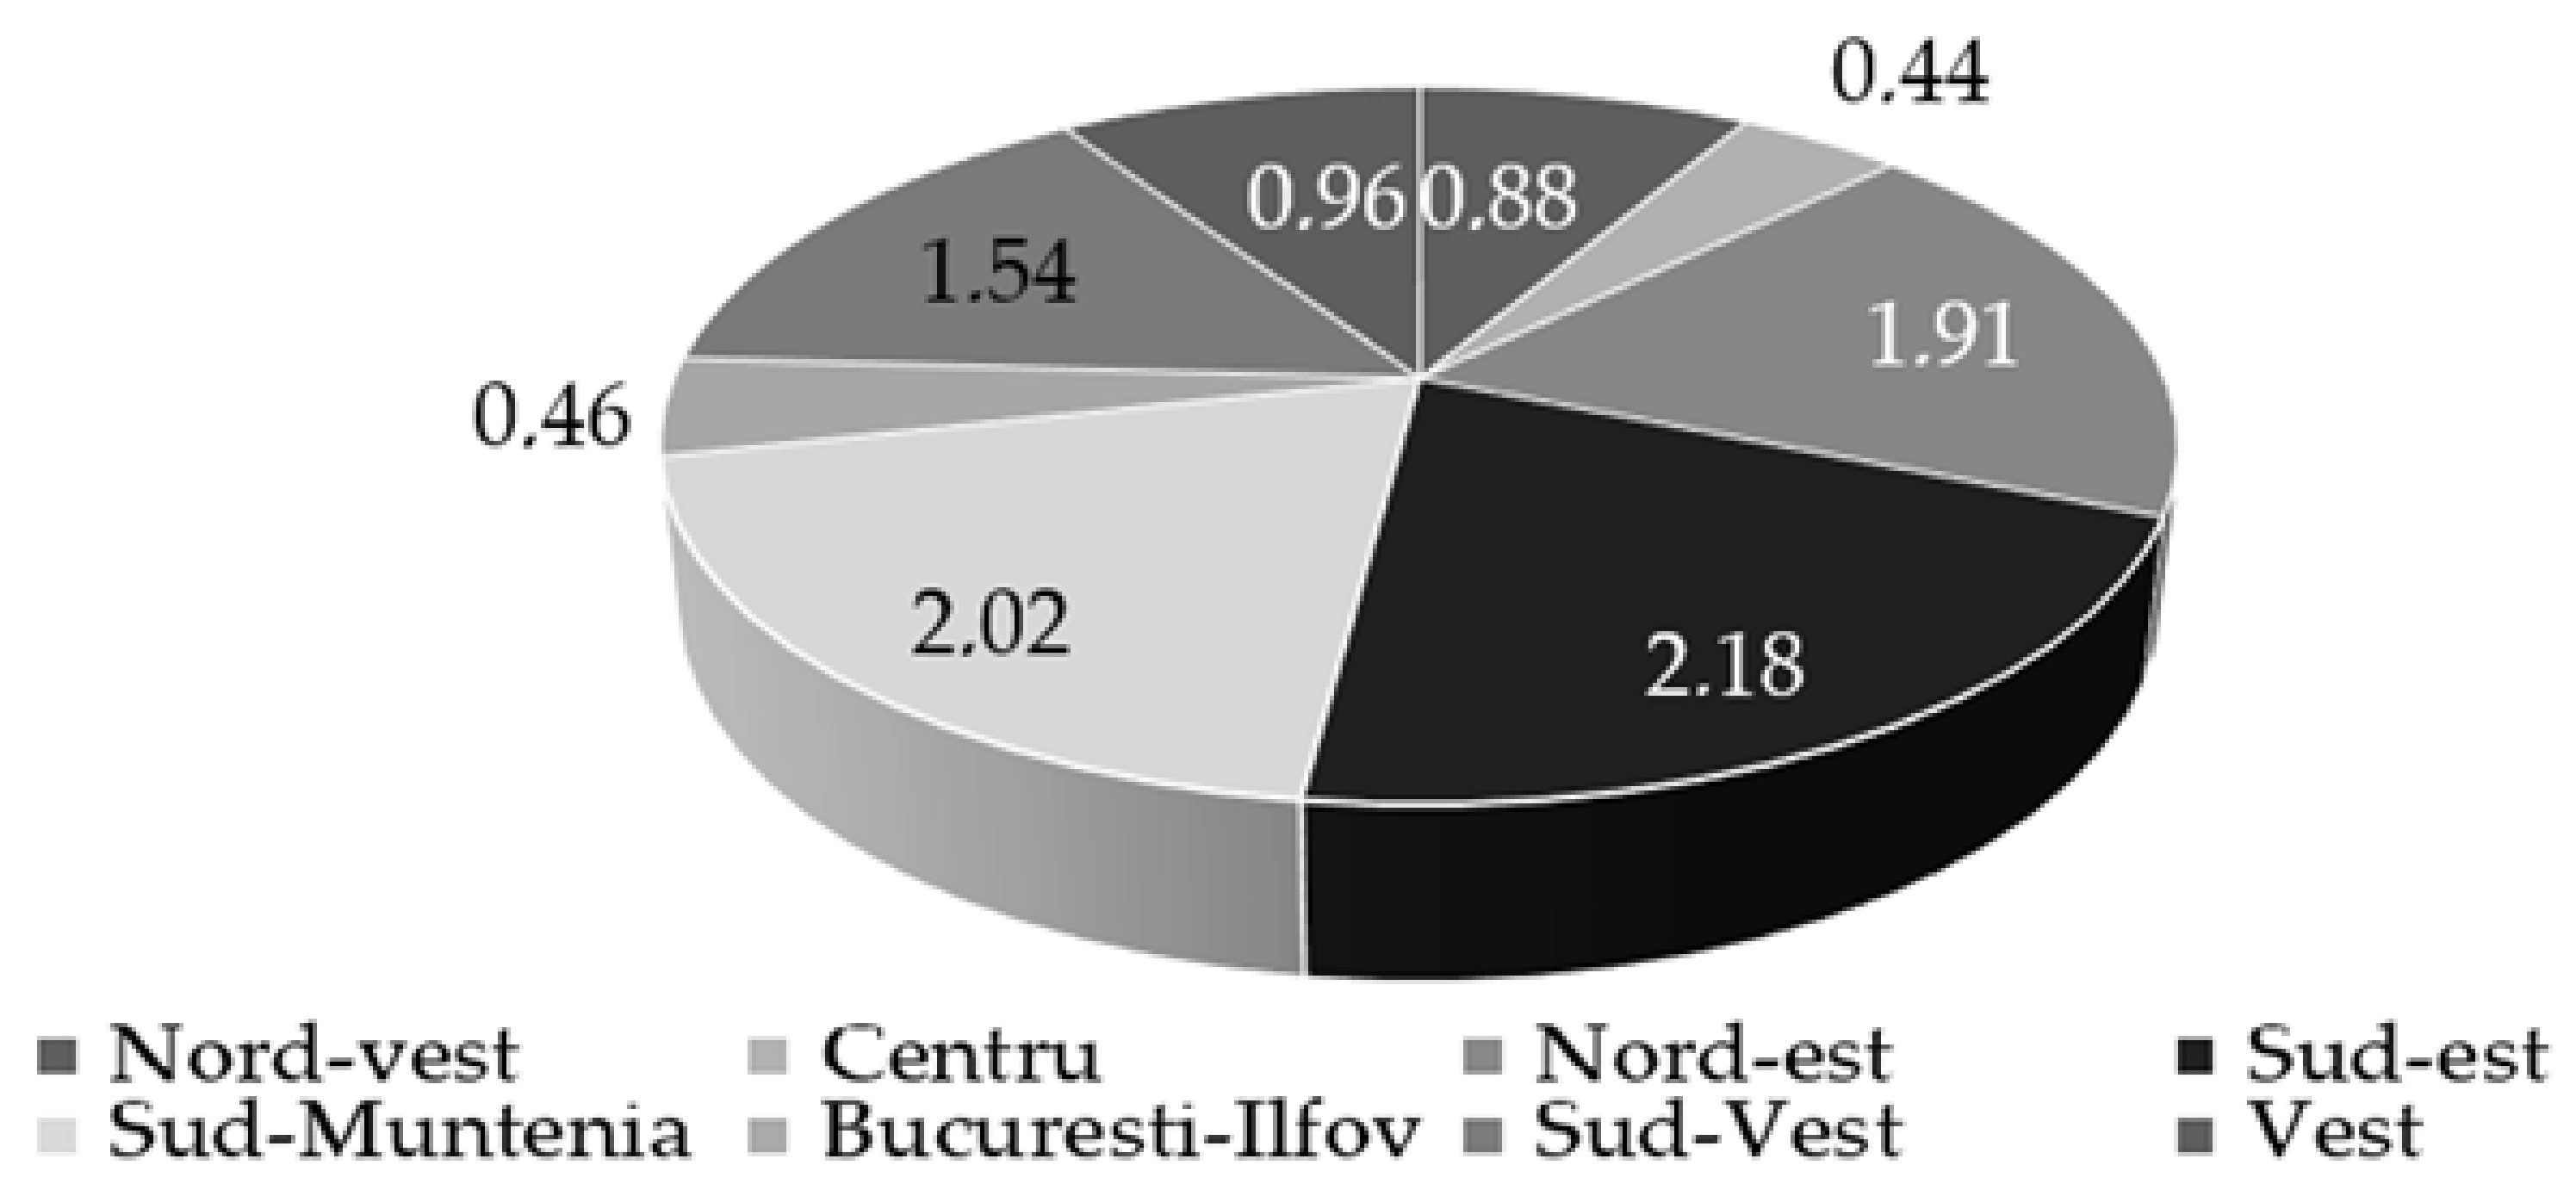
Extending the analysis by regional divisions from Romania (see Figure 8) we notice that the regions most affected by alcohol-related deaths are the Sud-Est region followed by Sud-Muntenia with rates above 2 per 100,000 inhabitants. At the opposite end, with the lowest rates of death caused by alcohol, we find the regions: Centru (a rate of 0.44 deaths per 100,000 inhabitants) and București-Ilfov (with a rate of deaths of 0.46 per 100,000 inhabitants).

Figure 8.
Deaths caused by mental and behavioral disorder due to the use of alcohol, Romania, 2016, by regional divisions (rate by 100,000 inhabitants). Source: processed by the authors after data from Eurostat database [56].
All the above presented arguments support the third hypothesis of our study, namely that increased alcohol consumption has strong negative effects on the health of the Romanian population. But to support these claims and empirically prove them, we tested the correlation between average per capita alcohol consumption and death determined by an alcohol use disorder (Table 7 and Table 8).
Table 7.
The correlation between alcohol consumption and alcohol related deaths.
Table 8.
The effects of alcohol consumption on the alcohol related deaths.
The coefficient of correlation between the consumption of alcohol and alcohol related deaths shows a very strong and positive relation, thus highlighting that increasing alcohol consumption is strongly associated with increase in alcohol related deaths.
The results obtained from the linear regression analysis show us that alcohol related deaths from Romania depend positively and statistically significantly on average per capita consumption of alcoholic beverages. An increase in the average alcohol consumption of the Romanian population in the period 2014–2018 resulted in an increase in deaths caused by alcohol use disorder.
The level of R-squared adjusted highlights that are around 67% from the alcohol related deaths depend on the average alcohol consumption. Therefore, hypothesis 3 is confirmed.
Studies show that while it is clear that individuals and their families are affected by harmful alcohol consumption, communities as a whole are actually affected [57]. The auxiliary costs of harmful alcohol consumption that affect society as a whole come from traffic accidents, illnesses, injuries and violence caused by it [58]. If these ancillary costs could be estimated, then the magnitude of the problem on the health and functionality of society could be quantified [55].
4.4. Alcohol Consumption and Sustainability of Public Health
The role of alcohol consumption in society has often been neglected compared to smoking and obesity. However, due to its major effects on health and society, decision-makers at the local, national and global levels should work together to ensure that consumption is reduced.
The excessive alcohol consumption is a problem of public health because the health problems related to alcohol consumption have increased significantly and alcohol use determines a wide range of diseases, mental disorders and road traffic accidents, placing a significant burden on the national health systems. Thus, because alcohol consumption contributes significantly to losing a healthy life, alcohol needs increased attention from the public health community.
The 2030 Agenda for Sustainable Development [59] includes reducing alcohol consumption among its major objectives to ensure sustainable development. Ensuring healthy lives and promoting well-being is the third goal from the agenda. Public health interventions are needed mostly for prevention of alcohol related problems, because when it comes to treatment, the costs and implications are already higher both on the part of those who consume and also for those who treat. Thus, the consumption of healthy foods and beverages should be promoted to a greater extent to the detriment of those that affect health.
This suggestion is also sustained by the study of Nissensohn et al. (2017) [60] which have pointed out the need to formulate appropriate health and nutrition policies in order to increase the consumption of healthy beverages such as water and energy intakes in the population. Thus, at the European level, a collective effort to contribute to standardizing the assessment of beverage intakes, and to minimize the use of unhealthy beverages, including alcoholic beverages is necessary.
For ensuring the sustainability of public health it is necessary to build effective alcohol policies. These policies should focus, among others, on taxation, access to alcohol, and the availability of treatment of alcohol use disorders.
However, it looks like, according to our findings, that the increase of taxes on alcoholic beverages is not always efficient in reducing alcohol consumption, because it also depends on the aptitude of these increases. In fact, in this sense, the situation is consistent with the results of other research related to the effects of fiscal incentives/deterrents on the consumer (not only in the field of alcoholic beverages) [61,62,63,64,65,66], from which it results that the fiscal incentive (positive or negative) does not have a very appreciable effect. Thus, besides prices, other controls on the availability of alcoholic beverages should be applied in order to reduce the consumption of alcohol. The intervention from health and social care practitioners is also needed.
Moreover, campaigns aimed at responsible alcohol consumption should be better targeted and implemented. Because, unfortunately, national policies addressing the availability of alcoholic beverages, marketing, and also their prices and taxation, as well as the penalties for those who drive after consuming alcohol, are being implemented at a very slow pace.
5. Conclusions
Our research reveals that in the literature there are studies that have shown the effects of excise taxes on alcohol on reducing harmful consumption [15,16,17,18], but other studies have not obtained such a relationship. Thus, our results are in line with those in the literature that did not obtain a significant relationship between these variables and is significant for decision makers because they emphasize the problem of public health affected by alcohol consumption. Also, our results point out the fact that the decision makers should take supplementary measures, should adopt other pricing options, and should develop information campaigns on harmful alcohol consumption in order to reduce the consumption and to decrease alcohol-related deaths.
5.1. Signals for Macro Decision Makers
Our findings highlight that the efforts made so far in Romania are not sufficient to reduce alcohol consumption effectively, therefore, the decision makers should reorient to implementing other pricing options.
Moreover, the price level of alcoholic beverages did not result in a significant effect on the consumption of beverages (except for wine). The consumption continued to increase, although at some point correlated with the increase in price, there was a slowdown in this increase.
Thus, if by modifying the excise taxes the Romanian authorities would have wanted to reduce the harmful alcohol consumption, this did not happen. These results allow us to state that the application of excise taxes to alcoholic beverages in Romania is in fact a fiscal objective and not a measure to influence harmful consumption.
But regarding the deaths caused by excessive alcohol consumption in Romania, they are still significant. Alcohol consumption is a factor that significantly influences alcohol-related illnesses and deaths.
As a synthetic conclusion, for the period 2014–2018, the excise tax on alcohol was more a fiscal objective that led to an increase in budget revenues than a public health objective. Thus, our study highlights the need of the decision makers to further develop sustained and effective policies to reduce alcohol consumption and its harmful effects on health, either by fiscal means or by other means.
5.2. Referring to Some Practical Implications and Additional Research Objectives
Due to the fact that diseases and deaths caused by alcohol fall into the category of preventable and they cause increased health costs that could be eliminated, we point to the need of the decision makers to reduce excessive alcohol consumption in Romania.
Following our studies on some macro-indicators related to this topic, it was highlighted that the changes in excise taxes on alcohol have not significantly influenced the level of prices for alcoholic beverages due to the fact that the share of excise duties in prices is low, and there are other elements that have a direct and stronger effect such as the general VAT rate. This points the need for higher and inflation adjusted alcohol tax, which measurably would increase the price of alcohol and thus reduce alcohol consumption. However, as we have seen the situation from 2015, an excessive increase in excise duties leads to a reduction in budget revenues which is not desirable by the decision makers from Romania.
5.3. About Some Limitations of the Research
Limitation of our study comes from the low data availability that determined a limited analysis period of only five years and a small sample size. In future studies we intend to extend the analysis period and the sample, including other countries to make a comparison.
Author Contributions
Conceptualization, I.B. and V.D.R.; methodology, I.B. and V.D.R.; software, I.B. and V.D.R.; validation, I.B. and V.D.R.; formal analysis, I.B. and V.D.R.; investigation, I.B. and V.D.R.; resources, I.B. and V.D.R.; data curation, I.B. and V.D.R.; writing—original draft preparation, I.B. and V.D.R.; writing—review and editing, I.B. and V.D.R.; visualization, I.B. and V.D.R.; supervision, I.B. and V.D.R.; project administration, I.B. and V.D.R.; funding acquisition, I.B. and V.D.R. Both authors have read and agreed to the published version of the manuscript.
Funding
This research received no external funding.
Informed Consent Statement
Not applicable.
Data Availability Statement
Not applicable.
Conflicts of Interest
The authors declare no conflict of interest.
Appendix A
Table A1.
Types of alcoholic beverages from Romania and their definition.
Table A1.
Types of alcoholic beverages from Romania and their definition.
| Alcoholic Beverage | Definition | |
|---|---|---|
| 1. | Beer | Means any product falling within CN code 2203 or any product containing a mixture of beer and non-alcoholic beverages falling within CN code 2206 and having, in either case, an alcoholic strength exceeding 0.5% in volume. |
| 1.1. | Beer produced by independent producers | Refers to the producers whose production in the previous calendar year did not exceed 200,000 hl/year, and for the current year the authorized warehouse keeper declares on his own responsibility that he will produce a quantity of less than 200,000 hl/year. |
| 2. | Wines from which: | |
| 2.1. | Still wines | 1. Having an alcoholic strength by volume exceeding 1.2%, but not exceeding 15% by volume, and in which the alcohol contained in the finished product results entirely from fermentation; or 2. Have an alcoholic strength by volume of more than 15% volume but not more than 18% volume, have been obtained without any enrichment and in which the alcohol contained in the finished product results entirely from fermentation. |
| 2.2. | Sparkling wines | 1. Are presented in closed bottles with a mushroom stopper fixed by means of connections or which are under pressure equal to or greater than 3 bar due to carbon dioxide in solution; 2. Have an alcoholic strength exceeding 1.2% volume, but not exceeding 15% volume, and in which the alcohol contained in the finished product results wholly from fermentation. |
| 3. | Fermented beverages other than beer and wine | |
| 3.1. | Still fermented beverages | 1. Have an alcoholic strength exceeding 1.2% volume, but not exceeding 10% volume; or 2. Have an alcoholic strength exceeding 10% volume, but not exceeding 15% volume, and in which the alcohol contained in the finished product results wholly from fermentation. |
| 3.2. | Sparkling fermented beverages | 1. Have an alcoholic strength exceeding 1.2% by volume but not exceeding 13% by volume; or Methodological norms 2. Have an alcoholic strength exceeding 13% volume, but not exceeding 15% volume, and in which the alcohol contained in the finished product results wholly from fermentation. |
| 4. | Intermediate products | 1. Intermediate products represent all products that have an alcoholic concentration exceeding 1.2% by volume, but not exceeding 22% by volume, and which fall within CN codes 2204, 2205 and 2206, but which do not fall under art. 349-351. 2. Intermediate products shall also be considered as: (a) any still fermented beverage provided in art. 351 par. (1) lit. a), which has an alcoholic strength exceeding 5.5% by volume and which does not result entirely from fermentation; (b) any sparkling fermented beverage provided in art. 351 par. (1) lit. b), which has an alcoholic strength exceeding 8.5% by volume and which does not result entirely from fermentation. |
| 5. | Ethyl alcohol | (a) All products with an alcoholic strength exceeding 1.2% by volume and falling within CN codes 2207 and 2208, even when those products are part of a product falling within another heading of the combined nomenclature; (b) Products with an alcoholic strength exceeding 22% volume and falling within CN codes 2204, 2205 and 2206; (c) Brandy and fruit spirits; (d) Potable spirits containing products, in solution or not. |
| 5.1. | Ethyl alcohol produced by small distilleries | Whose production in the previous calendar year did not exceed 10 hl of pure alcohol and for the current year the authorized warehouse keeper declares on his own responsibility that he will have a production of less than 10 hl of pure alcohol |
Source: Selection made by authors from The Law no. 227/2015 on the Fiscal Code, updated by Government Emergency Ordinance no. 1/2020.
Table A2.
The value of excise taxes on different types of alcoholic beverages, for Romania 2014–2020 (lei*/hl of product).
Table A2.
The value of excise taxes on different types of alcoholic beverages, for Romania 2014–2020 (lei*/hl of product).
| Beverage | 2014 | 2015 | 2016 | 2017 | 2018 | 2019 | 2020 | |
|---|---|---|---|---|---|---|---|---|
| 1. | Beer | 0.82 | 3.9 | 3.3 | 3.3 | 3.3 | 3.40 | 3.53 |
| 1.1. | Beer produced by independent producers (Hl/1 grade Plato) | 0.47 | 2.24 | 1.82 | 1.82 | 1.82 | 1.88 | 1.95 |
| 2. | Wines from which: | |||||||
| 2.1. | Still wines | 0 | 0 | 0 | 0 | 0 | 0 | 0 |
| 2.2. | Sparkling wines | 34.05 | 161.33 | 47.38 | 47.38 | 47.38 | 48.87 | 50.73 |
| 3. | Fermented beverages other than beer and wine: | |||||||
| 3.1. | Still | 100 | 47.38 | 396.84 | 396.84 | 396.84 | 409.34 | 424.90 |
| 3.2. | Sparkling | 45 | 213.21 | 47.38 | 47.38 | 47.38 | 48.87 | 50.73 |
| 4. | Intermediate products | 165 | 781.77 | 396.84 | 396.84 | 396.84 | 409.34 | 424.90 |
| 5. | Ethyl alcohol | 750 | 4738.01 | 3306.98 | 3306.98 | 3306.98 | 3411.15 | 3540.78 |
| 6. | Ethyl alcohol produced by small distilleries | 475 | 2250.56 | 1653.49 | 1653.49 | 1653.49 | 1075.57 | 1779.39 |
* The national currency of Romania. Source: processed by the authors after the Fiscal Code of Romania with the application norms [42,43,44,45,46] and the Ministry of Public Finance [47].
References
- World Health Organization. Alcohol in the European Union. Consumption, Harm and Policy Approaches. 2012. Available online: https://www.euro.who.int/__data/assets/pdf_file/0003/160680/e96457.pdf?ua=1 (accessed on 16 March 2021).
- OECD. State of Health in the EU. România: Profilul de Țară din 2019 în Ceea ce Privește Sănătatea; OECD Publishing: Paris, France; European Observatory on Health Systems and Policies: Brussels, Belgium, 2019. [Google Scholar]
- World Health Organization. Global Status Report on Alcohol and Health. 2018. Available online: https://www.who.int/substance_abuse/publications/global_alcohol_report/en (accessed on 19 March 2021).
- World Health Organization. Global Health Observatory. Global Information System on Alcohol and Health. 2019. Available online: https://www.who.int/gho/alcohol/en/ (accessed on 20 March 2021).
- Dávalos, M.E.; Fang, H.; French, M.T. Easing the pain of an economic downturn: Macroeconomic conditions and excessive alcohol consumption. Health Econ. 2012, 21, 1318–1335. [Google Scholar] [CrossRef] [PubMed]
- Dee, T.S. Alcohol abuse and economic conditions: Evidence from repeated cross-sections of individual-level data. Health Econ. 2001, 10, 257–270. [Google Scholar] [CrossRef] [PubMed]
- Freeman, D.G. A note on economic conditions and alcohol problems. Health Econ. 1999, 18, 661–670. [Google Scholar] [CrossRef]
- Johansson, E.; Böckerman, P.; Prättälä, R.; Uutela, A. Alcohol-related mortality, drinking behavior, and business cycles. Eur. J. Health Econ. 2006, 7, 212–217. [Google Scholar] [CrossRef] [PubMed]
- World Health Organization. Management of Substance Abuse. Country Profiles. 2019. Available online: https://www.who.int/substance_abuse/publications/global_alcohol_report/profiles/rou.pdf?ua=1 (accessed on 22 February 2021).
- European Centre for Monitoring Alcohol Marketing. Regulations on Alcohol Marketing—Romania. 2019. Available online: http://eucam.info/regulations-on-alcohol-marketing/romania (accessed on 23 March 2021).
- Rădulescu, S.M.; Dâmboeanu, C. Alcohol consumption and abuse as a social and medical problem. Rom. J. Sociol. 2006, XVII, 433–461. [Google Scholar]
- Probst, C.; Kilian, C.; Sanchez, S.; Lange, S.; Rehm, J. The role of alcohol use and drinking patterns in socioeconomic inequalities in mortality: A systematic review. Lancet Public Health 2020, 5, e324–e332. [Google Scholar] [CrossRef]
- Chisholm, D.; Moro, D.; Bertram, M.; Pretorius, C.; Gmel, G.; Shield, K.; Rehm, J. Are the ‘Best Buys’ for Alcohol Control Still Valid? An Update on the Comparative Cost-Effectiveness of Alcohol Control Strategies at the Global Level. J. Stud. Alcohol Drugs 2018, 79, 514–522. [Google Scholar] [CrossRef]
- World Health Organization. Global Strategy to Reduce the Harmful Use of Alcohol. 2010. Available online: https://www.who.int/substance_abuse/msbalcstragegy.pdf (accessed on 29 March 2021).
- Wagenaar, A.C.; Tobler, A.L.; Komro, K.A. Effects of Alcohol Tax and Price Policies on Morbidity and Mortality: A Systematic Review. Am. J. Public Health 2010, 100, 2270–2278. [Google Scholar] [CrossRef]
- Babor, T.; Caetano, R.; Casswell, S.; Edwards, G.; Giesbrecht, N.; Graham, K.; Grube, J.W.; Hill, L.; Holder, H.; Homel, R.; et al. Alcohol: No Ordinary Commodity—Research and Public Policy, 2nd ed.; Oxford University Press: Oxford, UK, 2010. [Google Scholar] [CrossRef]
- La Foucade, A.; Metivier, C.; Gabriel, S.; Scott, E.; Theodore, K.; Lapiste, C. The potential for using alcohol and tobacco taxes to fund prevention and control of noncommunicable diseases in Caribbean Community countries. The potential for using alcohol and tobacco taxes to found prevention and control of noncommunicable diseases in Caribbean Community Countries. Rev. Panam. Salud Publica 2018, 42, e192. [Google Scholar]
- Chaloupka, F.J.; Powell, L.M.; Warner, K.E. The Use of Excise Taxes to Reduce Tobacco, Alcohol, and Sugary Beverage Consumption. Annu. Rev. Public Health 2019, 40, 187–201. [Google Scholar] [CrossRef] [Green Version]
- Nelson, J.P.; McNall, A.D. Alcohol Prices, Taxes, and Alcohol-Related Harms: A Critical Review of Natural Experiments in Alcohol Policy for Nine Countries. Health Policy 2016, 120, 264–272. [Google Scholar] [CrossRef]
- McClelland, R.; Iselin, J. Do state excise taxes reduce alcohol-related fatal motor vehicle crashes? Econ. Inq. 2019, 57, 1821–1841. [Google Scholar] [CrossRef]
- Angus, C.; Holmes, J.; Meier, P.S. Comparing alcohol taxation throughout the European Union. Addiction 2019, 114, 1489–1494. [Google Scholar] [CrossRef] [Green Version]
- Nuță, A.-C.; Nuță, F.-M. Modelling the Influences of Economic, Demographic, and Institutional Factors on Fiscal Pressure Using OLS, PCSE, and FD-GMM Approaches. Sustainability 2020, 12, 1681. [Google Scholar] [CrossRef] [Green Version]
- Onofrei, M.; Gavriluţă, A.F.; Bostan, I.; Oprea, F.; Paraschiv, G.; Lazăr, C.M. The Implication of Fiscal Principles and Rules on Promoting Sustainable Public Finances in the EU Countries. Sustainability 2020, 12, 2772. [Google Scholar] [CrossRef] [Green Version]
- Costea, I.M. Fiscalitate Europeană. Note de Curs; Hamangiu: Bucharest, Romania, 2016; 408p. [Google Scholar]
- Oprea, F.; Mehdian, S.; Stoica, O. Fiscal and financial stability in Romania-an overview. Transylv. Rev. Adm. Sci. 2013, 40, 159–182. [Google Scholar]
- Vintilă, G.; Onofrei, M.; Ţibulcă, I.L. Fiscal convergence in an enlarged European Union. Transylv. Rev. Adm. Sci. 2014, 10, 213–223. [Google Scholar]
- Oprea, F.; Bilan, I.; Stoica, O. Public Debt Policy in Romania—A Critical Review. In Models and Methods in Applied Sciences, Proceedings of the 2nd International Conference on Environment, Economics, Energy, Devices, Systems, Communications, Computers, Mathematics (EDSCM ‘12), Saint Malo & Mont Saint-Michel, France, 2–4 April 2012; WSEAS Press: Saint Malo & Mont Saint-Michel, France, 2012; pp. 212–217. [Google Scholar]
- Anton, S.G.; Onofrei, M. Health Care Performance and Health Financing System in Selective Countries from Central and Eastern Europe. A Comparative Study. Transylv. Rev. Adm. Sci. 2012, 35, 22–32. [Google Scholar]
- Anton, S.G. Financing health care in Romania and implications on the access to health services. USV Ann. Econ. Public Adm. 2013, 12, 195–200. [Google Scholar]
- Morariu, A. The Management of the Human Resources in the Public Health System: The Complexity and the Euro-Global Socio-Economic Challenges. Rev. Cercet. Interv. Soc. 2014, 44, 266–278. [Google Scholar]
- Costea, I.M. Combaterea Evaziunii Fiscale si Frauda Comunitara; C.H. Beck: Bucharest, Romania, 2010; 344p. [Google Scholar]
- Morariu, A. The Phenomenon of not Declaring Paid Activities to the Public Authorities. Ovidius Univ. Ann. Econ. Sci. Ser. 2017, 17, 263–267. [Google Scholar]
- Tofan, M.; Gavriluţă (Vatamanu), A.F. Heterogeneity of taxation and fiscal challenges. In European Union Financial Regulation and Administrative Area; Tofan, M., Bilan, I., Cigu, E., Eds.; Editura Universităţii “Alexandru Ioan Cuza”: Iaşi, Romania, 2019; pp. 771–779. [Google Scholar]
- The Official Gazette of Romania. Fiscal Code of Romania with Its Application Norms. The Law No. 227/2015 on the Fiscal Code, Updated by Government Emergency Ordinance No. 1/202; Romanian Parliament: Bucharest, Romania, 2015. [Google Scholar]
- National Institute of Statistics. Romanian Statistical Yearbook 2018; National Institute of Statistics: Bucharest, Romania, 2019; Available online: https://insse.ro/cms/sites/default/files/field/publicatii/anuarul_statistic_al_romaniei_carte_en_1.pdf (accessed on 4 March 2021).
- National Institute of Statistics. Consumul de Băuturi în Anul 2015; National Institute of Statistics: Bucharest, Romania, 2016; Available online: https://insse.ro/cms/sites/default/files/field/publicatii/consumul_de_bautruri_in_anul_2016.pdf (accessed on 4 April 2021).
- National Institute of Statistics. Consumul de Băuturi în Anul 2017; National Institute of Statistics: Bucharest, Romania, 2018; Available online: https://insse.ro/cms/sites/default/files/field/publicatii/consumul_de_bauturi_in_anul_2017.pdf (accessed on 5 April 2021).
- National Institute of Statistics. Consumul de Băuturi în Anul 2018; National Institute of Statistics: Bucharest, Romania, 2019; Available online: https://insse.ro/cms/sites/default/files/field/publicatii/consumul_de_bauturi_in_anul_2018.pdf (accessed on 6 April 2021).
- National Institute of Public Health. Luna Națională a Informării Despre Efectele Consumului de Alcool; Analiză de Situație; National Institute of Public Health: Bucharest, Romania, 2019. Available online: https://insp.gov.ro/sites/cnepss/wp-content/uploads/2016/01/ANALIZA-DE-SITUATIE-2019.pdf (accessed on 7 April 2021).
- World Health Organization. Indicators. 2020. Available online: https://www.who.int/data/gho/data/indicators (accessed on 8 April 2021).
- Institute for Health Metrics and Evaluation. 2020. Available online: https://vizhub.healthdata.org/cod/ (accessed on 8 March 2021).
- Fiscal Code of Romania with the Application Norms. 2014. Available online: https://static.anaf.ro/static/10/Anaf/Legislatie_R/Cod_fiscal_norme_2014.htm (accessed on 10 April 2021).
- Fiscal Code of Romania with the Application Norms. 2015. Available online: https://static.anaf.ro/static/10/Anaf/legislatie/CFN_ante_21ian15_OG4.htm (accessed on 11 April 2021).
- Fiscal Code of Romania with the Application Norms. 2016. Available online: http://static.anaf.ro/static/10/Anaf/legislatie/L_227_2015.htm (accessed on 12 April 2021).
- Fiscal Code of Romania with the Application Norms. 2017. Available online: https://static.anaf.ro/static/10/Anaf/legislatie/Cod_fiscal_norme_2018.htm (accessed on 13 April 2021).
- Fiscal Code of Romania with the Application Norms. 2018. Available online: https://static.anaf.ro/static/10/Anaf/legislatie/Cod_fiscal_norme_10122018.htm (accessed on 15 April 2021).
- Ministry of Public Finance. 2020. Available online: www.mfinante.gov (accessed on 16 April 2021).
- Spirits Romania–Asociația Producătorilor și Importatorilor de Băuturi Spirtoase din Romania. Sectorul Bauturilor Spirtoase in Romania; Asociația Producătorilor și Importatorilor de Băuturi Spirtoase din Romania: Bucharest, Romania, 2014; Available online: http://www.spirits-romania.ro/wp-content/uploads/2015/09/Spirits-Ro.pdf (accessed on 16 April 2021).
- Consiliul Fiscal. Raport Anual 2015; Consiliul Fiscal: Bucharest, Romania, 2016; Available online: http://consiliulfiscal.ro/RA2015%20ro%203iunie2016%20c.pdf (accessed on 17 April 2021).
- Consiliul Fiscal. Raport Anual 2017; Consiliul Fiscal: Bucharest, Romania, 2018; Available online: http://www.consiliulfiscal.ro/raport_2017_final.pdf (accessed on 17 April 2021).
- Consiliul Fiscal. Raport Anual 2018; Consiliul Fiscal: Bucharest, Romania, 2019; Available online: http://www.consiliulfiscal.ro/raport2018final.pdf (accessed on 18 April 2021).
- Sopek, P. The Alcohol Taxation System in European Union and Croatia. Institute of Public Finance Newsletter 2013, No. 76. Available online: http://www.ijf.hr/upload/files/file/ENG/newsletter/76.pdf (accessed on 18 April 2021).
- European Commission. Data on Taxation 2020; European Commission: Brussels, Belgium, 2020; Available online: https://ec.europa.eu/taxation_customs/business/economic-analysis-taxation/data-taxation_en (accessed on 18 April 2021).
- National Institute of Public Health. Ghid de Prevenție; National Institute of Public Health: Bucharest, Romania, 2016; Volume 2, Partea I. Available online: http://insp.gov.ro/sites/1/wp-content/uploads/2014/11/Ghid-Volumul-2-web.pdf (accessed on 19 April 2021).
- Furtunescu, F.; Galan, A.; Mihăescu-Pinția, C. Studiu Privind Impactul Economic al Consumului Dăunător de Alcool Asupra Sistemului de Sănătate din România. Studiu de Cercetare; Asociația Română Pentru Promovarea Sănătății: Bucharest, Romania, 2016; Available online: https://arps.ro/sites/default/files/Studiu_impact%20economic%20consum%20alcool_.pdf (accessed on 19 April 2021).
- Eurostat Database. 2020. Available online: https://appsso.eurostat.ec.europa.eu/nui/submitViewTableAction.do (accessed on 20 April 2021).
- Alcohol and Disease Related Impact Software. 2008. Available online: https://nccd.cdc.gov/DPH_ARDI/default/default.aspx (accessed on 1 May 2021).
- Hedlund, J.H. If they didn’t drink, would they crash anyway? The role of alcohol in traffic crashes. Alcohol Drugs Driv. 1994, 110, 115–125. [Google Scholar]
- United Nations. Transforming Our World: The 2030 Agenda for Sustainable Development; United Nations: New York, NY, USA, 2015. [Google Scholar]
- Nissensohn, M.; Sánchez-Villegas, A.; Galan, P.; Turrini, A.; Arnault, N.; Mistura, L.; Ortiz-Andrellucchi, A.; Edelenyi, F.S.d.; D’Addezio, L.; Serra-Majem, L. Beverage Consumption Habits among the European Population: Association with Total Water and Energy Intakes. Nutrients 2017, 9, 383. [Google Scholar] [CrossRef] [Green Version]
- Agarwal, S.; Marwell, N.; McGranahan, L. Consumption responses to temporary tax incentives: Evidence from state sales tax holidays. Am. Econ. J. Econ. Policy. 2017, 9. [Google Scholar] [CrossRef] [Green Version]
- Surrey, S.S. Tax incentives as a device for implementing government policy: A comparison with direct government expenditures. Harv. Law Rev. 1970, 83, 705–738. [Google Scholar] [CrossRef]
- Alonso, S.L.N.; Forradellas, R.R. Tax Incentives in Rural Environment as Economic Policy and Population Fixation. Case study of Castilla-León Region. In Business, Economics and Science Common Challenges; Bernat, T., Duda, J., Eds.; Filodiritto Editore: Bologna, Italy, 2020; pp. 205–210. [Google Scholar]
- Alonso, S.L.N. The Tax Incentives in the IVTM and “Eco-Friendly Cars”: The Spanish Case. Sustainability 2020, 12, 3398. [Google Scholar] [CrossRef] [Green Version]
- Jappelli, T.; Pistaferri, L. Do people respond to tax incentives? An analysis of the Italian reform of the deductibility of home mortgage interests. Eur. Econ. Rev. 2007, 51, 247–271. [Google Scholar] [CrossRef]
- Alhulail, I.; Takeuchi, K. Effects of Tax Incentives on Sales of Eco-Friendly Vehicles: Evidence from Japan (No. 1412); Kobe University: Kobe, Japan, 2014. [Google Scholar]

Publisher’s Note: MDPI stays neutral with regard to jurisdictional claims in published maps and institutional affiliations. |
© 2021 by the authors. Licensee MDPI, Basel, Switzerland. This article is an open access article distributed under the terms and conditions of the Creative Commons Attribution (CC BY) license (https://creativecommons.org/licenses/by/4.0/).