1. Introduction
Studies have shown that sea level rise (SLR) serves as one of the most extreme climate change impacts, allowing rising waters to threaten global coastlines and coastal societies. The need for taking actions against SLR is even more urgent in low-lying regions such as Denmark with over 7000 km of coastline, straddling the North and Baltic Sea. There are numerous factors that can threaten such a foundation and lead to SLR and flooding, such as climate change and human activities. In 2018, the Intergovernmental Panel on Climate Change (IPCC) concluded that climate change is accelerated by anthropogenic means [
1]. Greenhouse gas emissions have been rising for over a century, with Carbon Dioxide (CO
2) emissions escalating significantly since the 1950s. A higher concentration of CO
2 in the atmosphere has resulted in an increase of the Earth’s average atmospheric temperature. Consequently, new weather and climate phenomena have become observable in the form of more aggressive heat waves, droughts, floods, rising sea levels and destabilizing ecosystems [
1].
According to the IPCC, the global mean SLR is projected to be around 0.1 m lower with global warming of 1.5 °C compared to 2 °C, by 2100, highlighting the need for immediate reduction of greenhouse gas producing activities. The magnitude and rate of SLR depends on the future representative greenhouse gas concentration pathway scenario (RCP) for a particular study area [
1]. At the Conference of the Parties in 2015, the 196 member states of the United Nations Framework Convention on Climate Change signed a legally binding climate agreement: The Paris Agreement. Countries taking part in this agreement are obligated to contribute to reducing national greenhouse gas emissions by 40% in 2030 compared to 1990 emission levels with the purpose to limit future temperature rise to 1.5 °C instead of the expected 2 °C [
2]. Rising temperatures further exacerbates sea levels as thermal expansion causes water to fill a larger volume and move further inland [
3]. Temperature increases leads to depletion of ice, glaciers, and other stored water sources, releasing substantial amounts of water to the oceans, and ultimately lead to the risk of flooding. If anthropogenic emissions of CO
2 continue at current observable rates, global temperatures will continue to increase, leading to major impacts on human living conditions, many of which to be caused by SLR [
1].
The IPCC believes a slower rate of SLR enables greater opportunities for adaptation in the human and ecological system of small islands and low-lying coastal areas [
1]. Adaptation due to SLR is necessary as urbanization has resulted in populations moving closer to water, with overall economic development taking place in coastal regions worldwide. For example, over 30% of Denmark’s tourism revenue originating from coastal-based activities in 2019 [
4]. This compression of coastal areas being transformed into urban areas can lead to increased risk of exposure to hazardous natural events, such as coastal erosion, storm surges, coastal inundation, salination of fresh water supplies and so forth. Another impact of urbanization is how surrounding areas of rivers or coastlines have been developed, increasing the chances of flooding due to impervious cover. Drains and sewers are funneling runoff water directly to these environments, preventing natural land cover from absorbing water under normal circumstances [
5].
A recent study found that municipalities across Denmark are aware that sea levels are rising and that they are likely to have a significant impact on their municipality, but how they are going to be impacted exactly remains unknown [
6]. Thus, there is an urgent need for thorough spatial analysis of the down-scaled SLR at a local level within a practical analytical workflow in order to identify the vulnerable areas, population at risk, and business sectors in a given case study. Doing so will allow key stakeholders and local authorities to visualize and understand how they will be affected in various future SLR scenarios.
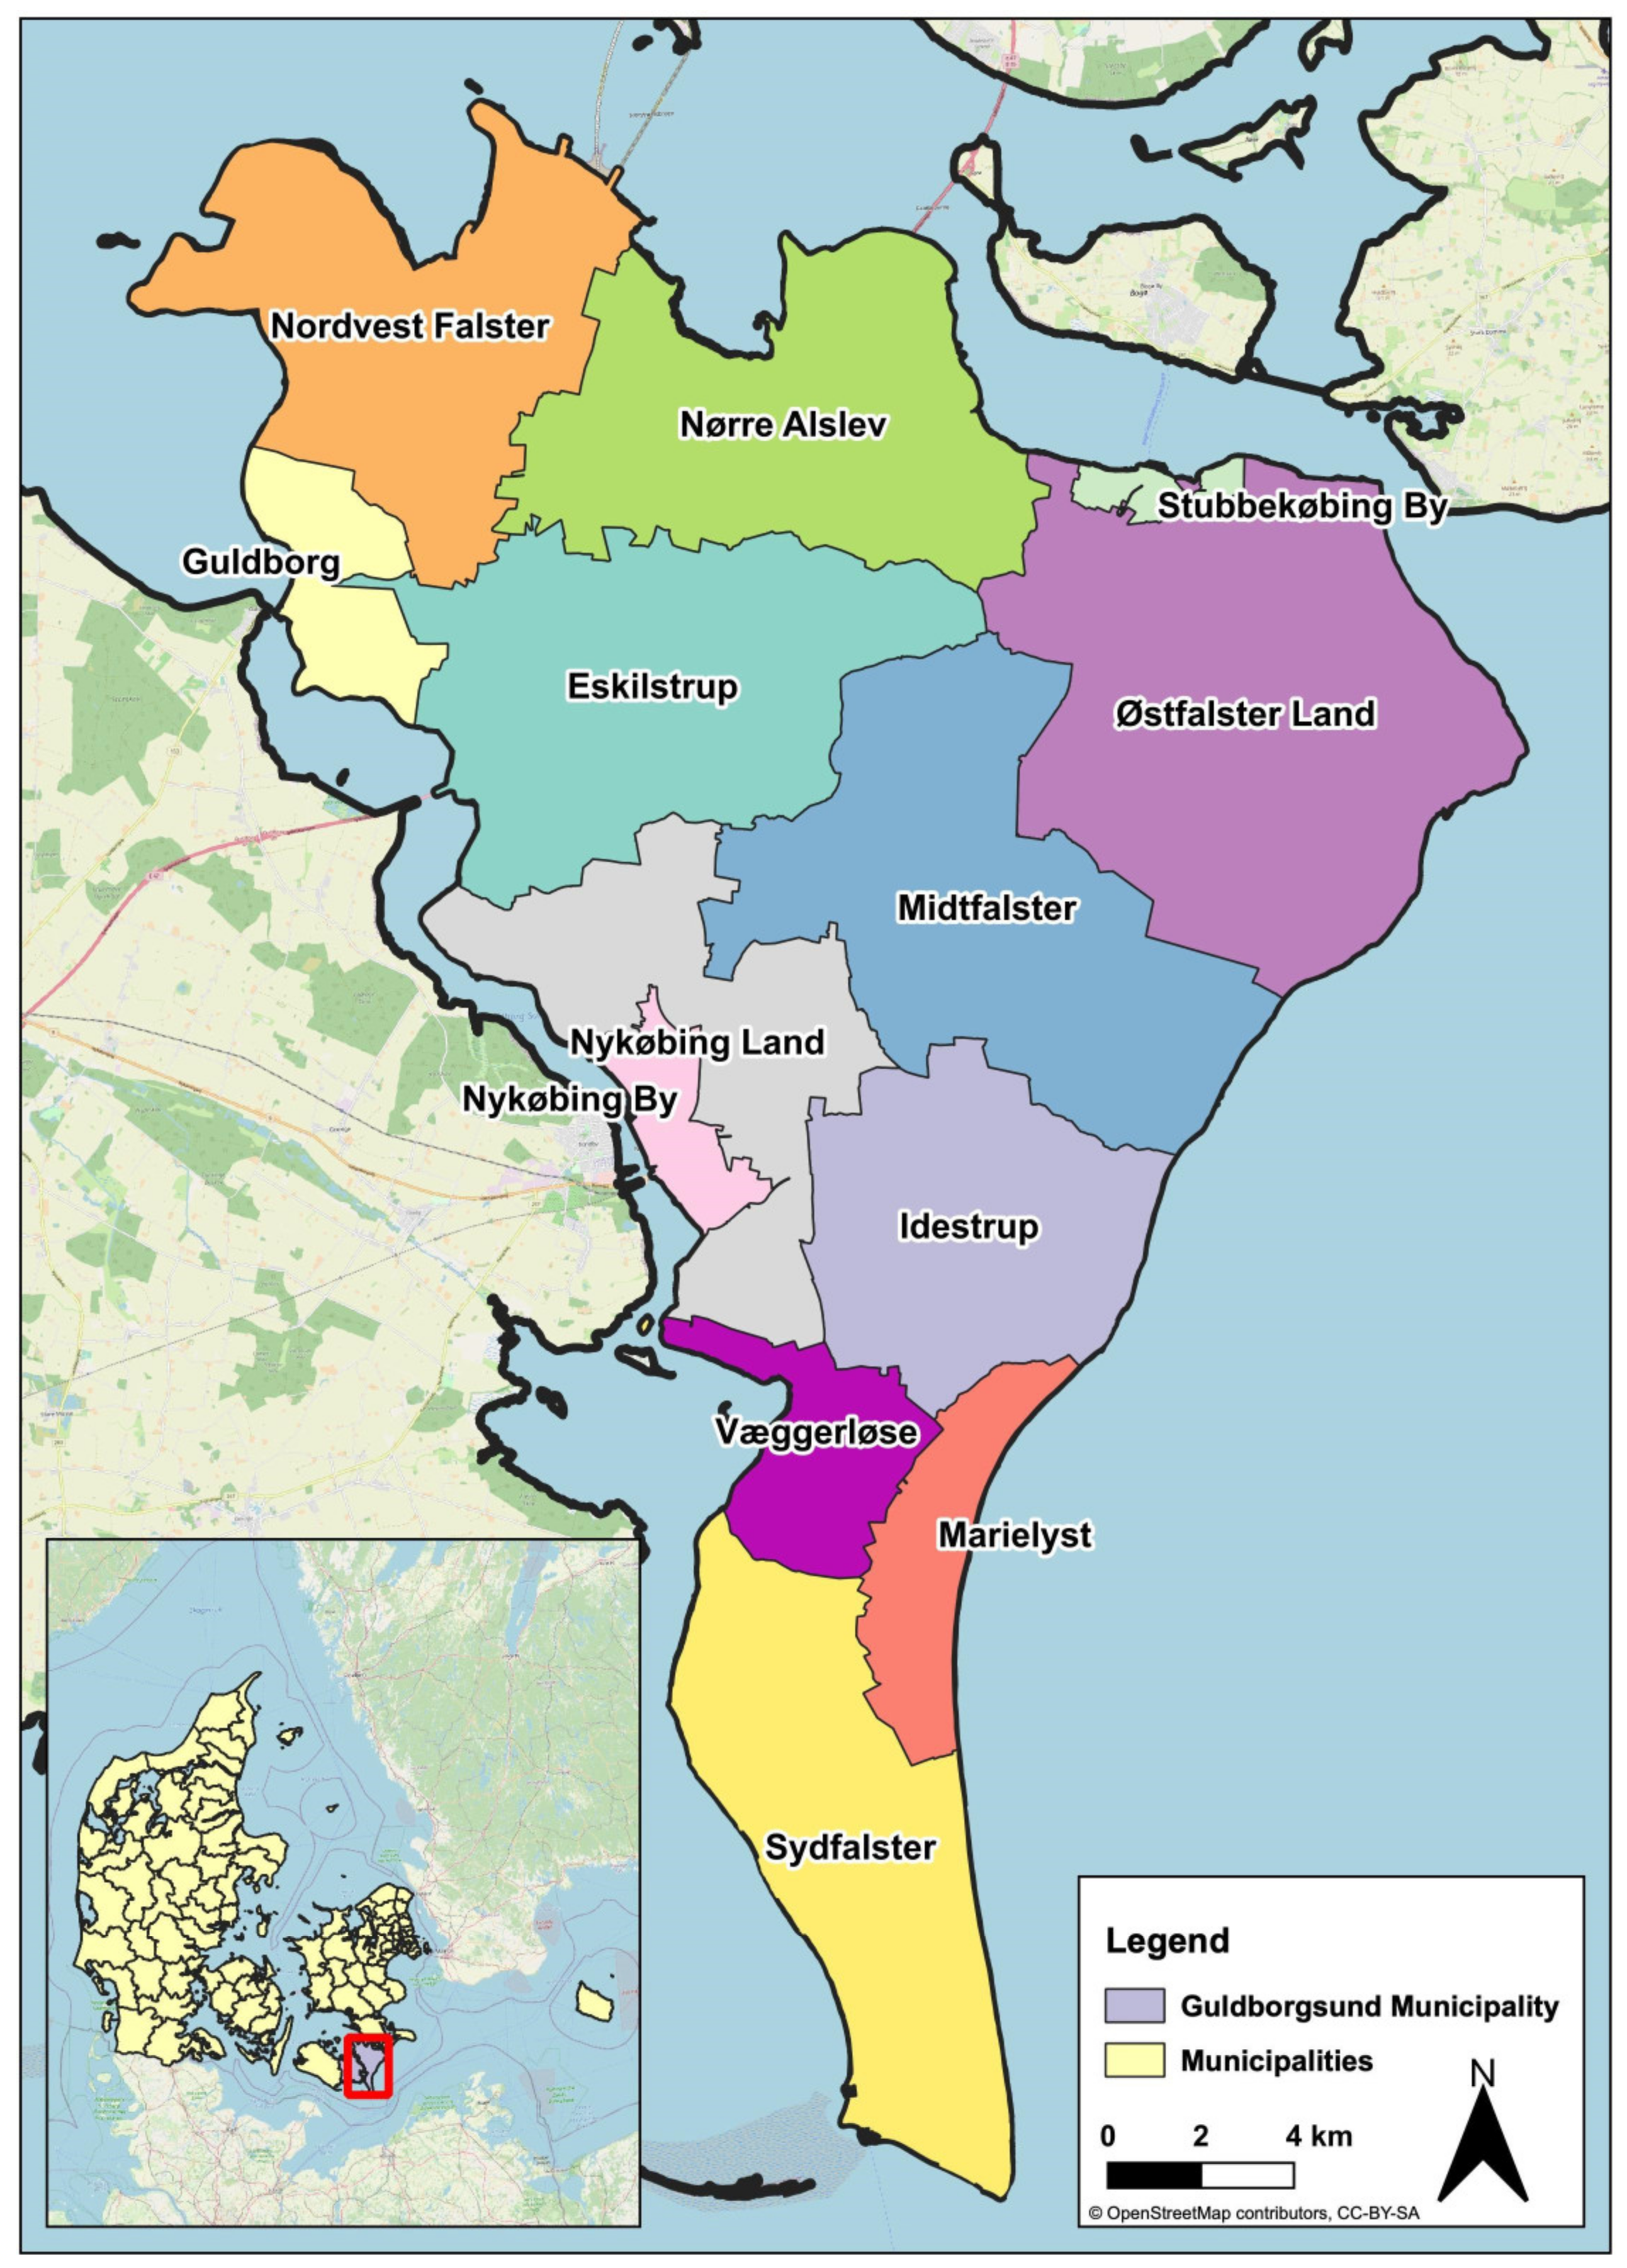
Hence, the main objective of this study is to illustrate the impacts of future SLR scenarios on an exemplary rich-data case study of Falster, located in the Guldborgsund municipality of Southeastern Denmark as shown in
Figure 1. Estimating impacted population, land cover types, as well as potential public health and economic impacts can allow stakeholders to more easily and effectively grasp the scale and severity of future SLR for their respective regions. Such analysis can prove critical for the Eastern portion of the municipality as it is a large island that is dependent upon tourism and overnight rentals of summer cottages, many of which reside near coastlines that are prone to the effects of SLR. This study aims at answering the following research question: How can we analyze the publicly available open data in order to gain insights on the extent of SLR for the island of Falster so that the municipality is aware of the impacts of future SLR?
2. Materials and Methods
Climate change and temperature increase due to the emission of greenhouse gases are expected to be the driving forces behind SLR [
1]. Official predicted levels for future SLR scenarios for the country of Denmark are produced and provided by the Danish Meteorological Institute (DMI). These estimations are guided by the IPCC’s RCPs for future atmospheric concentrations of greenhouse gas emissions and land use given current trends [
1].
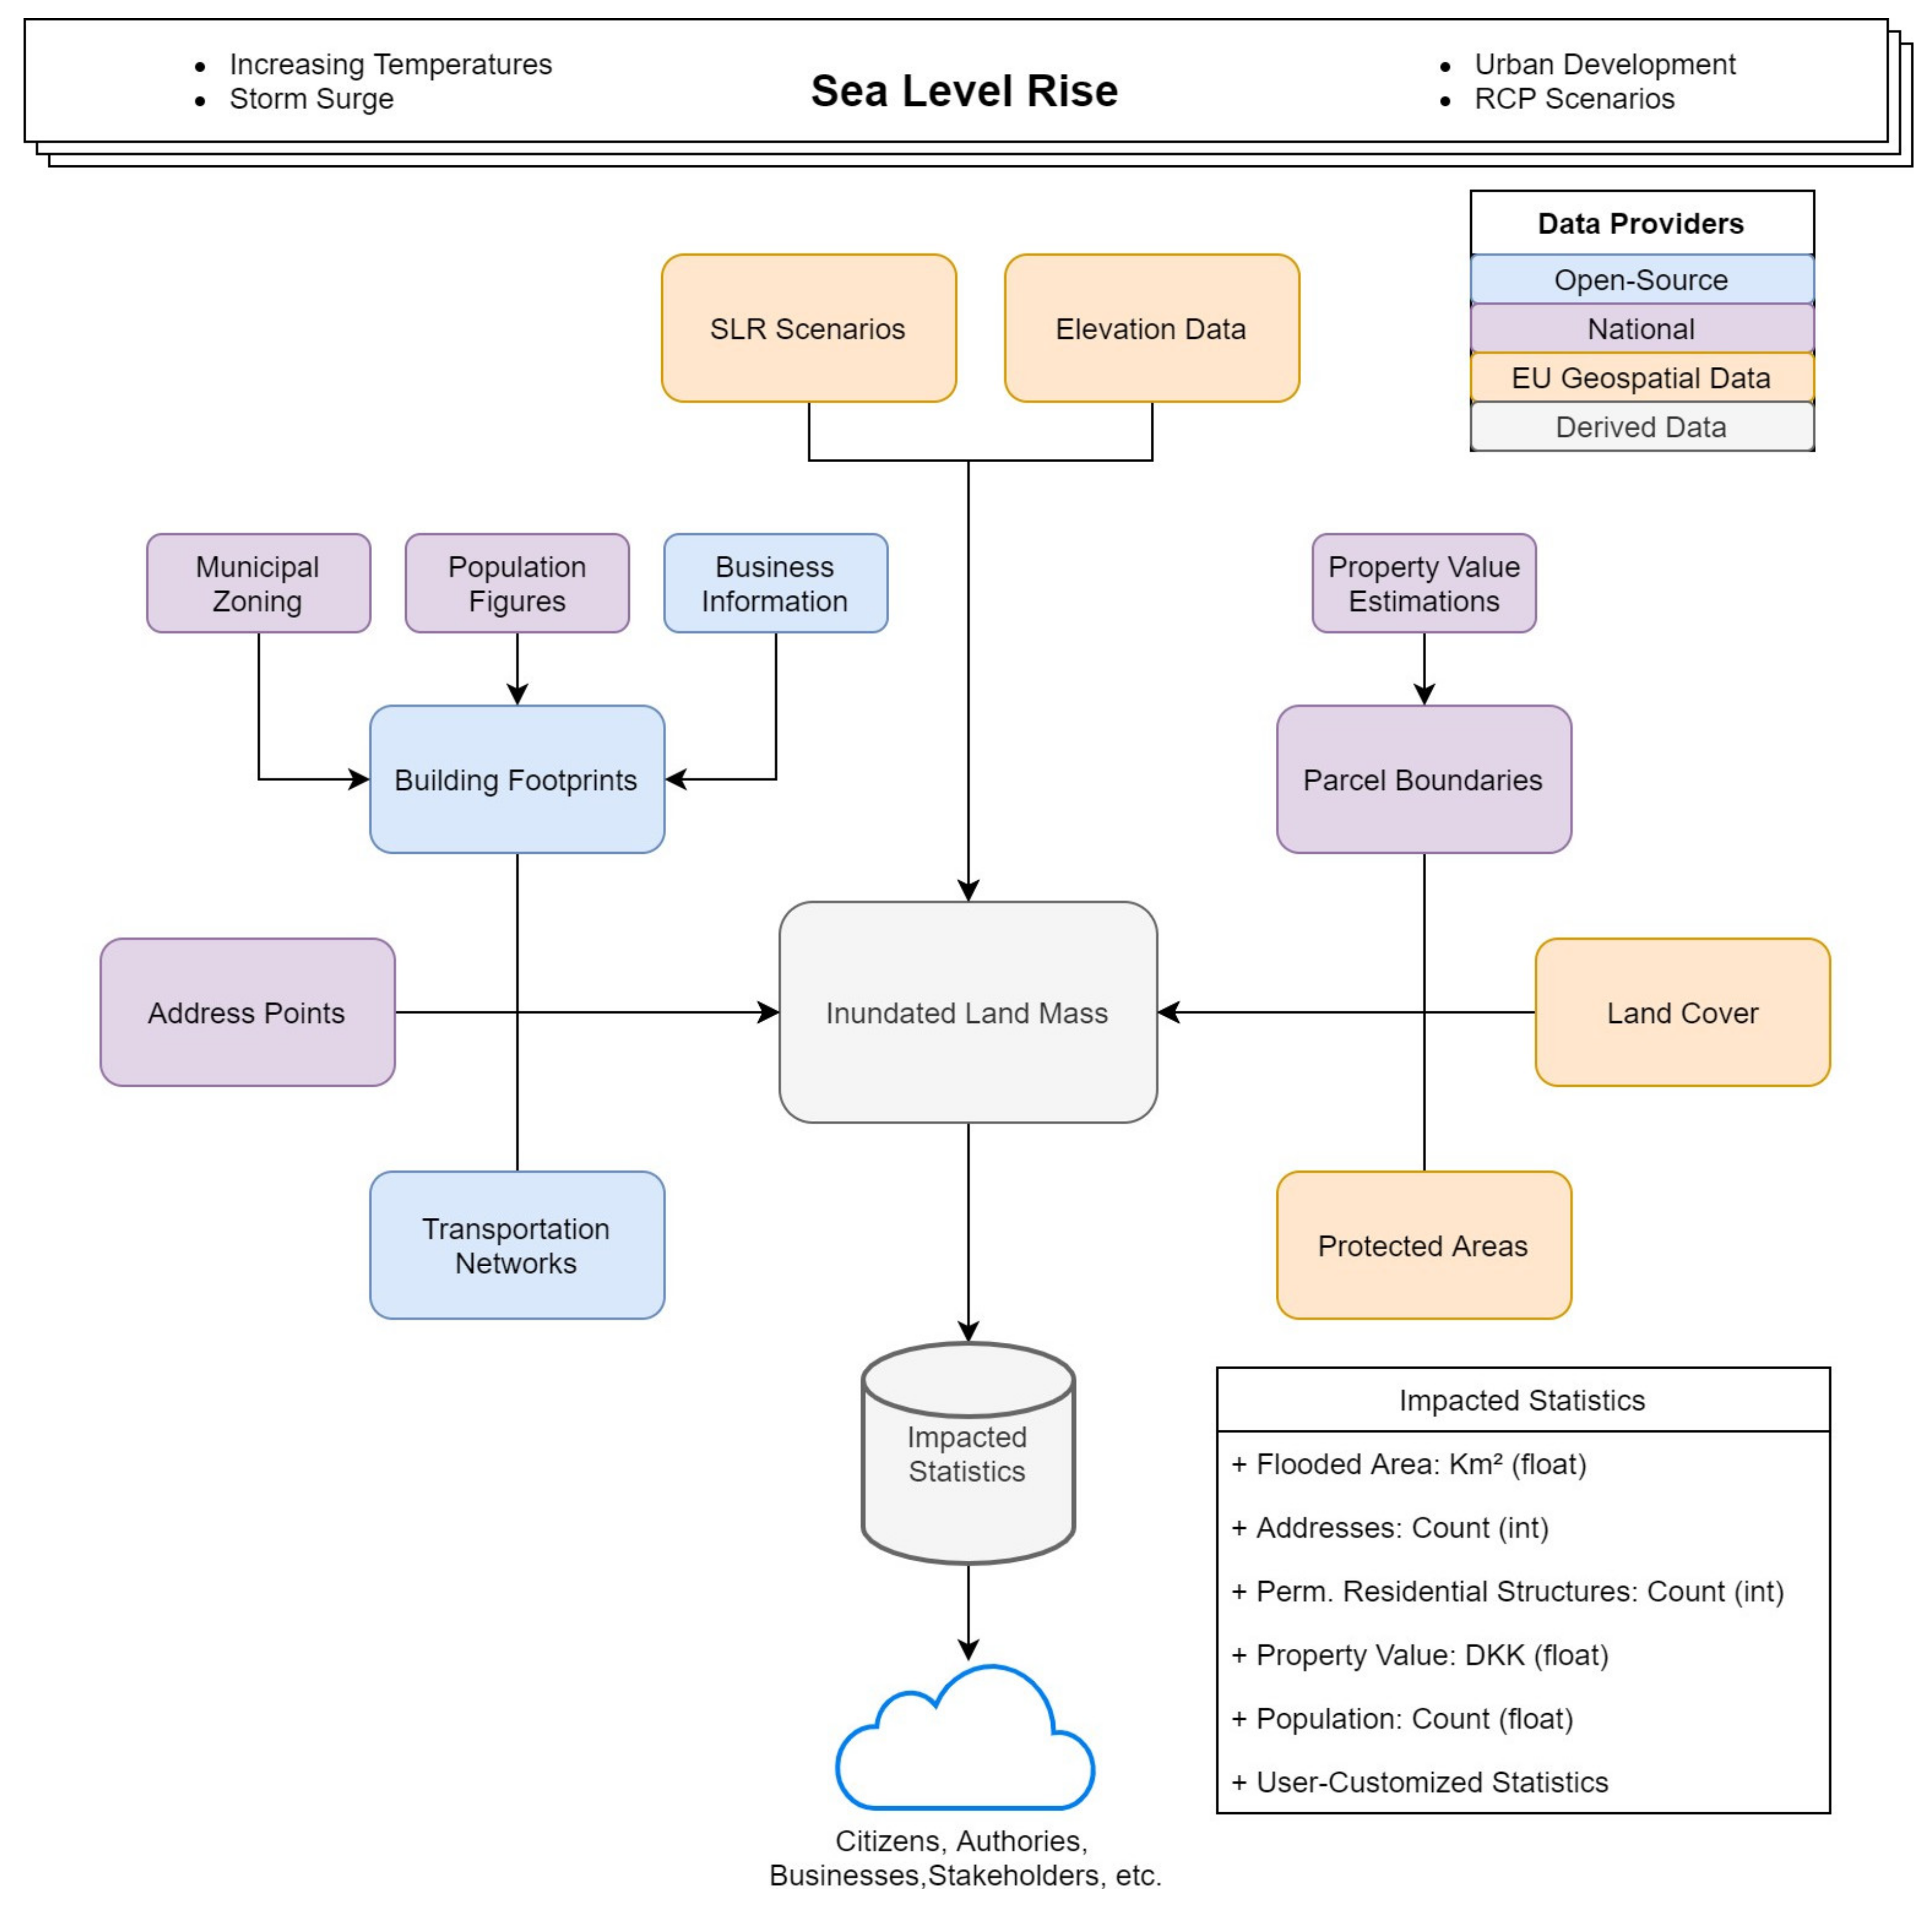
To conduct a thorough analysis of the potential impacts of SLR for the island of Falster, a proposed workflow was designed to organize and formulate the steps and data required to conduct such a study as seen in
Figure 2. Our proposed workflow incorporates large geospatial datasets combined with future SLR scenarios to derive consumable and actionable statistics to deliver to municipalities, authorities, and other stakeholders. Analysis of potential data sources concluded that Denmark has many rich spatial datasets available for download and consumption by the public.
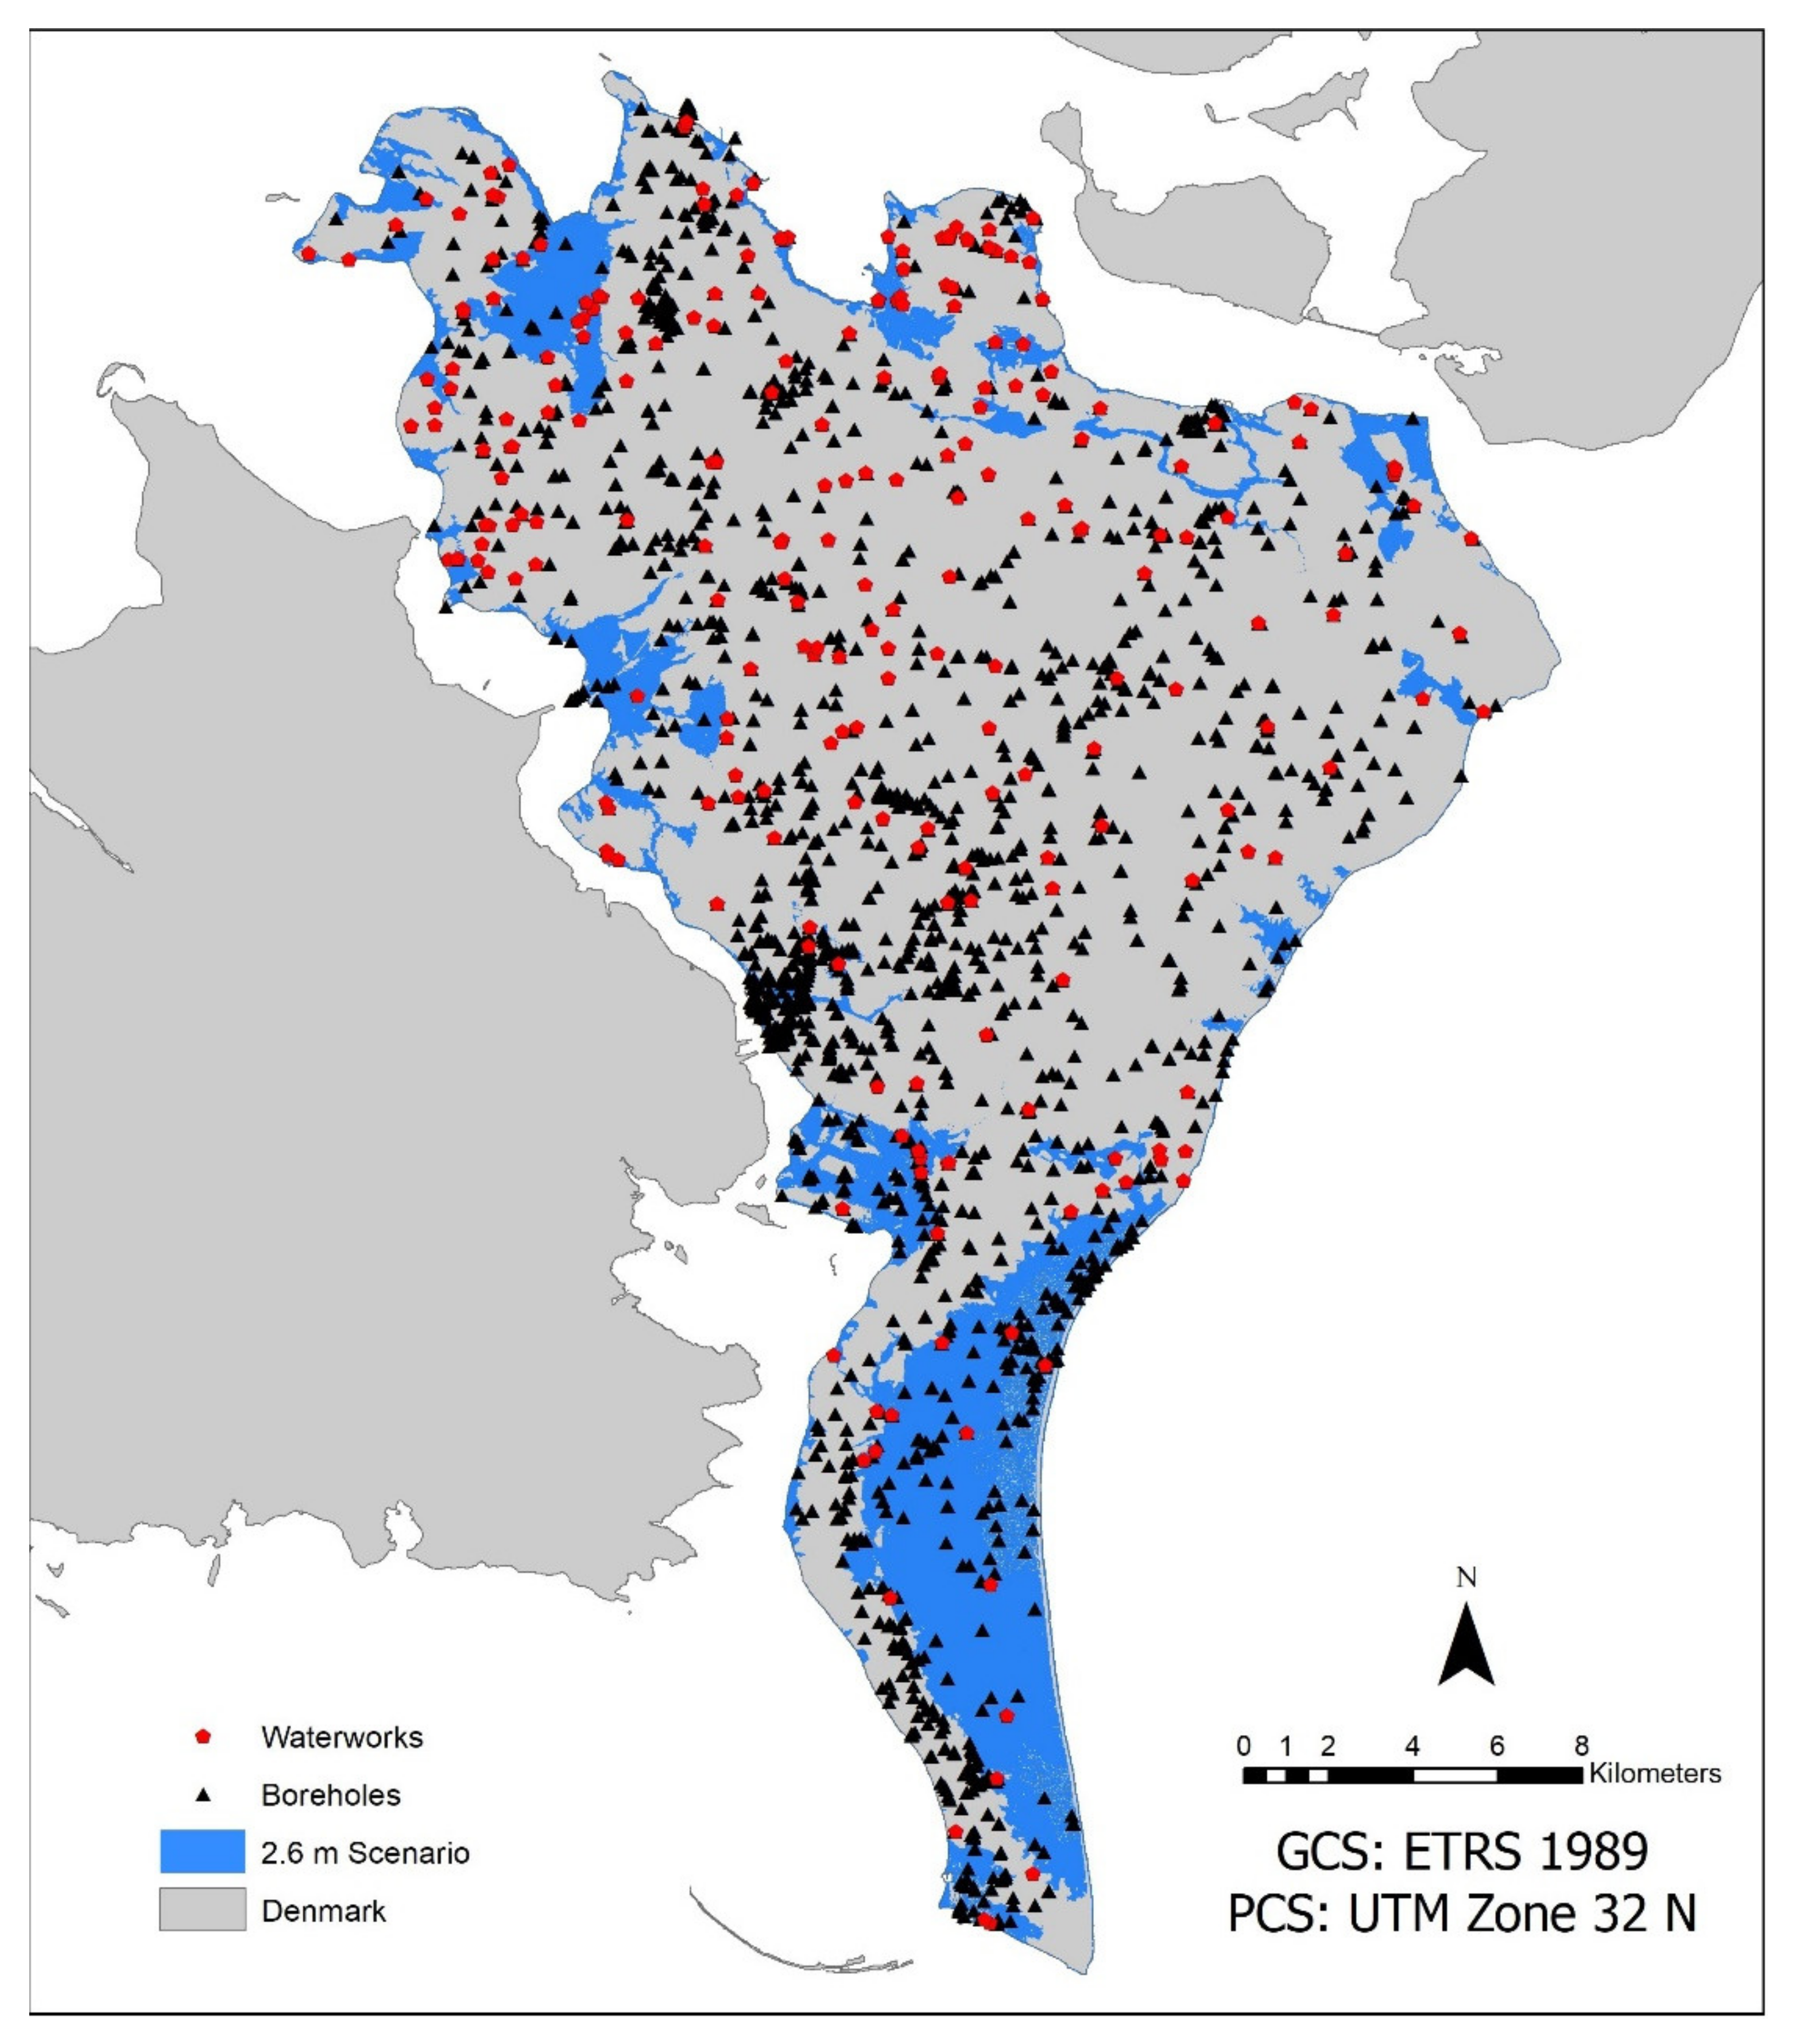
First, a general overview of each SLR scenario was conducted, focusing on the number of structures and parcels of land impacted, length of road network under water, and area of land flooded. Allowing stakeholders to obtain, at a quick glance, the severity of SLR. Next, potential shoreline change and movement was calculated for the study area to highlight areas where erosion of the island’s coastline could further worsen SLR conditions. Following this step, economic ramifications in the form of estimated property costs, industries and businesses impacted for each scenario was collected, assigning an economic value to the spatial event of SLR. Protected areas of land where then analyzed to determine the scale of protected area loss within the study area of Falster island. Critical infrastructure, such as waterworks and boreholes, are studied to derive the extent of inundation of infrastructure that is vital to the public. Land cover types were assessed highlighting further economic and public health issues that can arise from the loss of agricultural and urban land cover. Finally, followed by population estimates to highlight the severity of each event on the regions of the island. Such a comprehensive analysis of the island allows the opportunity for stakeholders, and the public, to see exactly where and how SLR can impact themselves and the areas around them. Municipalities and national governments can then see which areas are less impacted and study as to why that may be the case in order to combat the issue of SLR in neighboring municipalities.
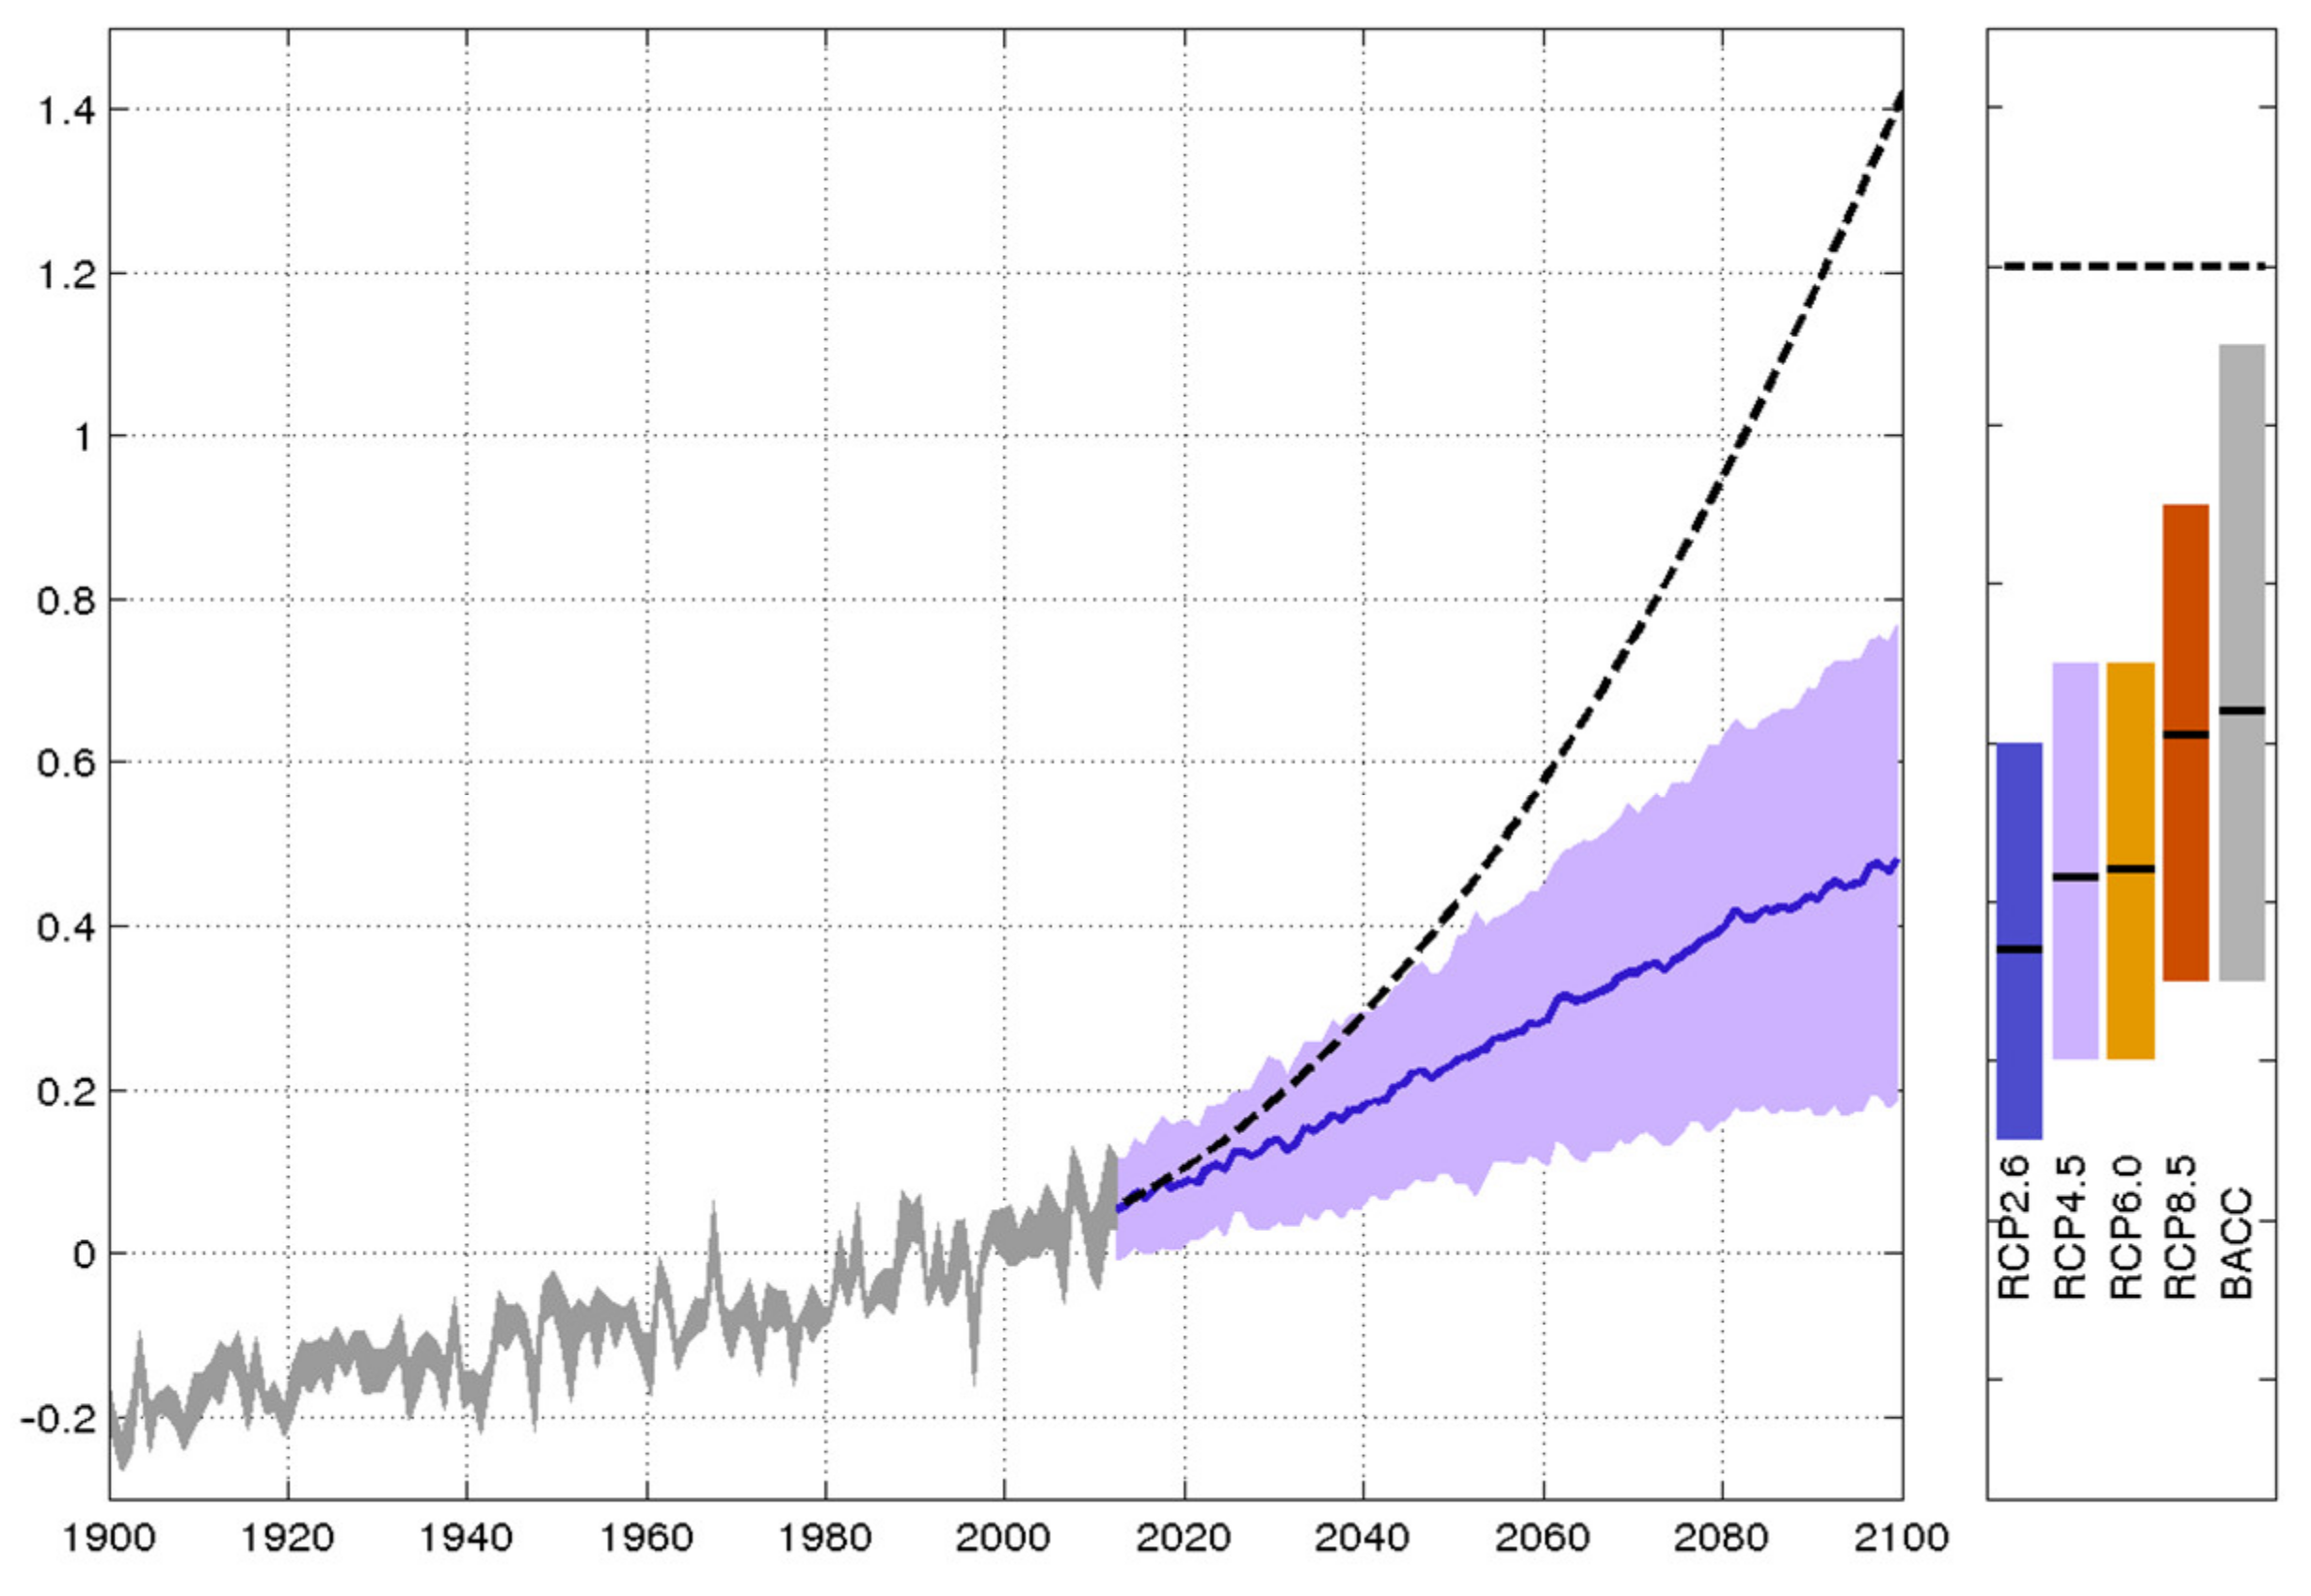
Visualizations and data creation for potential SLR scenarios in Denmark has been calculated and made available by DMI, as seen in
Figure 3, using Denmark’s high resolution digital elevation model (DEM) allowing for robust and detailed modeling of inundated areas in each scenario. Elevation data were collected via LiDAR scanning with an average point density of 4 to 5 points per square meter for all of Denmark resulting in a DEM raster with a spatial resolution of 40 cm per pixel [
8]. Pre-processed polygons, in the form of shapefiles (.shp) for each scenario were employed for this study to reduce data processing times and computational workloads. Using pre-processed data allows for quick and efficient implementation of data, where elevation rasters require specialized software in order to visualize and process elevation surfaces. Water level shapefiles accounted for local features, such as dikes and embankments, when calculating area under water. Meaning that if an area behind a dike was at a lower elevation than the water level during a SLR event, it would not be shown as flooded unless the SLR overwhelms the dike, or is widespread enough to circumvent the protective measures and flood the area from alternative avenues. With the Agency for Data Supply and Efficiency’s (SDFE) sea level modeling, an area of land must have access to the sea in order to be flooded, and it does not account for how long it will take for the area to flood [
8]. Sea level data are fundamental to this study and used in all subsequent steps to derive impacted figures and statistics. Rapid access to sea level polygons allows for quick implementation and turnaround.
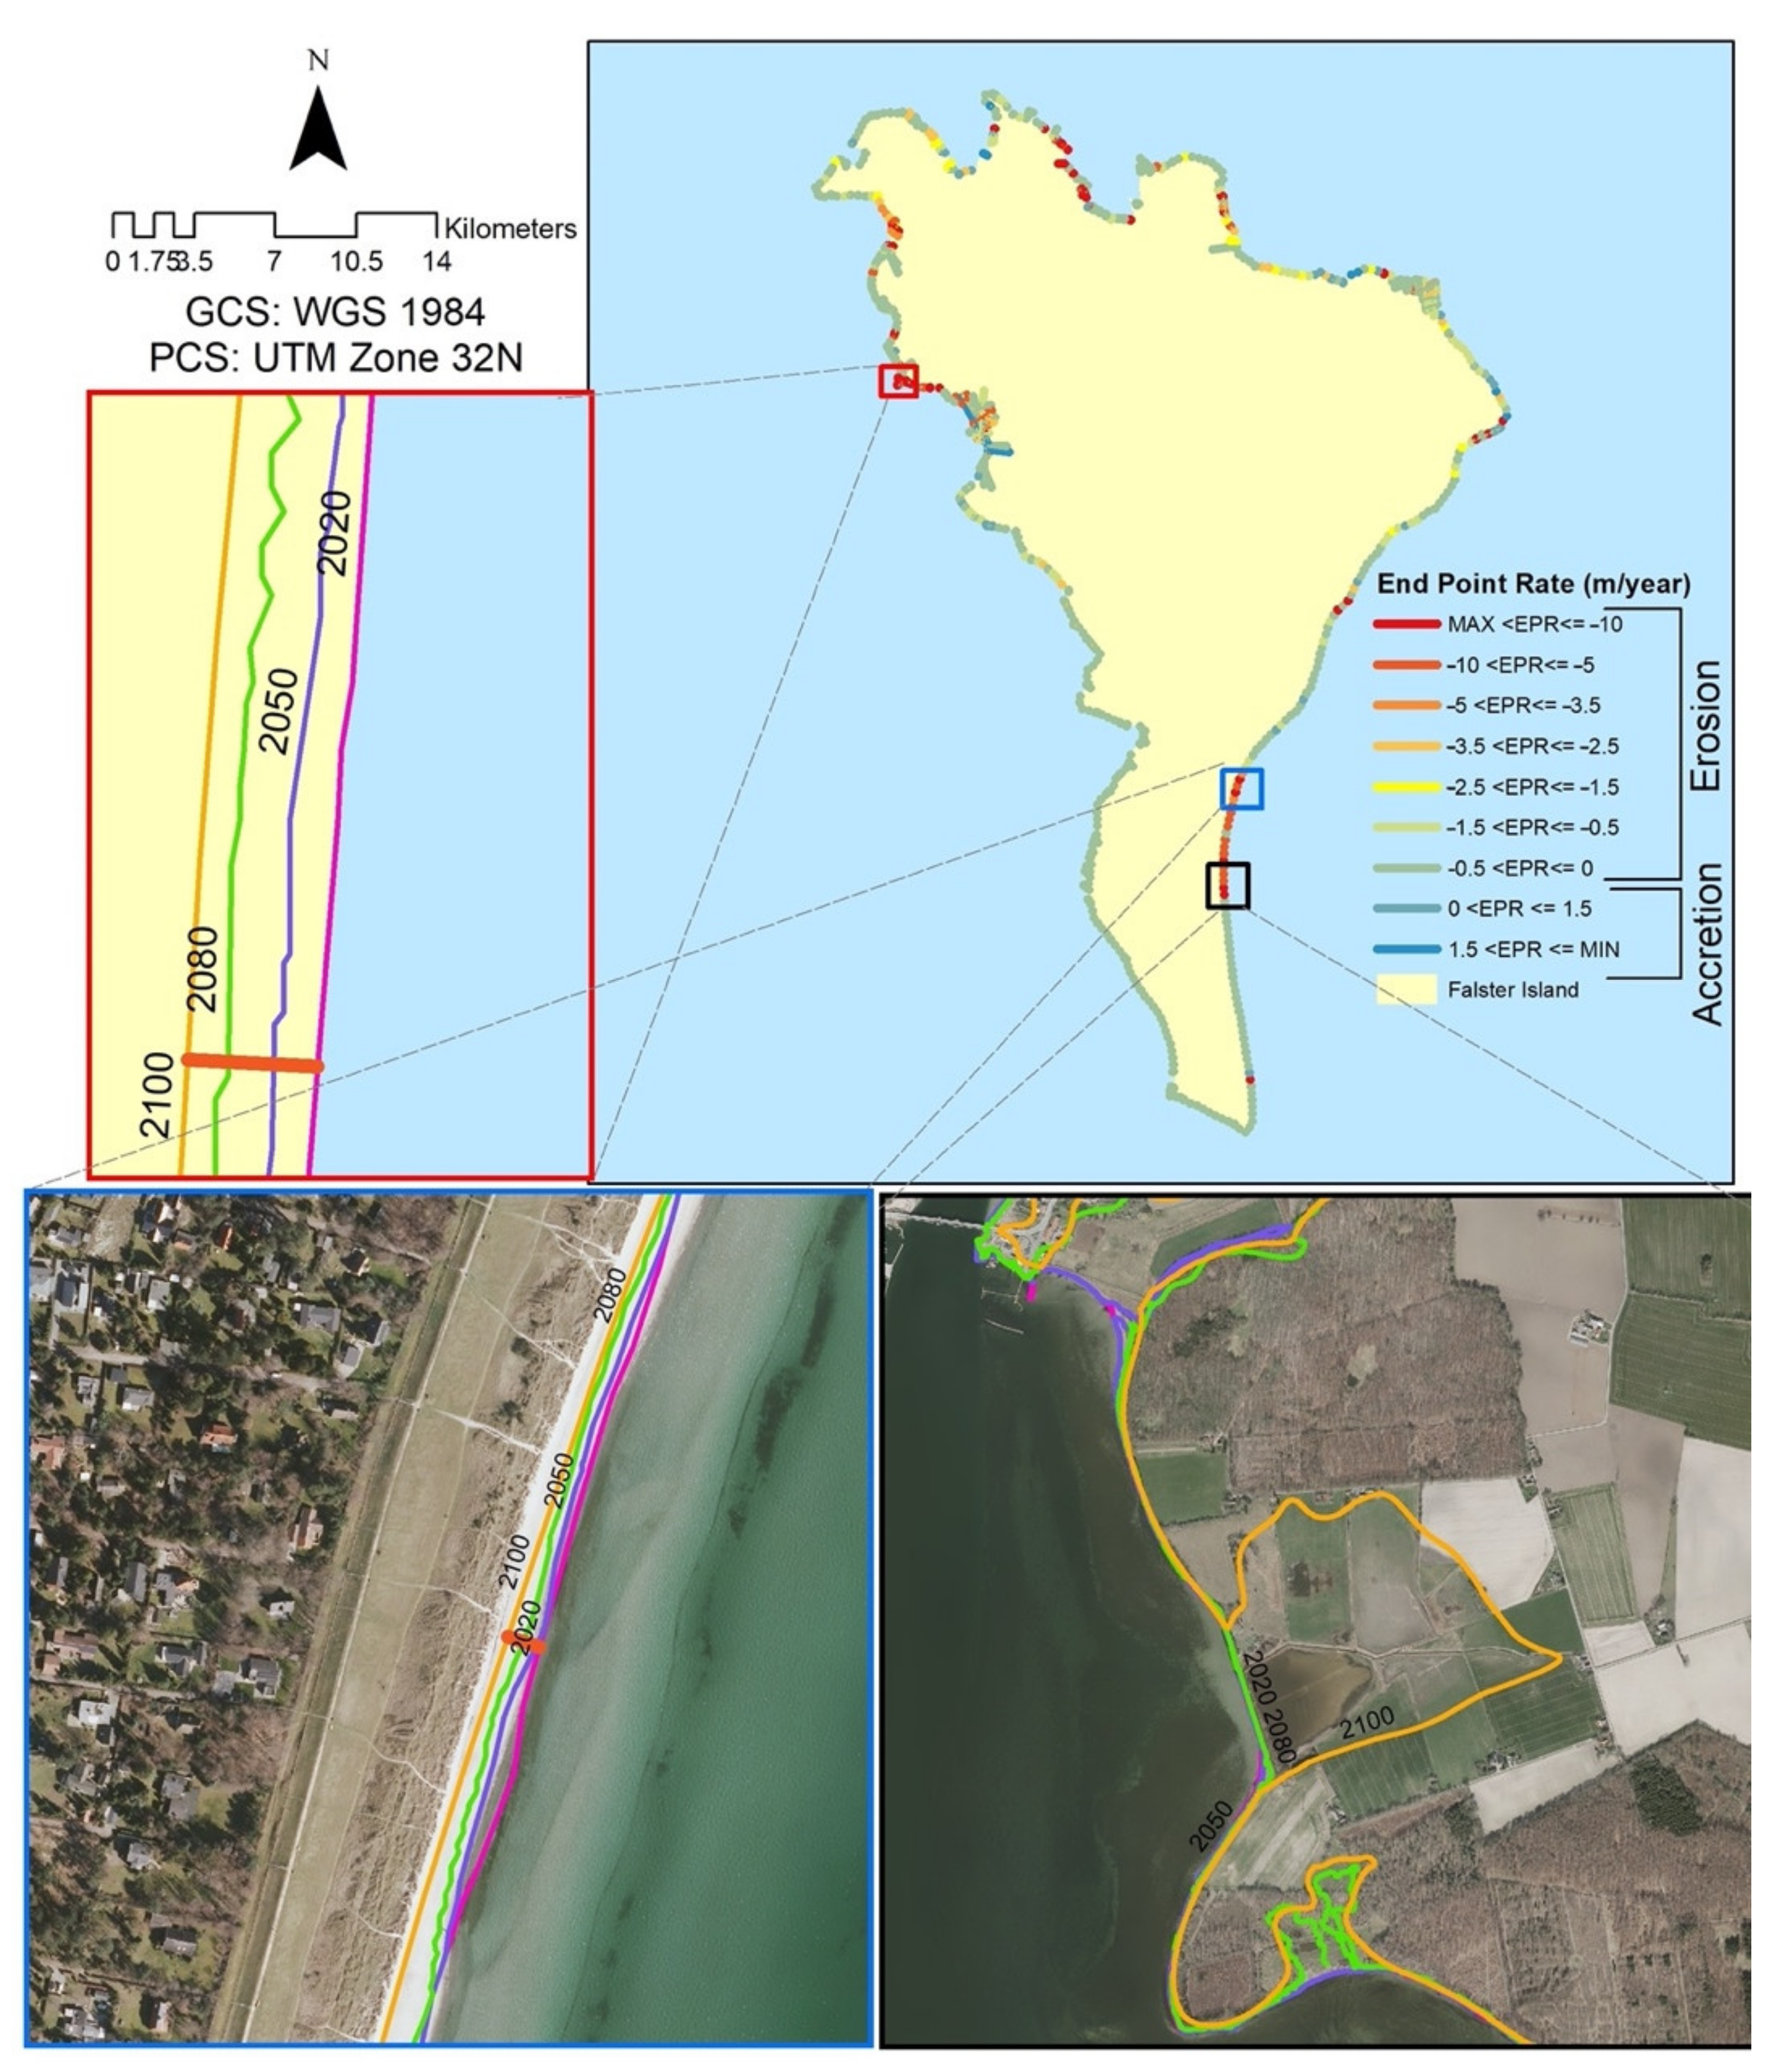
Calculations for shoreline erosion and accretion were performed using the Digital Shoreline Analysis System (DSAS) made available by the United States Geological Survey (USGS) for the island in the form of a freely available plugin for ArcGIS, a subscription-based GIS developed by ESRI (Environmental Systems Research Institute). Conducting End Point Rate (EPR) analysis requires a user to have access to ArcGIS. However, free alternatives are being developed in the form of the EPR4Q tool for QGIS, a free and open-sourced (FOSS) GIS, developed by QGIS users [
9].
To facilitate rapid deployment and applicability among other potential areas of SLR, OpenStreetMap (OSM) was considered to be an option for obtaining road networks as well as building footprints to determine the frequency of flooded structures in SLR event. To conduct a more rigorous analysis, the European Union (EU) led Infrastructure for Spatial Information in Europe (INSPIRE) program was employed for the purposes of this study. A structure that meets INSPIRE data standards is defined as “constructions above and/or underground which are intended or used for the shelter of humans, animals, things, the production of economic goods or the delivery of services and that refer to any structure permanently constructed or erected on its site” [
10]. These footprints are supplied by the Central Register of Buildings and Dwellings (BBR), which is formatted to the INSPIRE data initiative. In the case of Falster island, OSM reported that there are 40,249 structures as of November 2020, compared to the 66,166 structures provided by BBR (with OSM only reporting 61% of footprints reported by BBR). Due to the difference in data richness, BBR structure footprint data were employed for analysis in this study in order to gain better insight as to the severity of SLR and which areas would be vulnerable given the current building density on the island. Polygons representing building footprints were used to determine the number of structures would intersect with SLR data and therefore be impacted in each scenario. These footprints will also have population estimates per footprint spatially joined to them in order to estimate impacted population in later steps. OSM can be a good alternative to official building data as it is continuously updated and easy to access outside of specialized GIS software environments, such as in freely available Python environments. Whereas official data and statistics can be difficult to obtain, slow to update, and unwieldly to manipulate depending on the area and use case. Open source data provides a quick alternative, providing large amounts of data that is otherwise inaccessible or in a specialized format.
OSM can also be beneficial for analyzing potential impact on roadway networks. Using such data would allow the end user to see exactly where and to what extent that their thoroughfare infrastructure would be impacted or lost due to SLR. Due to ease of access of freely available road network line features from SDFE, official road network data were used to calculate transportation network estimates. This was calculated by intersecting road network data with SLR predictions in order to determine a figure. In the case of this study, the impacted road statistics only includes overall road kilometers, not individual lane kilometers, for the island.
Deriving estimated population impacts for an SLR scenario can be challenging depending of the end users’ access to controlled data. Due to privacy concerns, detailed population data that is made available to the public is aggregated up to an administrative level of church parishes in Denmark, versus a per structure statistic, a resolution that is too coarse to determine a realistic estimation for impacted population in a dynamic event such as SLR. As such, considerations had to be made when deriving population estimates so that the resulting statistics would provide a meaningful and accessible figure to provide stakeholders and interested parties a representative estimation for their respective areas.
To obtain an estimation concerning the potential number of individuals that could be at risk, tabular data from Statistics Denmark (DST) detailing aggregated population was spatially joined with administrative boundaries from SDFE. Address points from SDFE were then used to determine an average population per address in each region, followed by using these detailed address points to locate primary structures and assign a population per inhabited structure for each administrative area to determine which, and how many, structures and individuals were at risk in a SLR event. An individual was defined to be at risk if their structure (building footprint), or any part of their structure, had been overcome by the rising sea level.
Address data were downloaded from SDFE in the form of points. The points lay inside of the building footprint that they were assigned to and thus were used to determine inhabited residential structures on the island to determine population estimates. If address points had not been used to determine the “primary” structure of the parcel, the average population of an area would be skewed too high due to the abundance of structures (sheds, garages, etc.). Using address points allows one to narrow down which structures to focus on in the case of an SLR event. To put this into perspective, there were 93,234 building footprints located in Guldborgsund Municipality, while there are only 40,546 registered address points for the same area as of November 2020.
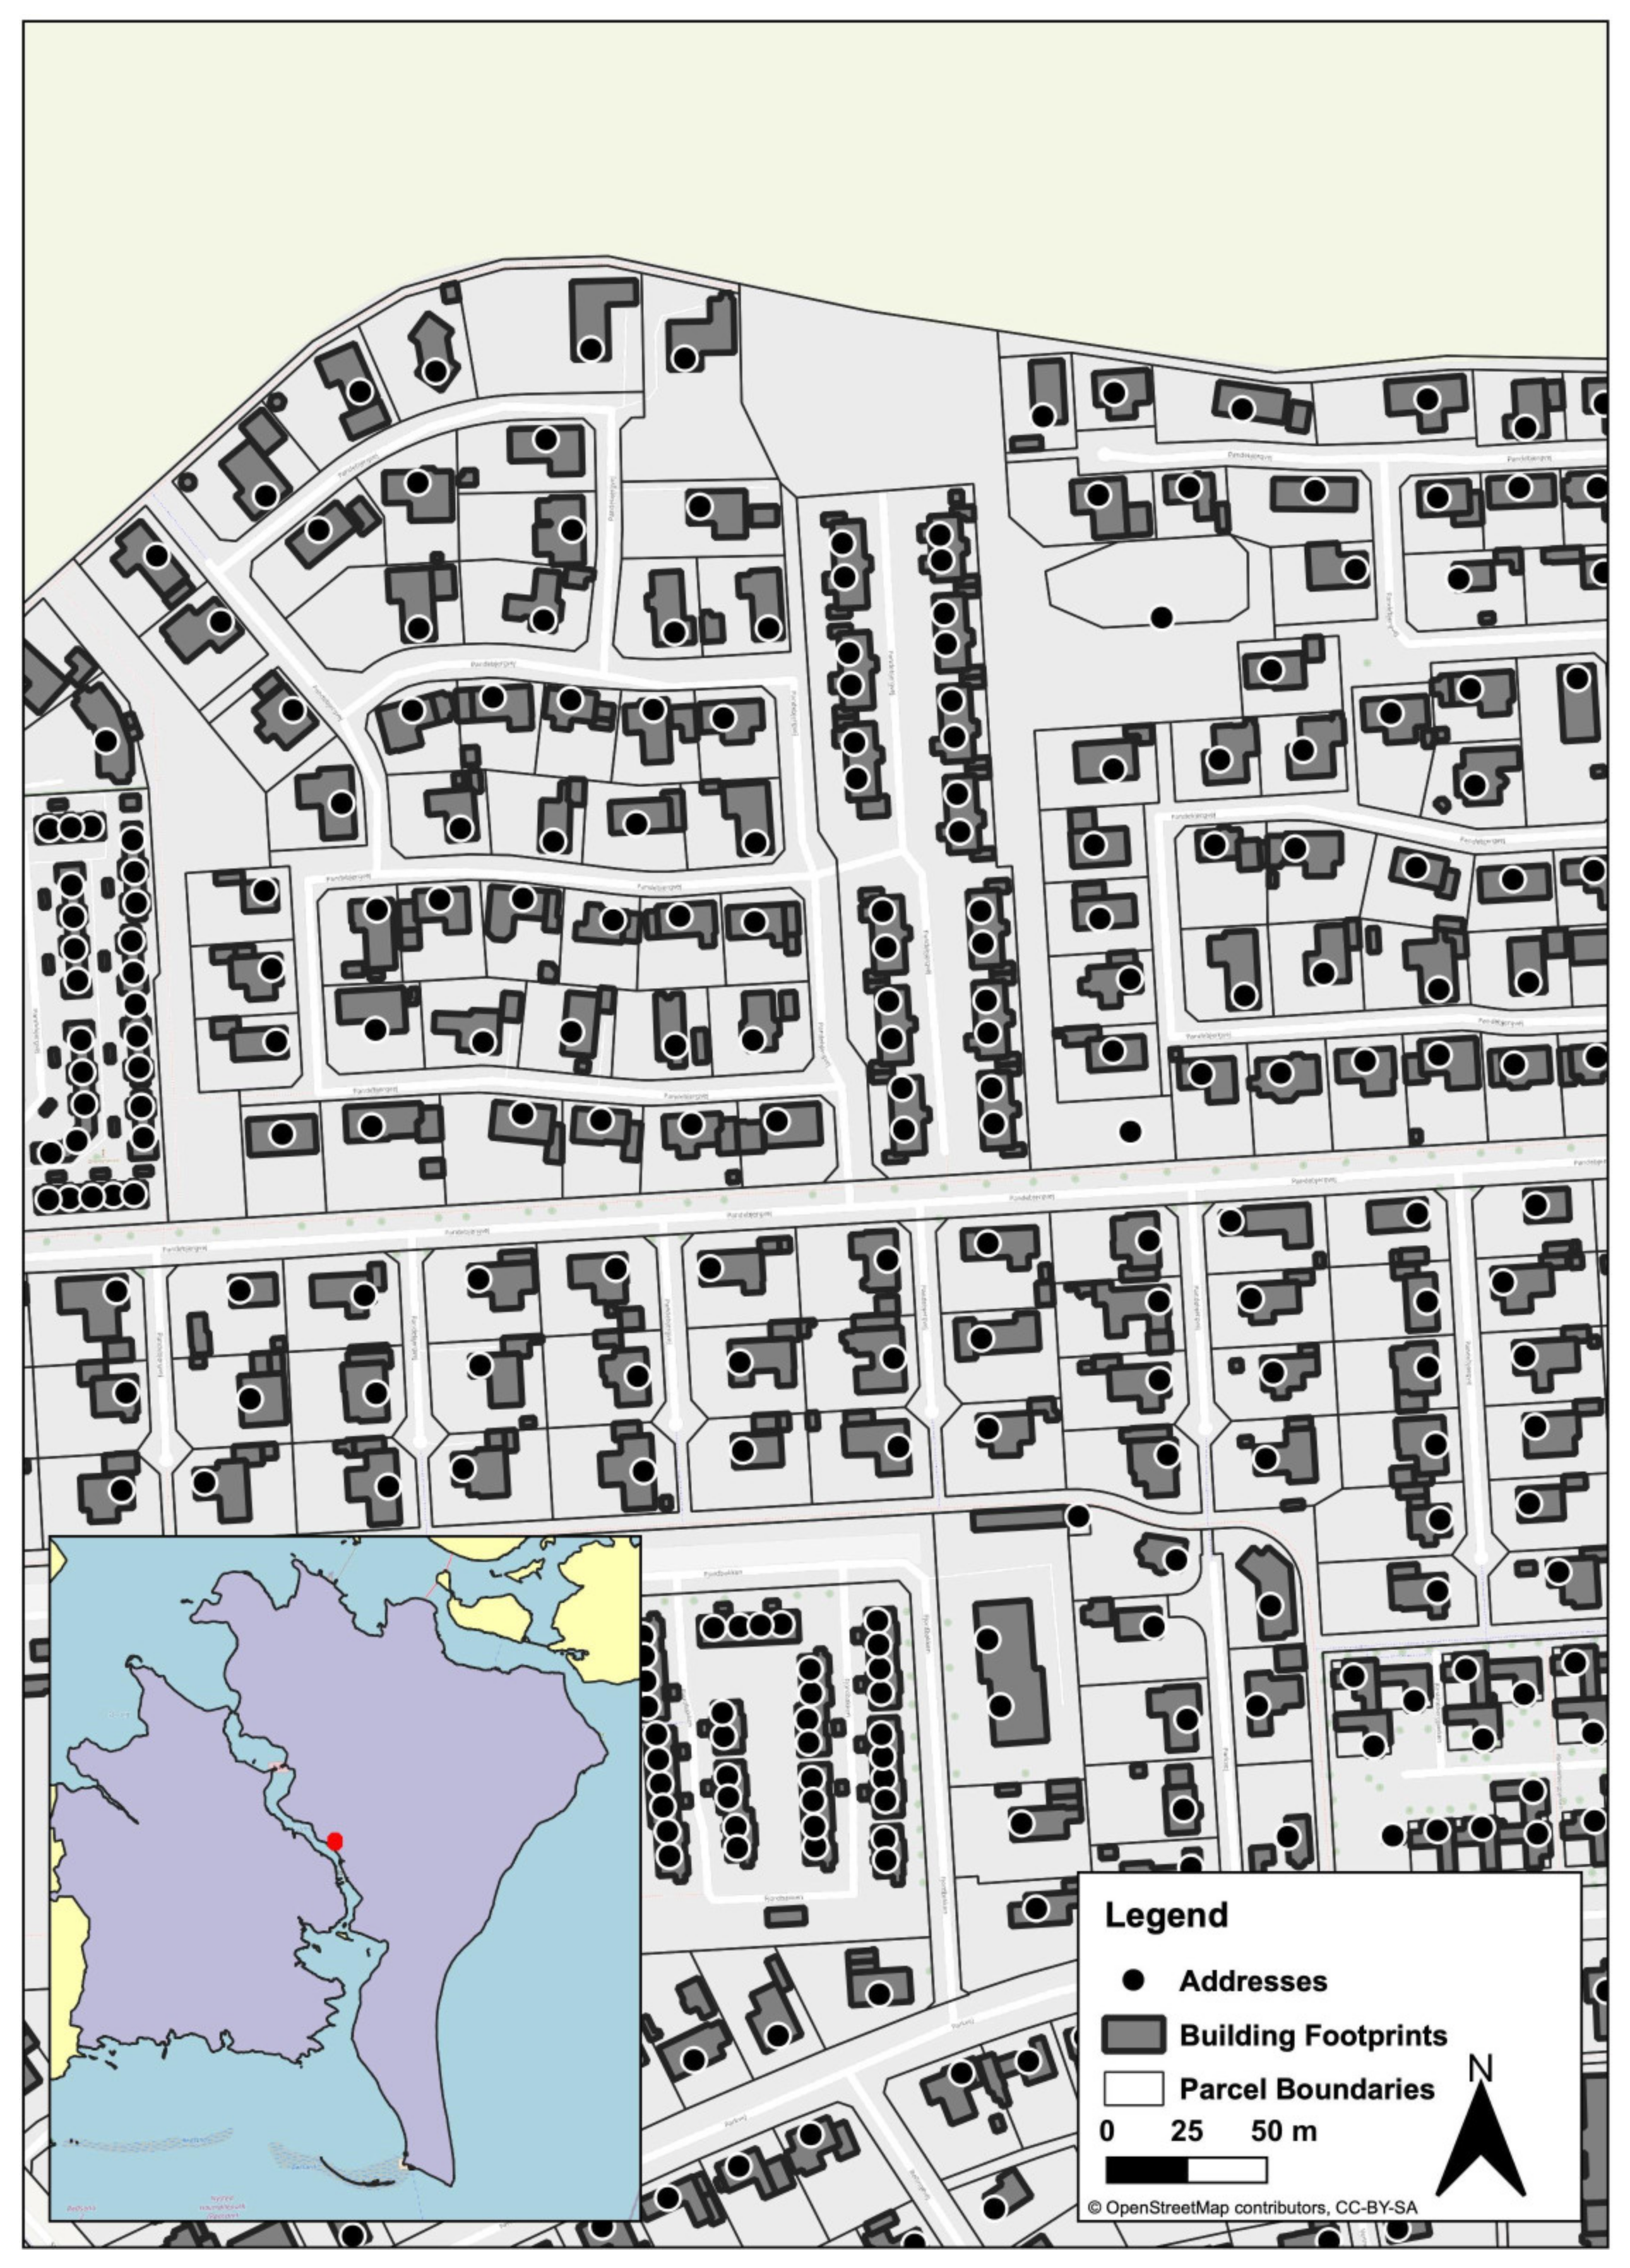
Building data often contained multiple structures per parcel, as can be seen in
Figure 4, increasing difficulty when assigning an average population figure per structure as with multiple structures located on a single property parcel would overestimate the number of individuals per household that are impacted in an SLR scenario. To overcome this issue, address points were used to assign population figures to a building footprint as it was assumed that each single family residential parcel would only have one address point even if the parcel contained multiple structures. These primary structures were then placed in a new dataset to be used for population predictions. Extraneous structures did not have a population assigned to them as to not negatively impact population predictions. Combining building footprints data with address points to aid with population predictions allows for a more representative statistic, as not all address points have a structure (parks, fields, etc.) and not all building footprints have people residing within them.
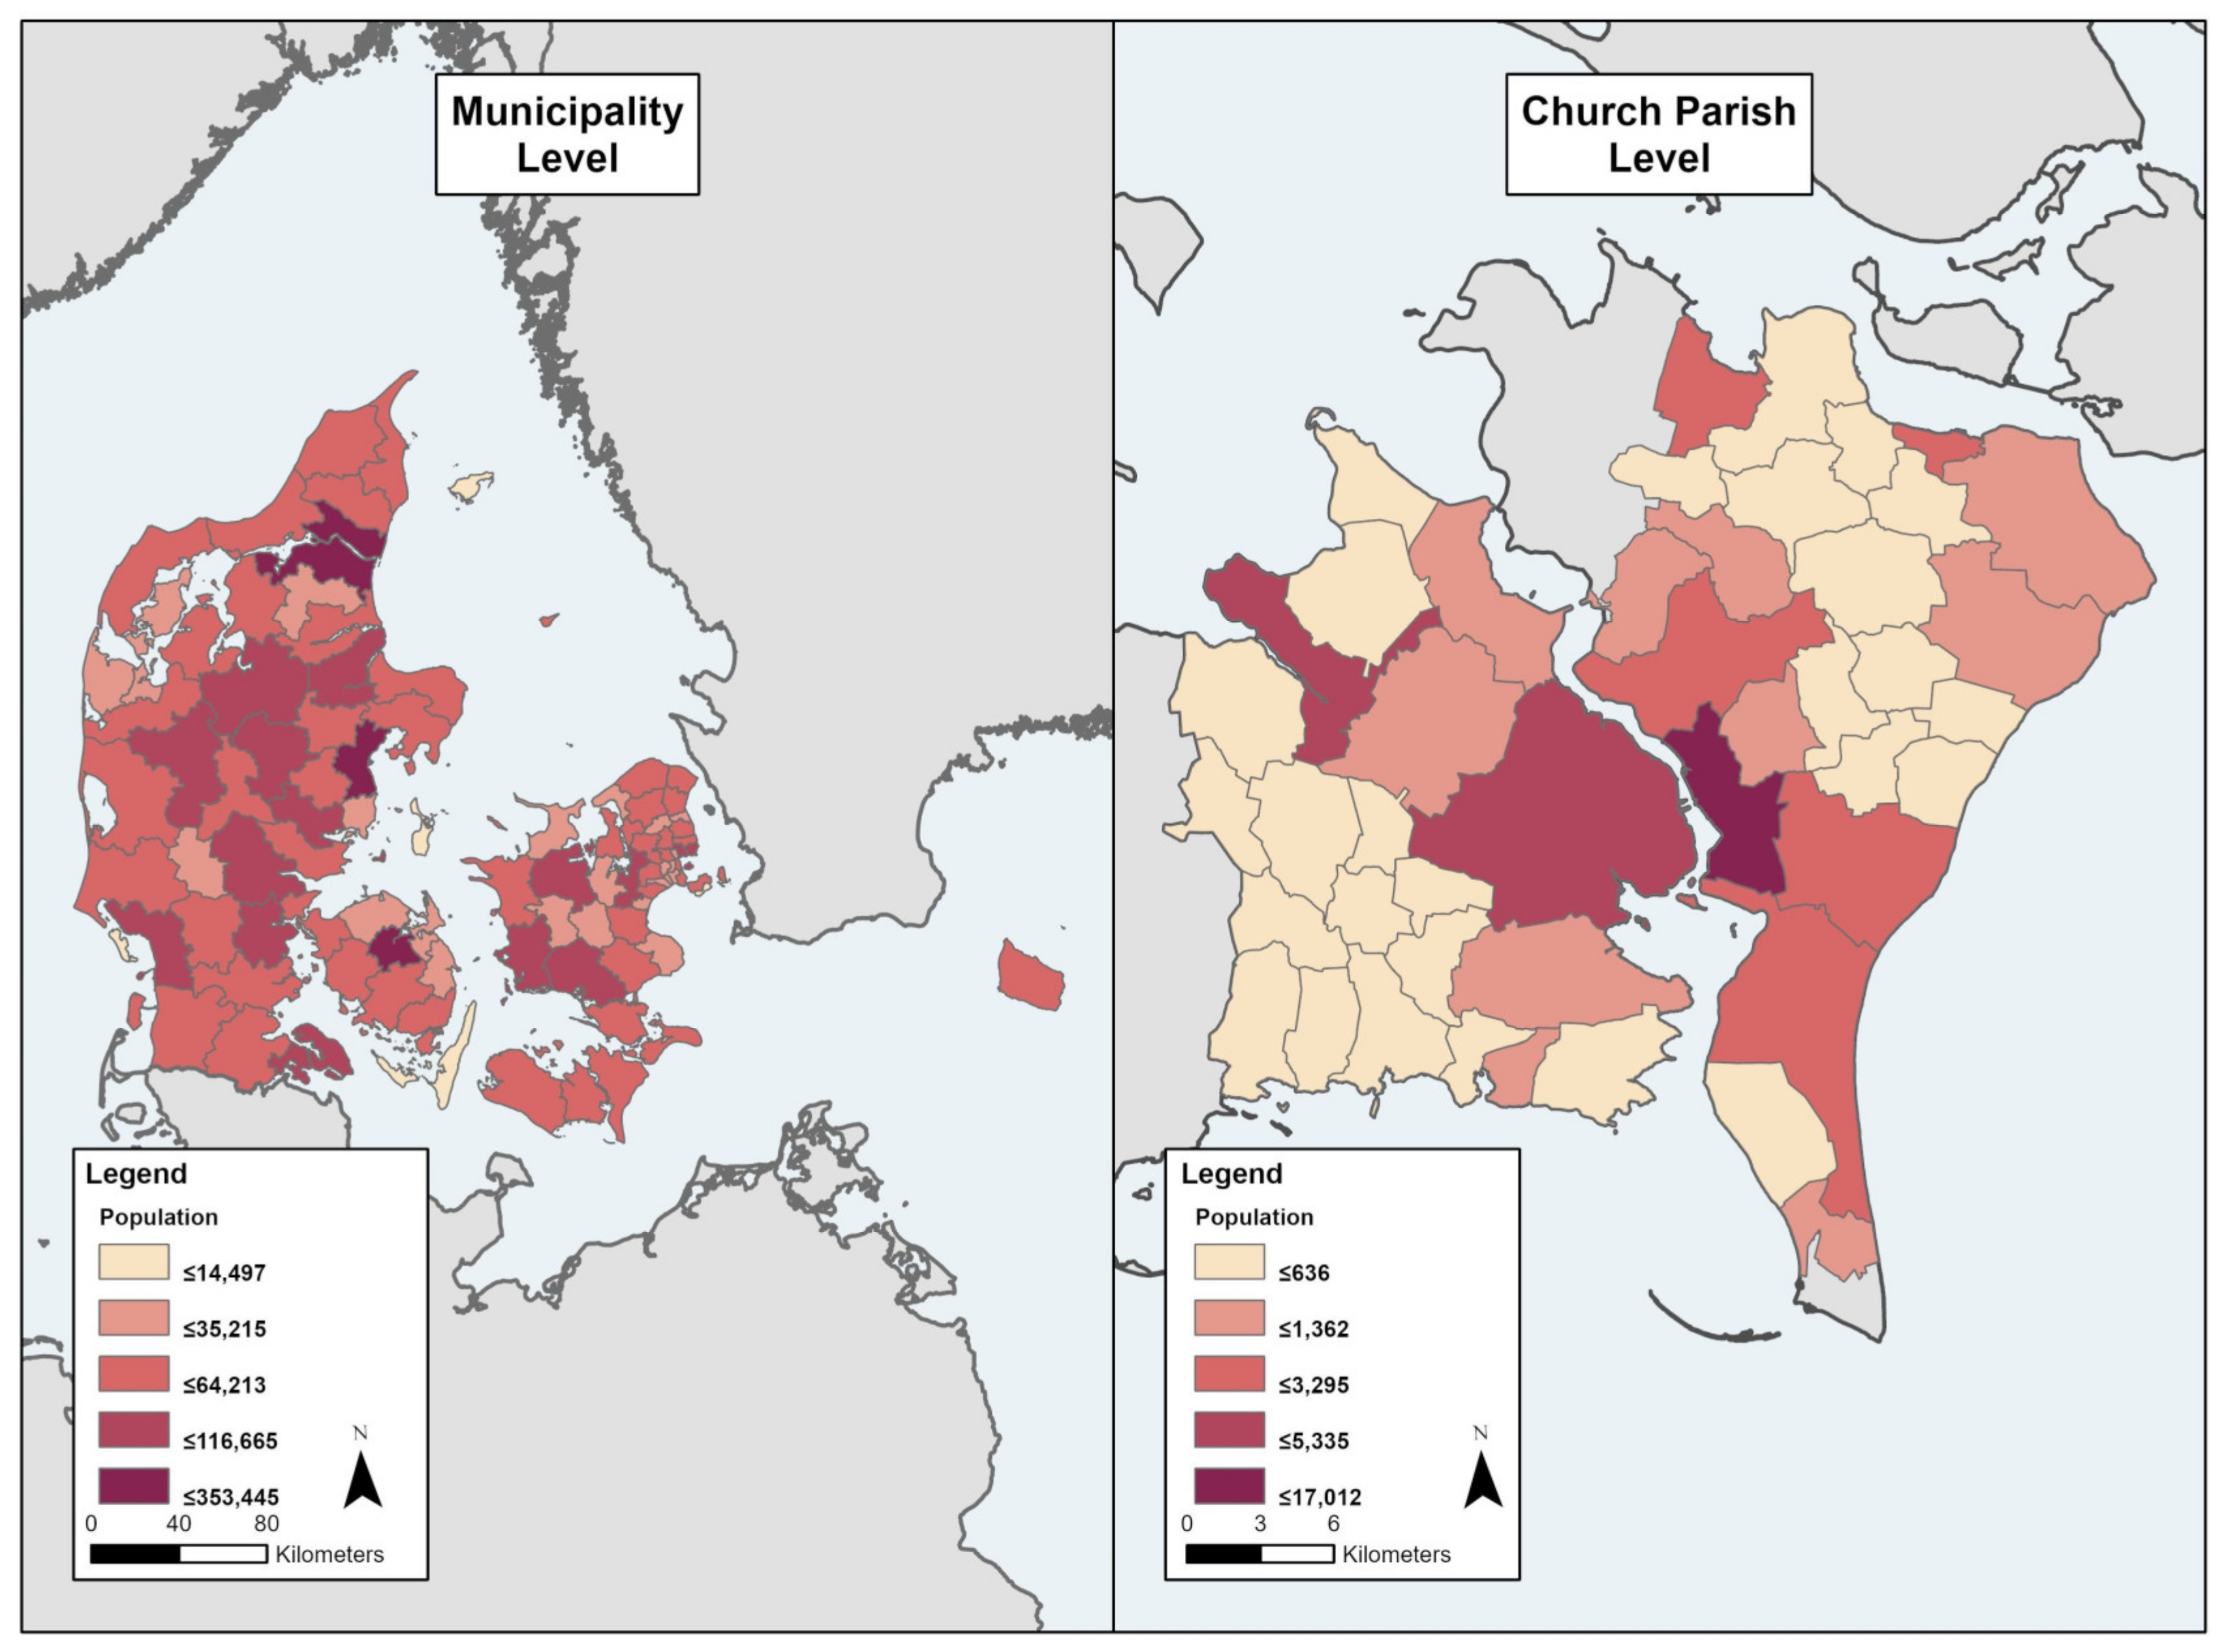
The most granular official population data that is made available and readily accessible for public consumption in Denmark is aggregated up to the level of a “
sogne”, or church parish as seen in
Figure 5. In a church parish, tabular statistics are reported as the population registered and population not registered to the area’s church. These figures were used as the steppingstone to derive building population statistics. Church parish shapefiles were obtained from SDFE and population tables were provided by DST using the ‘SOGN10—Population by Parish’ table [
11]. This table was then spatially joined to their corresponding parish polygons to be used in assigned population per address point later on. Data in such a coarse resolution would not allow for the accurate calculation of potential impacted population. However, in the case of our study, being able to obtain more granular data allows the stakeholders to visualize how their respective areas will be impacted, and the formulation and design of more focused measures to counteract and combat the effects of SLR.
It is important to note that the estimated population is based on current data (as of November 2020) and not future projections. Future projections are available in coarse (1 km) resolution raster datasets and are therefore not suitable for detailed population estimates. Current data were used due to the granularity of available datasets.
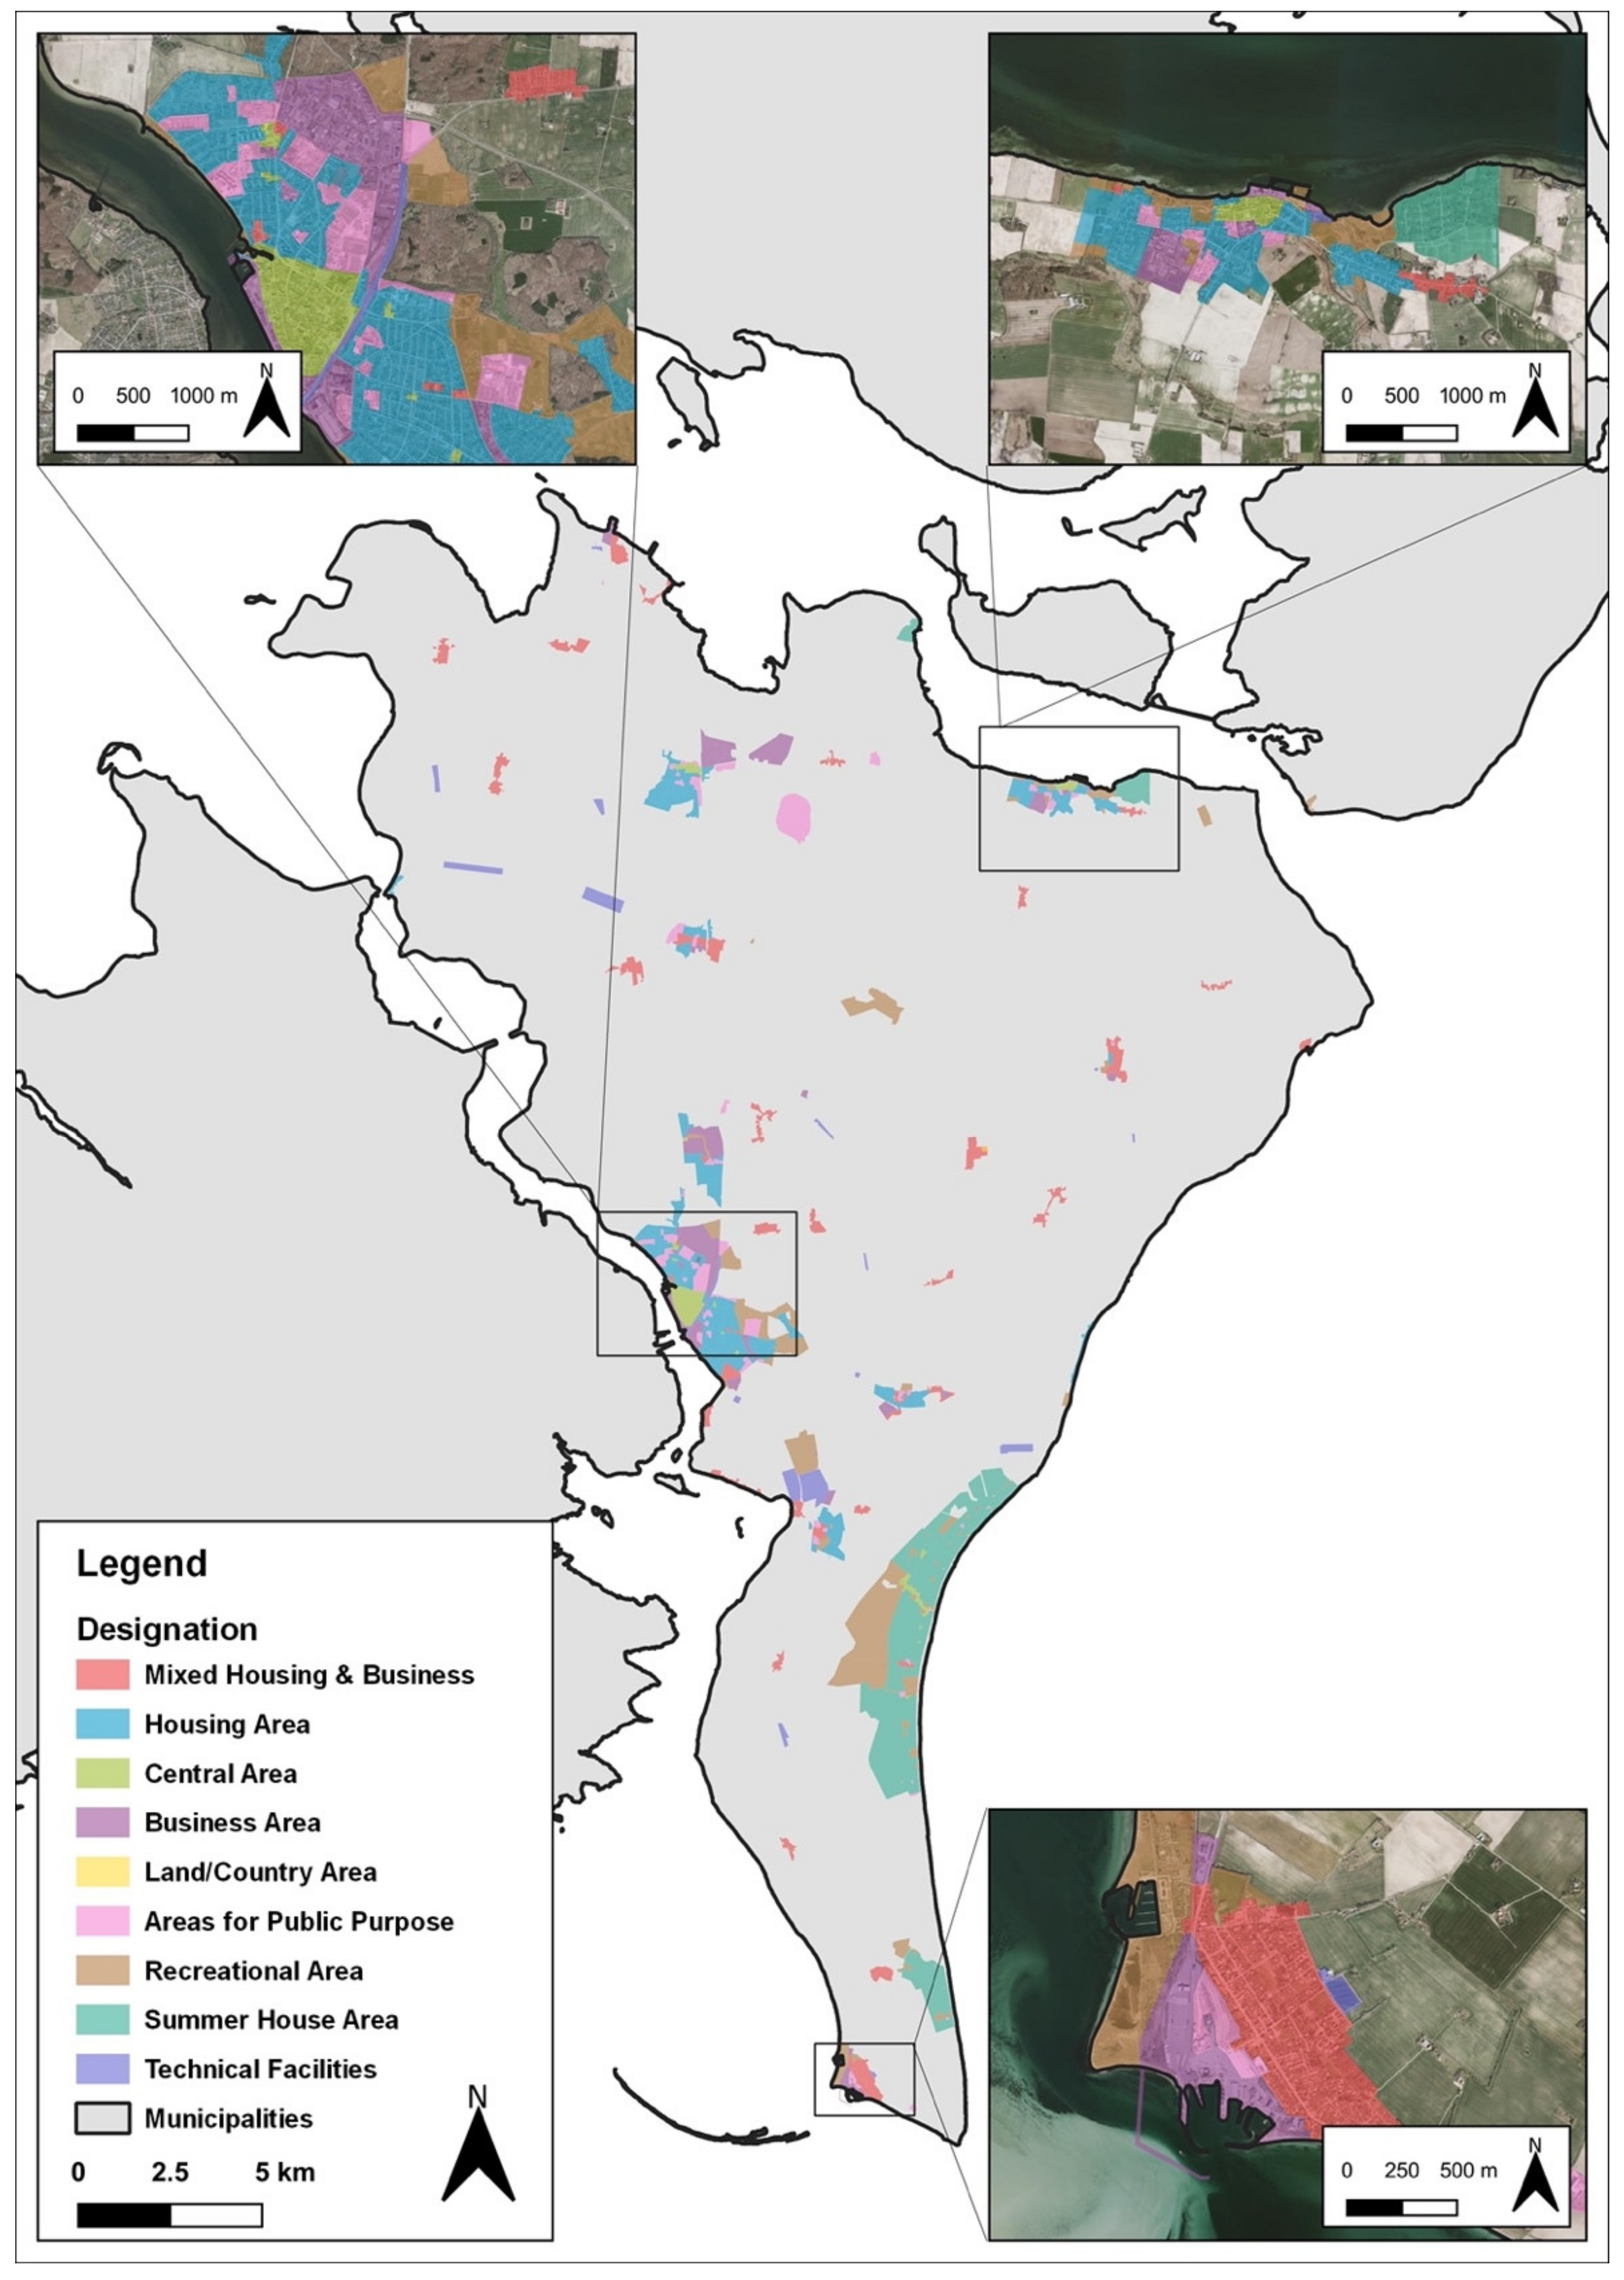
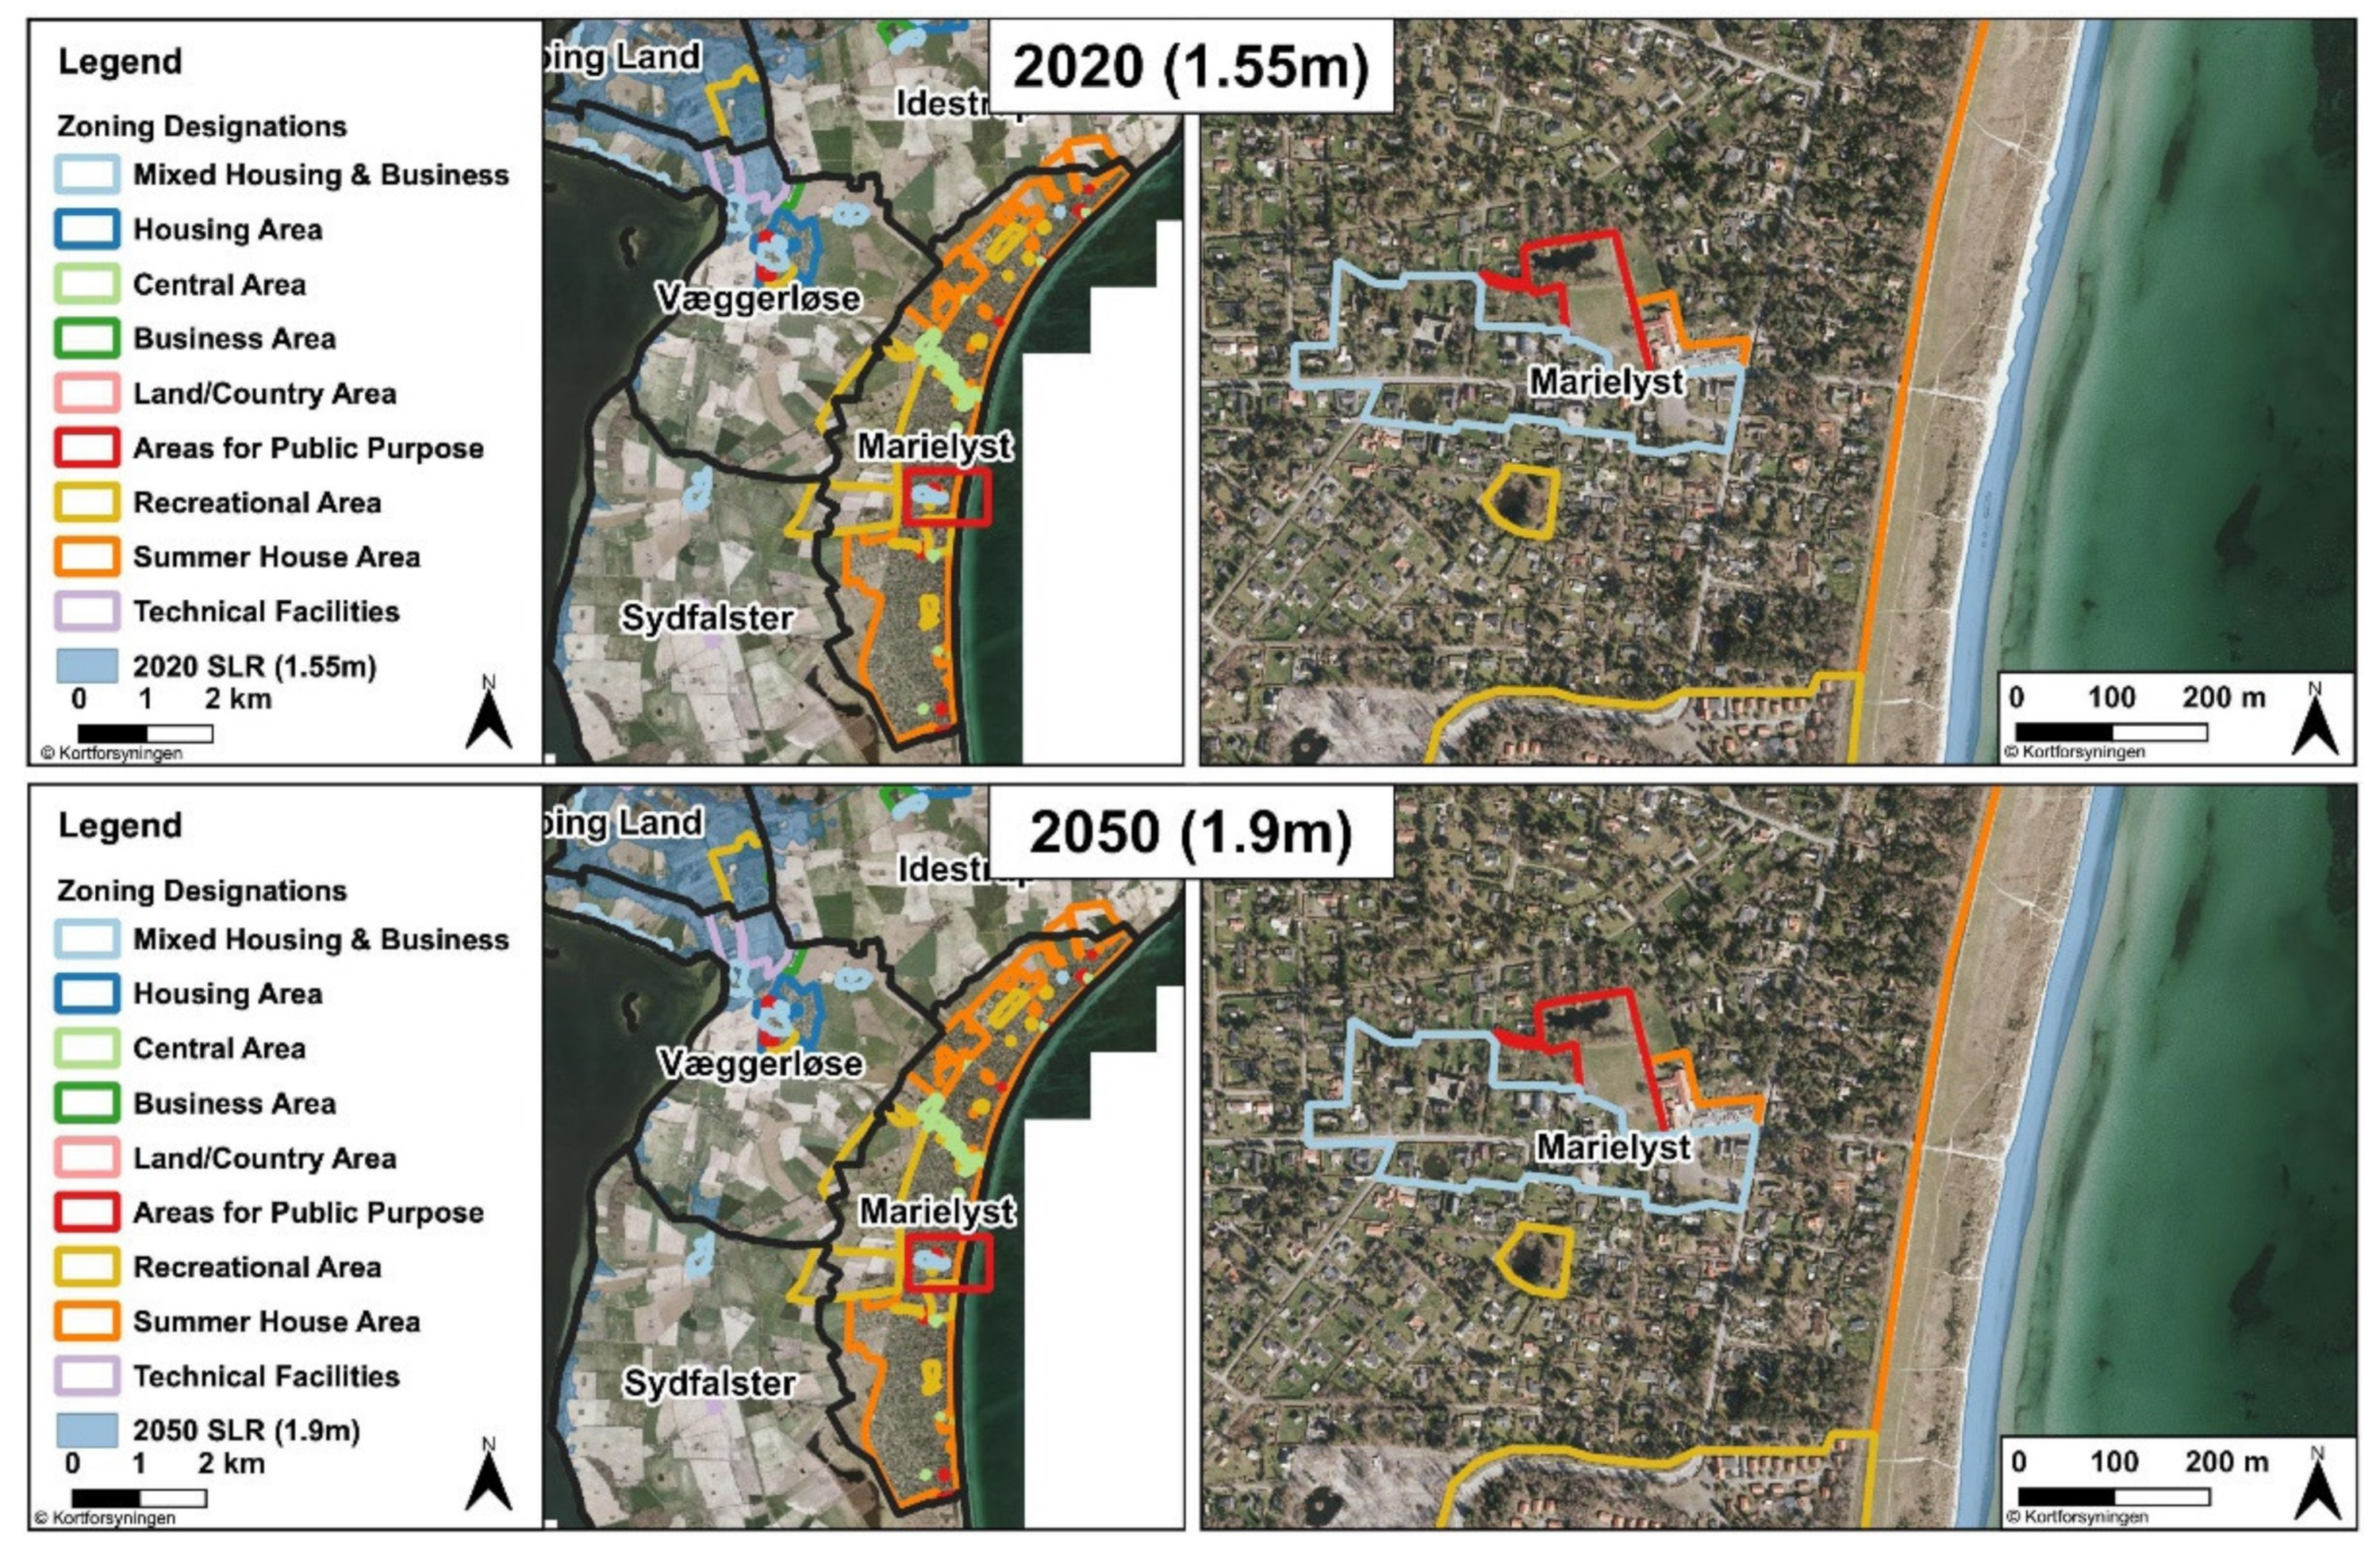
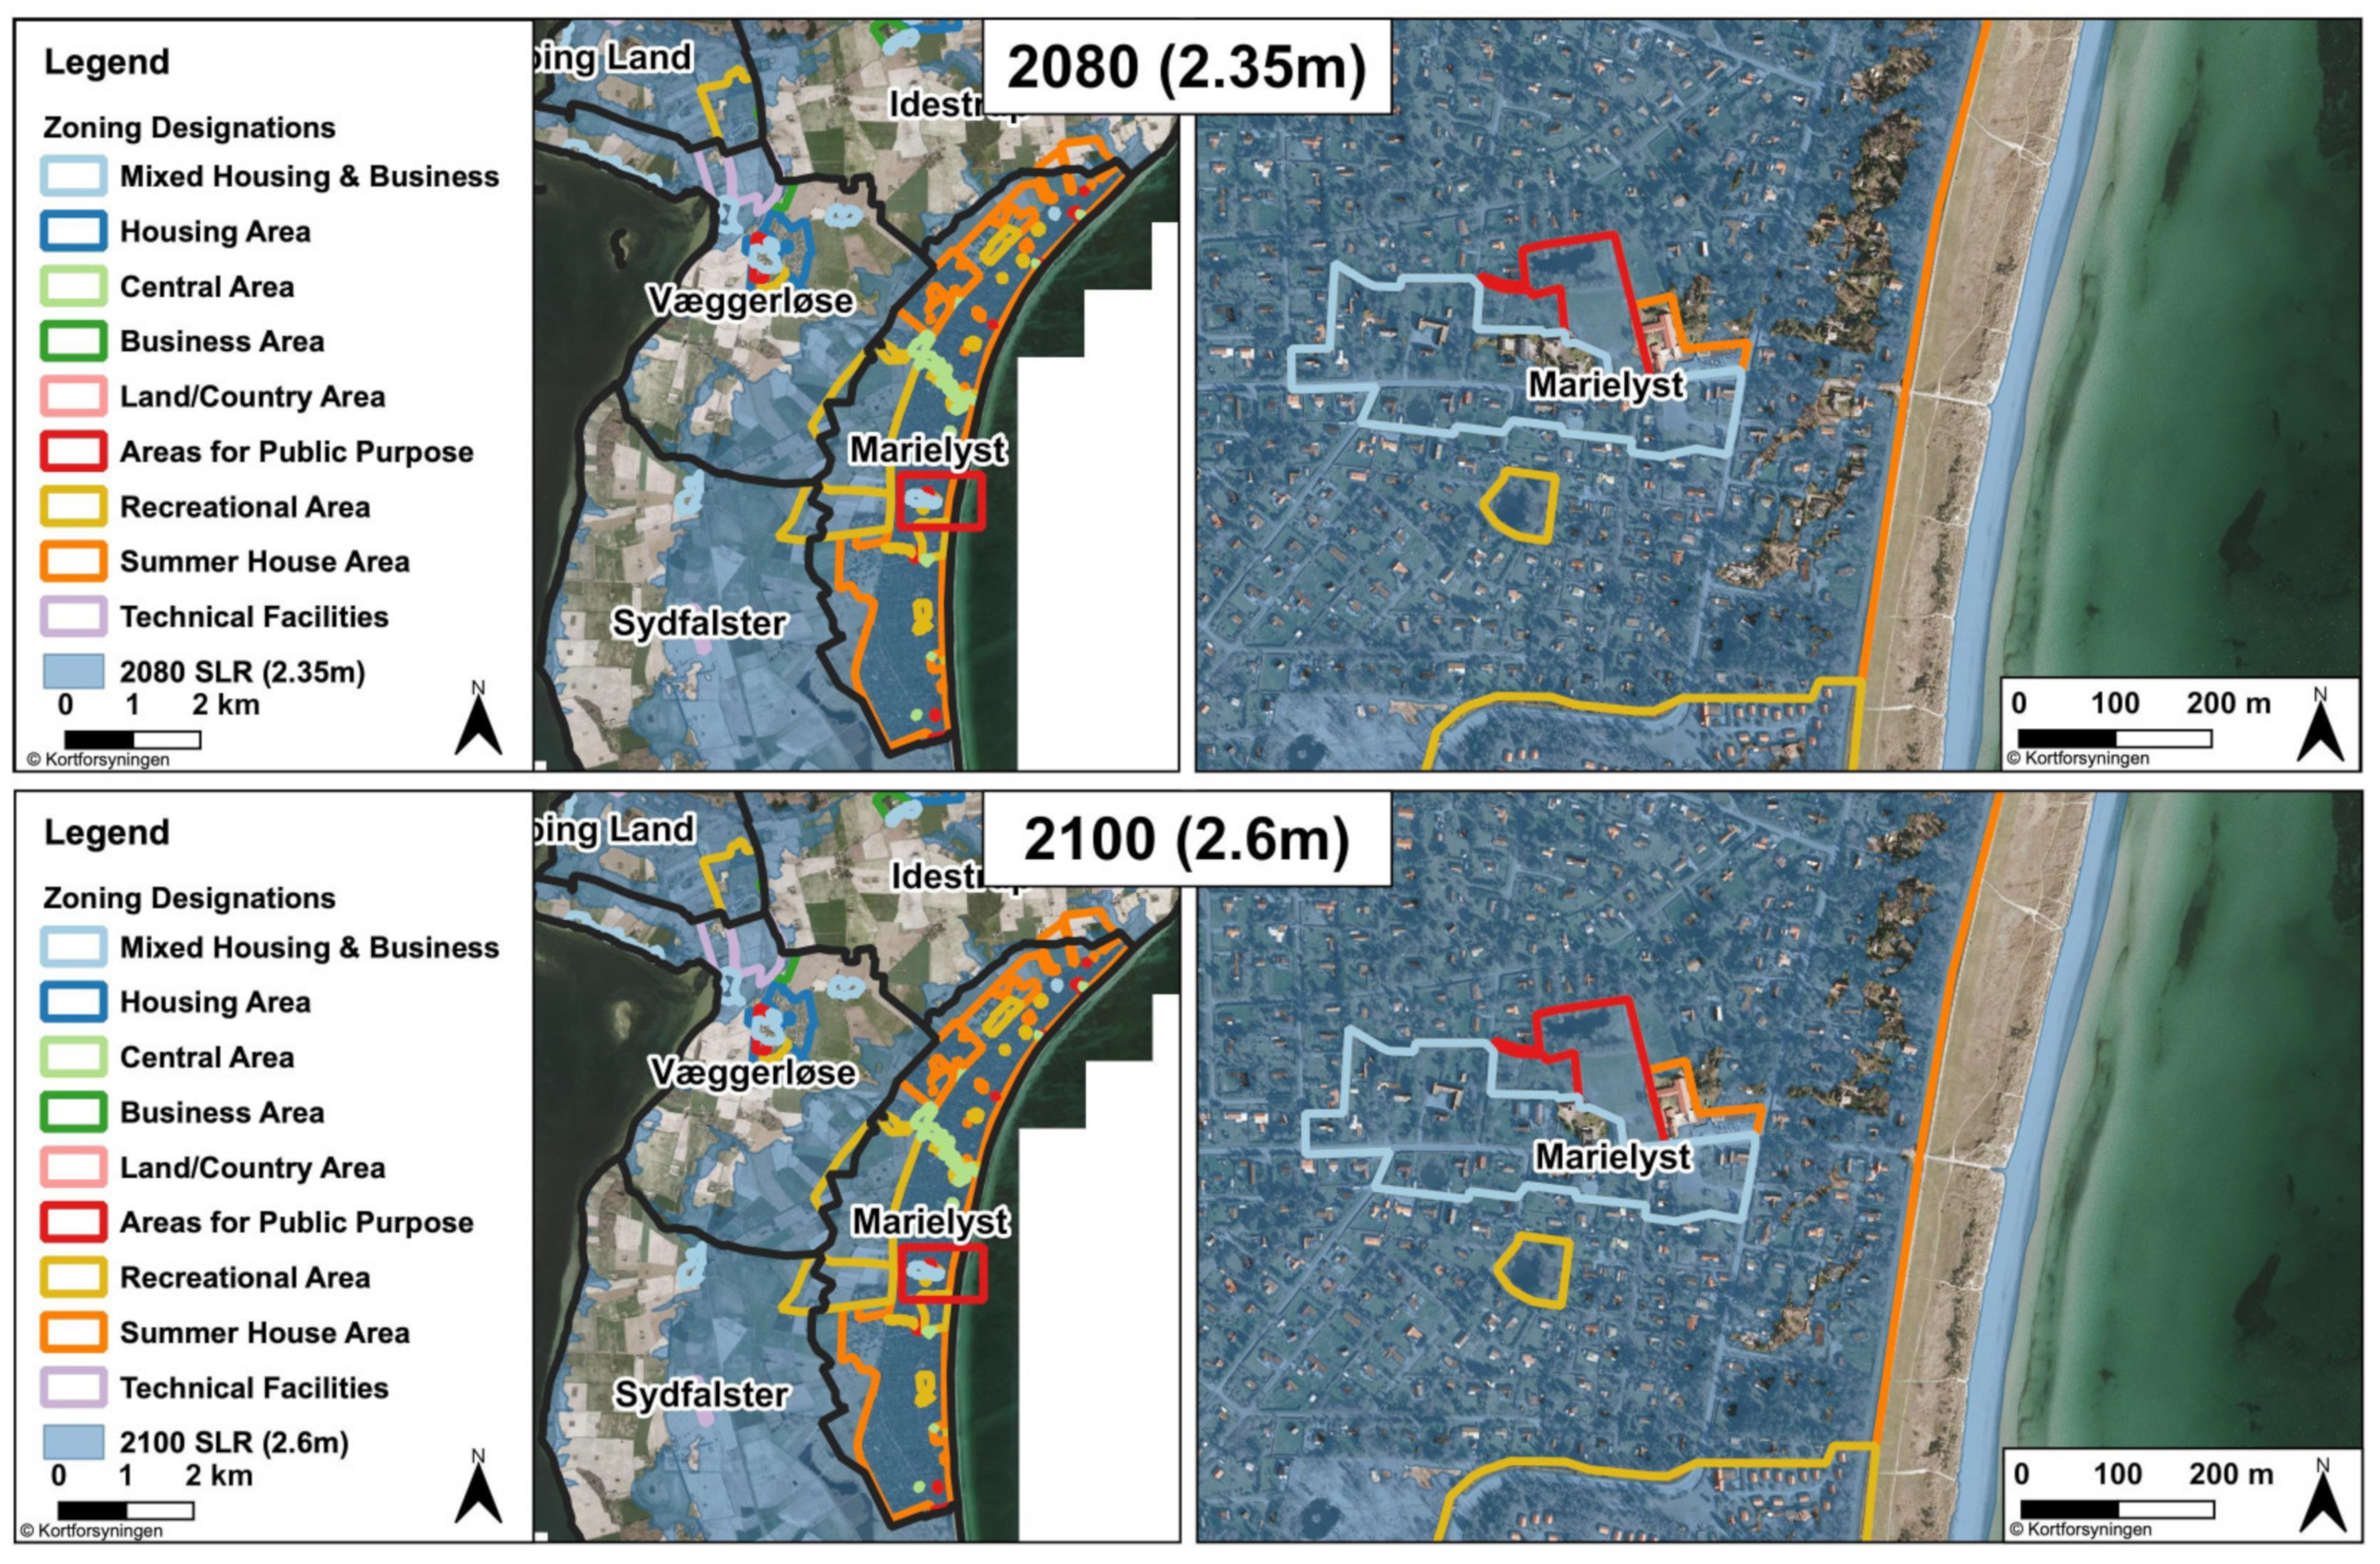
Planning data are download via SDFE in the form of polygons stored in a shapefile. Such plans are made by each municipality to designate which areas of land are allowed to have certain types of structures or land uses associated with them, such as residential or industrial, for example. This dataset is labeled as “Kommuneplanrammer alle Vedtaget”, or Municipal Planning Framework, has been adopted by the municipality as seen in
Figure 6.
This municipal framework details areas (represented as polygons within a shapefile) of the island, and what their intended and current purpose is in regards to land use that relate to national planning directives [
12]. This data were used in order to determine which buildings and address points intersected with planning areas that were deemed as non-residential uses. Zoning areas that were designated as business areas, areas for public purposes, technical facilities, runways, basins, graveyards, and recreational areas were assumed to be daytime structures and therefore structures that were located within these areas were not included in population estimates. This is critical in the process of estimating impacted population so that address and buildings that are not residential do not have an estimated population value assigned to them which would result in unreliable estimates for the island. Current municipal framework and zoning data were used for this study. Future zoning can be incorporated into such an analysis to provide a more accurate estimation of future SLR impacts. However, such dynamic data can easily complicate predictions and make analysis troublesome compared to using current data.
The Guldborgsund municipal framework also details areas of residential usage into types of residential usage; specifically, whether it is a summer cottage region or not. Such classification can allow us to identify the types of structures in a region, and therefore determine which industries may be hit hardest during an SLR event. On Falster, this can prove to be crucial as much of the economy income is dependent upon tourism with 714,000 overnight stays on the island, accounting for 40% of the region of Zealand’s overnight stays, for 2019 [
13]. Being informed of how many summer cottages that may be wiped-out or impacted by rising sea water will provide stakeholders with an idea of how their island’s economy, and thus the residents and infrastructure, will be affected in such a scenario. Being able to delineate land use areas, and structure types is critical to inform what is at stake in the area.
With residential addresses located, these points were further reduced into two groups; Permanent Residential and Non-Permanent Residential. Permanent residential structures are structures where individuals reside on a full-time basis. These address points were located in zoning areas labeled as; residential areas, nursing homes, villages, or city centers, with their associated building footprint falling into the same scheme. There is room for error to be introduced into estimations as villages and city centers do not consist solely of residential address points, but were not excluded as they do contain residential structures. Non-Permanent areas were located in zoning regions defined as summer cottage areas as mentioned above. With estimations broken down into these two categories, stakeholders will have a better image of the at-risk populations and the potential long-term impacts such as the economic repercussions of the loss or reduction of a key industry and its ancillary services.
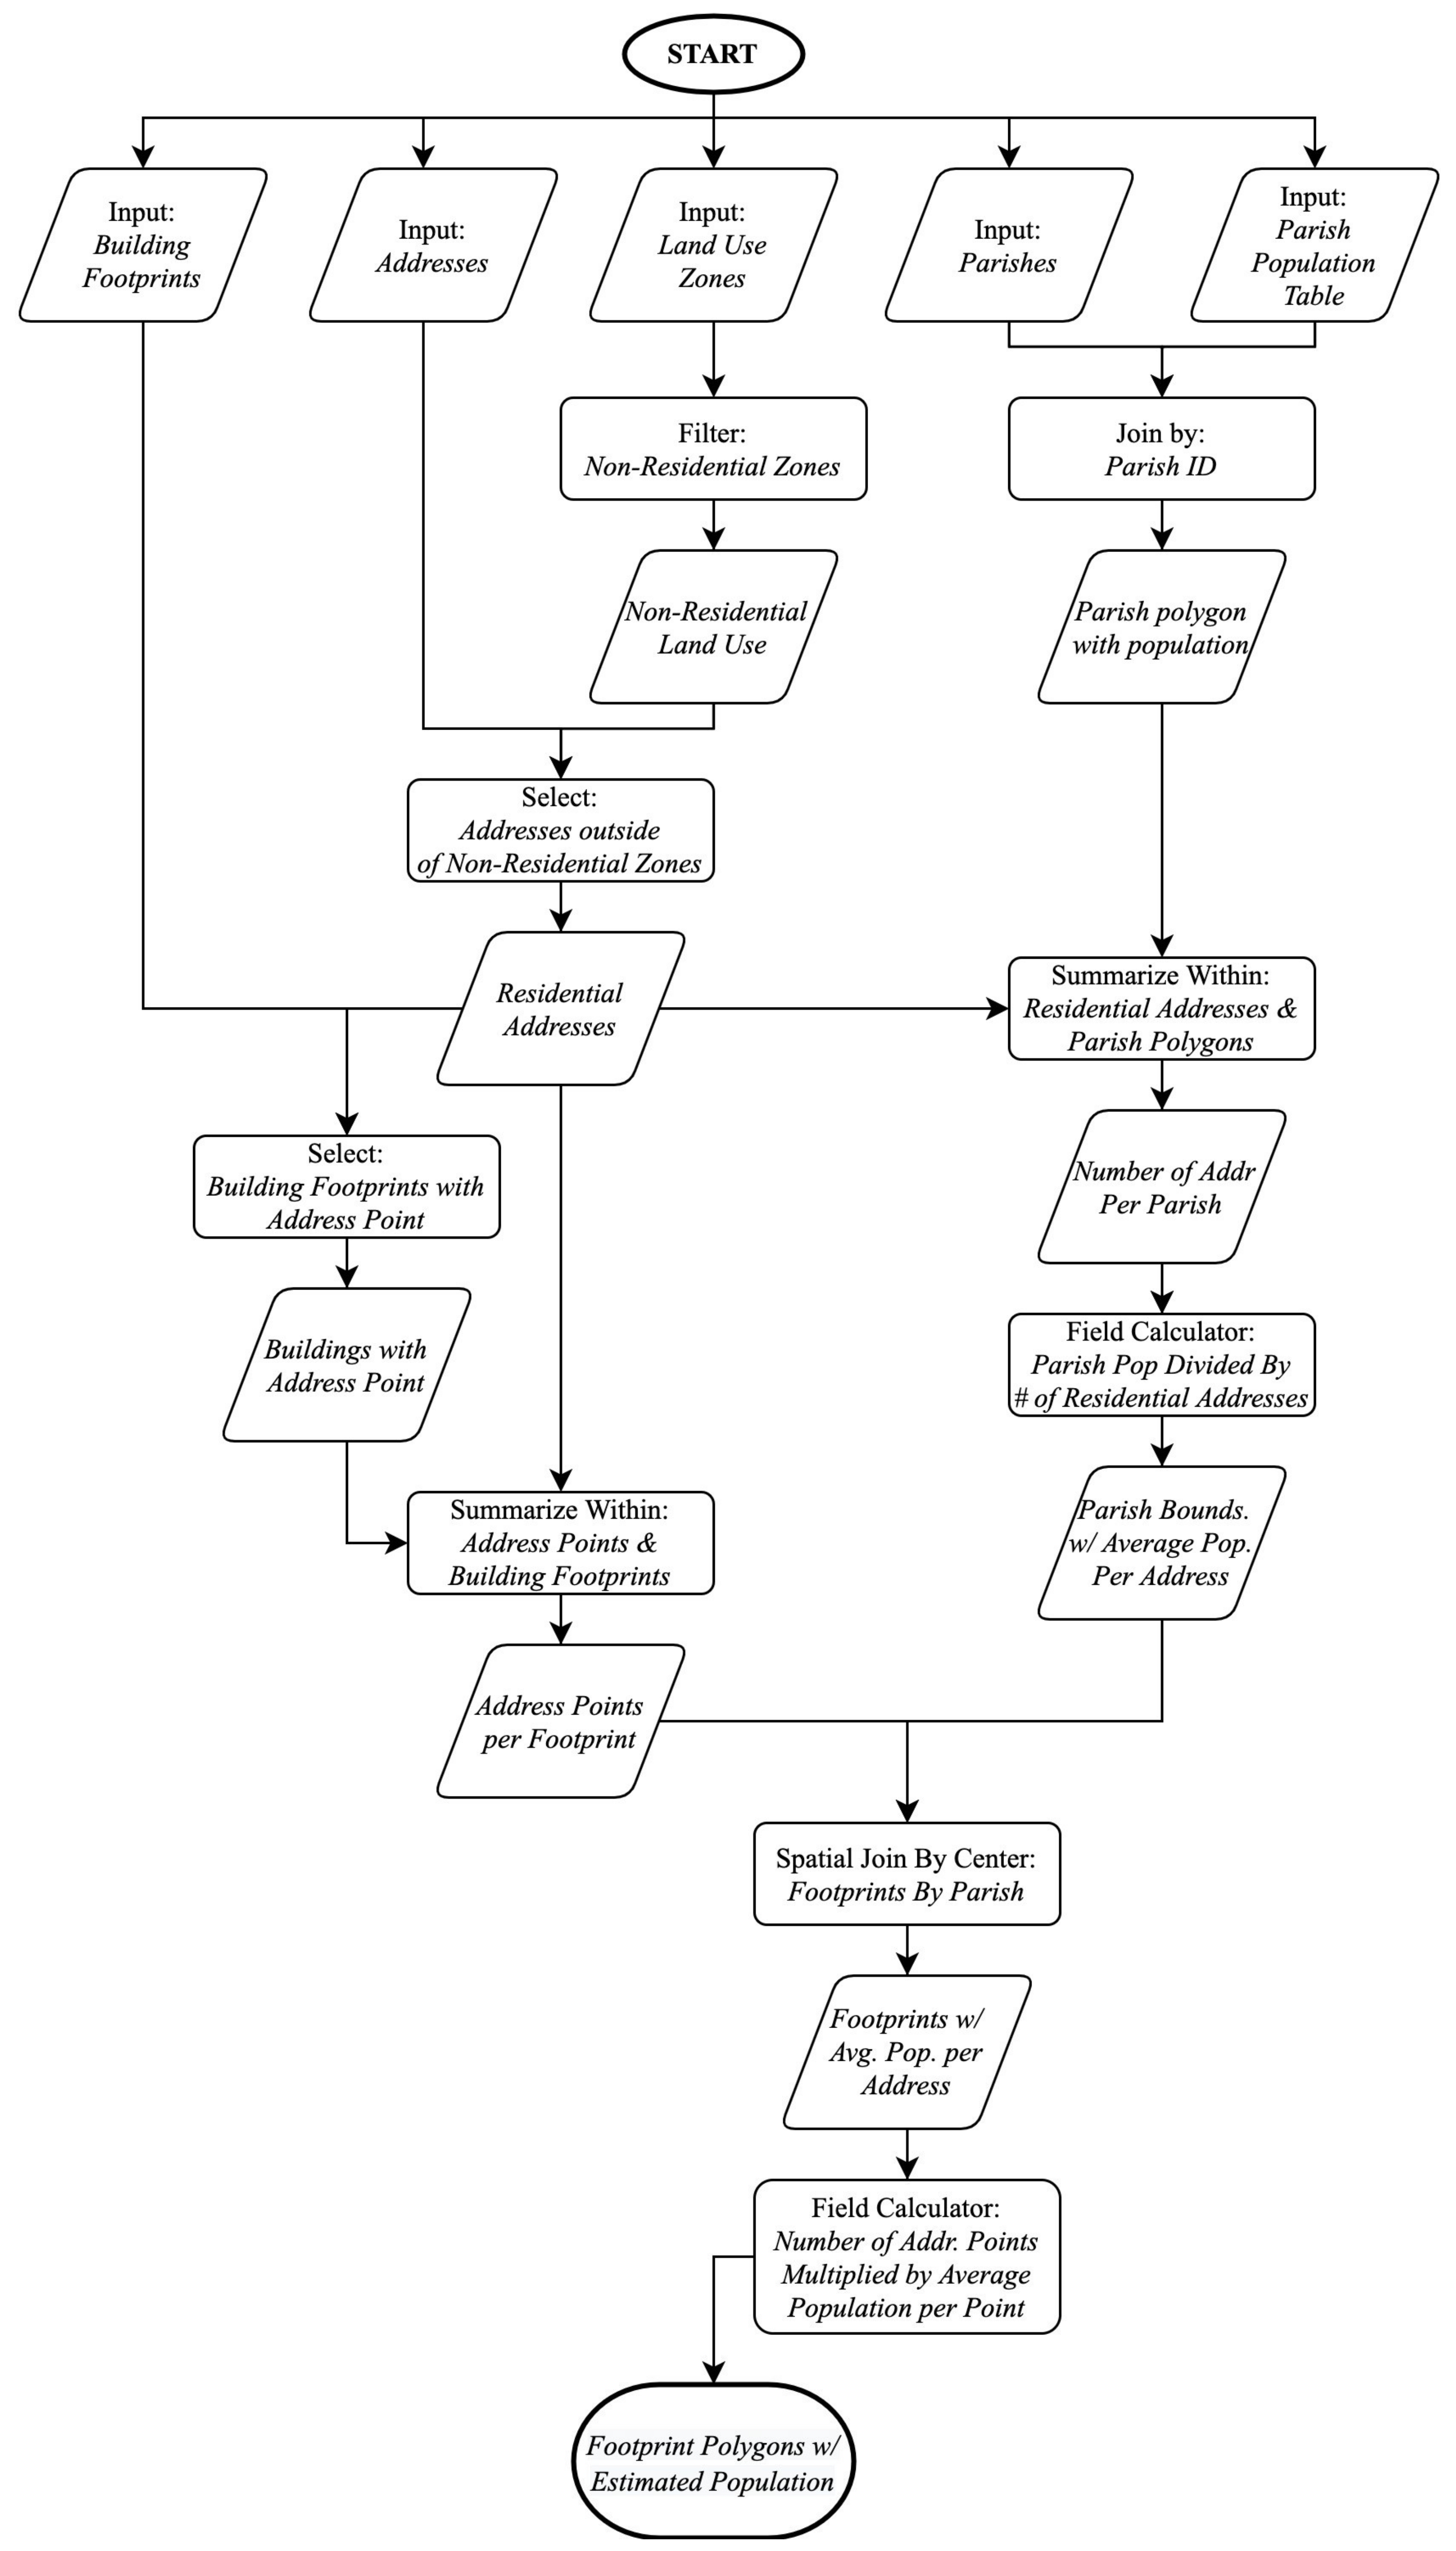
In many cases, there were also structures that contained multiple address points per building footprint, such as apartment buildings that have multiple families within one footprint. Building footprints were defined as the extent of the building based on their outer walls, provided in the form of polygons from BBR. To compensate for this, an average population was derived for each address point within a parish and then assigning the sum of the population points to their respective building footprint. Deriving an average population from building footprints alone would lead to apartment buildings being underrepresented if they were impacted in an SLR scenario. The process of deriving population estimates can be seen in
Figure 7.
When using the entire building polygon instead of relying solely upon an address point, this ensures that properties that are expected to be impacted are included as their real-world areal footprint is taken into consideration in this spatial event. Address points only represent a single point of such a structure, and therefore are potentially excluding many properties that lie along the edge of SLR scenario areas and do not come into contact with rising waters. The added detail of building polygons is critical when predicting the impact of SLR as well as including the potential population that is at risk of each scenario and informing stakeholders of the potential outcomes and significance of future SLR events.
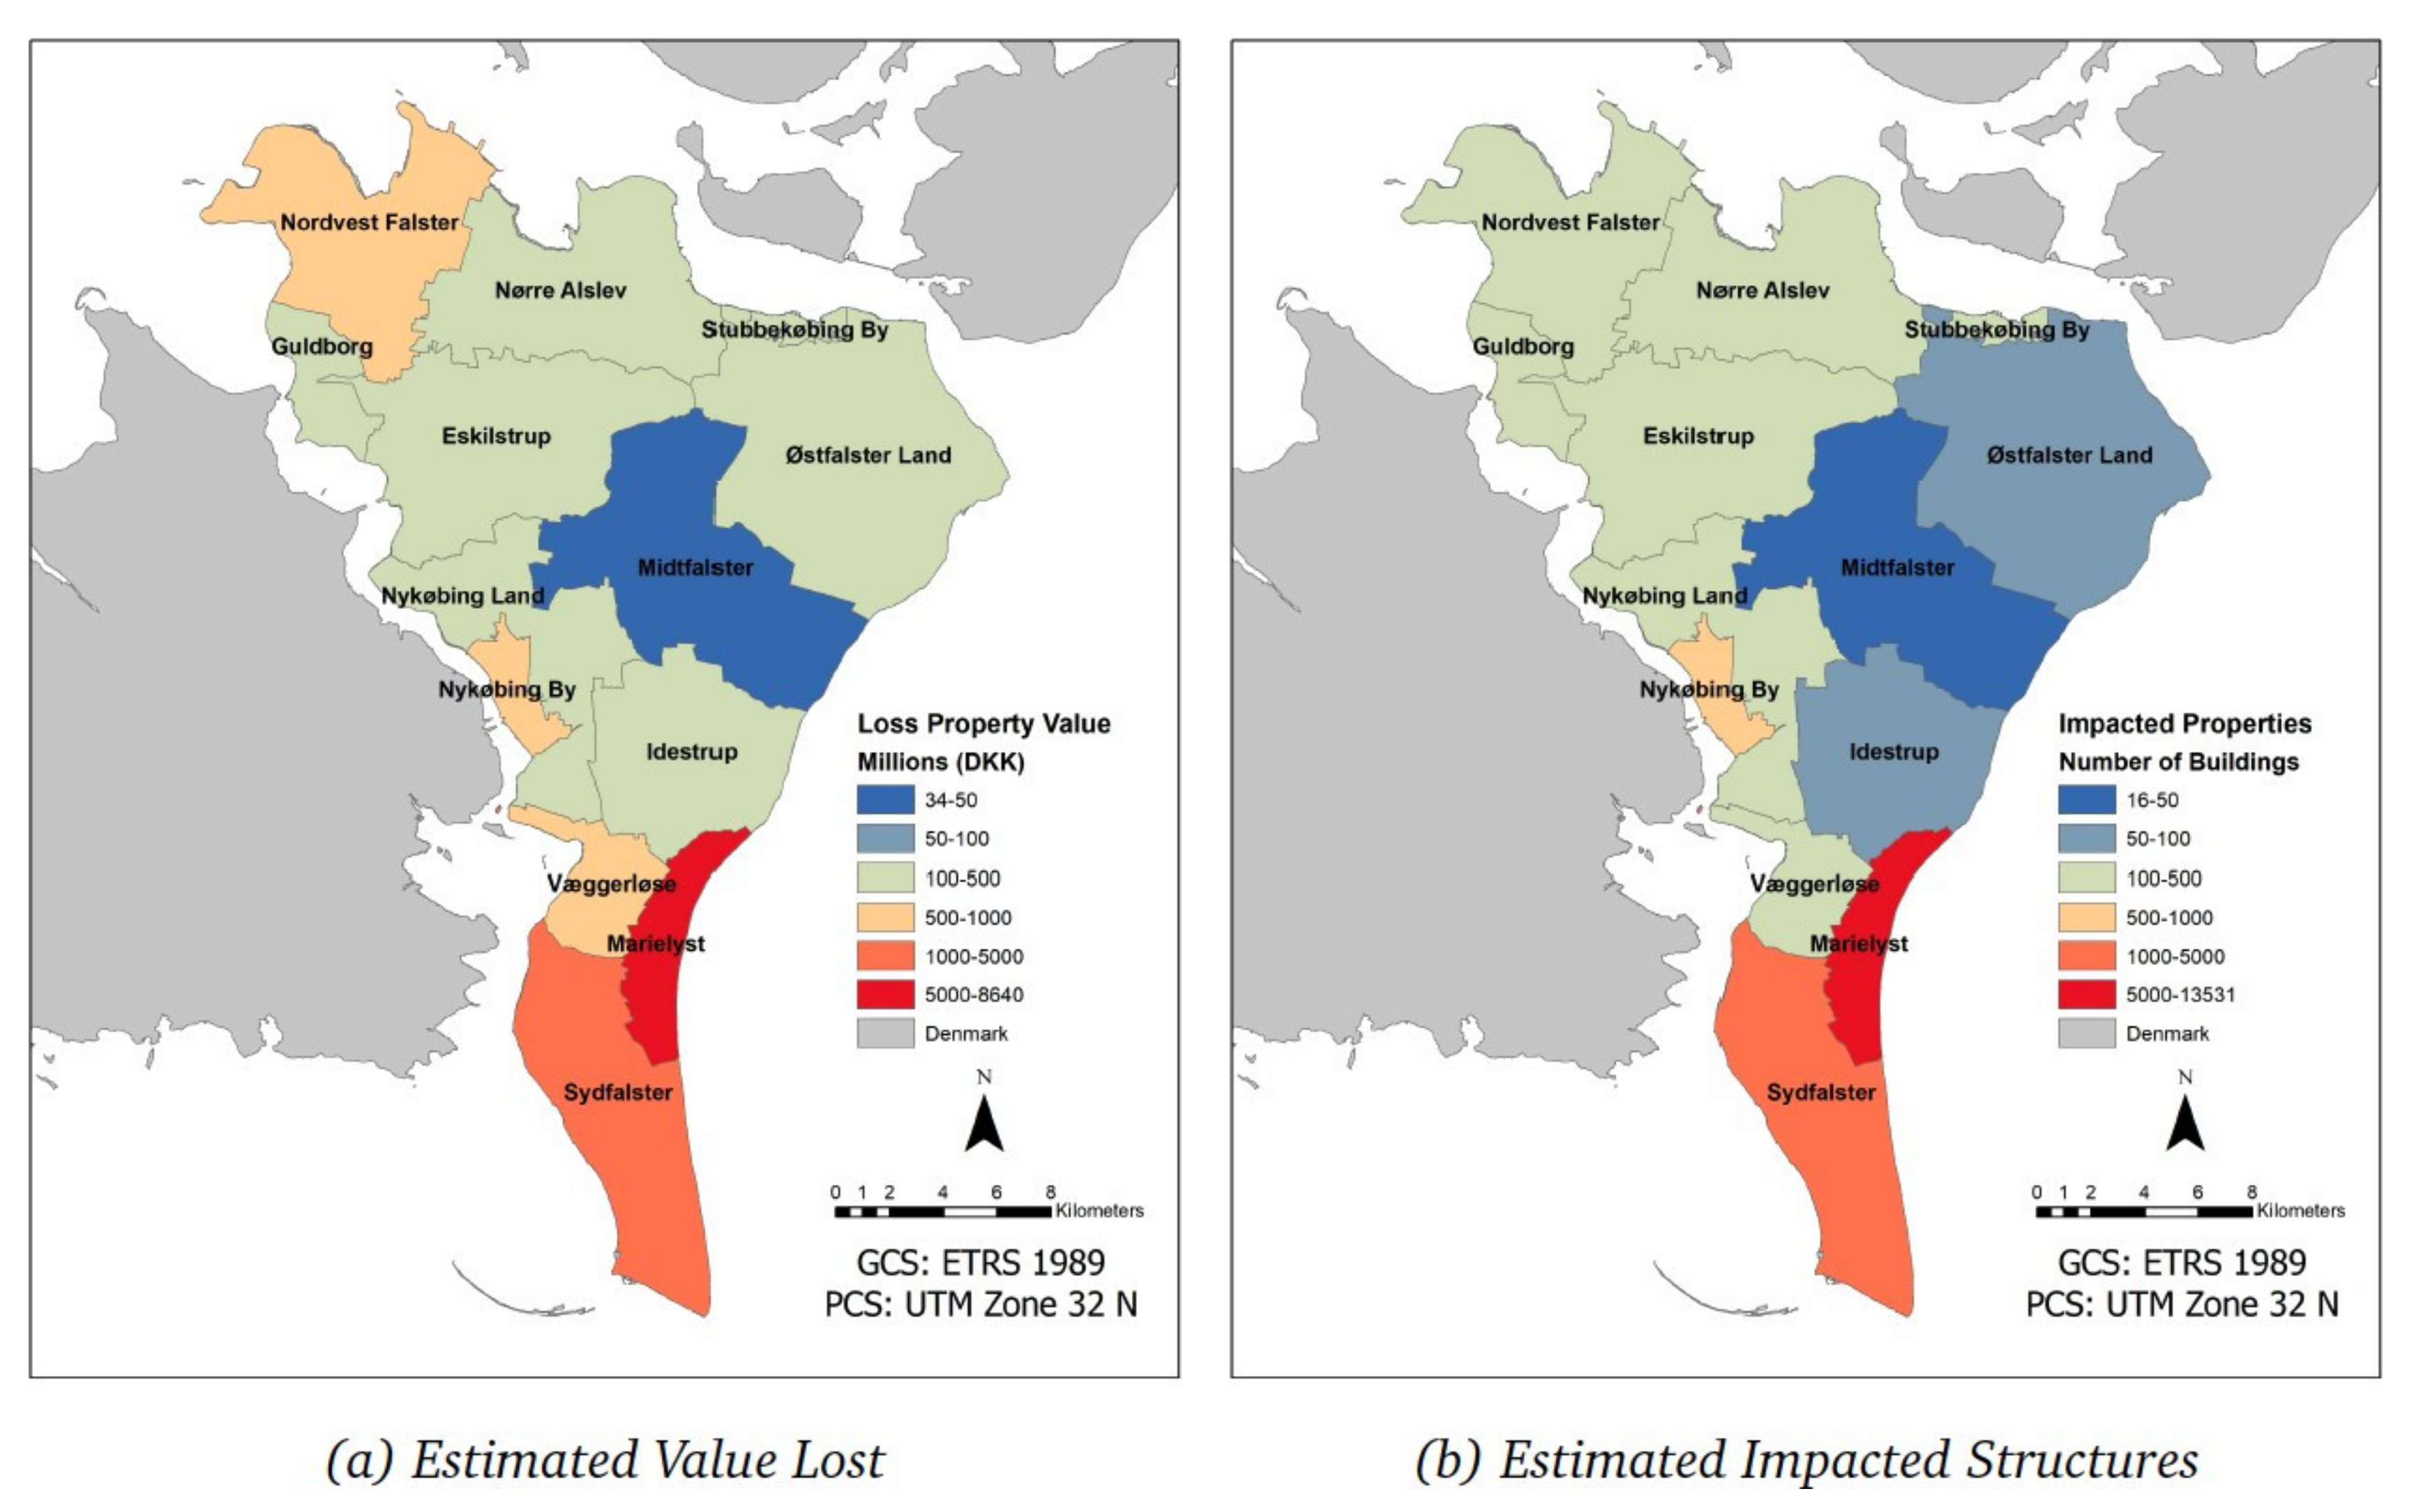
Parcels, or “jordstykke” as referred to in the Danish cadastral system, were provided by SDFE in the form of polygons for the entire nation. Parcels in this study are defined as a piece of land with an associated residence, or a farm with its associated fields, or a woodland property [
14]. These plots were used to determine estimated costs of property loss in the cases of SLR when an average property value for the municipality was applied to the plots. Plots are measured in three different ways with varying levels of spatial accuracy when representing their respective areas in relation to the real world. Boundaries are measured by map, as in conducting areal measurements derived from historical records and data, or georeferencing; whenever construction occurs, a change in property boundaries triggers a need to measure boundaries; or by a requested survey; a property owner wants to confirm their property size for resale or tax purposes [
15]. Due to the historic nature of some parcels, particularly within city centers, there is some error introduced when measuring area of parcels. This has the potential to affect spatial analysis and alter the statistics generated from such analysis.
Property value estimations are provided by DST in the form of tabular data rep-resenting the average market value of real estate in each municipality for each year in the “
EJDFOE1” dataset [
16]. This average is then spatially joined to property parcels so that they have a spatial representation. The number of parcels that intersected with each SLR scenario shapefile then provides us with an estimated value of property loss due to rising water levels based on the average price for the municipality.
Land cover data were downloaded in raster format from the Sentinel-2 Global Land Cover (S2GLC) project at a resolution of 10 m, with 13 land cover classes that are automatically derived for Denmark with an accuracy of 94% when compared with ground sampling data [
17]. Access to high quality ground cover data for the entire continent of Europe aids in processing times, as well as providing accurate and detailed statistics for large areas within the scope of such datasets, allowing end users and stakeholders to disseminate the impacts of SLR on the land around them, and in their regions of interest.
Four different years were taken into consideration when conducting SLR analysis for the island of Falster; 2020, 2050, 2080, and 2100, with their respective water levels seen in
Table 1. In the case of shoreline change, water level increase due to storm surges was not included as they were considered discontinuous events. Sea levels can also be impacted by tidal events; however, these were not considered for this study due to their dynamic nature. In the case of this study, the most extreme 100 year storm surge event of 1.4 m [
7] was taken into account when calculating potential impacts. Even though such a storm surge is a rare event (1% chance of a storm of this magnitude occurring each year), it must considered when planning for extreme events, with the severity and likelihood of storms increasing with rising atmospheric and water temperatures [
18].
For the purpose of this study, the four years were chosen at intervals to visualize the impacts at regular intervals in the future. However, storm surge data from more regular occurrences (as seen in
Figure 8) can be easily incorporated into this analytical workflow to quantify such occurrences.
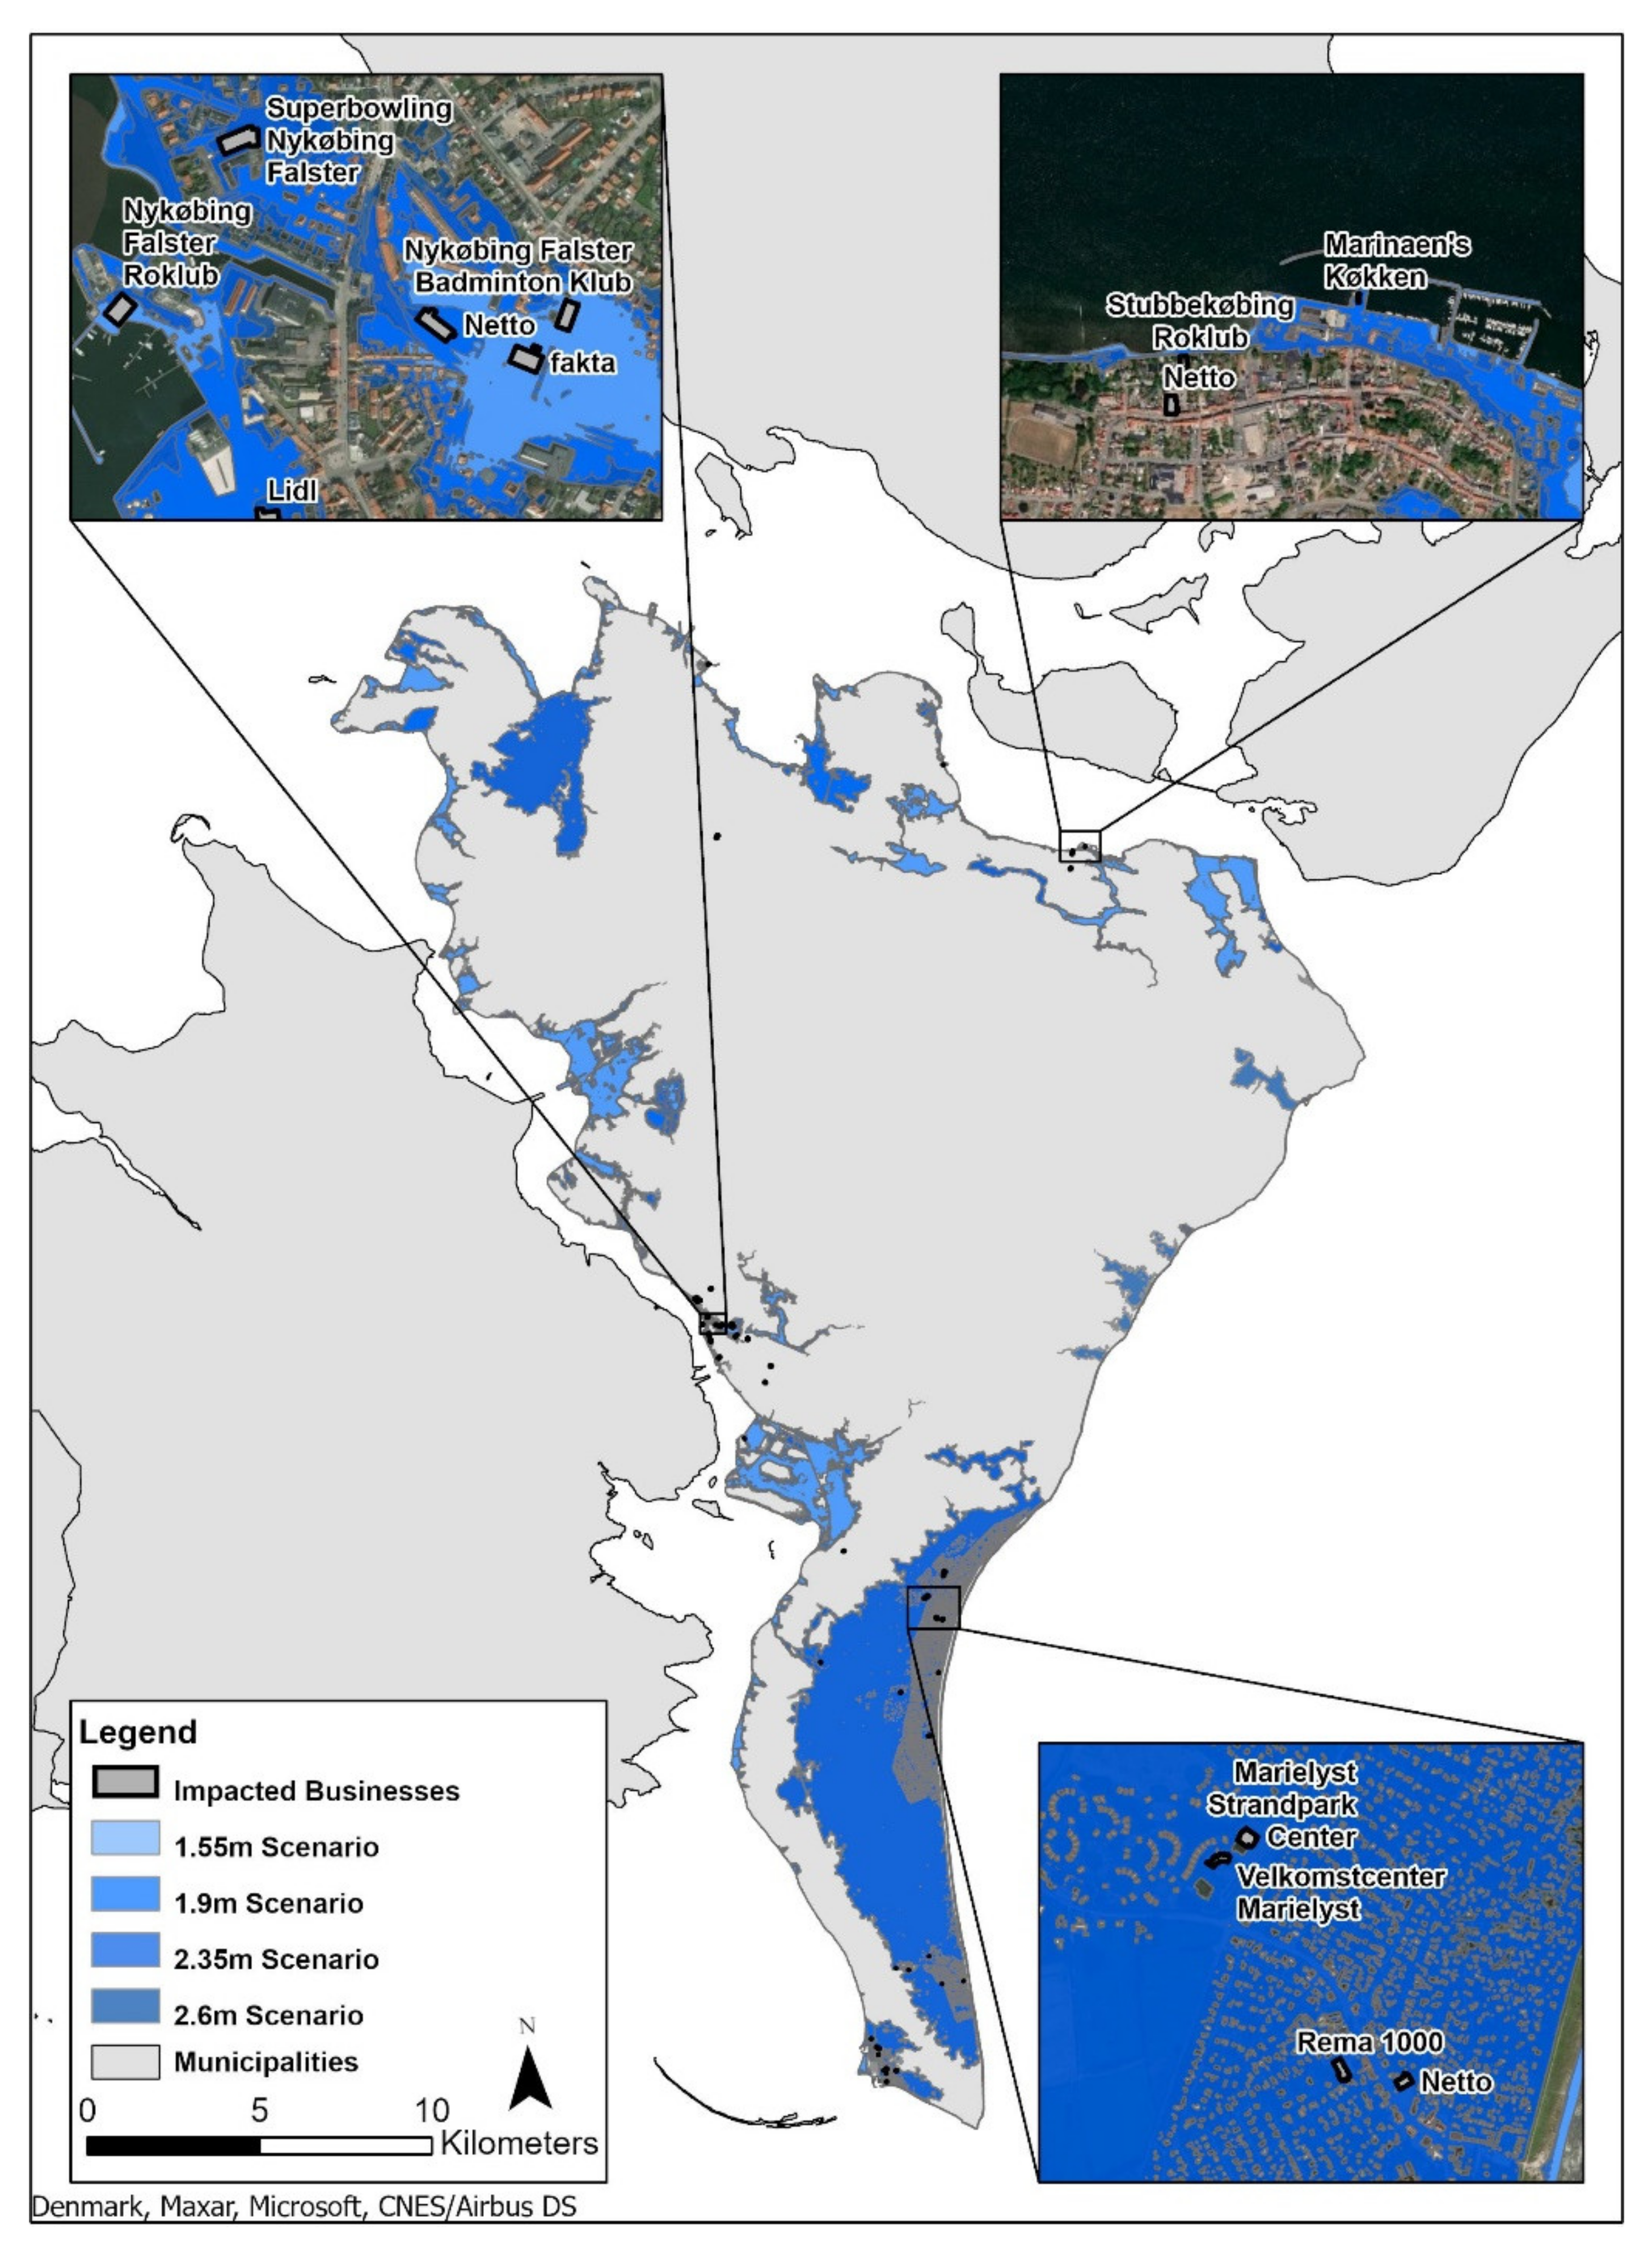
The growth of open-sourced geospatial platforms, such as OSM, and the increase of data availability that these platforms provide can allow regions to supplement their analysis further with more information available in their area to reinforce the consequences of SLR. Users of OSM have the ability to report the location and address of local businesses that they frequent. Whereas official data for building footprints, or address points, can lack such attribution. To provide a general idea of the impacts of SLR on traditional brick and mortar businesses, OSM was used to determine the location of businesses for the island.
Business data were accessed via OSMnx, a Python library that allows users to download data from OpenStreetMap to model, project, visualize, and analyze real-world street networks [
20]. Building footprint data were downloaded in tabular form and stored as a GeoPandas dataframe, where footprints that had an attributed name, where deemed to be businesses. The overlay tool made available from the GeoPandas library in Python was used to locate which of these footprints intersected with the various SLR scenarios in a Python environment, negating the need to transfer data to a separate GIS environment to manually process data. GeoPandas extends the datatypes used by pandas to allow spatial operations on geometric types.
4. Discussions and Conclusions
With spatial planning being decentralized in Denmark and local municipalities developing regional plans based on their individual needs in accordance to the planning act [
29], national level considerations should be employed to ensure a comprehensive approach to mitigating future SLR. Land management helps to address many of the challenges that are present when working with climate change adaptation planning. Flood and land use modeling can aid in policy formulation to control urban development as well as enforcing beneficial land use practices in areas prone to SLR as noted on Falster island [
30]. Such studies were conducted in other areas of Denmark, employing multi-criteria analysis of future land use simulation in order to identify areas which are potentially vulnerable to future climate change and SLR, highlighting the potential for wide scale implementation of such techniques [
31]. Climate adaptation as the result of SLR is a critical issue that can be observed presently across the globe. However, the approach to solve SLR should be more holistic and strategic, rather than a traditional approach with more obtrusive solutions such as seawalls. Including more sectors of the economy and stakeholders of the surrounding region can lead to a more integrated solution to the problem, instead of localized temporary remedies.
Even with the EU Flood Directive being implemented in 2007, many Danish municipalities lack explicit objectives on how to go about accomplishing this goal [
32]. In January 2018, Danish lawmakers agreed on regulating the Planning Act to prevent damage caused by flooding and erosion, providing municipalities with the legal framework to begin combating SLR. However, implementation of adaptations is still hindered by lack of coordination at the municipal level [
33]. When conducting geospatial analysis on this study area, several regions of Falster are critically exposed to future SLR. Perhaps, the biggest challenge is to provide a comprehensive and detailed analysis of which areas are impacted, and how severely.
Guldborgsund is already aware of the their SLR problem, but they are unsure what to expect in regard to their local areas within the island. It was determined that this was largely due to a lack of geospatial analysis of available data that this study aims to alleviate to some extent. Traditionally, in Denmark, coastal protection has been fragmented as the responsibilities typically fall to privately managed local dike boards. These privately managed institutions are concerned with their administrative regions, as well as issues of financing such costly endeavors, leaving the problem of SLR in the hands of the public [
34]. However, as noted throughout this study, SLR is not a local problem, but a national one. A unified and holistic approach is required to tackle such a mounting problem effectively and in a sustainable manner. Dikes across the country are likely failing to take into account the inhabitants, increases in tidal amplitude, mean water levels, storminess, and increasing surges that are being experienced in Denmark [
5].
The analytical workflow developed in this study can be adapted to a Python environment with minimal data collection and pre-processing to allow for easy statistical analysis of other areas of Denmark, allowing other coastal municipalities to determine the extent and severity of sea level rise for their area. With the rise of open-sourced data, and global datasets for land cover and elevation, such a study can also be implemented for other areas of the world experiencing, or preparing for, SLR with similar results.
There are numerous methods of tackling SLR, with two pertinent strategies being hard engineering and soft engineering. Hard engineering largely consists of man-made “gray” structures designed to absorb energy and prevent coastal erosion, often times resulting in detrimental effects further down the coastline. Man-made dikes are largely used, and recommended in the Copenhagen Adaptation Plan [
35], in order to protected the capital city of Copenhagen, Denmark from experiencing flooding from a storm surge or SLR. Such temporary solutions can often prove detrimental to surrounding developments and natural areas.
Soft, or “green”, engineering strategies rely upon natural strategies to combat coastal erosion and SLR. Wetland restoration can play a vital role in lowering future greenhouse emissions as natural areas can act as carbon stores while forming a natural area to protect communities against future storms and SLR [
36]. Nature-based risk mitigation, in the form of wetland preservation, can reduce the impact of waves, shoreline erosion, as well as accumulating sediments to further prevent SLR in an area while also curtailing future climate change [
37] as well as benefiting the biodiversity of local ecosystems [
38]. Softer measures that employ natural processes, such as reefs or marshes, can often be more cost effective in the long term, leading to greater flexibility of land use as the hard structures of gray solutions often have require further improvements or are less effective altogether when compared to green alternatives [
39]. Natural, “green”, engineering solutions help to solve not only SLR, but climate change and other factors when compared to the more tradition “gray” solutions.
In local areas, such as the heavily impacted area of Marielyst, serious considerations need to be made in order to prevent a significant loss of land in a worst case scenario. Natural solutions, such as wetlands that can be found in other areas of the island, may work as a temporary solution, but may not be able to keep up with a potentially accelerating rate of SLR. More comprehensive, and holistic solutions must be planned for, such as dikes that incorporate soft and hard aspects of coastal protection [
40]. By incorporating nature-based solutions, which deal well with handling sediment accretion, with man-made structures, such as dikes with reinforced outer slopes, SLR and flooding can be more easily managed and prevented with only the need to increase the crest height of the dike if accretion of sediments is too high thus allowing waves to reach the top of the structure [
40,
41,
42].
Limitations & Future Studies
Throughout the course of this study, data were easily accessible via official sources (SDFE, DST, DMI, etc.), or able to be supplemented from open source alternatives, such as OSM, as Denmark is an extremely data-rich country. This includes sea level data that was used for every step of the analysis. Where such data are not available, elevation data must be derived, a time consuming and cumbersome process involving processing raster data from local or global sources. Larger datasets can lack the resolution to accurately analyze local areas of SLR, and may require down-sampling of data in order to increase resolution.
Throughout this study, current land cover data were used in order to derive statistics. This is a limitation as land cover is a dynamic process, along with SLR. The statistics presented give a general idea of land cover types impacted, but do not include future land cover change and therefore may not be entirely representative of the future of Falster island.
Countries where administrative population figures are not available have the option of using coarse, 1 km resolution, population data for the entire world in the form of a raster dataset provided by the Center for International Earth Science Information Network (CIESIN) that can then be down-sampled to their area of study where official figures are not available [
43]. While not being as fine a scale as the methods used in this study, such data are still able to provide a general figure to allow for easy consumption of data from stakeholders.
Collaboratively collected data and citizen scientists have greatly increased the amount of data on infrastructure (transportation, businesses, scenic areas, etc.) with the introduction and development of open-sourced platforms such as OSM. Access to freely available (and detailed) data via Python environments and libraries allows other areas of the world to have access to similar datasets that were employed in this workflow in their respective areas.
Further studies can include processing remotely sensed satellite imagery in order to derive features from an area where data from official or unofficial sources may be lacking in quantity or quality. Such means could be used to derive building footprints as well as land cover information for much of the globe.


