1. Introduction
Online reviews are one of the main sources of eWOM communications, and consumers will consult them before making a purchase decision. The BrightLocal survey [
1] pointed out that 93% of customers read online reviews to make a purchase decision. In addition, 85% of consumers trust reviews at the same level as their personal recommendations from friends or family. The study also pointed out that online reviews of restaurants and hotels play an extremely important role for consumers. Therefore, online reviews have not only become an important reference resource for consumers to make purchase decisions [
2,
3,
4], but also an important source of strategic intelligence for companies to understand their current location and competitive advantages [
5,
6,
7].
Previous studies [
5,
6,
7] have shown that online reviews will greatly affect the purchase decision of consumers who read reviews and may affect the company’s sales and revenue. A large amount of literature [
8,
9,
10,
11,
12,
13] is devoted to studying the influence of online reviews on people’s purchase intention based on different aspects of reviews (such as usefulness, credibility, professionalism and information quality). Many of these studies use predictive models to predict how the characteristics of reviews in these aspects (usefulness [
8,
14,
15,
16], polarity [
17], acceptance [
18], quality [
19], reputation [
20], etc.) affect purchase decision. These predictive models are designed to understand how comments affect consumers’ purchasing intentions from different perspectives. It can be seen that no matter which aspect of the review, the impact of reviews on purchase intention is very obvious. Therefore, online reviews are now playing an important role in consumer purchasing decisions.
For companies, it has become a top priority to understand which characteristics of online reviews affect consumers’ purchasing intentions and how. In fact, so far, past studies have often used some important characteristics of reviews to explore how they affect readers’ purchase intentions. However, these studies only explored the influence of online reviews on purchase intention based on the characteristics of certain aspect of online reviews and lack a comprehensive consideration. For example, some studies have explored the influence of online reviews on purchase intention from different perspectives of reviews, such as the credibility [
21], the usefulness [
22], the information quality [
23] and the professionalism [
24]. Here, credibility refers to the degree of trust or belief, usefulness refers to the degree to which information can help users, information quality refers to the quality of the information content and professionalism refers to expected abilities or skills. A detailed review and discussion of these four factors are given in
Section 2.
Based on the above examples, we can see that various aspects of reviews can have an impact on consumers’ purchase intentions, and the important aspects include usefulness, information quality, professionalism, credibility, etc. However, one of the shortcomings of these past studies is that they only start from a certain angle to explore the impact on purchasing intentions. However, these different aspects are related to each other but at the same time are different from each other. Therefore, their exploration of purchasing intention is partial and incomplete, and they lack a comprehensive and holistic understanding of the possible factors that affect purchasing intention. Therefore, from this shortcoming, a research need is pointed out, that is, how to integrate the different perspectives used to understand the influence of purchasing in the past to achieve a holistic and comprehensive understanding, and find out a more complete list of influencing factors and build a predictive model to explore how these factors affect purchasing intentions.
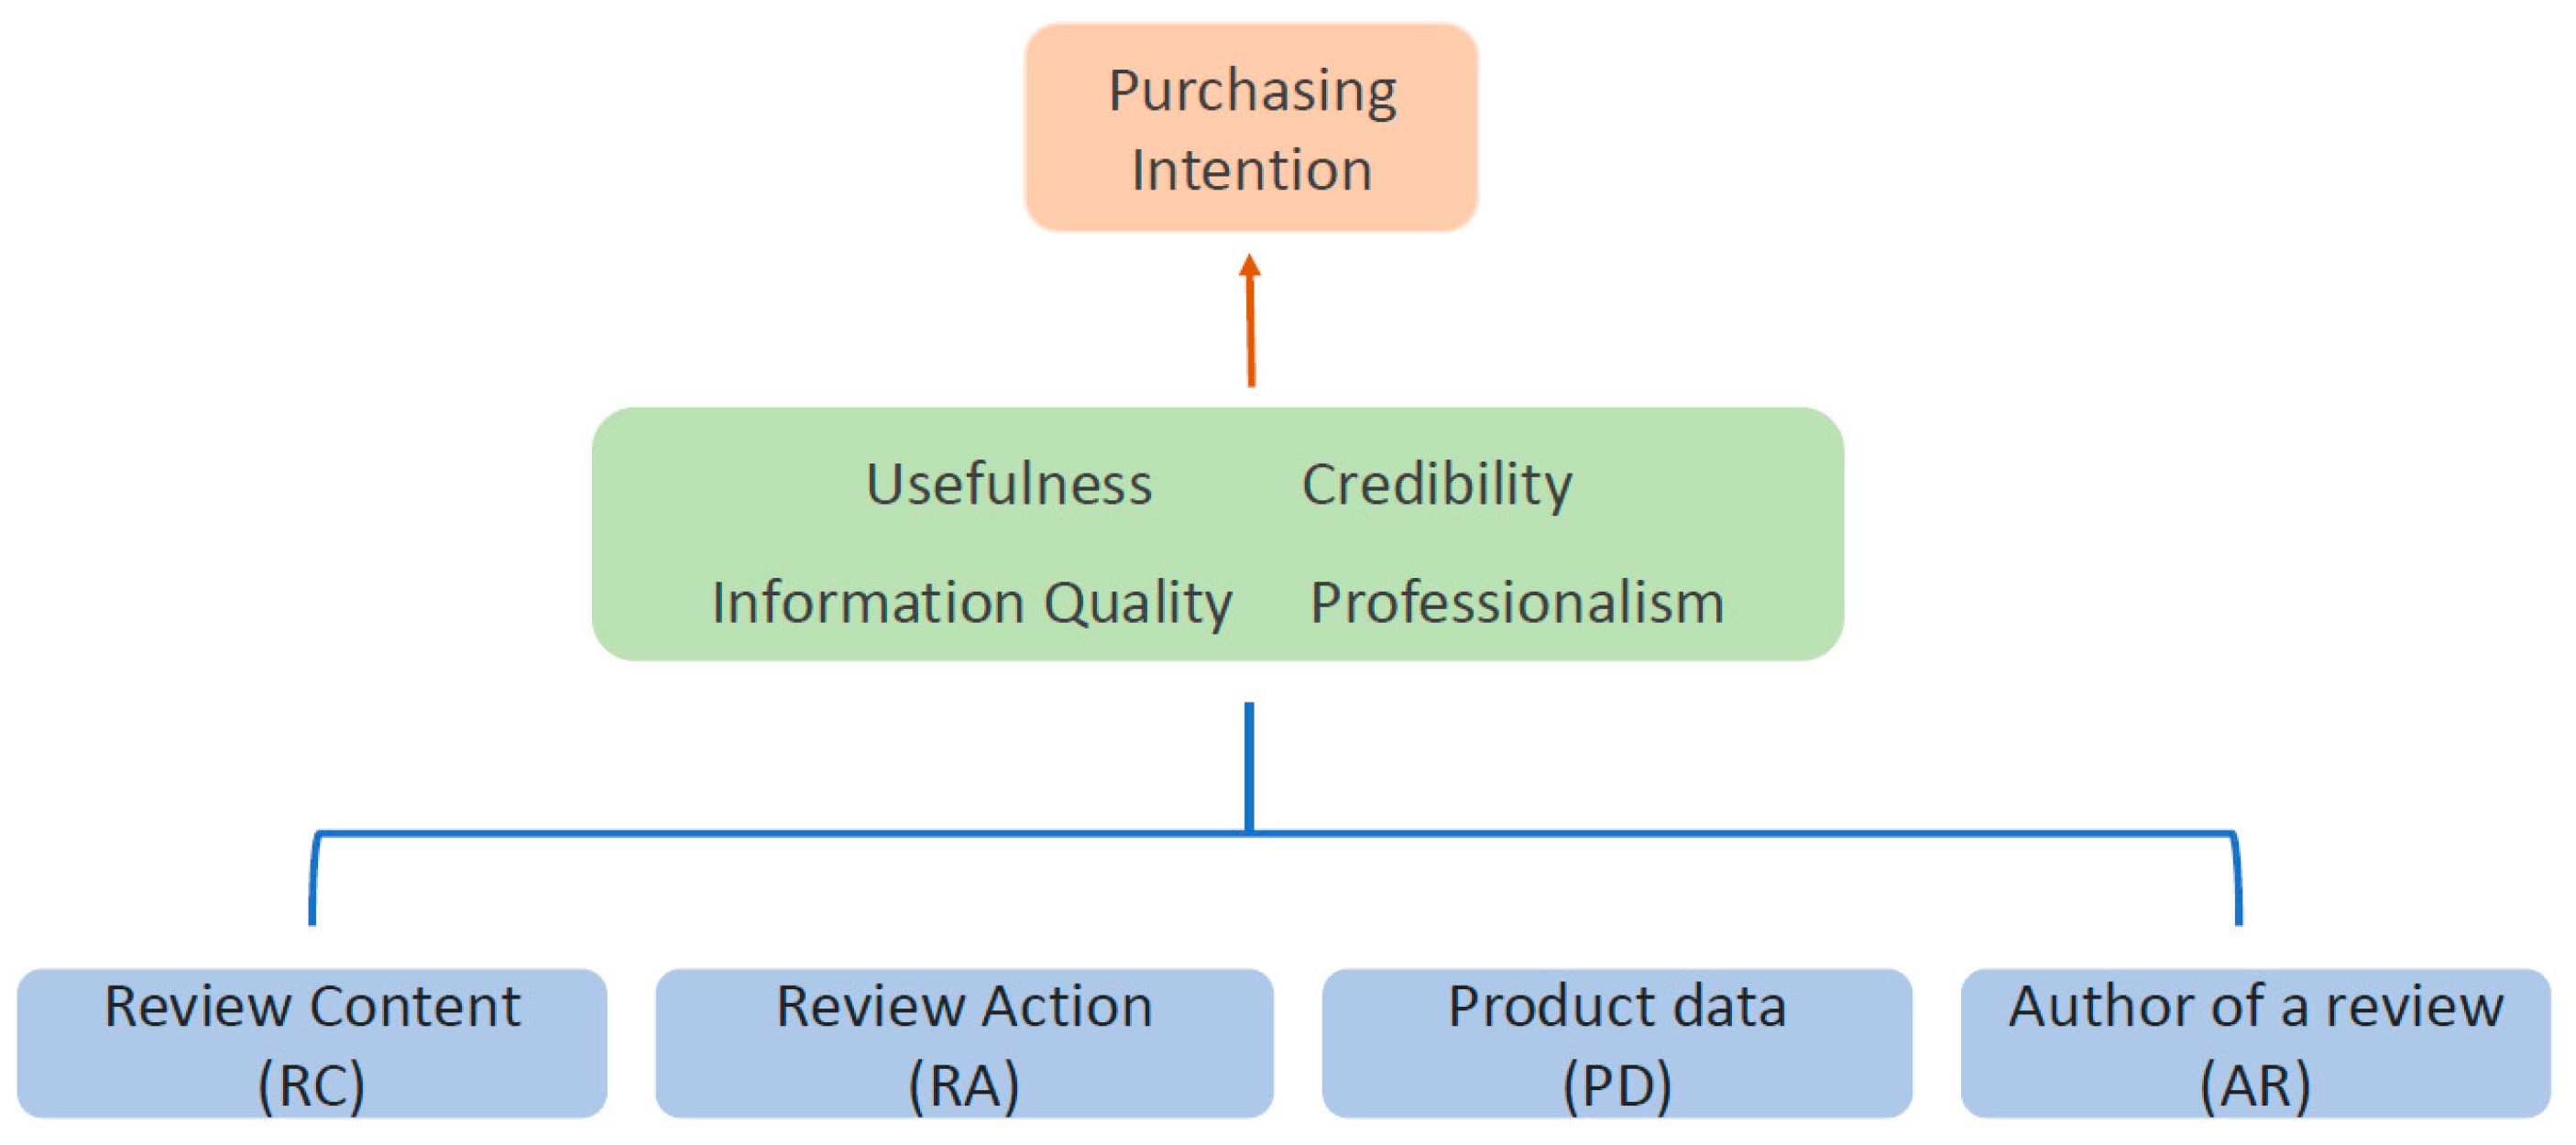
In this paper, we aim to address these research gaps. We discussed the influencing factors of purchase intention from the perspective of consumers and conducted joint analysis from various aspects. The model in the research uses the important aspects related to reviews in the literature, combined with the features that readers can recognize, to capture the relevant variables. Therefore, this paper discusses the factors that may affect purchase intention from four aspects: usefulness, information quality, credibility and professionalism, and further extracts these factors from the review content, reviewer information, review action and product information. As a result, a total of 41 variables were extracted. Then, we took a closer look at how the components of the review affect purchase intentions. The entire conceptual framework is shown in
Figure 1. The advantage of this framework is that it combines the four dimensions used in previous studies, so it can combine the variables of these four dimensions to explore which variables have greater influence and which variables have less influence. In addition, this framework can also help us clarify the similarities and differences between the four-dimensional variables and clarify how they complement each other. In addition, the framework can objectively evaluate the predictive capabilities of various aspects on purchase intention, and by integrating these aspects, the overall predictive capabilities can be significantly improved.
This paper makes multiple contributions to the field. First, we identify the important factors of reviews that affect purchase intention from four aspects rather than a single aspect. Second, our proposed model can provide a more comprehensive understanding of which characteristics of reviews are more likely to influence purchase decisions, because our perspective covers four different but related aspects. Third, we propose an ensemble model that predicts the influence of reviews on purchase intention by combining four different aspects. Fourth, the experimental results show that our model can predict review influence more accurate than the model based on a single aspect.
The rest of the paper is organized as follows.
Section 2 is a review of related work.
Section 3 introduces the method and process of constructing the prediction model.
Section 4 presents a series of experiments to prove the effectiveness of our prediction model.
Section 5 is the conclusion of this paper.
2. Literature Review
For the related literature on the characteristics of eWOM, there have been several significant aspects in the past, namely usefulness, credibility, information quality and professionalism. The related literature will be introduced below.
2.1. Usefulness/Helpfulness
Among the studies related to reviews, the most common are studies on usefulness and helpfulness [
8,
9,
25,
26,
27,
28,
29]. In these papers, “helpfulness” and “usefulness” are used interchangeably. This is due to a phenomenon that has emerged in recent years that voting on how helpful online reviews are is particularly important because they constitute a check on consumer decisions during the purchase process. Many large e-commerce websites have helpful voting mechanisms. Such a voting mechanism will not only affect the comments themselves but will also affect the judgements of the commenters. Generally, reviews with more votes will be considered more useful. Usefulness is regarded as a criterion reflecting judgments. Gupta et al. [
30] found that highly useful reviews can help customers evaluate and improve the credibility of reviews, which also means that these reviews can increase customers’ confidence in making purchasing decisions. Mudambi et al. [
31] also pointed out that usefulness analysis can effectively help understand the impact of comments on the decision-making process, and the depth of comments has a positive correlation with perceived usefulness. Moreover, useful reviews have a greater impact on the experience of products. Compared with advertising, people pay more attention to whether the actual experience content is useful to them.
Racherla and Friske [
32] pointed out that negative reviews are more influential than positive reviews. The study suggests that finding negative reviews is a better way to understand the content of the product. Salehan and Kim [
14] further found that neutral polarity reviews were considered more helpful. Korfiatis et al. [
9] used basic readability measures, average length measures, text content and positive and negative sentiments to assess the quality and usefulness of reviews. The findings of [
8] on the impact of reviews on sales and perceived usefulness indicate that subjectivity, readability, self-disclosed identity, product-related information and negative reviews are important impact characteristics. Almutairi et al. [
33] showed that the reviewer’s disclosure and the reviewer’s history will affect the online social community and behaviors such as review helpfulness. Therefore, we also use the reviewer’s personal information and past records as research variables. Liu and Park [
34] found that the combination of reviewers and information features has a significant impact on the usefulness of reviews, while [
32] pointed out that online reviews are essentially a source of information used by consumers to obtain knowledge about products and services. Therefore, the amount of information available in the reviews helps customers evaluate the function of the product. Based on the above findings, this study used polarity, relevance, readability, subjectivity, popularity, information and history as the influencing factors of usefulness.
2.2. Credibility
The trustworthiness of messages has always been an important issue in online communication research topics. As the population using the Internet continues to grow, consumers have more experiences online. However, even with so much experience, it is often impossible to determine the credibility of the online environment. How to evaluate credibility is the research direction that many scholars attach importance to [
35,
36,
37,
38]. Gunawan and Huarng [
39] believe that trust in information will affect consumers’ attitudes and subjective consciousness, and in turn affect their purchase intentions. Some studies [
40,
41] have pointed out that credible comments will be accepted by readers and affect subsequent behavior. In general, when product reviews are more credible, it may have a significant impact on consumers’ preference for products.
Kusumasondjaja et al. [
36] used positive reviews, negative reviews and the personal identification information of reviewers to investigate the credibility of online reviews and initial trust. Zhang and Watts [
42] found that the consistency of information is the key. The consistency of comments refers to whether the information in the comments has the same trend as other messages. Since consumers view messages as clues, the process of receiving them will also be affected. Similar messages presented by numerous reviewers may be considered more credible. This is also consistent with what [
43,
44] found. The support of a growing number of other people will strengthen the so-called “consensus power.” Readers tend to believe what most other people believe, even if those beliefs may not be true.
However, there are many anonymous messages on the Internet, and the anonymity often results in irresponsible speech. Even if many operators actively develop monitoring mechanisms to find false reviews, the current situation is still inevitable. Xie et al. [
45] studied how the existence of personal identification information of electronic reviewers influences consumers’ handling of contradictory online booking intentions. The presence of personally identifiable information will have a positive impact on the credibility of online reviews. In addition, [
46] found that when a review does not reveal the identity of the reviewer, there is actually not much difference between positive and negative reviews of consumers. Almost all websites now require identity authentication. In addition to having a higher level of control, it also allows consumers to acquire more references. Therefore, the reviewer’s personal information and website reputation are also important variables. Based on the above findings, this study used consistency, richness, subjectivity, relevancy, reputation, information as the influencing factors of credibility.
2.3. Information Quality
Obviously, the impact of a review may also be related to the quality of the information. The higher the quality, the more likely it is to benefit consumers. Atika et al. [
47] indicated that source credibility and information quality have a significant impact on brand image and purchase intention. The research model of [
48] confirms that when users evaluate and judge online information, the most common mention is information quality. In the research of [
11], the criteria for judging information quality and credibility have been strengthened. The most common concern is the usefulness, correctness and particularity of the message content. In addition, reputation, expertise and enthusiasm are related to reliability in judging authors. Chua and Banerjee [
49] found that the relationship between information quality and review assistance varies with emotion and product type. The study also determined the three dimensions of information quality for evaluation, namely, comprehensibility, specificity and reliability. In the research of [
50], the quality evaluation of product reviews was regarded as a classification problem. The characteristics of the message used to assess quality take into account all aspects of the review, including believability, subjectivity, reputation, relevance, timeliness, completeness, appropriate quantity, comprehension and simplicity. These were also adopted in our study. Among them, we use consistency to replace the believability in the research. In the literature related to decision-making, [
21] showed that the number and quality of online consumer reviews are two of the characteristics that affects users’ information processing. Lee and Shin [
51] showed that, especially in the evaluation of search products, the quality of reviews has a greater impact on purchase intention. In addition, when there are photos of reviewers, the review quality will affect the evaluation of the website, which means that the photos of reviewers may cause consumers to adopt different message processing strategies. Based on the above findings, this study used subjectivity, richness, polarity, relevancy, timeliness, reputation and consistency as the influencing factors of information quality.
2.4. Professionalism
Anyone can access resources on the Internet, but whether to accept it depends on personal judgment. Professionalism is an indicator that is highly related to credibility. Most people measure credibility according to the professionalism revealed in the message. For example, people usually trust reviews that contain detailed information. Rieh and Belkin [
52] proved that information seekers can measure the ultimate perceived credibility based on the reliability and professionalism of information. From the consumer’s point of view, when considering or making a decision, a “professional” is usually the final confirmation. Professional knowledge means in-depth knowledge of a specific field. Therefore, the research of [
53] found that, compared with search products, the expertise of reviewers in trust-based and experience-based services will increase value and influence. People are more influenced by messages from authoritative and professional sources. Especially when professional comments have eliminated personal prejudice to a certain extent, trust and authority will be enhanced [
54]. The study of [
55] demonstrated the importance of the interaction between the comments of professional reviewers and other external signals that may influence consumer behavior. Zhou and Duan [
24] confirmed that professional reviews influence online user choices indirectly through the volume of online user reviews, in addition to their direct impact. There are numerous studies linking the process of generating credibility with the professionalism of the source. Mackiewicz [
56] further studied how these professional claims are connected to contributions. The study showed that reviewers can gain credibility through the performance of their behavior or expression (Indirect way), rather than through the promotion of professional knowledge (Direct way). Jameson’s research [
57] also shows that persuasiveness can be achieved through narrative experience, and the process of linking past experiences with products will naturally turn to expertise. Lin et al. [
58] showed that the expertise of senders will attract user to adopt the information and make decision to purchase when they made a comment in consumer review. Generally speaking, professionalism can be viewed as “authoritativeness,” “competence” and “expertness” [
59]. Based on the above findings, this study used information, history, reputation, relevancy, subjectivity as the influencing factors of professionalism.
3. Framework and Method
In this study, the evaluation of the impact of electronic word-of-mouth on purchase intentions is regarded as a classification problem, and we propose a model for predicting the level of influence of reviews. Since we consider predictive influence as a classification problem, we have selected several suitable classification algorithms to develop predictive models and analyzed the most appropriate method for analyzing the relationship between attributes and influence scores. The framework of this article is described in the Graphical abstract and can be divided into eight steps. First, we collected review data sets from TripAdvisor, which is one of the largest travel platforms in the world (data collection). We mainly used important aspects related to reviews to obtain rich variables (feature extraction). Then, we asked experts to assign an impact score (dataset labeling) for each review and divided it into three levels. We then preprocessed the data set, including data conversion and standardization (Preprocess). Then, using Pearson correlation analysis (correlation analysis) and five feature selection algorithms to evaluate and filter the variables, we found the set of variables with the strongest interpretation capability for modeling (Feature Assessment). The model was trained using cross validation, and finally several important evaluation principles were used to assess the performance of our predictive model (Model Training and Validation).
3.1. Data Collection
Our research selected TripAdvisor as the target, which is one of the major travel websites in the world. Its business is mainly to provide searchers with reviews and information about global hotels, restaurants and tourist destinations. As a frequently used online website, it is an important resource for travel reviews. In this study, we selected 10 restaurants in the top three regions (New York, Los Angeles and Chicago) on the TripAdvisor page, and selected 10 reviews from each restaurant. A total of 300 reviews were used as our dataset.
3.2. Features Extraction
Table 1 indicates the relevant variables of four important aspects (helpfulness, credibility, information quality, professionalism) in the literature related to the review mining. Based on this, we extracted from the TripAdvisor website the index variables that are often seen in every aspect of the literature and the relevant data that consumers will pay attention to.
Furthermore, we extracted a total of 41 features in the review from four different sources: (1) review content: text content, (2) review action: actions or events taken as a result of comments, (3) product data: information related to the product itself and (4) review author: information about the author who posted the review.
Table 2 is the list of features considered in developing the prediction models. It uses four important aspects (helpfulness, credibility, information quality and professionalism) and related data that consumers should pay attention to on the website (such as the website’s predefined scoring items). These 41 variables are represented as z-score representation. The details of each variable from the four sources are described below.
3.2.1. Reviews Content (RC)
We extracted a total of 14 variables from the review content (RC), which belong to five categories (readability, subjectivity, richness, polarity and relevancy). First, [
61] pointed out that easy-to-read text will be better understood, and readers will form a more reasonable view of the text. In the readability section, we used eight variables, where readability indexes f5, f6, f7 and f8 are defined in [
62,
63,
64], respectively (see
Table 1). In addition, Chen and Tseng [
50] indicated that subjective opinions in online reviews may help readers make decisions. The degree of subjectivity is based on the number of opinion words used. The subjective part uses “the number of opinion words” (f10) and “the proportion of use” (f9). As for richness, we use “the number of photos” (f11) to determine the richness of this review. In the polarity part, we used the VaderSentiment sentiment analysis package for sentiment analysis. We captured “the sentiment score of the review content” (f12) and “the sentiment score of the review’s headline” (f13) because readers may pay attention to different reviews at the same time. Review relevancy refers to the frequency with which a review mentions the important characteristics of the target restaurant. The characteristics considered include 23 items: food, taste, price, quality, size, ingredients, drink, dessert, service, parking, staff, open hours, menu, pets allowed, WIFI, seating, ambiance, environment, view, located, discount, payment and smoke. Degree of relevance (f14) is the total number of times that these 23 items are mentioned in a review.
3.2.2. Reviews Action (RA)
This section is the follow-up behavior caused by users after reading the reviews. These operations on reviews include star ratings on reviews, other people’s responses, other readers voting for the help of the review, and the relationship between a single review and other factors from an overall perspective. First, since readers usually pay attention not only to one review, but also notice the differences from other reviews, we used two features to evaluate the consistency of the review: “the degree of deviation between the reviewer’s rating and the average rating” (f15) and “the degree of deviation between the rating and the polar rating” (f16). The mapping method is used to map the scoring level to the proportion of the sentiment score and was then subtracted to obtain the difference value. In addition, the behaviors related to reviews include “Rating” (f17), “Helpful Vote” (f21) and “Response.” In “Response,” we use “With or without replies” (f18) and “Total number of responses” (f19) as two measures to observe the impact of the number of responses. In addition, according to research, 41% of consumers will only refer to reviews within about 2 weeks, and only 18% of consumers will refer to reviews from the previous year [
21]. Therefore, “Timeliness” (f20) must also be considered as a variable.
3.2.3. Product Data (PD)
According to the research by [
65], eWOM has different effects on purchase intention. For different products and types, their impact is not the same. Therefore, we also include product-related variables in the scope of research, hoping to provide more theoretical reports through the analysis of the service industry. In the “Product Data” section, there are six variables. We use “number of reviews” (f22) and “average score” (f23) as indicators of popularity. In addition, we directly apply the predefined scoring aspects of the TripAdvisor website, including “food score” (f24), “service score” (f25), “value score” (f26) and “atmospheric score” (f27).
3.2.4. Author of a Review (AR)
Forman et al. [
46] confirmed the importance of revealing the identity and location of the commentator. Paek et al. [
66] also showed that the user’s background information helps predict the importance of the information s/he publishes. Since our research goal is to predict the impact of reviews on purchase intention, it is an important factor whether the relevant information of reviewers will affect the judgment of products and reviews. To this end, we collected the personal information, past records and reputation of each reviewer on the website. Personal information includes “gender” (f28), “age” (f29) and “year of joining” (f30). More specifically, in the geographic location information section, we chose “whether this reviewer’s location is the same as the restaurant’s location” (f31). Finally, in the self-introduction section of the reviewer’s page, we can observe “whether he/she disclosed more identity information” (f32). Readers can move to the reviewer’s name area to see relevant information, such as what rating “this reviewer has rated the most” (f33) in the past, “the number of places visited” (f34) and “a total number of photos provided” (f35).
This reputation part is part of TripAdvisor’s recognition plan for website reviewers. It can show the reviewer’s contribution to TripAdvisor, as well as their status and reputation on the site, to bring a better experience to other travelers. Six variables were extracted in this section: “Contribution” (f36) represents the total contribution of reviewers on this site. “Followers” (f37) is the number of followers the reviewer has. “Reviewer ranking” (f38) is published by TripAdvisor. The more points he/she earns on the website, the higher the level he/she is at. “Number of badges” (f39) indicates the travel knowledge possessed by the reviewer. The more travel points he/she collects, the more travel badges he/she can obtain, which will be shown in his/her profile. “Total points” (f40) is equal to the reviewer’s travel points on TripAdvisor. You can earn different numbers of travel points by posting comments, posting photos, etc. The 41st variable is “the total number of useful votes.”
3.3. Dataset Labeling
We followed the methods of past research to find experts to label the data [
67]. The three people who assisted in data labeling are TripAdvisor users who are familiar with the functions of the website and have experience of searching for information on the website. In addition, they have experience of making decisions influenced by reviews. During the labeling process, we had three experts (coders) rate the same review at the same time, with a score of 1–5. When the difference between the maximum score and minimum score does not exceed 0.5, we averaged the three scores and reached a consensus. When the distance was greater than 0.5, it means that no consensus was reached. If consensus could not be reached, inconsistent reviews were excluded and the next consensus review score was sought until 300 reviews were collected.
After marking all the reviews, we used the K-means algorithm to divide the impact level into three levels based on people’s general psychological judgments (such as large, medium and small). Level 1 is the least influential and Level 3 is the most influential. Results of the K-Means show that the cluster centroids of level 1 to level 3 are 1.4961, 2.8319 and 3.9636, respectively. Then, for the purpose of checking whether there is consistency between the scores of the three coders, we use Kendall W (the Kendall’s coefficient of concordance) for the consistency check among the raters. The narrative statistics of the coders are shown in
Table 3. The results showed that the Kendall W agreement coefficient is 0.979, the chi-square value is 878.400 and the
p-value (=0.000) of significance is less than 0.05, which means that the ratings of the three reviewers (Coders) have high consistency.
3.4. Feature Selection
In this study, we applied five feature subset selection methods and the Pearson correlation (PC) method to evaluate the variables. Each of these methods aims to select the subset of attributes most relevant to the predicted target variable. From the results of variable selection, we can determine which variables are more important for prediction. In addition, we can also build a good prediction model based on these variables.
CfsSubsetEval (CS) uses the Pearson correlation formula as a basis for evaluating the predictive ability of each attribute and its redundancy between each other.
InInfoGainAttributeEval (IG): uses information gain as a criterion to evaluate the valence of attributes. It mainly records how to select appropriate attributes from the data set as the basis for data classification through entropy.
ReliefFAttributeEval (RF) evaluates the value of attributes by distinguishing the degree of feature values from different groups of samples that are similar to each other.
OneRAttributeEval (OR) establishes a rule for each attribute in the training data, and then selects the rule with the smallest error. It is usually used as a baseline performance benchmark for attribute evaluation.
SymmetricalUncertattributeEval (SU) evaluates the worth of an attribute by measuring the symmetrical uncertainty with respect to the class. It establishes the SU score of an attribute. This criterion is similar to the gain ratio criterion.
The above subset selection methods were implemented with the Weka data mining package.
3.5. Ensemble Model
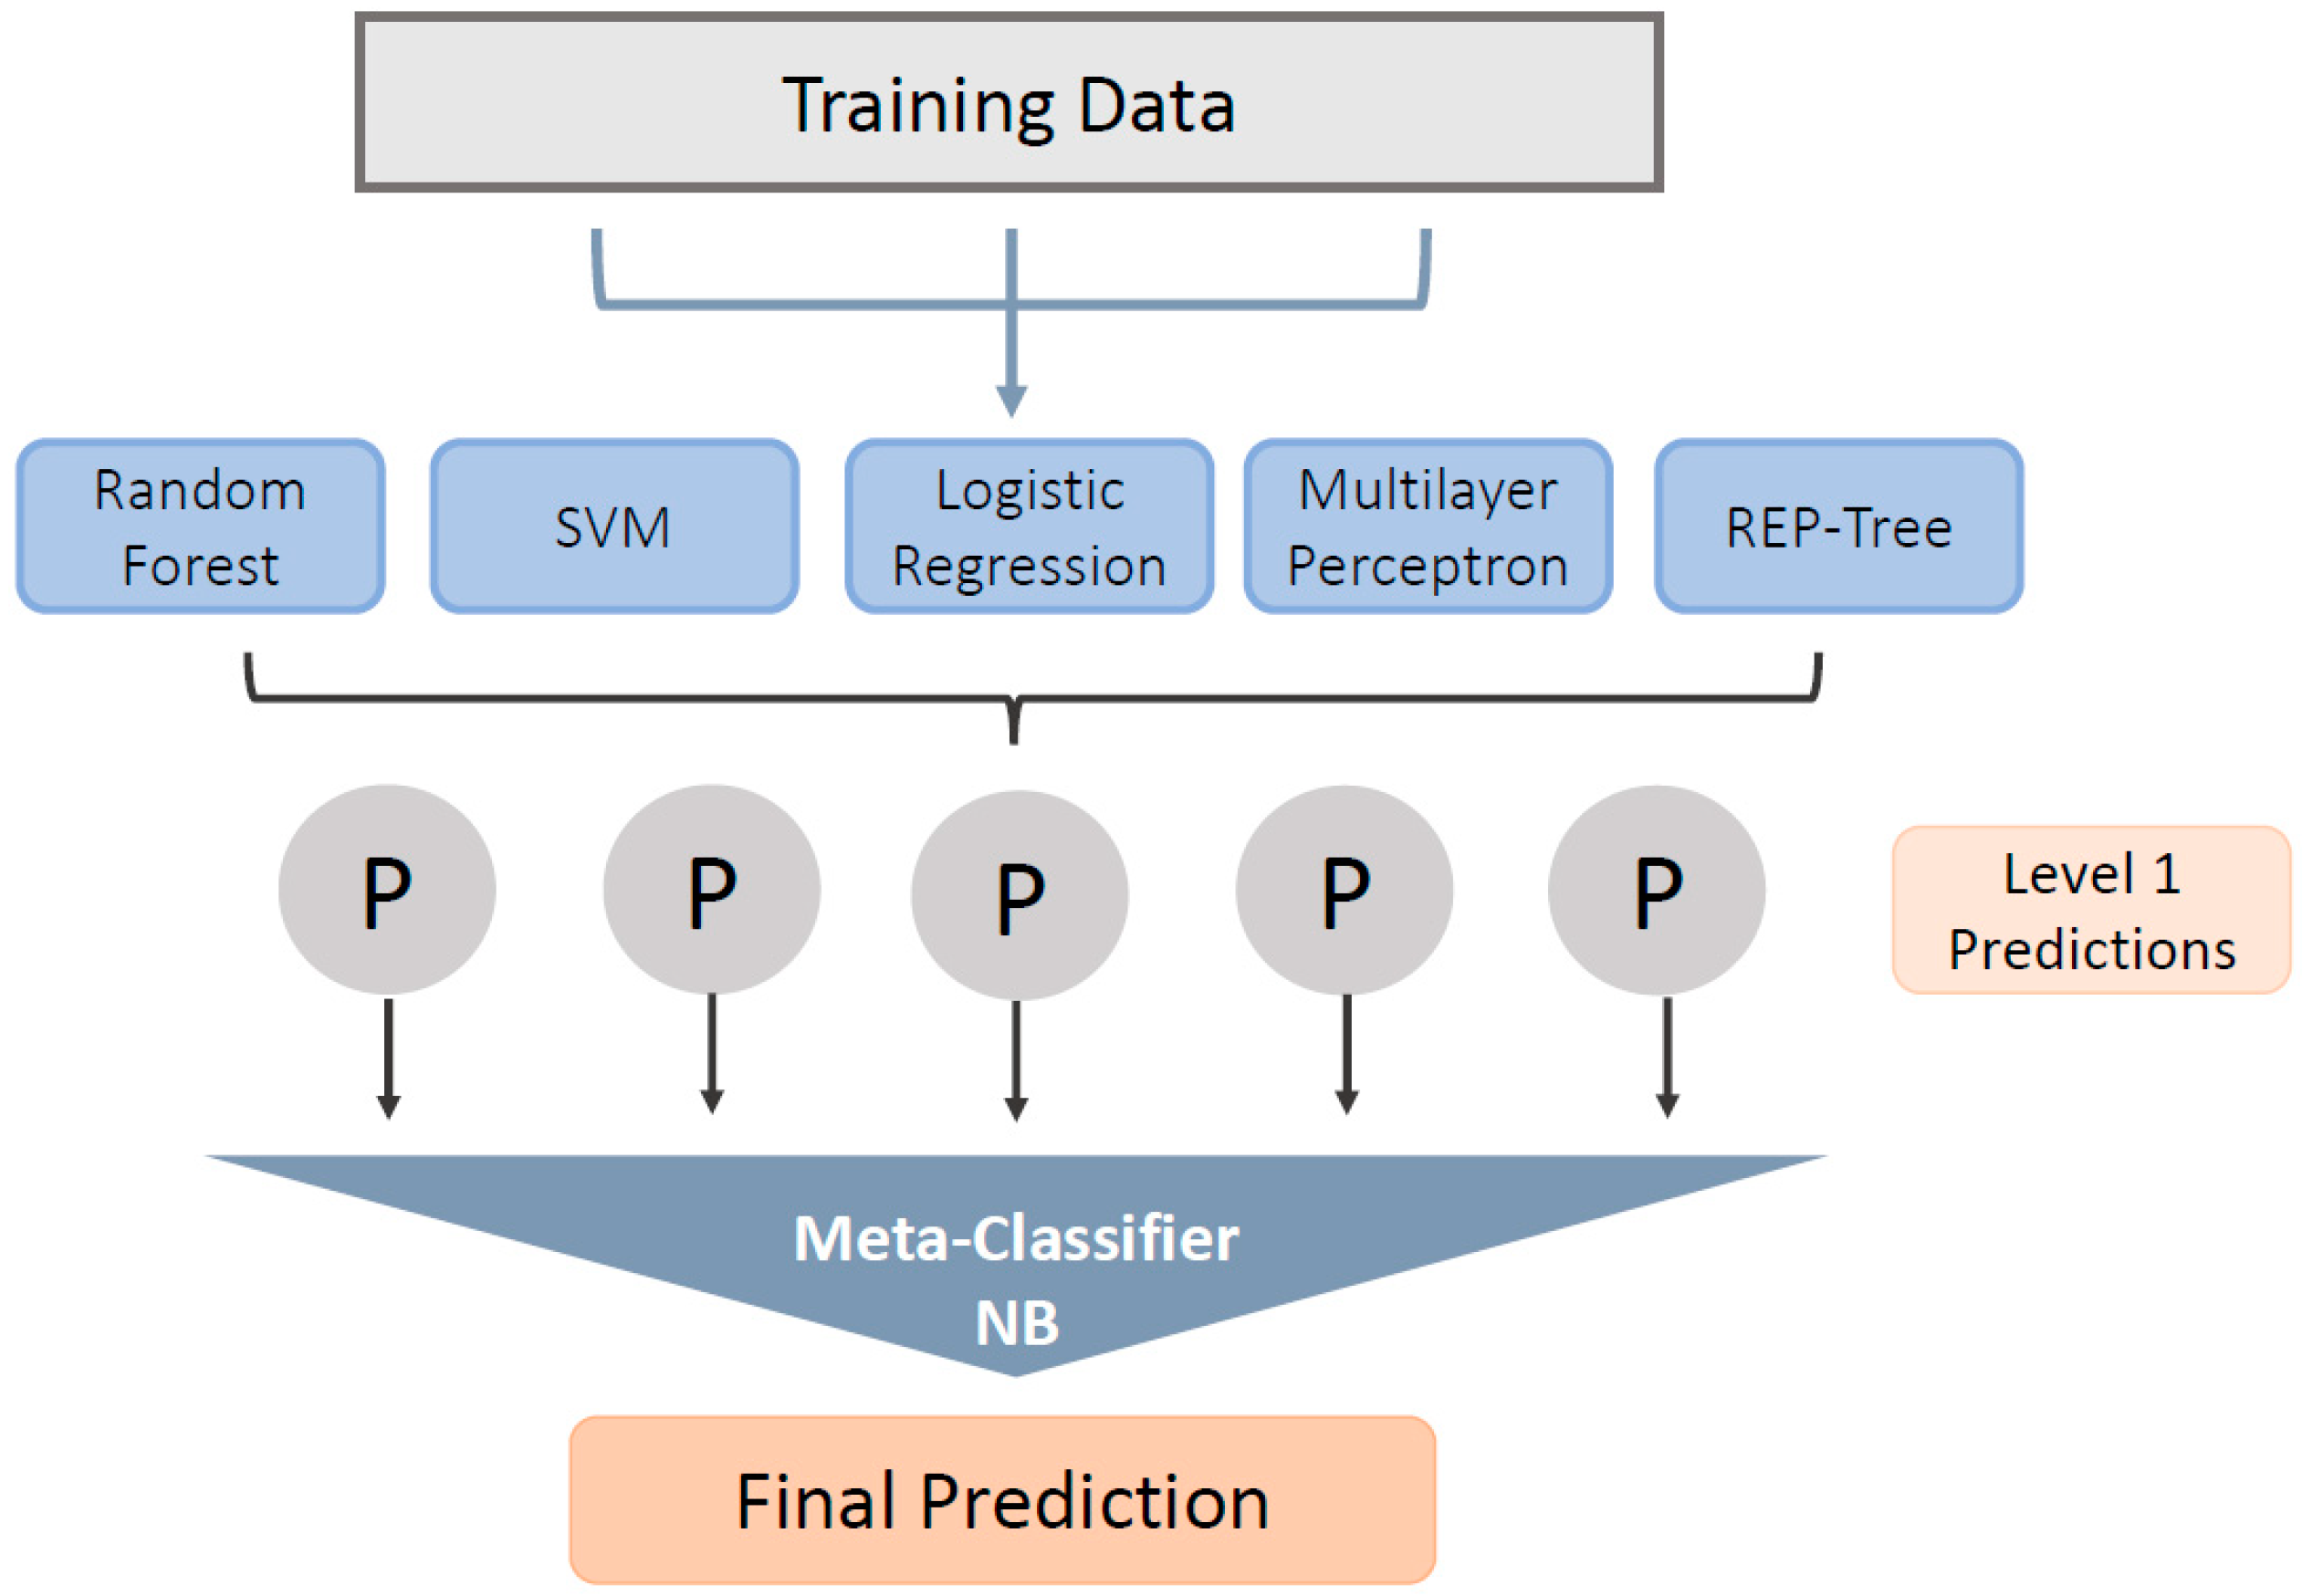
The ensemble method uses multiple learning algorithms to obtain predictive performance that is superior to the performance obtained from a single learning algorithm of any composition. The advantage of ensemble methods is that they can combine and smooth deviations of learning algorithms. For the proposed ensemble model, we have implemented stack generalization. Our stack architecture is divided into two layers: layer zero combines five algorithms, namely support vector machine (SVM), logistic regression, neural network, random forest and REPTree as basic classifiers. Then in the first layer, we take the prediction result of the zeroth classifier as input and use the meta-classifier to optimize the results of the basic classifier. We use Naive Bayes as a meta-classifier to optimize the results of the basic classifier and reduce the generalization error. Naive Bayes is a probability classifier that calculates the probability of each category of a given sample, and then outputs the sample category with the highest probability.
Figure 2 shows the framework of our ensemble model.
Through 10-fold cross-validations, the influence prediction of the ensemble machine learning model proposed in this study is completed. The 10-fold cross-validation randomly divides the original dataset into 10 subsets. In each test, nine of the 10 subsets are used as training data to build a prediction model, and the remaining data are used to evaluate the model. Finally, we compare our method with several classification algorithms, such as random forest, multilayer perceptron, logistic regression, support vector machine (SVM) and REPTree. All stages of classification (training and modeling) are implemented through the Weka data mining package.
4. Experiment and Evaluation
In the experiment, we have a total of seven methods to select attribute sets, and a total of six algorithms to build models. The attribute set selection algorithm includes all attributes, PC, CS, IG, RF, OR and SU. The six algorithms for building models include support vector machines, logistic regression, neural networks, random forest and REPTree and ensemble models. In Study 1, we observed the performance of the model constructed using all variables. In Study 2, we observed the performance of models constructed using variables selected by PC, CS, IG, RF, OR and SU, respectively. Finally, in Study 3, we observed the performance of models built using variables from four aspects: usefulness, credibility, information quality and credibility.
4.1. Study 1: Using All 41 Predictive Variables
In this experiment, we used all 41 variables to build the model. The average accuracy of all algorithms is around 65%, and the accuracy of the ensemble model proposed in this study can reach 71% (See the “All features” column of
Table 4).
4.2. Study 2: Using Pearson Correlation Analysis and Five Feature Subset Selection Methods, Respectively
4.2.1. Correlation Analysis (PC)
Table 5 shows the Pearson correlation value of each feature. According to the analysis results, important attributes are f1, f10, f11, f14, f15, f16, f17, f18, f19, f20, f21, f26, f32, f34, f35, f36, f38, f39 and f40.
From the results of these significant variables, it can be found that these belong to four categories related to reviews (RC, RA, PD, AR). In the variable field selected in this study, each category has factors that influence purchase intention. f14 (the degree to which product features are mentioned), f38 (the level in the website), f20 (the time of the comment release), f32 (there is more identity disclosure) and f11 (the number of photos) are the top five significant variables, which are considered as the primary potential predictor variables in this study to reflect variations in influence between different reviews. From the results of important attributes, we can observe that whether this review cuts into the topic and describes relevant features may be the first thing readers should pay attention to. Whether there is more identity disclosure may be a mechanism for readers to determine authenticity, and the ranking of reviewers in the website will also have an impact on the influence of reviews. Among them, in particular, f20 is a negative correlation variable. We found that the longer the comment is posted, the more the impact of the comment will decrease, regardless of the identity and level of the commenter. This is also in line with the timeliness of the concept of information quality. In addition, among other influencing variables, f15 (the degree of deviation from the average score) and f16 (the degree of deviation between the score and the extreme score) are also negatively correlated variables. Both f15 and f16 are indicators of consistency, and both observe the degree of difference between variables. It can be seen from this that the greater the difference, the lower the degree of consistency and the smaller the impact. As explained by Russo et al. [
68], when someone chooses between two options, he/she may distort the new information to support any one option that is temporarily preferred. For example, information that meets predetermined preferences in the assessment will be considered more useful. In addition, combined with the significant variables selected through Pearson correlation analysis, the accuracy of the model proposed in this study can reach 75% (see the PC column in
Table 4).
4.2.2. CfsSubsetEval Filtering Method (CF)
In the CfsSubsetEval (CF) filtering method, we chose BestFirst and Greedy Stepwise as the search methods. The variables selected by the BestFirst method are f10, f14, f15, f20, f32, f37 and f41. These variables represent the number of opinion words, the degree of relevance, the degree of deviation from the average score, timeliness, any disclosure, number of fans and total votes. On the other hand, the variables selected by the greedy stepwise method are f14, f15, f20, f32, f37 and f41, which, respectively, indicate the degree of relevance, deviation of product ratings of reviews, timeliness, any disclosure, fans and total votes. In our Ensemble model, the accuracy of the BestFirst method is 75.33%, while the accuracy of Greedy Stepwise is 77.33% (see the “CF” column in
Table 4). It can be found from the results that the variable set selected using the greedy stepwise method as the search method has better modeling accuracy.
4.2.3. InfoGainAttributeEval (IG) Filtering Method
Based on the results of this attribute evaluation algorithm, we use the rank method to select attributes with a value greater than 0. There are 16 variables in descending order: f14, f38, f20, f39, f41, f37, f32, f34, f36, f1, f40, f11, f15, f16, f30 and f17. Then, we input different numbers of variables (large to small) into the ensemble model. From the test results, we found that when the last selected variable is variable f32, the accuracy can reach 79% (see the IG column in
Table 4), which is the highest point in all results. Therefore, we used these seven variables as the attribute filtering results of InfoGainAttributeEvaluation (IG): f14, f38, f20, f39, f41, f37 and f32, respectively, representing the degree of relevance, reviewer rank, how long this comment has been published, number of badges, total votes, followers and any disclosure.
4.2.4. SymmetricalUncertattributeEval (SU) Filtering Method
Similarly, in this attribute evaluation method, we sort the attributes whose result value is greater than zero according to the filtering result of the SU algorithm, and then use different numbers of attributes as the input of the ensemble model in order from large to small. The results show that when eighth attributes are used, the best performance of the model is 77.67% (see the “SU” column in
Table 4). Therefore, we used the variable set f14, f37, f41, f20, f39, f32, f36 and f38 as the result of this attribute filtering method. These variables represent relevance, number of followers, total votes, timeliness, number of badges, any disclosure, contribution and reviewer rank.
4.2.5. ReliefFAttributeEval (RF) Filtering Method
In the fifth attribute evaluation method, we first sort the variables according to the results, and then test each variable combination separately from the maximum value to the minimum value. Based on the ensemble model we proposed, we found that when we acquire the variables before the 17th variable (f29), we can achieve the best performance of 75.33% (see the “RF” column in
Table 4), so we will use f32, f38, f14, f17, f15, f28, f10, f13, f16, f26, f20, f23, f30, f33, f11, f24 and f29 as the variable set of this filtering algorithm, which represents any disclosure, degree of relevance, gender, reviewer rank, the rating of review, degree of deviation from average score, number of photos, number of opinion words, timeliness, join years, value score, age rank, average rating, food score, the polarity of title, degree of deviation between score and extreme score and most frequently rated score.
4.2.6. OneRAttributeEval (OR) Filtering Method
In the last attribute evaluation method, we also first sorted the variables according to the algorithm result, and then used different combinations of variables from large to small as the input of the ensemble model. When the last included variable is f33, the results show that the combination of the 16 variables is the most accurate with 72% (see the “OR” column in
Table 4), so we chose to use the top 16 variable set as the result of the OR method. The selected variables are f14, f32, f38, f11, f37, f15, f1, f19, f18, f39, f27, f23, f24, f25, f17 and f33, respectively, representing degree of relevance, any disclosure, reviewer rank, number of photos, number of followers, degree of deviation from average score, total number of words, total number of responses, any response, number of badges, atmosphere score, average rating, food score, service score, the points of this review and average rating.
After finishing the experiment of study 2, we analyzed the results. From
Table 6 and
Table 7 below, we can find that f14 and f32 are the only two variables that commonly appear in the Pearson correlation analysis and the five attribute evaluation methods. They are “relevance” and “any disclosure,” and we also consider these two variables as the main potential impact characteristics in the significant analysis. It can be considered that the degree of mention of product characteristics and the existence of identity exposure are the key factors that arouse widespread readers’ attention. Next, there are two variables that were selected five times, namely f20 (timeliness) and f38 (reviewer rank). From the results of feature filtering, we can find that readers not only pay attention to the content of the review itself, but also refer to the identity of the author of the review to influence their decisions. In addition, the selected high frequency variables are f15 (degree of deviation from the average score), f37 (number of followers) and f39 (number of badges). Among them, in the Pearson correlation analysis, f37 is an insignificant variable. In the influence analysis, this variable was not significantly correlated. Of all the reviews we collected, most reviewers do not have too many followers, and only a few have many followers. Therefore, it may be difficult to determine the importance of this feature for the dataset. However, if a reviewer has more followers, it can actually indirectly affect the reviewer’s reputation on the website, thereby affecting the ranking of its reviewers.
In addition, in the Pearson correlation analysis, f11 (number of photos) was among the top five potential influence variables but was selected only twice among the five attribute filtering algorithms. In the process of tagging a data set, the presence or absence of photos does have an impact. When the coders were asked to tag the dataset, the three coders almost paid more attention to the reviews with photos and increased the degree of discussion. It can be inferred that photos are also a key factor. However, due to the limited number of photos that can be uploaded in each review, there are not many reviews with photos. Therefore, although f11 is a less influential variable in terms of analysis, in reality it may have some degree of influence.
4.2.7. Experiment Results of Study 2
The experiments in Study 2 applied the six algorithms to the variable sets selected by the six attribute selection methods.
Table 4 shows the accuracy results of all these combinations.
From each entry in
Table 4, we can see the accuracy of the combination of algorithm and feature selection method. For example, the best performance can be achieved by combining the Ensemble algorithm with the IG feature selection method, while the worst performance is achieved when the REPTree algorithm is combined with the OR data selection method.
From each row in
Table 4, we can observe the average performance of all six different algorithms. The results in
Table 4 show that the best performing algorithm is the Ensemble algorithm, followed by SVM, multi-layer perceptron, random forest, logistic regression and finally REPTree. In fact, in all datasets, the performance of the Ensemble algorithm is superior to that of the other five algorithms. This phenomenon shows that the Ensemble algorithm is not only effective but also robust. According to their performance, these six algorithms can be further divided into three categories. The first group consists of just the Ensemble algorithm. The second group includes SVM, multi-layer perceptron and random forest, due to their similar accuracy. The last group contains two algorithms, logistic regression and REPTree; their performance is very poor.
From each column of
Table 4, we can observe the average performance of all six feature selection methods. The results in
Table 4 indicate that the best feature selection method is IG and the worst is OR. In fact, the performance of OR is not as good as the method using all 41 variables, as shown in
Table 4. From
Table 6, we see that IG uses only eight variables, while OR uses 16 variables. This comparison shows that using too many redundant variables can adversely affect model performance. A very interesting finding is that the three best data selection methods in
Table 4 are IG, SU and CF. As shown in
Table 6, these three methods use the least number of variables to build the model (respectively, 8, 9 and 7 variables). This phenomenon shows that it is better to use fewer but important variables than to use more but redundant variables.
In addition to the accuracy indicators, we also used other indicators to measure the effectiveness of these combinations. Other indicators include accuracy, recall rate, F1 measure and ROC area.
Table 8 shows the average performance of five indicators of six different classification algorithms, while
Table 9 shows the average performance of five indicators of six different feature selection algorithms. Since the results of these two tables are similar to those of
Table 4, we will omit their discussion.
4.3. Study 3: For the Four Prediction Facets
In Study 3, we used four important theoretical aspects (helpfulness, credibility, information quality and professionalism) as the input variable combination of the ensemble model. In other words, when we used helpfulness as input to predict the target variable, the 24 variables listed in the helpfulness aspect in
Table 1 was used as the input variables for model building. The results are shown in
Table 10.
The highest accuracy ensemble model in this study is a combination of variables selected by IG, and its accuracy can be close to 79%. The selected variables (f14, f38, f20, f39, f41, f37, f32) are completely related to the four theoretical aspects proposed in this study. Among them, according to
Table 1, f14 and f32 are applicable to helpfulness. f14, f38, f39, f41, f37 and f32 are in line with the credibility. From the perspective of information quality, the fitting variables are f14, f38, f20, f39, f41 and f37. In the last aspect of professionalism, there are f38, f39, f41, f37 and f32.
Table 10 shows the analysis results with four theoretical aspects. From the data, we can see that information quality (IQ) is the most accurate model, followed by credibility. Surprisingly, the accuracy of the helpfulness dimension is the lowest. However, no matter which aspect is used, its performance is more than 10% lower than that of the model built on all four aspects. Through the experiment of Study 3, we can prove that the previous literature discussing several important aspects of e-commerce is not enough to fully represent the influence on purchasing intention. This also shows that from the perspective of readers and consumers, the impact on purchase intention is not the same as that on helpfulness, credibility, information quality and professionalism. Therefore, our research proves that predicting the purchase intention from all aspects together can achieve a good influence assessment.
5. Conclusions
This study proposes a method to assess the impact of product reviews based on the four important theoretical aspects of reviews in the field of e-commerce, namely help-fulness, credibility, information quality and professionalism. We adopted feature filtering algorithms (CF, IG, RF, OR, SU) and proposed an ensemble model to integrate these classification results to obtain the most accurate prediction. The results showed that the accuracy of the ensemble model can reach 79%. Furthermore, we also conducted experiments on these four theoretical aspects separately. As a result, it was confirmed that the important aspects of e-commerce discussed in the previous literature were not sufficient to fully represent the influence. From the perspective of consumers, the impact on purchase intention is different from the meaning or degree of usefulness, credibility, information quality or professionalism, but these are indeed interrelated. It was found that the results of the analysis help to clarify the relationship between these factors and help us to understand which kind of comment has influences on purchasing intention.
The products we chose are experienced products, not credence or search goods, so the basis and perception of readers when viewing reviews and making decisions may vary. In addition, the age and nationality of the reviewers will also affect readers’ feelings. In the future, we may be able to consider more factors and check the correlation between more variables and filters to improve the accuracy of the system and conduct a more comprehensive analysis.
Author Contributions
Conceptualization, Y.-L.C., C.-L.C. and A.-Q.S.; methodology, Y.-L.C., C.-L.C. and A.-Q.S.; resources, Y.-L.C.; writing—original draft, Y.-L.C., C.-L.C. and A.-Q.S.; writing—review and editing, Y.-L.C. and C.-L.C.; supervision, Y.-L.C.; project administration, Y.-L.C. and C.-L.C.; funding acquisition, Y.-L.C.; software, C.-L.C. and A.-Q.S.; investigation, Y.-L.C., C.-L.C. and A.-Q.S.; data curation, C.-L.C. All authors have read and agreed to the published version of the manuscript.
Funding
This research received no external funding.
Institutional Review Board Statement
Not applicable.
Informed Consent Statement
Not applicable.
Data Availability Statement
The data presented in this study are available on request from the corresponding author.
Conflicts of Interest
The authors declare no conflict of interest.
References
- Murphy, R. Local Consumer Review Survey. Available online: https://www.brightlocal.com/research/local-consumer-review-survey/ (accessed on 10 June 2021).
- De Bruyn, A.; Lilien, G.L. A multi-stage model of word-of-mouth influence through viral marketing. Int. J. Res. Mark. 2008, 25, 151–163. [Google Scholar] [CrossRef]
- Hou, T.; Yannou, B.; Leroy, Y.; Poirson, E. Mining customer product reviews for product development: A summarization process. Expert Syst. Appl. 2019, 132, 141–150. [Google Scholar] [CrossRef]
- Baek, J.; Choe, Y. Differential Effects of the Valence and Volume of Online Reviews on Customer Share of Visits: The Case of US Casual Dining Restaurant Brands. Sustainability 2020, 12, 5408. [Google Scholar] [CrossRef]
- Chevalier, J.A.; Mayzlin, D. The Effect of Word of Mouth on Sales: Online Book Reviews. J. Mark. Res. 2006, 43, 345–354. [Google Scholar] [CrossRef]
- Tellis, G.J.; Johnson, J. The Value of Quality. Mark. Sci. 2007, 26, 758–773. [Google Scholar] [CrossRef]
- Vidanagama, D.U.; Silva, T.P.; Karunananda, A.S. Deceptive consumer review detection: A survey. Artif. Intell. Rev. 2019, 53, 1323–1352. [Google Scholar] [CrossRef]
- Ghose, A.; Ipeirotis, P. Estimating the Helpfulness and Economic Impact of Product Reviews: Mining Text and Reviewer Characteristics. IEEE Trans. Knowl. Data Eng. 2011, 23, 1498–1512. [Google Scholar] [CrossRef]
- Korfiatis, N.; García-Bariocanal, E.; Sánchez-Alonso, S. Evaluating content quality and helpfulness of online product reviews: The interplay of review helpfulness vs. review content. Electron. Commer. Res. Appl. 2012, 11, 205–217. [Google Scholar] [CrossRef]
- Cheung, C.M.-Y.; Sia, C.-L.; Kuan, K.K. Is this review believable? A study of factors affecting the credibility of online consumer reviews from an ELM perspective. J. Assoc. Inf. Syst. 2012, 13, 618. [Google Scholar] [CrossRef]
- Savolainen, R. Judging the quality and credibility of information in Internet discussion forums. J. Am. Soc. Inf. Sci. Technol. 2011, 62, 1243–1256. [Google Scholar] [CrossRef]
- Park, D.-H.; Kim, S. The effects of consumer knowledge on message processing of electronic word-of-mouth via online con-sumer reviews. Electron. Commer. Res. Appl. 2008, 7, 399–410. [Google Scholar] [CrossRef]
- Filieri, R.; McLeay, F.; Tsui, B.; Lin, Z. Consumer perceptions of information helpfulness and determinants of purchase intention in online consumer reviews of services. Inf. Manag. 2018, 55, 956–970. [Google Scholar] [CrossRef]
- Salehan, M.; Kim, D.J. Predicting the performance of online consumer reviews: A sentiment mining approach to big data analytics. Decis. Support Syst. 2016, 81, 30–40. [Google Scholar] [CrossRef]
- Ngo-Ye, T.L.; Sinha, A.P.; Sen, A. Predicting the helpfulness of online reviews using a scripts-enriched text regression model. Expert Syst. Appl. 2017, 71, 98–110. [Google Scholar] [CrossRef]
- Lee, S.; Choeh, J.Y. Predicting the helpfulness of online reviews using multilayer perceptron neural networks. Expert Syst. Appl. 2014, 41, 3041–3046. [Google Scholar] [CrossRef]
- Hu, M.; Liu, B. Mining opinion features in customer reviews. AAAI 2004, 4, 755–760. [Google Scholar]
- Yin, D.; University of Missouri; Bond, S.D.; Zhang, H. Georgia Institute of Technology Anxious or Angry? Effects of Discrete Emotions on the Perceived Helpfulness of Online Reviews. MIS Q. 2014, 38, 539–560. [Google Scholar] [CrossRef]
- Zheng, X.; Zhu, S.; Lin, Z. Capturing the essence of word-of-mouth for social commerce: Assessing the quality of online e-commerce reviews by a semi-supervised approach. Decis. Support Syst. 2013, 56, 211–222. [Google Scholar] [CrossRef]
- Zhao, Y.; Yang, S.; Narayan, V.; Zhao, Y. Modeling consumer learning from online product reviews. Mark. Sci. 2013, 32, 153–169. [Google Scholar] [CrossRef]
- Lee, J.; Park, D.; Han, I. The different effects of online consumer reviews on consumers’ purchase intentions depending on trust in online shopping malls. Internet Res. 2011, 21, 187–206. [Google Scholar] [CrossRef]
- Jia, Y.; Liu, I.L. Do consumers always follow “useful” reviews? The interaction effect of review valence and review usefulness on consumers’ purchase decisions. J. Assoc. Inf. Sci. Technol. 2018, 69, 1304–1317. [Google Scholar] [CrossRef]
- Gao, J.; Zhang, C.; Wang, K.; Ba, S. Understanding online purchase decision making: The effects of unconscious thought, information quality, and information quantity. Decis. Support Syst. 2012, 53, 772–781. [Google Scholar] [CrossRef]
- Zhou, W.; Duan, W. Do Professional Reviews Affect Online User Choices Through User Reviews? An Empirical Study. J. Manag. Inf. Syst. 2016, 33, 202–228. [Google Scholar] [CrossRef]
- Li, M.; Huang, L.; Tan, C.H.; Wei, K.K. Helpfulness of Online Product Reviews as Seen by Consumers: Source and Content Features. Int. J. Electron. Commer. 2013, 17, 101–136. [Google Scholar] [CrossRef]
- Sipos, R.; Ghosh, A.; Joachims, T. Was this review helpful to You? It depends! Context and voting patterns in online content. In Proceedings of the 23rd International Conference on World Wide Web, Seoul, Korea, 7–11 April 2014; pp. 337–348. [Google Scholar]
- Hu, Y.-H.; Chen, K. Predicting hotel review helpfulness: The impact of review visibility, and interaction between hotel stars and review ratings. Int. J. Inf. Manag. 2016, 36, 929–944. [Google Scholar] [CrossRef]
- Park, Y.-J. Predicting the Helpfulness of Online Customer Reviews across Different Product Types. Sustainability 2018, 10, 1735. [Google Scholar] [CrossRef]
- Lee, S.; Lee, K.; Choeh, J. Using Bayesian Network to Predict Online Review Helpfulness. Sustainability 2020, 12, 6997. [Google Scholar] [CrossRef]
- Gupta, P.; Harris, J. How e-WOM recommendations influence product consideration and quality of choice: A motivation to process information perspective. J. Bus. Res. 2010, 63, 1041–1049. [Google Scholar] [CrossRef]
- Mudambi, S.M.; Schuff, D. Research Note: What Makes a Helpful Online Review? A Study of Customer Reviews on Amazon.com. MIS Q. 2010, 34, 185. [Google Scholar] [CrossRef]
- Racherla, P.; Friske, W. Perceived ‘usefulness’ of online consumer reviews: An exploratory investigation across three services categories. Electron. Commer. Res. Appl. 2012, 11, 548–559. [Google Scholar] [CrossRef]
- Almutairi, Y.; Abdullah, M.; Alahmadi, D. Review Helpfulness Prediction: Survey. Period. Eng. Nat. Sci. 2019, 7, 420–432. [Google Scholar] [CrossRef]
- Liu, Z.; Park, S. What makes a useful online review? Implication for travel product websites. Tour. Manag. 2015, 47, 140–151. [Google Scholar] [CrossRef]
- Cheung, M.Y.; Luo, C.; Sia, C.L.; Chen, H. Credibility of Electronic Word-of-Mouth: Informational and Normative Determinants of On-line Consumer Recommendations. Int. J. Electron. Commer. 2009, 13, 9–38. [Google Scholar] [CrossRef]
- Kusumasondjaja, S.; Shanka, T.; Marchegiani, C. Credibility of online reviews and initial trust: The roles of reviewer’s identity and review valence. J. Vacat. Mark. 2012, 18, 185–195. [Google Scholar] [CrossRef]
- Jensen, M.L.; Averbeck, J.M.; Zhang, Z.; Wright, K.B. Credibility of Anonymous Online Product Reviews: A Language Expectancy Perspective. J. Manag. Inf. Syst. 2013, 30, 293–324. [Google Scholar] [CrossRef]
- Luo, C.; Luo, X.; Xu, Y.; Warkentin, M.; Sia, C.L. Examining the moderating role of sense of membership in online review evaluations. Inf. Manag. 2015, 52, 305–316. [Google Scholar] [CrossRef]
- Gunawan, D.D.; Huarng, K.-H. Viral effects of social network and media on consumers’ purchase intention. J. Bus. Res. 2015, 68, 2237–2241. [Google Scholar] [CrossRef]
- Wee, C.H.; Lim, S.L.; Lwin, M. Word-of-mouth Communication in Singapore: With Focus on Effects of Message-sidedness, Source and User-type. Asia Pac. J. Mark. Logist. 1995, 7, 5–36. [Google Scholar] [CrossRef]
- Smith, R.E.; Vogt, C.A. The effects of integrating advertising and negative word-of-mouth communications on message pro-cessing and response. J. Consum. Psychol. 1995, 4, 133–151. [Google Scholar] [CrossRef]
- Zhang, W.; Watts, S. Knowledge Adoption in Online Communities of Practice. Syst. Inform. Manag. 2016, 21, 67–88. [Google Scholar] [CrossRef]
- Weiner, B. Attributional Thoughts about Consumer Behavior. J. Consum. Res. 2000, 27, 382–387. [Google Scholar] [CrossRef]
- Deutsch, M.; Gerard, H.B. A study of normative and informational social influences upon individual judgment. J. Abnorm. Soc. Psychol. 1955, 51, 629–636. [Google Scholar] [CrossRef]
- Xie, H.J.; Miao, L.; Kuo, P.-J.; Lee, B.-Y. Consumers’ responses to ambivalent online hotel reviews: The role of perceived source credibility and pre-decisional disposition. Int. J. Hosp. Manag. 2011, 30, 178–183. [Google Scholar] [CrossRef]
- Forman, C.; Ghose, A.; Wiesenfeld, B. Examining the Relationship Between Reviews and Sales: The Role of Reviewer Identity Disclosure in Electronic Markets. Inf. Syst. Res. 2008, 19, 291–313. [Google Scholar] [CrossRef]
- Atika, A.; Kusumawati, A.; Iqbal, M. The effect of electronic word of mouth, message source credibility, information quality on brand image and purchase intention. EKUITAS J. Ekon. Dan Keuang. 2017, 20, 94–108. [Google Scholar] [CrossRef][Green Version]
- Rieh, S.Y. Judgment of information quality and cognitive authority in the Web. J. Am. Soc. Inf. Sci. Technol. 2002, 53, 145–161. [Google Scholar] [CrossRef]
- Chua, A.; Banerjee, S. Helpfulness of user-generated reviews as a function of review sentiment, product type and information quality. Comput. Hum. Behav. 2016, 54, 547–554. [Google Scholar] [CrossRef]
- Chen, C.C.; Tseng, Y.-D. Quality evaluation of product reviews using an information quality framework. Decis. Support Syst. 2011, 50, 755–768. [Google Scholar] [CrossRef]
- Lee, E.-J.; Shin, S.Y. When do consumers buy online product reviews? Effects of review quality, product type, and reviewer’s photo. Comput. Hum. Behav. 2014, 31, 356–366. [Google Scholar] [CrossRef]
- Rieh, S.Y.; Belkin, N. In Interaction on the Web: Scholars’ judgement of information quality and cognitive authority. In Proceedings of the Annual Meeting-American Society for Information Science, Chicago, IL, USA, 12–16 November 2000; Information Today: Medford, NY, USA, 2000; pp. 25–38. [Google Scholar]
- Racherla, P.; Mandviwalla, M.; Connolly, D.J. Factors affecting consumers’ trust in online product reviews. J. Consum. Behav. 2012, 11, 94–104. [Google Scholar] [CrossRef]
- Amblee, N.; Bui, T. Freeware Downloads: An Empirical Investigation into the Impact of Expert and User Reviews on Demand for Digital Goods. AMCIS 2007 Proc. 2007, 21. Available online: https://aisel.aisnet.org/cgi/viewcontent.cgi?article=1531&context=amcis2007 (accessed on 3 July 2021).
- Cox, J.; Kaimann, D. How do reviews from professional critics interact with other signals of product quality? Evidence from the video game industry. J. Consum. Behav. 2015, 14, 366–377. [Google Scholar] [CrossRef]
- Mackiewicz, J. Assertions of Expertise in Online Product Reviews. J. Bus. Tech. Commun. 2009, 24, 3–28. [Google Scholar] [CrossRef]
- Jameson, D.A. Narrative Discourse and Management Action. J. Bus. Commun. 2001, 38, 476–511. [Google Scholar] [CrossRef]
- Lin, C.; Wu, Y.S.; Chen, J.-C.V. Electronic word-of-mouth: The moderating roles of product involvement and brand image. TIIM 2013 Proc. 2013, 43, 39–47. [Google Scholar]
- Huang, J.-H.; Chen, Y.-F. Herding in online product choice. Psychol. Mark. 2006, 23, 413–428. [Google Scholar] [CrossRef]
- Cheung, C.M.; Lee, M.K.; Rabjohn, N. The impact of electronic word-of-mouth: The adoption of online opinions in online customer communities. Internet Res. Electron. Netw. Appl. Policy 2008, 18, 229–247. [Google Scholar] [CrossRef]
- O’Connor, R.E.; Bell, K.M.; Harty, K.R.; Larkin, L.K.; Sackor, S.M.; Zigmond, N. Teaching reading to poor readers in the in-termediate grades: A comparison of text difficulty. J. Educ. Psychol. 2002, 94, 474. [Google Scholar] [CrossRef]
- Flesch, R. A new readability yardstick. J. Appl. Psychol. 1948, 32, 221. [Google Scholar] [CrossRef] [PubMed]
- Kincaid, J.P.; Fishburne, R.P., Jr.; Rogers, R.L.; Chissom, B.S. Derivation of New Readability Formulas (Automated Readability Index, Fog Count and Flesch Reading Ease Formula) for Navy Enlisted Personnel; Naval Technical Training Command Millington TN Research Branch: Millington, TN, USA, 1975. [Google Scholar]
- Mc Laughlin, G.H. SMOG grading-a new readability formula. J. Read. 1969, 12, 639–646. [Google Scholar]
- Tsao, W.-C.; Hsieh, M.-T. eWOM persuasiveness: Do eWOM platforms and product type matter? Electron. Commer. Res. 2015, 15, 509–541. [Google Scholar] [CrossRef]
- Paek, T.; Gamon, M.; Counts, S.; Chickering, D.M.; Dhesi, A. Predicting the importance of newsfeed posts and social network friends. In Proceedings of the Twenty-Fourth AAAI Conference on Artificial Intelligence, Atlanta, GA, USA, 11–15 July 2010. [Google Scholar]
- Bian, J.; Liu, Y.; Zhou, D.; Agichtein, E.; Zha, H. Learning to recognize reliable users and content in social media with coupled mutual reinforcement. In Proceedings of the 18th International Conference on Supporting Group Work, Sanibel Island, FL, USA, 10 May 2009; Association for Computing Machinery (ACM): New York, NY, USA, 2009; pp. 51–60. [Google Scholar]
- Russo, J.E.; Meloy, M.G.; Medvec, V.H. Predecisional distortion of product information. J. Mark. Res. 1998, 35, 438–452. [Google Scholar] [CrossRef]
| Publisher’s Note: MDPI stays neutral with regard to jurisdictional claims in published maps and institutional affiliations. |
© 2021 by the authors. Licensee MDPI, Basel, Switzerland. This article is an open access article distributed under the terms and conditions of the Creative Commons Attribution (CC BY) license (https://creativecommons.org/licenses/by/4.0/).


