1. Introduction
Clarifying CO
2 reduction responsibility of transportation is of considerable significance to global climate change and completing global CO
2 reduction objectives. CO
2 emissions of transportation take a large proportion in numerous regions of the world. The largest sources of transportation-related CO
2 emissions include passenger cars, medium- and heavy-duty trucks, and light-duty trucks, including sport utility vehicles, pickup trucks, and minivans. These sources account for over half of the emissions from transportation. The remaining emissions from transportation come from other modes of transportation, including commercial aircraft, ships, boats, and trains, as well as pipelines and lubricants. It was estimated that by 2018, U.S. transportation would attain 28% of CO
2 emissions, surpassing the power sector (27%) and developing into the largest CO
2 emissions in the United States [
1]. Similarly, in the fuel type composition in FY 2017, gasoline contained in fuel oil took up the largest share (54%), followed by light oil (26%) and electricity consumed by railroad (11%). Furthermore, as of 2018, CO
2 emissions from transportation rose to 17% of total emissions in Tokyo, Japan [
2]. As the most populous region in Greece, Attica emits 40% of the domestic CO
2 emissions of transportation [
3]. In China, the largest carbon emitter around the world, CO
2 emissions of transportation obtained second place among six major sectors, and its energy consumption growth rate seeded first among six major sectors [
4]. The further rise in total CO
2 emissions would be effectively controlled by CO
2 reduction from transportation, and macro-control policy is one of the basic measures on CO
2 reduction [
5,
6]. Emerging countries in Southeast Asia have also issued corresponding policies to cope with the increase in the number of motor vehicles and their negative impacts on air quality, transportation, energy security, livability, and greenhouse gas emissions [
7]. In Dublin, Republic of Ireland, research shows that people prefer self-driving vehicles with clean fuel, and urban transport policies can leverage people’s attitudes to promote sustainable urban transport [
8]. A study in a specific area of Rzeszow, Poland, shows that converting 25% of existing vehicles into electric vehicles can reduce PM
10 emissions by about 30% [
9]. In addition, with the increase in the proportion of electric vehicles, it is considerable to optimize the location planning and design of electric vehicle charging stations (EVCS
S). Reasonable EVCS
S can greatly increase the number of electric vehicles in circulation [
10]. Although the analytic hierarchy process and the spatial geographic analysis method can optimize the site selection of EVCS
S, it still needs the support of relevant policies in the implementation process. Therefore, the development of relevant policies is necessary for transportation CO
2 emissions. However, traditional macro-control policies lack consideration of the responsibility for CO
2 reduction transferred during transportation [
11]. Thus, ascertaining reduction responsibilities of different regions is crucial for accomplishing CO
2 reduction objective of transportation.
In the past decades, many scholars have done a number of studies to identify responsibility for CO
2 reduction. Nakano et al. adopted a bilateral trade method to define CO
2 share and solve the carbon trade problem of 17 sectors in 41 countries/regions [
12]. Xu et al. considered the impact of the environmental indirect cost of labor input from the perspective of EOLI and calculated energy demand and CO
2 emission responsibility in Sino-US trade [
13]. For transportation, Wang et al. calculated emission responsibility of transportation in China from 2000 to 2015 based on measured data [
14], and Zhang et al. evaluated CO
2 emission responsibility of private and official cars according to the carbon footprint method [
15]. It seems from these works that researchers have selected different methods to reveal the process of carbon transfers among regions or sectors and clarify responsibility for CO
2 emissions. However, compared with these methods, input–output analysis method is more accurate in quantifying CO
2 transfer implicit in trade. For example, Meng et al. analyzed the characteristics of CO
2 emissions and their impacts on energy intensity in some regions of China by IOA [
16]. Liu et al. improved the IOA model to calculate carbon transfer of local trade and studied carbon transfer and carbon emission responsibilities of 17 sectors in eight major regions of China in 1997 and 2007 [
17]. The IOA method proposed by Leontief in 1936, which could distinguish responsibility of end user by determining the size and direction of indirect emissions embodied in supply chain across geographical boundaries [
18,
19,
20]. Therefore, compared with bilateral trade method and carbon footprint method, IOA is more advantageous in confirming CO
2 import and export volume of various sectors and promoting redistribution of CO
2 emissions; and this method is widely used in the calculation of transfer of CO
2, virtual water, and others [
21]. However, IOA is incapable of solving uncertainty problems. If the accuracy of input data is insufficient, it affects the validity of the calculation result to a certain extent. It is worth mentioning that fuzzy theory may boost the ability to judge information subjectively, which is useful for dealing with uncertainty problems. It combines quantitative analysis with qualitative analysis to reintroduce value judgments into the analysis of human spatial behavior, enabling natural language to be used in scientific and rigorous investigations and extended in geography, economics, mathematics, and other fields [
22].
However, it is indispensable to further illustrate the interaction between each component in the system, but IOA and fuzzy theory is unable to represent relationships between the various components of system [
23]. It is gratifying that the introduction of ENA makes up for the shortcomings and vividly illustrates the internal relationships of the system, which is a system-oriented analysis tool that can deeply understand complex system interactions by researching interdependence between different regions [
24,
25,
26]. This method was applied to study different types of relationships between components by some scholars. In virtue of ENA, Zhang et al. described internal energy transfer relationships between social and economic sectors of Beijing [
27]. Through network control analysis and network utility analysis, ways of virtual water cycle and interrelationships between pairs of departments are revealed by Fang et al. [
28]. Wang et al. established a multi-regional ENA model to explore structural characteristics and inter-departmental interactions within urban agglomeration in the Beijing-Tianjin-Hebei region of China [
29].
Therefore, the objective of this study is to present an ecological network input–output interval fuzzy linear programming (EIFP) method, effectively proposing CO
2 reduction advice for inter-provincial transfers implicit in transportation of China under different energy types. On the basis of EIFP, an inter-provincial transportation energy consumption–carbon linkage model (TECLM) combining IOA, IRFLP, and ENA is established. Respectively, the amount of inter-provincial CO
2 transfer in transportation is quantified by IOA. IRFLP is introduced to represent double uncertainty parameter, and the fault tolerance of data source is greatly reinforced through multiple representations of input data [
30]. ENA visualized relationships of inter-provincial CO
2 transfer under each of energy types. Simulation results are consistent with the emissions of various administrative regions in China, which proves validity and practicability of the framework. The research achievements would provide more valuable suggestions for adjusting CO
2 reduction responsibility of transportation and formulating CO
2 reduction policies.
2. Methods
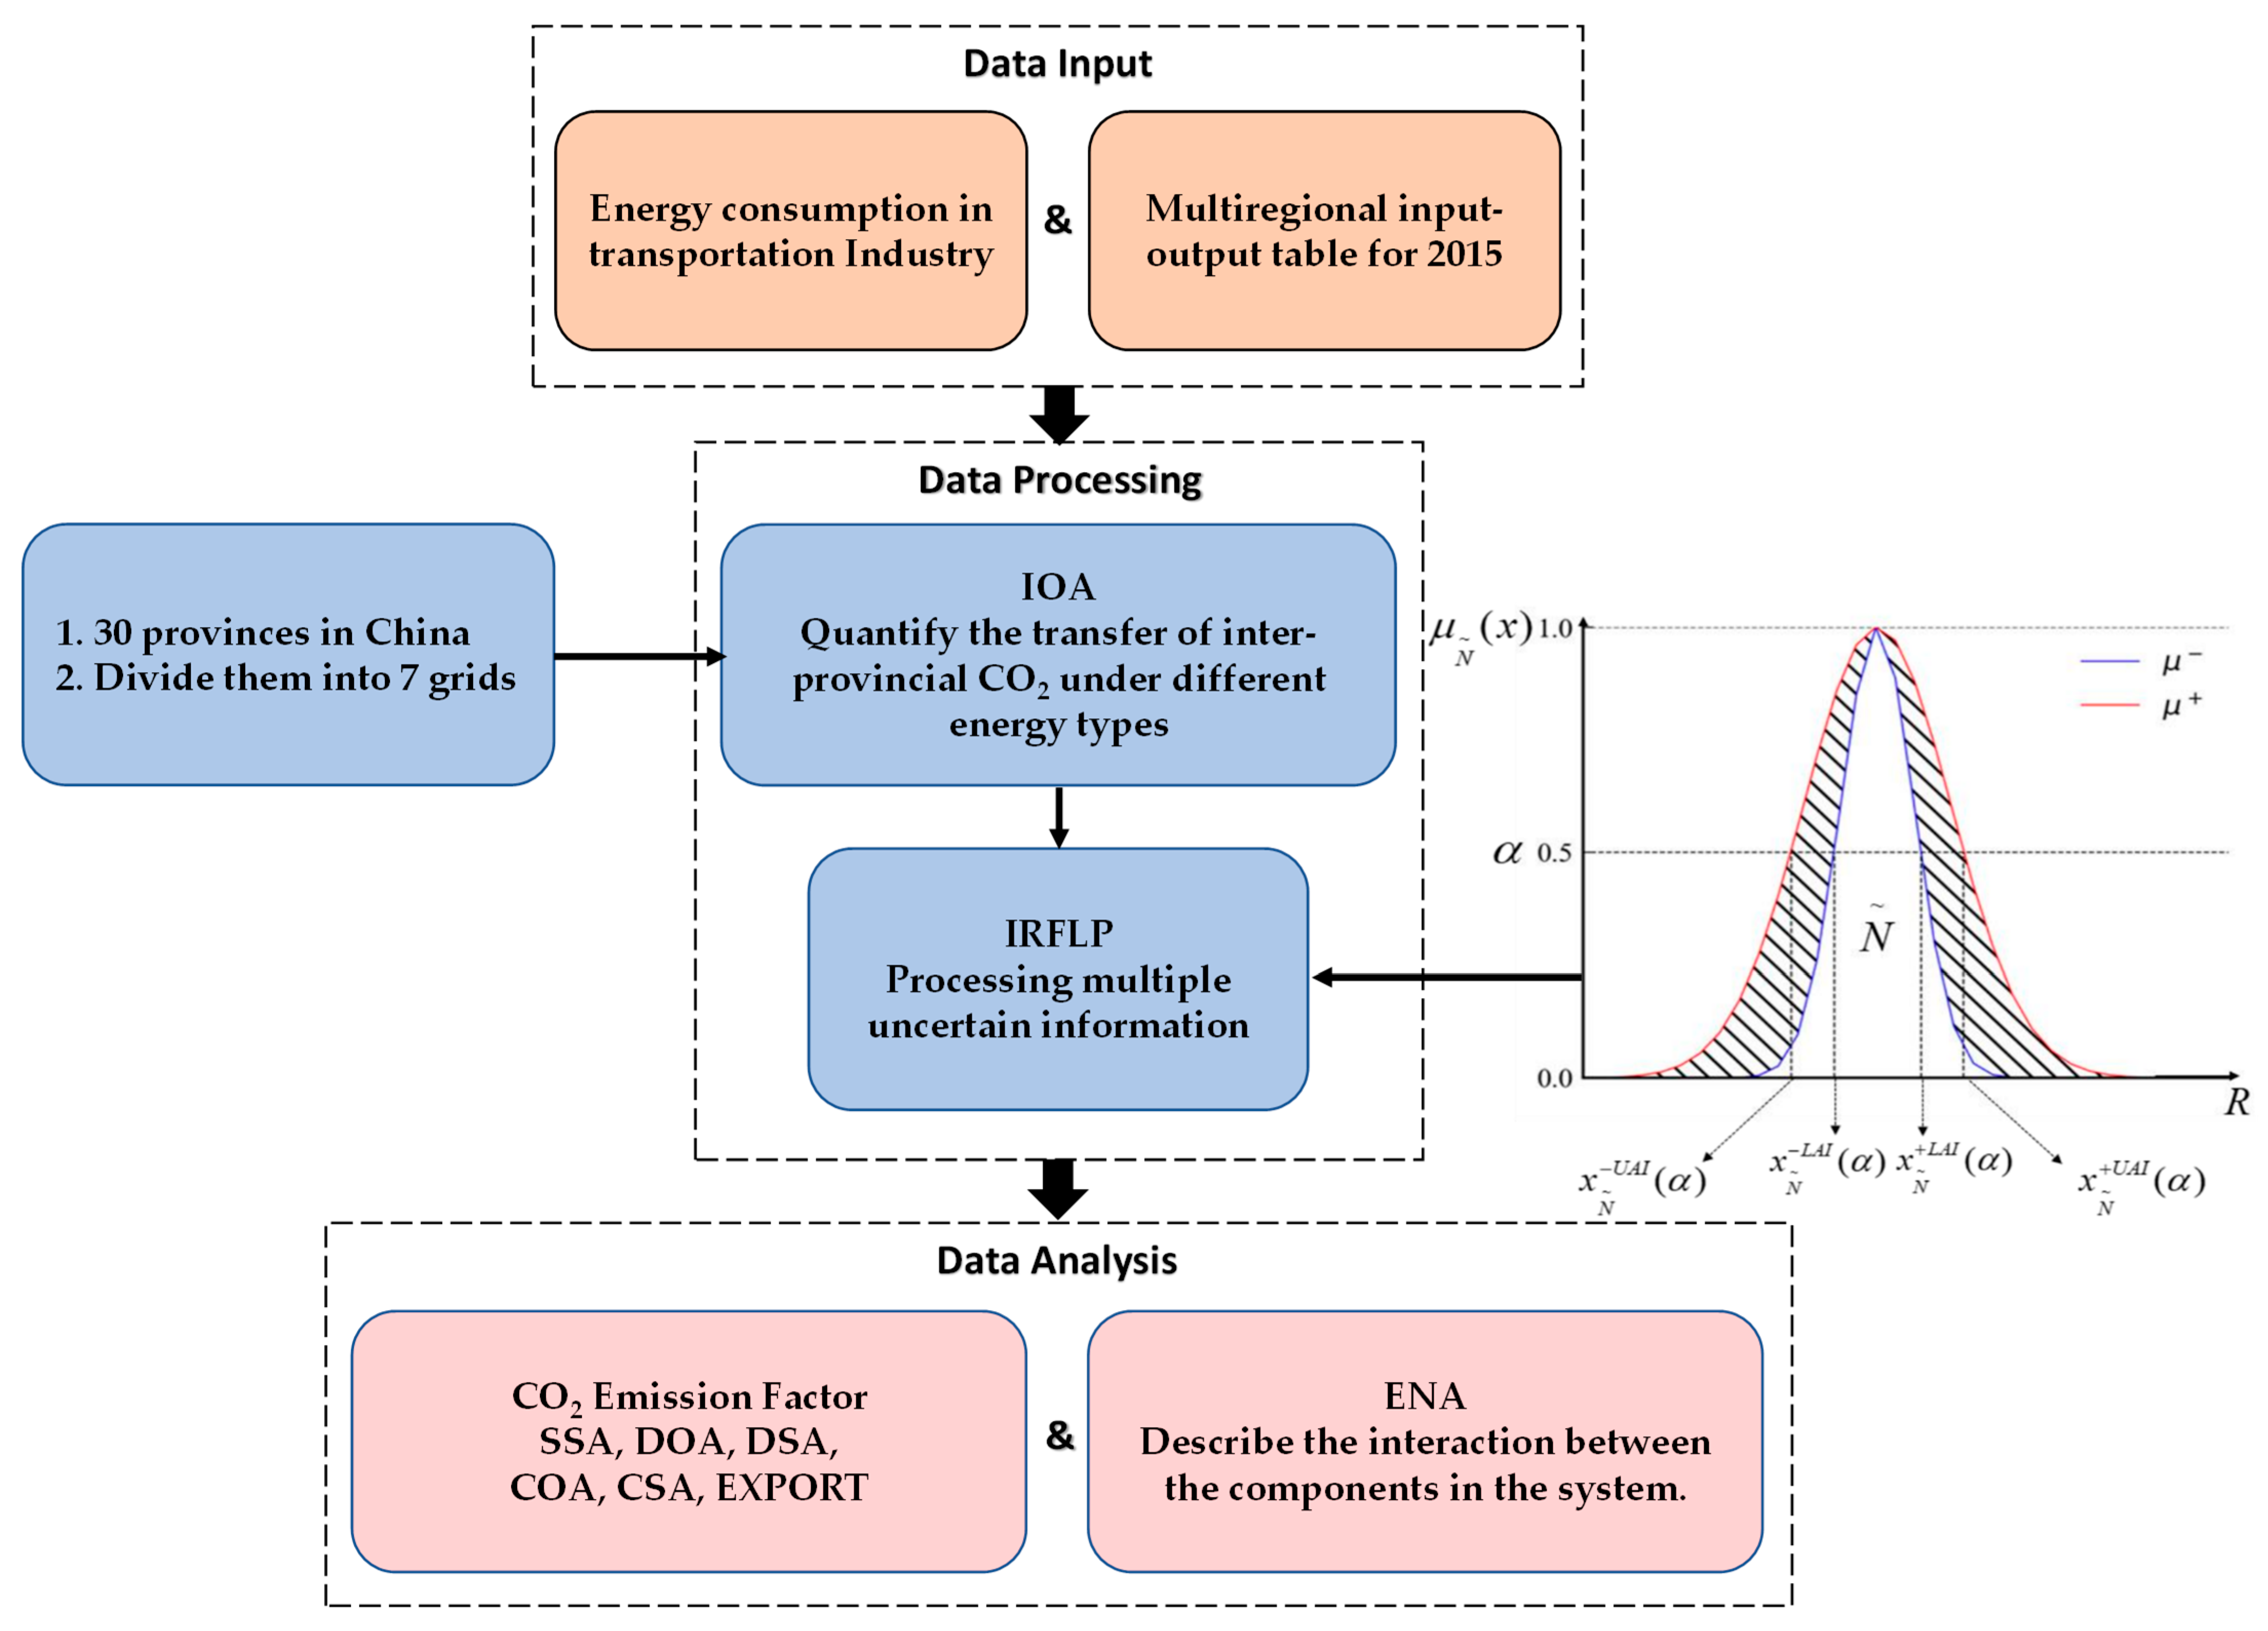
This research designed an ecological network input–output interval fuzzy linear programming (EIFP) method to consider CO
2 reduction responsibilities of 30 provinces in China. The research steps are shown in
Figure 1. After processing, the energy consumption of transportation and the multi-regional input–output table are taken as the input data of this model. The research scope is divided into two categories and calculated by IOA and IRFLP. Finally, the results were inputted into the data analysis section. CO
2 emission factors and ENA were used to analyze the results and draw a conclusion. The first is to quantify inter-provincial CO
2 transfer by applying IOA. It is derived from general equilibrium theory and is a combination of system analysis methods and economic measurement methods. By establishing a linear model, these relationships among economic variables are regarded as linear functional relationships [
31,
32]. In inter-provincial transportation energy consumption–carbon linkage model (TECLM), the total output of each province is equal to the sum of its intermediate demand and the final demand. It can be seen from
Table 1 that the number of provinces in model is
m, and the number of departments in each province is
n. The equation for each row is
The direct input coefficient
, which represents the input of unit currency products produced by sector
i in province
r for sector
j in province
s.
Formula (1) can therefore be transformed into a form containing
, the converted representation is as follows:
The matrix form of input–output model can be expressed as
If this matrix is transformed into a demand-oriented form, it can be expressed as
Then, we can get all the results in . The relationship between final demand and output has been comprehensively shown in this matrix for all provinces.
Then, obtaining a direct energy consumption coefficient is an important step to combine economic trade with energy consumption.
(ton/10 thousand Yuan) refers to the direct energy consumption required to produce a unit product.
Therefore, the virtual energy transfer matrix among provinces can be obtained from the following energy consumption coefficient matrix and total output matrix [
33]:
After the amount of CO
2 transfer among provinces is calculated by IOA, some CO
2 emission factors are established to reflect CO
2 emission responsibility of each province from different perspectives [
34].
Secondly, IRFLP is adopted to characterize the results in a variety of situations. By improving selectivity, the effectiveness of results is enhanced. Generally, IRFLP model is expressed as follows:
To a certain extent, the application of fuzzy interval solves the validity of calculation results when input data are not accurate enough.
The third step is to visualize relationships between components by operating ENA. It is a mathematical method spread to measure the control or advantage of a department over another department in its natural environment [
35,
36]. The interdependence of each element could be obtained by examining the contribution of each element to input and output of other elements [
37]. According to mass balance theory, the sum of CO
2 flows into
ith province should be equal to the sum of flows out of
ith province.
The superscript of
D (ranging from 0 to m) represents path length.
D0 stands for initial flow through each compartment,
D1 for direct utility relationship, and indirect interaction expressed by
Dm (
m > 2).
The interaction mode between these elements can be judged by the sign of each element in matrix
U and matrix
D [
38]. There are four types of utility relations: (+,−) stands for exploitation, (−,+) for exploited, (−,−) for competition, and (+,+) for mutualistic.
5. Conclusions
An ecological network input–output interval fuzzy linear programming (EIFP) method was established to clarify CO2 reduction responsibilities of different regions. Explicitly, this research quantified inter-provincial CO2 transfer of transportation; performed fuzzy processing on each CO2 transfer; and visualized mutual transfer relationships between provinces. On the basis of research results, different CO2 reduction recommendations are offered for different regions. For instance, Beijing should focus on the development of local renewable energy and other emerging energy sources to strengthen the ability to withstand energy crisis. Provinces with greater demand for fossil energy, such as Shandong, should introduce new policies to encourage all walks of life to vigorously develop energy-saving technologies by increasing investment in energy-saving technologies. What is more, input data of TECLM can be changed and applied to various regions. The EIFP method could further help to divide the cross-provincial CO2 reduction responsibility of transportation, which may provide effective theoretical foundation for decision-makers to formulate CO2 reduction policies of transportation in China.
Compared with previous studies, this study innovates the method and introduces inexact rough interval fuzzy linear programming (IRFLP) to enhance the ability to deal with data uncertainty. In addition, in terms of research content, this study adopted the “China Multi-Regional Input–Output Table 2015”, focused on the interprovincial transfer of CO2 in the transportation industry and future development planning, and established a relatively comprehensive modeling framework, which is relatively lacking in previous studies.
The limitations of this study are that it only studied the internal situation of transportation between 30 provinces and 7 regions. In terms of possible future recommendations of the study, we believe that it can be started from two aspects: the first is to expand the scope of research and explore the transfer of CO2 in transportation between countries, and the second is to expand the category of research departments and cross-consider the mutual influence between departments, so as to get better research results.


