Abstract
Since December 2019, the COVID-19 epidemic has been spreading all over the world. This epidemic has brought a risk of death in the daily activity (physical and social) participation that influences travellers’ physical, social, and mental health. To analyze the impact of the COVID-19-induced daily activities on health parameters of higher education institutes, 150 students of the Universiti Teknologi PETRONAS, Perak, Malaysia, were surveyed through an online web survey using random sampling techniques. The data were analyzed through RStudio and SPSS using multilevel linear regression analysis and Hierarchical Structural Equation Modeling. The estimated results indicate that restricting individuals from doing out-of-home activities negatively influences physical and social health. A unit increase in the in-home maintenance activities during the COVID-19 pandemic introduced a daily increase of 0.5% in physical health. Moreover, a unit increase in the in-home activities at leisure time represents a 1% positive improvement in social health. Thus, physical activity has proven to be beneficial in improving physical and social health with severe COVID-19. In contrast, the coefficient of determination (R2) for all endogenous variables ranges from 0.148 to 0.227, which is incredibly acceptable in psychological research. For a healthier society with a better quality of life, this study adopted multidisciplinary approaches that are needed to be designed.
1. Introduction
In December 2019, the severe acute respiratory syndrome coronavirus (SARS-CoV-2) was discovered in Wuhan city, Hubei Province, China, and spread worldwide, almost reaching an unprecedented scale. On 12 January 2020, the World Health Organization (WHO) announced a novel coronavirus disease 2019 and named the disease COVID-19 [1]. The establishments in Wuhan took extraordinary steps and locked down the city on 23 January 2020, to decrease the risks of additional disease transmission [2]. However, in some weeks, positive cases of COVID-19 were detected in many other countries of the world, becoming a global threat, and the WHO declared the coronavirus as a pandemic [1]. Several world regions are severely affected by the significant outbreak: China, Europe, Italy, South Korea, Iran, and United States. On March 13, the WHO stated that Europe had become the new epicentre of the pandemic. By 31 July 2020, COVID-19 had spread across more than 217 countries and territories, with approximately 17.1 million confirmed cases and 668,073 deaths [3]. As of now (March 2021), there is a variation in confirmed cases and deaths of COVID-19, so it is extremely important to prevent and combat the rapid spread of SARS-CoV-2 [4].
On 25 January 2020, the first case of COVID-19 tested positive in Malaysia and traced back to three Chinese nationals who previously had close contact with an infected person in Singapore [5,6]. However, on 4 February 2020, the first Malaysian was confirmed to have COVID-19, who was 41 and returned from Singapore. On the 6th of the same month, an older woman of 40 years was reported positive from COVID-19. She had no travel history to the infected area other than the younger sister of the 41-year-old man who migrated from Singapore, proving that COVID-19 spread from person to person [4]. She was the first COVID-19 patient in Malaysia who came into contact with the virus through local transmission. On 4 February, a 4-year-old Chinese girl who has been isolated at Sultanah Maliha Hospital, Langkawi, since January 29, recovered and was discharged from the hospital. That was the first patient in Malaysia who recovered from COVID-19 during the pandemic [7]. On 12 March 2020, Malaysia reported its first sporadic case of COVID-19 who neither travelled to the infected area nor had contact with an infected person.
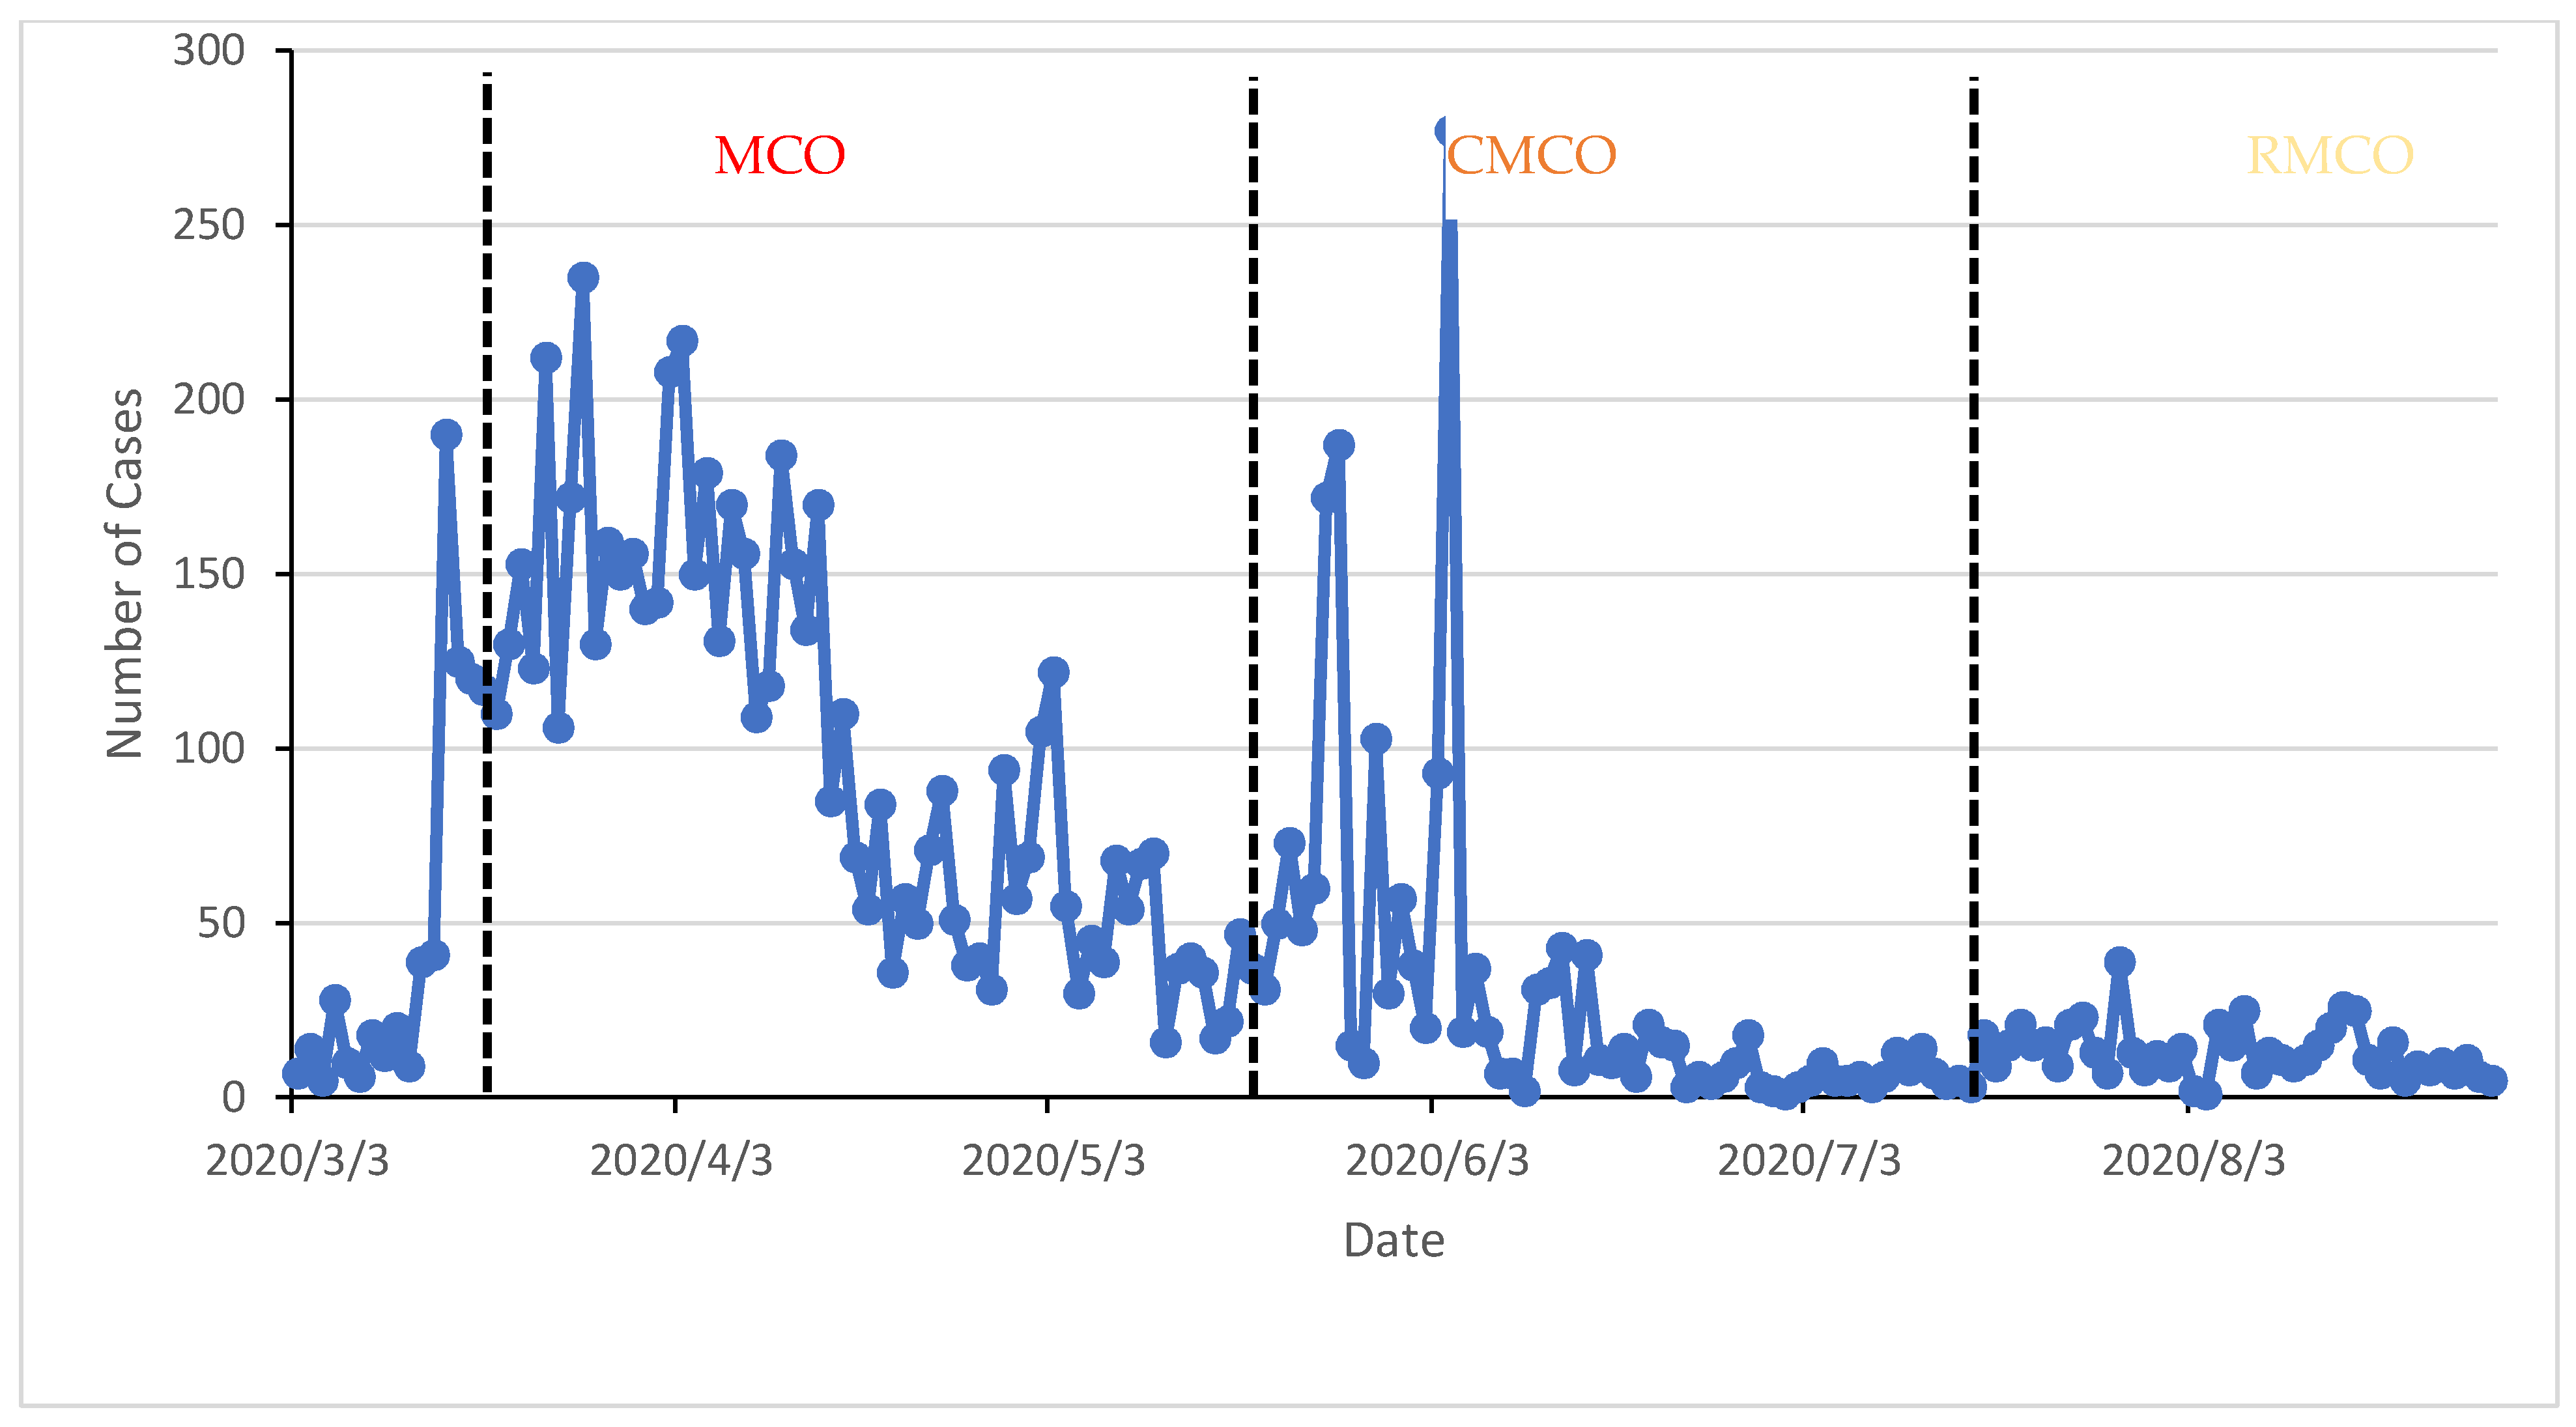
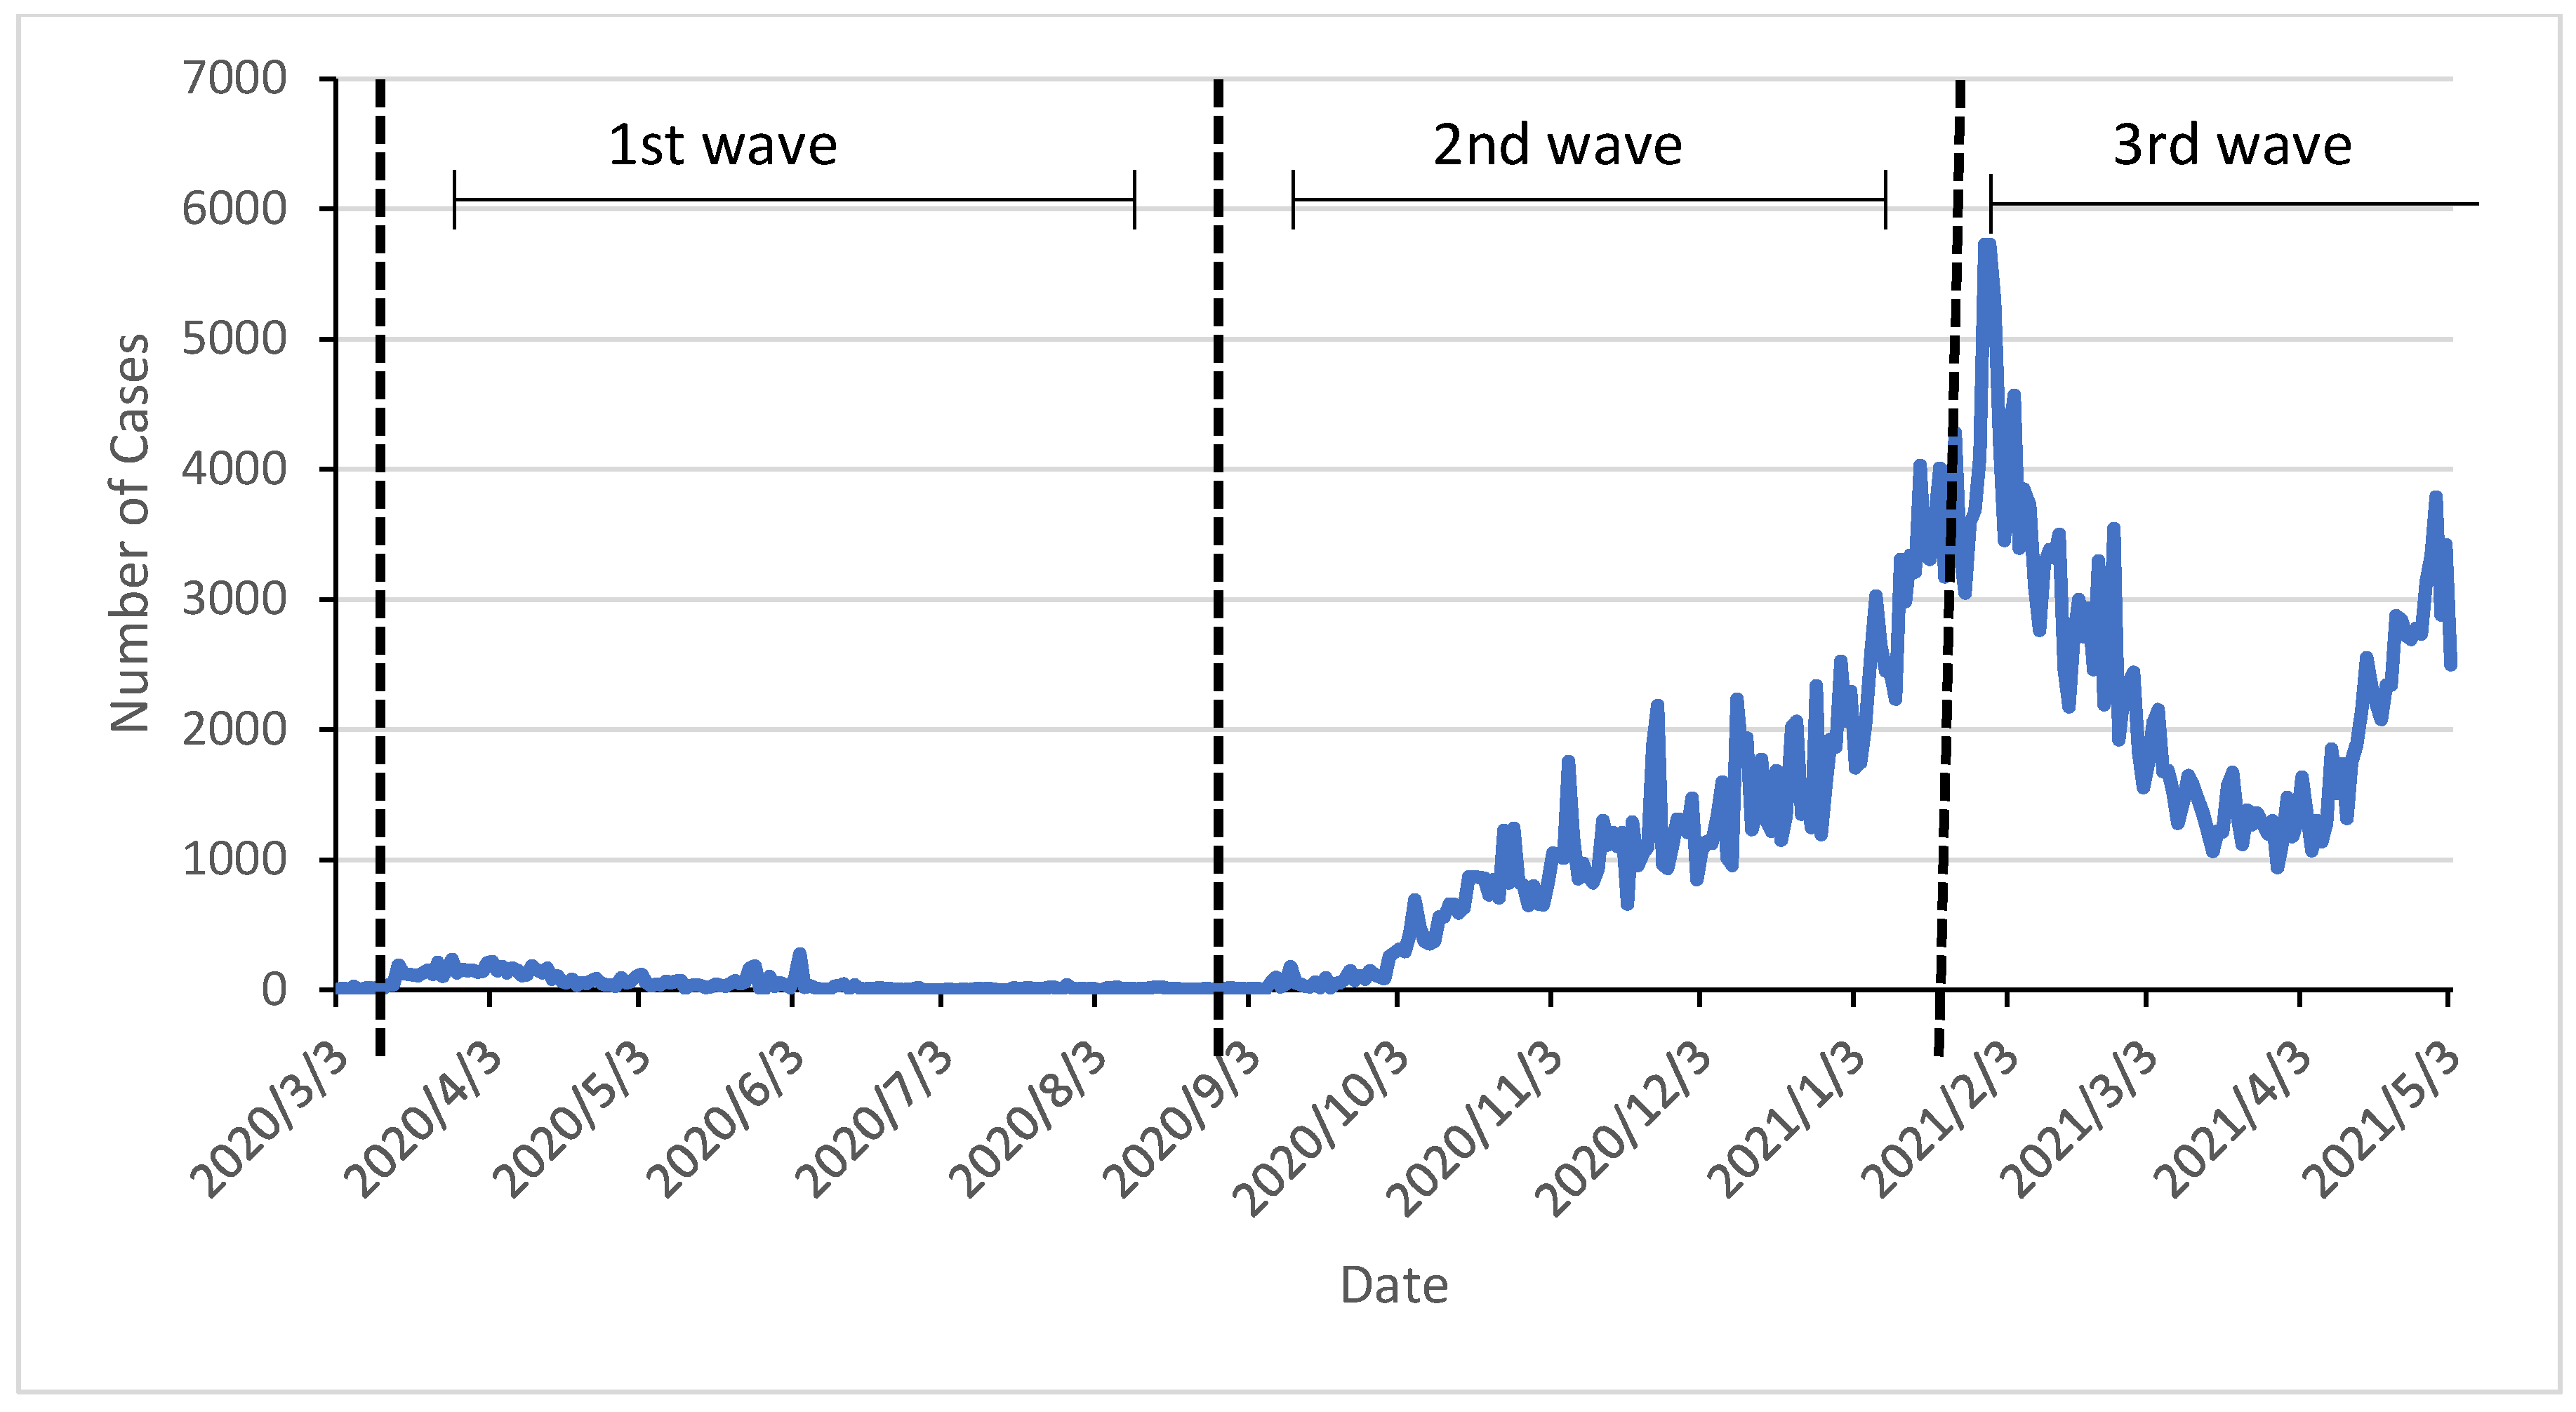
The number of cases surpassed 553 on 18 March 2020. The Malaysia Prime Minister announced the Movement Control Order (MCO). Only one person out of a single family could leave home to purchase the essential goods from their reference location [8]. Since 18 March 2020, the Malaysian government has restricted people from travelling to work and other countries’ states. As the number of positive cases remained high, the Prime Minister announced an extension of the MCO on 25 March 2020, for an additional 14 days [9]. As cases further increased, the Ministry of Health (MoH) Malaysia extended the MCO and by decreasing the cases, the MCO converted to Conditional Movement Control Order (CMCO) and Recover Movement Control Order (RMCO) which impacted the daily activity participation at different locations [10]. From 18 March 2020 to 27 August 2020, the first wave of COVID-19 in Malaysia was considered. The distribution of MCO, CMCO, and RMCO with the number of cases in the first wave of COVID-19 is shown in Figure 1. Moreover, the overall cases up to date are shown in Figure 2. Restricting participation in a different set of (research and physical) activities on a given day influences health parameters (physical, social, and mental) of Malaysians [11], especially international postgraduate students of different universities [12].

Figure 1.
First wave of COVID-19 from 18 March to 27 August 2020.

Figure 2.
Daily COVID-19 cases from 3 March 2020, to 3 May 2021.
Physically closing educational institutes (schools and universities) was considered an efficient way to minimize the spreading of the COVID-19, which leads it to many challenges for both the students and faculties. However, these closures had a big impact on students, especially postgraduate research students going to the lab and performing experiments daily. Moreover, the closure of recreational activities inside the campus restricted the student to participate in leisure and maintenance activities that influence their physical health and social health. Moreover, the pandemic also affects the students’ social life, not allowing them to come out from their blocks and participate with friends, parties, relatives, travel, and volunteerism.
The activities are categorized as in-home and out-of-home activities subdivided into mandatory/fixed and discretionary/flexible activities. Those activities that are difficult to be re-scheduled, such as work activities, pickup/drop up kids to and from school, are called mandatory activities. In contrast, discretionary activities are the opposite and can be re-scheduled at a high level of flexibility. Discretionary activities are sub-divided into leisure and maintenance activities. As for health concerns, the novel coronavirus has affected all types of activity participation that indirectly influence health parameters.
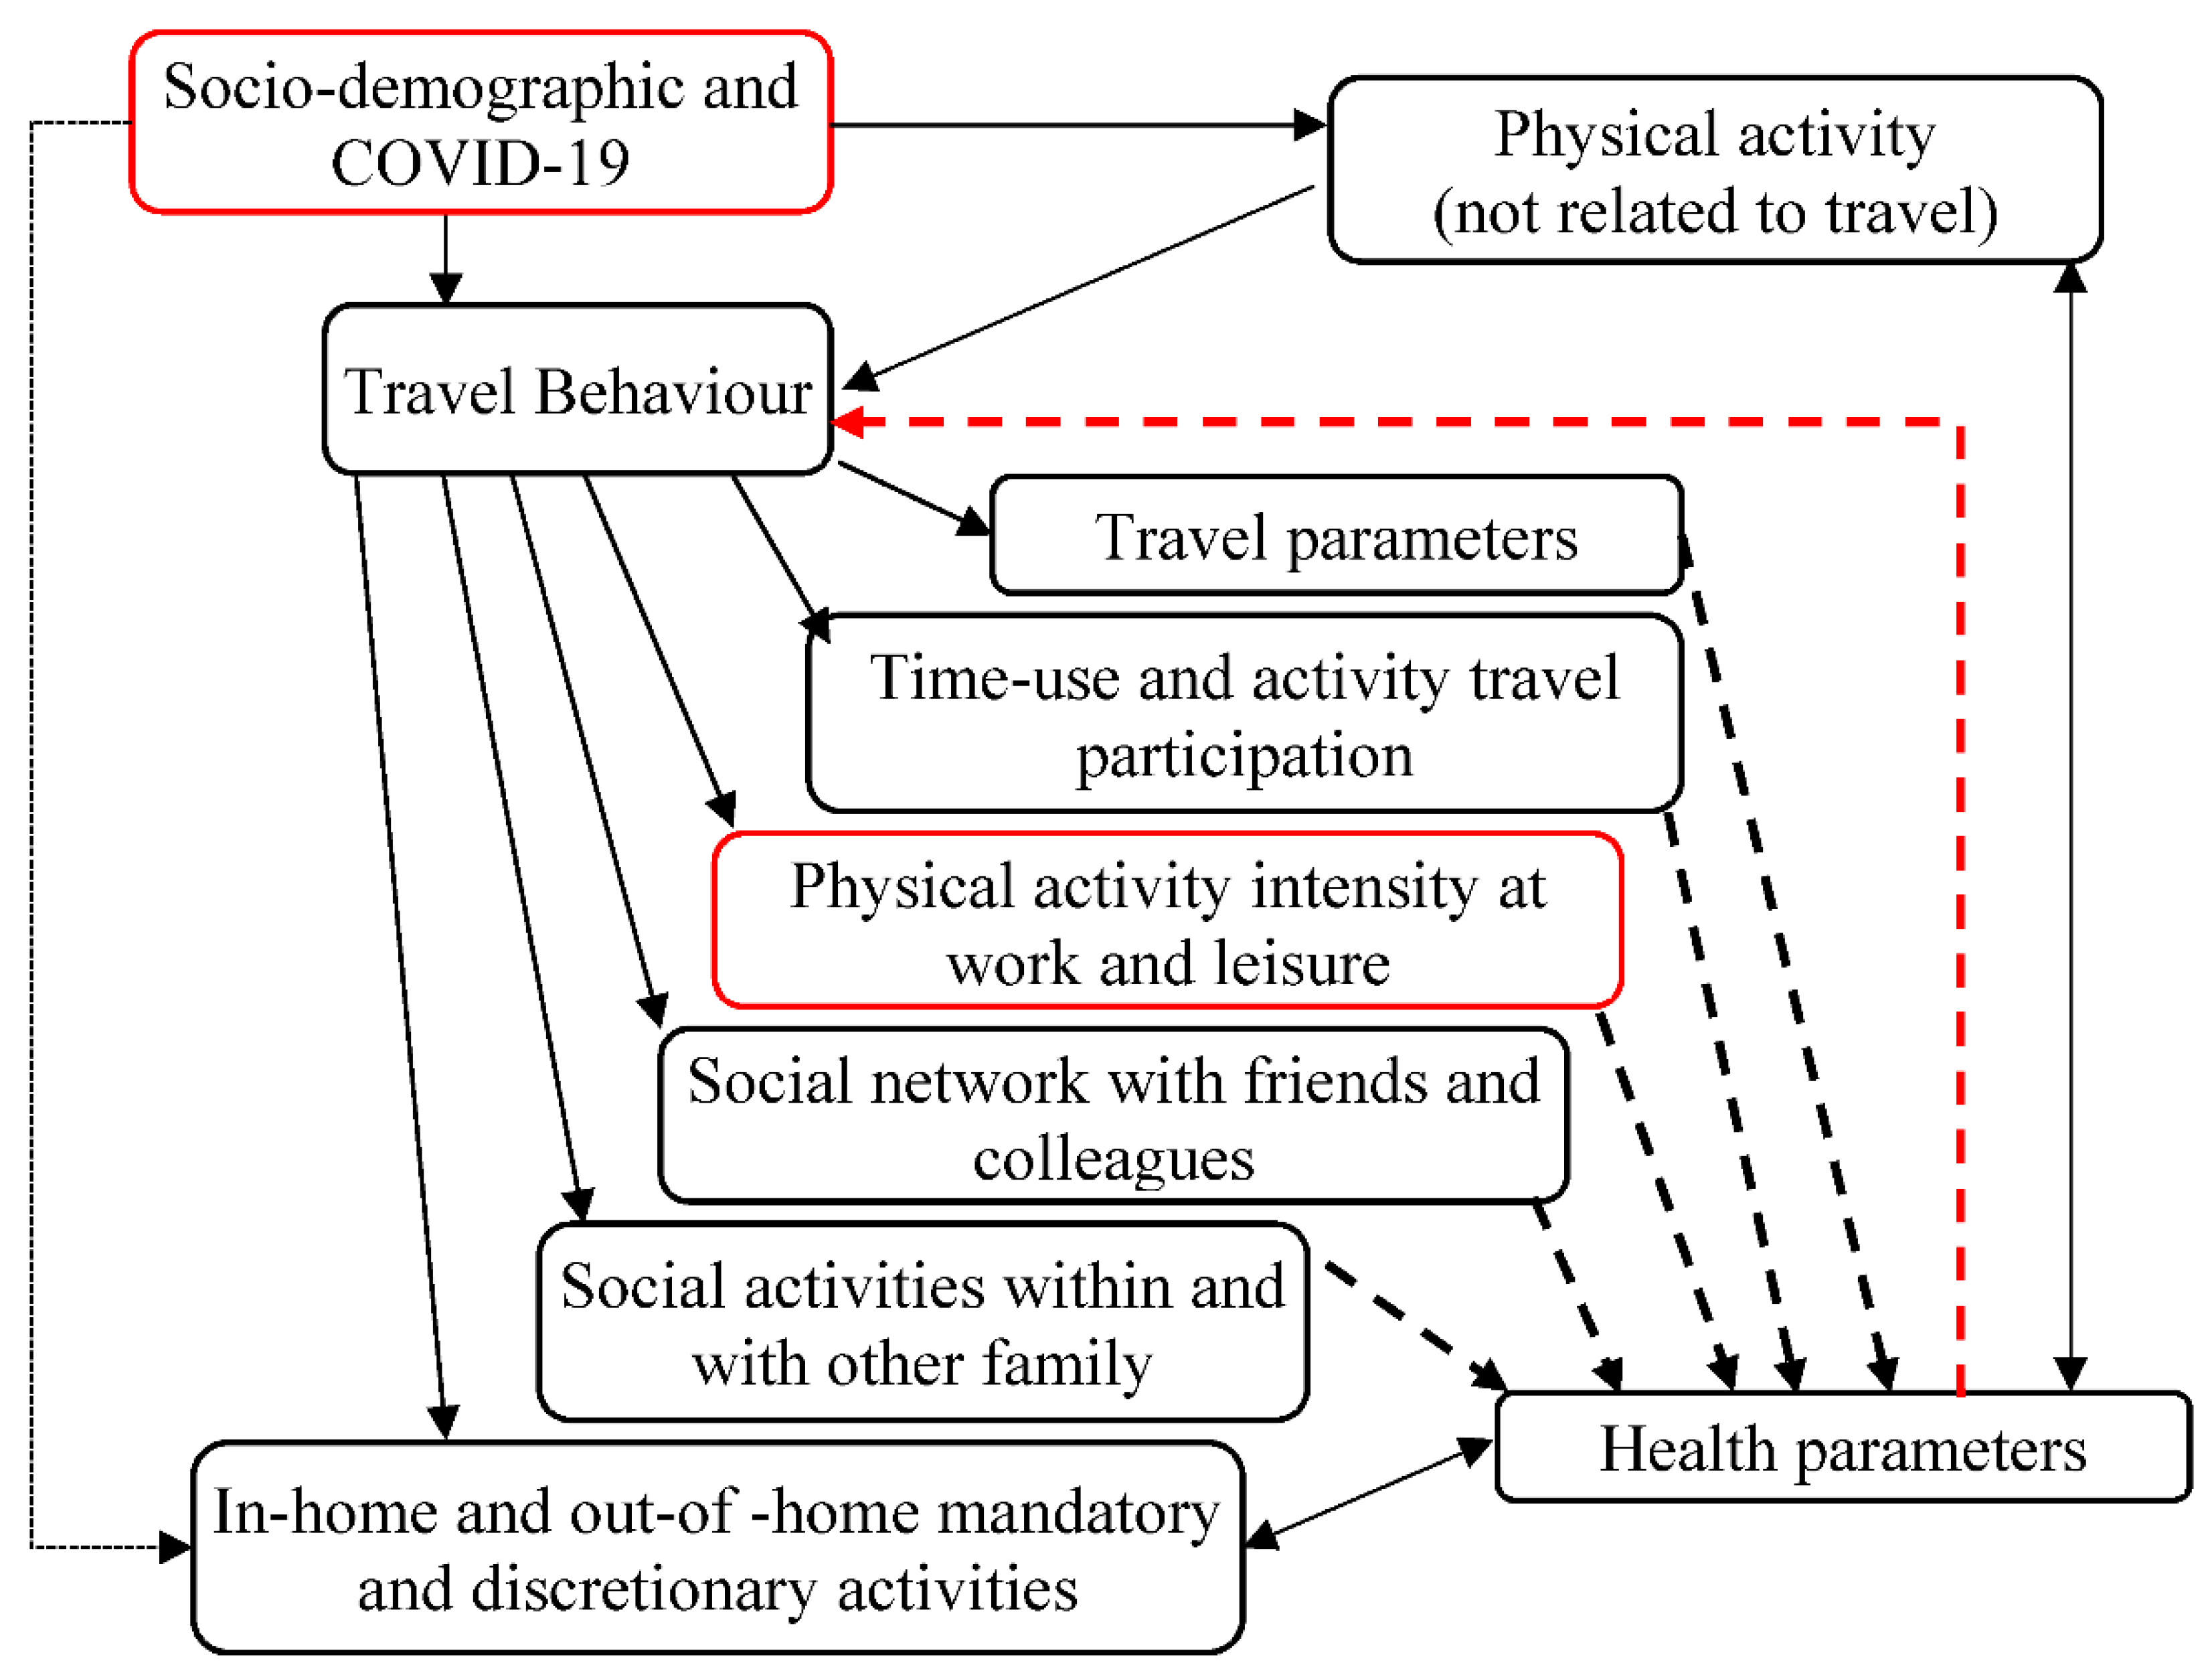
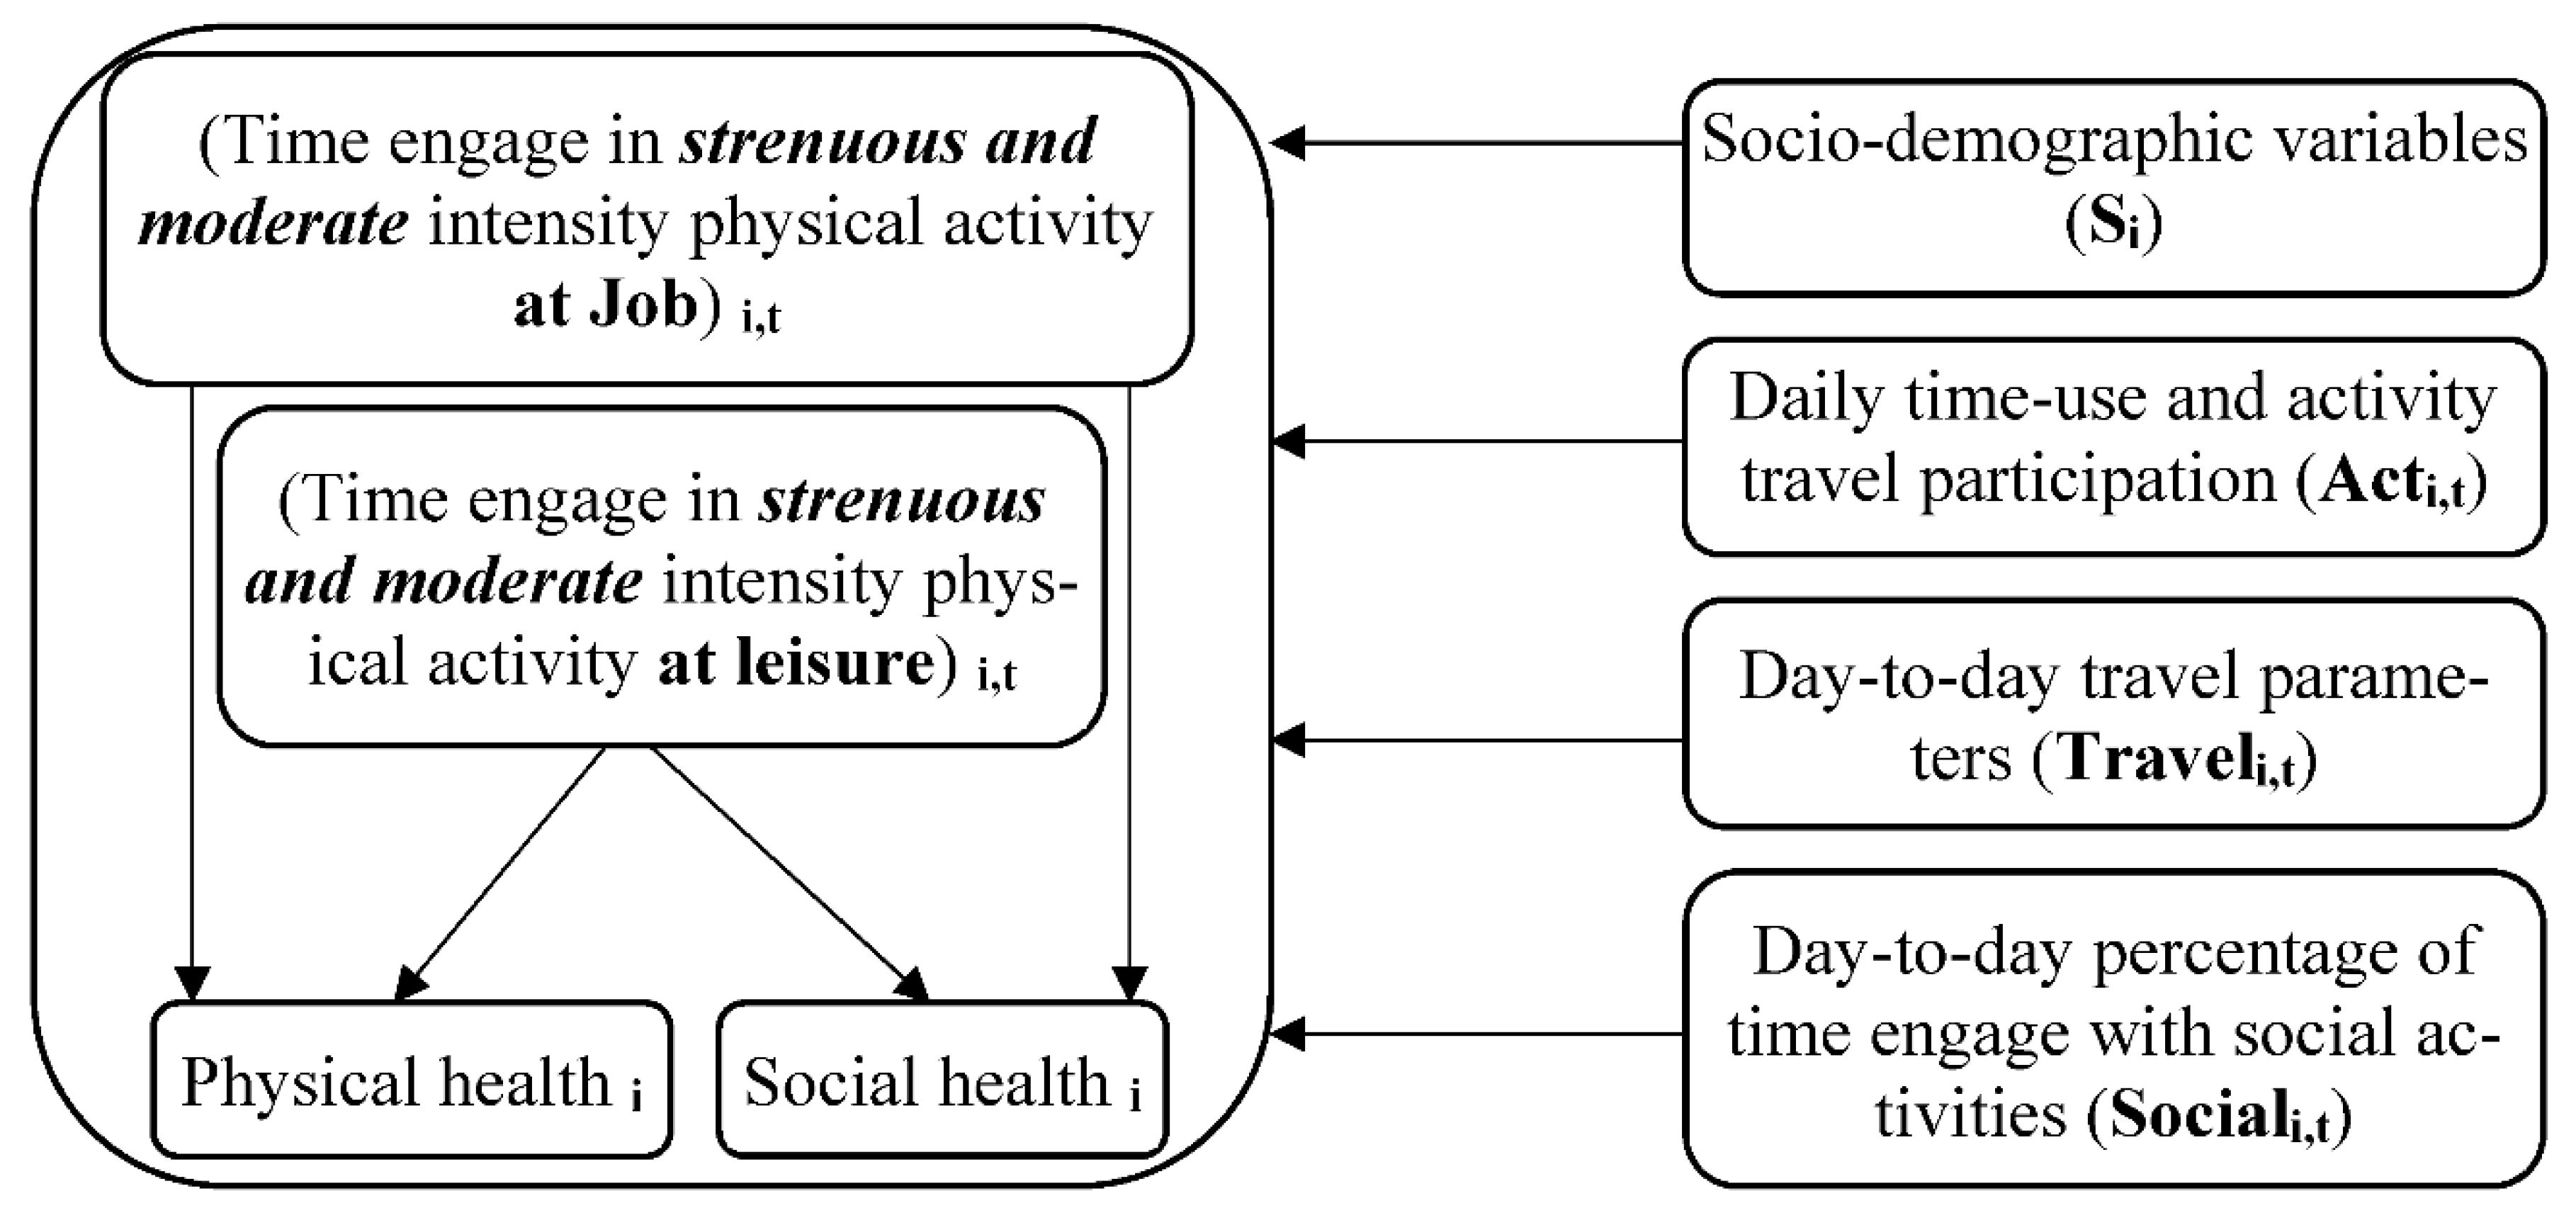
Every person is unique, and their day-to-day activities are different. To participate in a different set of activities, there should be some need, desire, and constraints. As individuals have both needs and desires, due to the movement constraints (COVID-19), they cannot travel and participate in different activities on a given day, which influences their physical, social, and mental health. A comprehensive dataset is needed at an individual level to study the influence of work and leisure time physical activities during the COVID-19 pandemic on health parameters. The conceptual model/framework for the interaction of activity and travel participation and health is shown in Figure 3.
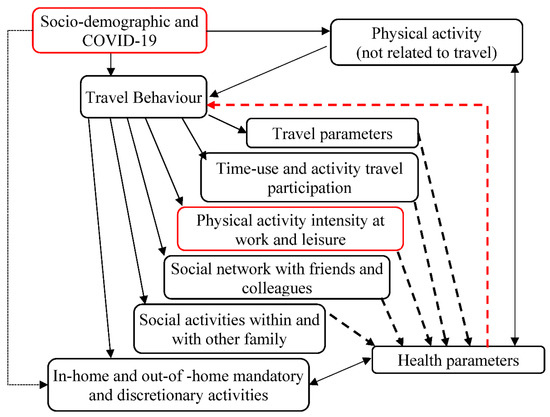
Figure 3.
Conceptual model of COVID-19, travel behaviour and health parameters.
Recently, many papers have been published on various aspects to study the COVID-19 pandemic. Several articles were related to the study of health parameters from a different perspective. Recent researchers explain the impact of online classes on the higher education students [3], perception, experience and expectation to do online classes [13], psychological and anxiety [14,15], their GPA before and after the COVID-19 [12,16], education and mental health [17,18], and sleep quality of students and academic staff [19]. In addition, some of the research studies the influence of COVID-19 and physical activity by considering obesity [20], self-reported physical activity and sedentary behaviour [21], metabolic syndrome [22,23], COVID-19 and home-based physical activity [24,25], and physical activity during the COVID-19 pandemic quarantine [26,27]. Previous research has clearly shown the influence of COVID-19 on education sectors, online teaching/learning, GPA, and mental health. However, the previous research rarely investigates the influence of daily activity participation on an individual’s physical and social health at university students. Recent research shows that physical and social activity positively correlates with better physical and social health. This study investigates the influence of daily activity participation during the COVID-19 pandemic on the physical and social health of Universiti Teknologi PETRONAS (UTP) students, Perak, Malaysia.
Furthermore, it is very complex to study the influence of activity patterns on health parameters. According to the authors’ view and recent literature, there has not been any study showing the direct relationship between activity and health [28,29,30]. Activity participation is too general a term, and does not directly influence health parameters. Therefore, physical activity intensity during the COVID-19 pandemic is used as an intermediate variable to study the influence of activity patterns on health parameters.
2. Methods and Materials
2.1. Study Area
The study area for the current research was chosen as Seri Iskandar as the facility has developed rapidly over the past five years. In addition, most of the residents of Seri Iskandar are students of Universiti Teknologi PETRONAS and Universiti Teknologi MARA; therefore, many facilities were built to support the community. Moreover, Ipoh is the capital city of Perak state, while Seri Iskandar is located at Perak Tengah and has been the district’s capital. Recently, Seri Iskandar has been considered as developing and the hub of activity for the people, whereas most government offices are located in the city due to the two universities. Seri Iskandar has an uncrowded road network with two routes for each highway from Ipoh to Lumut. Most people use a private car, public transport, and motorcycle for their daily activities.
Currently (March 2021), UTP has 1200 Foundational, 6000 Undergraduate and 1200 Postgraduate students from around 60 different countries, representing the number of UTP students at a ratio of 1:5:1. Most postgraduate students responded to the questionnaire survey, which is why the ratio was not followed in the sample. Several samples are needed to be collected to avoid the chances of error. To determine how many respondent data will be required, Yamane in 1967 [31] and Daryle W. Morgan and Robert V. Krejcie [32] introduced the formula in the 1970s, as shown in Equation (1). A total of 150 respondents participated in the survey for seven consecutive days (Monday to Sunday), representing 1.78% of the total population of the UTP in March 2021. The description of the respondents is shown in Table 1. Instead of travel diary, time-use and diary data were collected to provide richer information.
where n is the sample size, and N is the size of the population, e is the desired level of precision (3%, 5%, and 7%). For example, the desired level of precision for the current study was 5%.

Table 1.
Description of the respondents (N = 1050).
2.2. The Survey
In January 2021, the survey was designed to collect multi-dimensional information at the individual level, such as socio-demographic, diary activity participation and mode of transport, physical and social activities, and health-related Quality of Life (QoL). The data were collected through an online web survey using probability sampling techniques with random sampling. Based on the availability and accessibility, random sampling was selected. A web-based questionnaire survey was sent to all the UTP students through their email addresses to fill it through the registry section. The survey form was open to all UTP students and was not mandatory for every student to answer the questionnaire survey. Those students who responded to the questionnaire survey were considered, and randomly 150 students responded to the questionnaire survey. Moreover, in statistics, quality assurance, and survey methodology, sampling is the selection of a subset of individuals from within a statistical population to estimate the characteristics of the whole population. Therefore, randomly, 150 students representing the whole university were included in this research. Students were requested to fill the survey and mention their daily activities on weekdays and weekends for seven consecutive seven (7) days. The seven-day duration was selected to check their activities on weekdays and weekends. The abovementioned duration was selected based on recent and past studies [33]. The survey mainly consisted of three parts: (1) physical activity and its intensity survey, (2) time-use and activity diary and (3) Health-related QoL.
The physical activity survey contained five elements: socio-demographic variables, physical activity at the workplace, physical activity at leisure time, modes of transport for their daily activity, and social activity. The socio-demographic data consist of gender, age, education status, and level of study, whereas physical activities consist of moderate and strenuous-intensity physical activity. Moderate-intensity PA burns off 3 to 6 times more energy per minute than sitting quietly, which equals 3 to 6 Metabolic Equivalent Tasks (METs). In contrast, strenuous-intensity PA requires more effort and burns more than 6 METs and requires a high amount of oxygen consumption to complete an activity. Moreover, physical and social activities measured from their intensity are sub-divided into frequency (how many days in a week) and duration (how many minutes in a day) of an activity. In addition, respondents were asked to tell us about their daily transport modes, categorized as motorized, non-motorized and public transport modes.
Time-use and activity diary survey data are collected to estimate different in-home and out-of-home mandatory and discretionary activities. An activity diary survey was used to collect and provide richer information on travel behaviour, daily time use, and activity participation. For the simplicity of the surveyor and respondents, the time use and activity diary survey were organized for the 15 min interval, which makes 96 portions and 1440 min in a day. The time use and activity diary survey cause less bias in addressing the individual time distribution to the particular activity. The activity diary survey consists of 23 different in-home and out-of-home mandatory, leisure, and maintenance activities. The classification of these activities is as shown in Table 2. However, those activities which are less than 15 min are neglected.
Table 2.
Daily activity classification criteria.
In the activity diary survey, the respondents were asked to talk about their 24 h daily activities from bed to activities (working and leisure) and from activities to sleeping. However, the in-home mandatory activities were more because they consist of sleeping activities which almost take half of the day. Moreover, the influence of these different types of activities during the COVID-19 pandemic on health parameters are evaluated using RStudio and Statistical Package of Social Sciences (SPSS). Different types of in-home and out-of-home mandatory, leisure, and maintenance activities on a given day, such as weekdays and weekends, are also evaluated. Due to COVID-19, most individuals are restricted to do out-of-home activities, especially the students, who have the provision of all lectures and materials online. The influence of these restrictions on out-of-home activities and increasing the in-home activities and are needed to be evaluated.
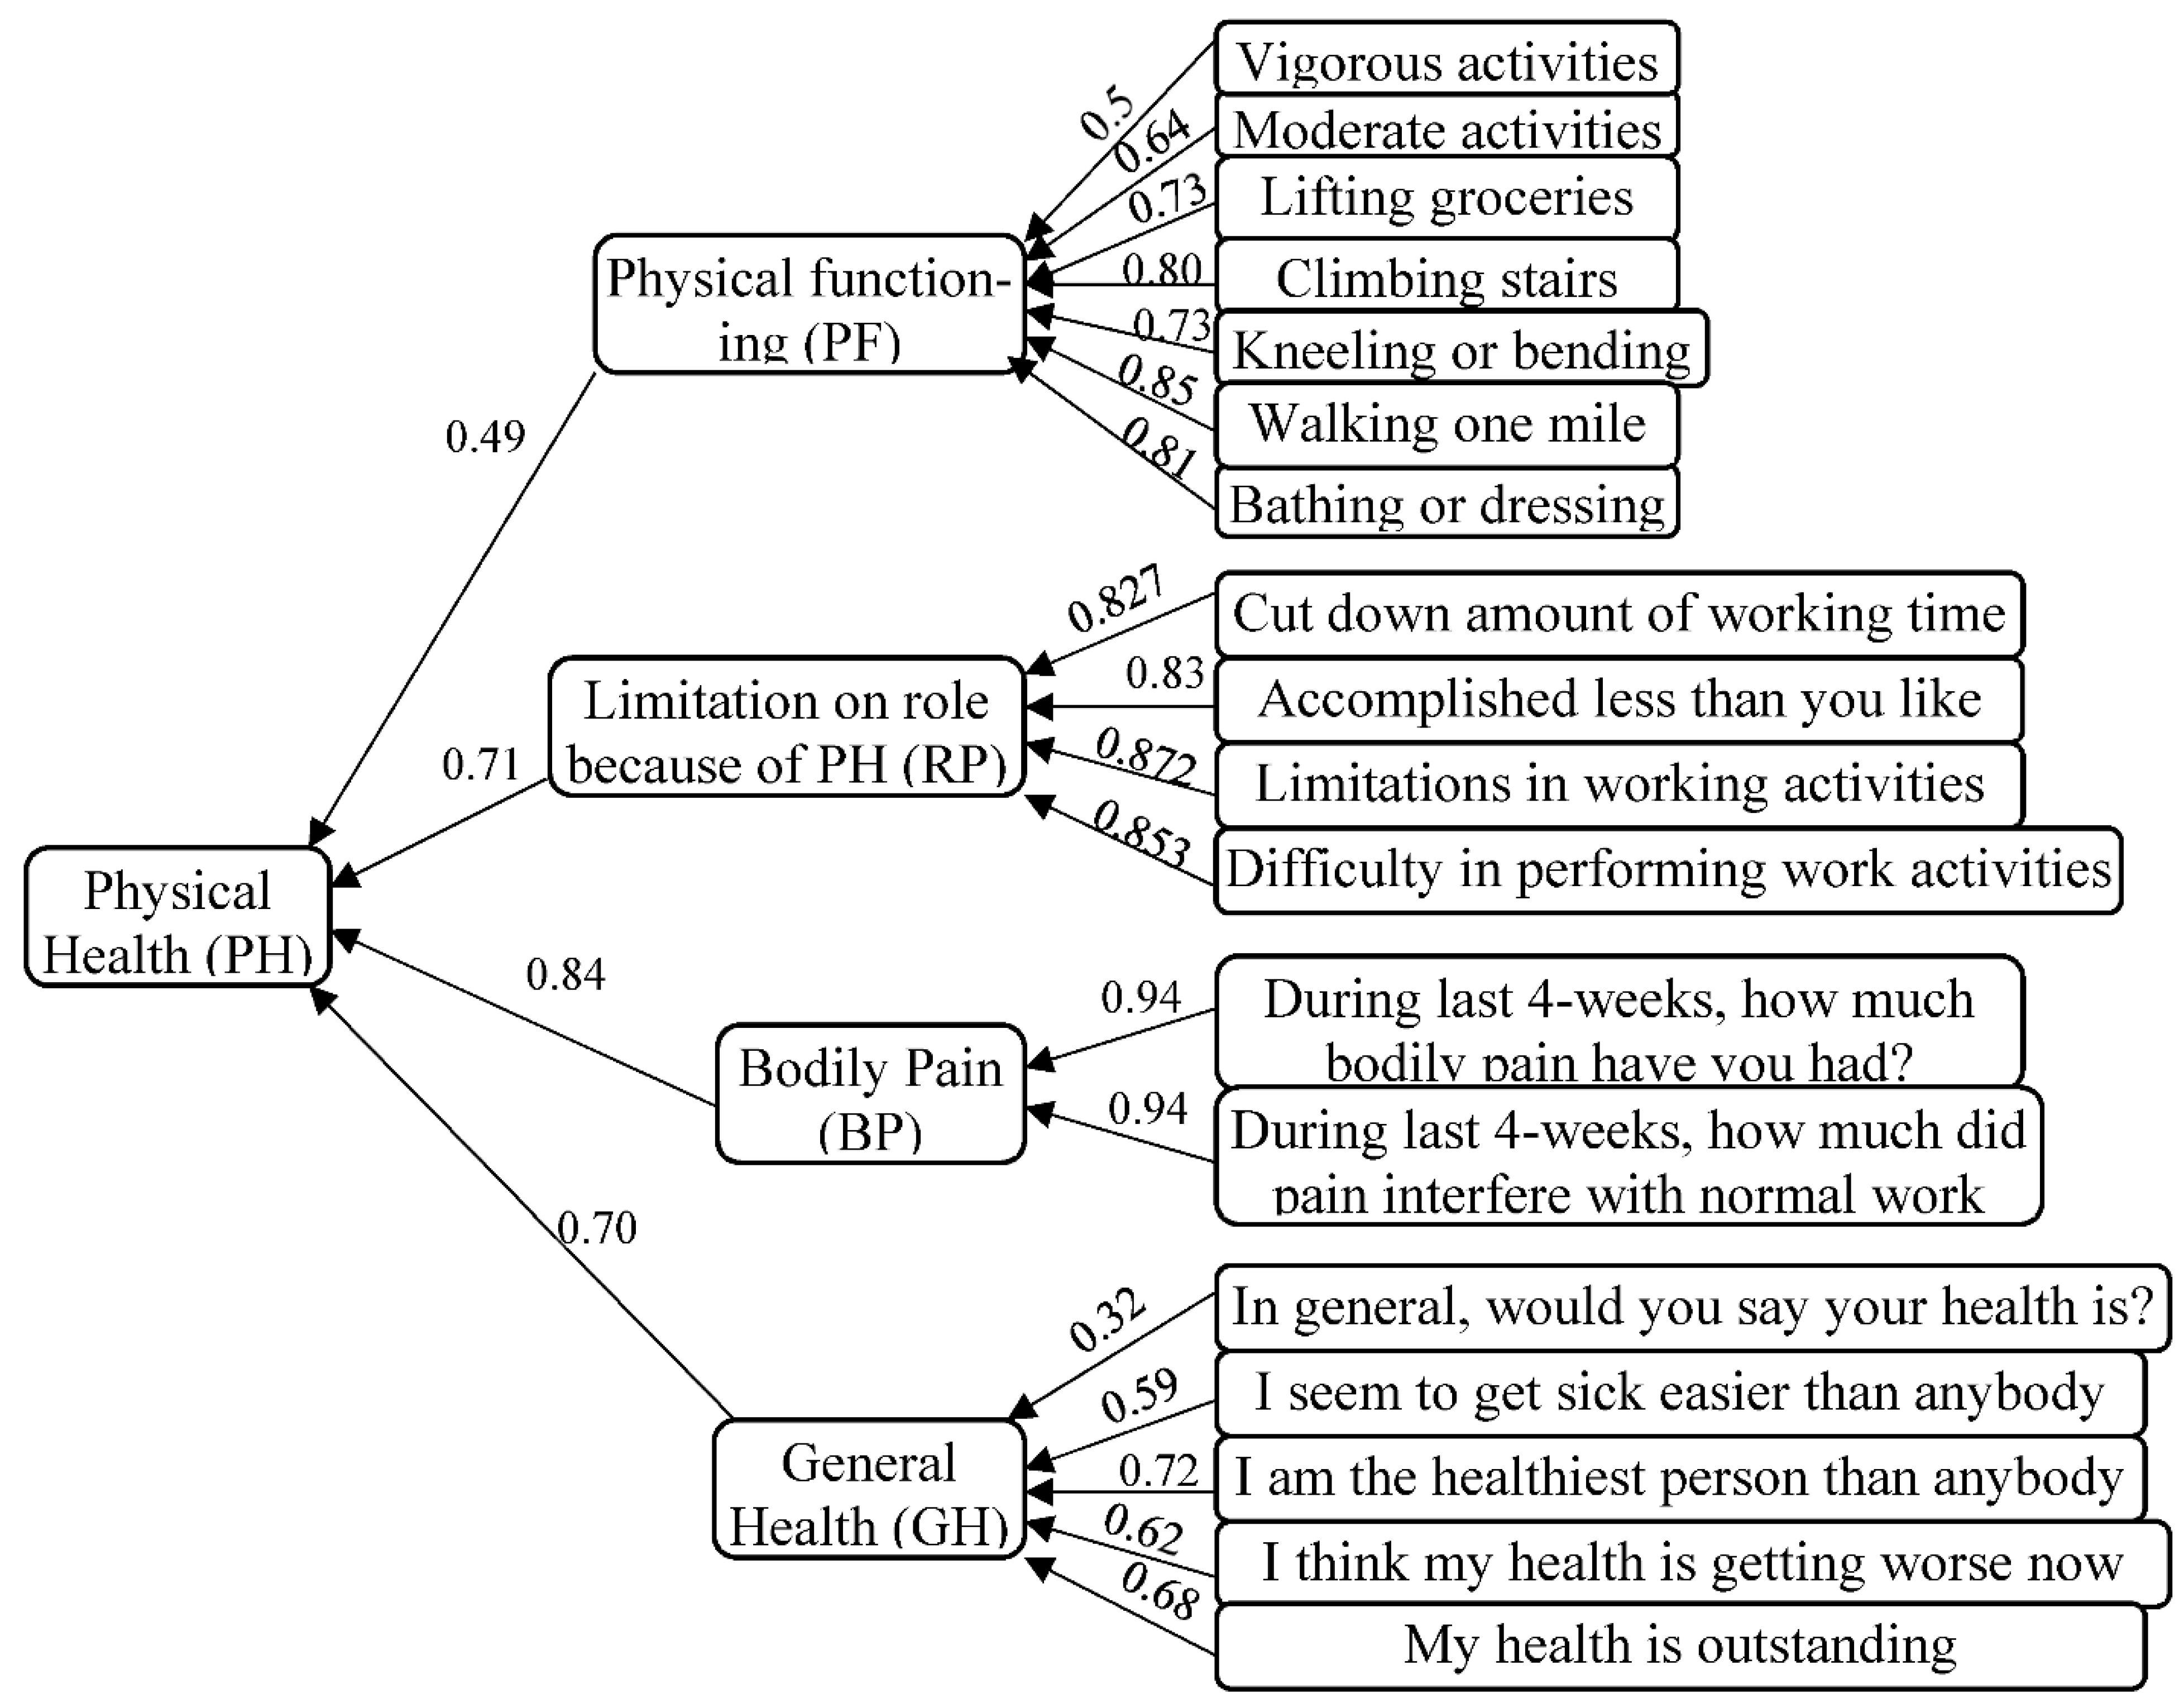
The survey contained health-related QoL questions based on Short Form-36 (SF-36) and was adopted in more than 11 countries [28,34]. The survey contains four main parts, but this study mainly focuses on the physical and social activities with and with other family members and health-related QoL and the factors that influence it. The health-related QoL questions contained eight sub-scales in which Physical Functioning (PF), limitation on role functioning because of physical health (RP), bodily panic (BP) and general health (GH) are measured physical health whereas, limitation on role functioning due to the emotional problem (RE), social functioning (SF), and limitation on role functioning because of physical health (RP), measured social health. Moreover, mental health can be measured from bodily panic (BP), general health (GH), vitality (VT), and mental health (MH) scales. For a detailed explanation of the health-related QoL scale, kindly refer to Zhang 2013 [28].
The health-related QoL survey responses were answered on a 5-point Likert scale ranging from “Excellent to Poor” and “All the time to Never”. SPSS version 26.0.0 was used for calculating the factor score of the variable by extracting through basic principle components and with a Promax rotation of Kappa 4. The Promax and Varimax rotation is used when a single variable is expected from multi-dimensional information [35]. The essential purpose of the factor analysis is to summarize the data so that the relationship can be easily understood and interpreted. Factor analysis was applied to both physical and social health variables, and their scores are shown in Figure 4 and Figure 5. Factor analysis is used to regroup the variables into a small cluster [36]. However, linear regression was applied to the dependent variable “Y” and independents variables “X1, X2, X3,………Xn” with an error term “ε”, as shown in Equation (2).
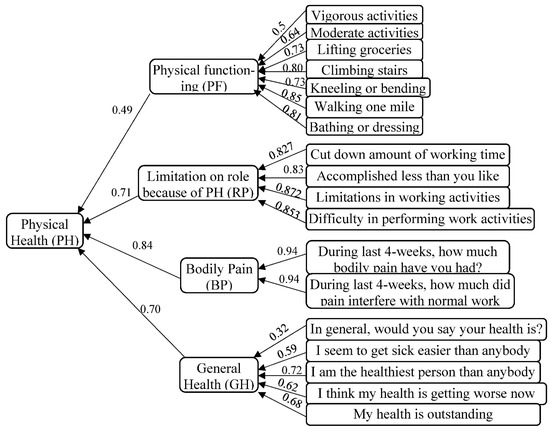
Figure 4.
A measurement model and factor loadings of observed variables used to estimate physical health.

Figure 5.
A measurement model and factor loadings of observed variables used to estimate social health.
On the other hand, “Y” is the endogenous variables, physical and social health and “X” is the exogenous variables, which is a different set of activities and travel parameters on a given day. However, β is the slope coefficient for each independent variable, α is the y-intercept, and ε is the error term’s random variable.
3. Exploratory Analysis and Discussion
3.1. Physical Activities at Socio-Demographic Level
The rate of physical activity measured from the intensity of an activity, whereas the frequency and duration of activity measured physical activity intensity. Frequency refers to how many days in a week individuals participate in different activities, whereas the duration is how many minutes in a day individuals participate in a particular activity. Physical activities are mainly classified as strenuous/vigorous and moderate-intensity physical activity. Those activities that require more effort expend many calories more than six Metabolic Equivalent Task (6 METs) are known as strenuous physical activity. Moreover, those activities requiring less energy to perform an activity and burn off three-six times more energy per minute than sitting quietly are defined as moderate-intensity physical activity.
Current research uses both moderate and strenuous-intensity physical activity, an intermediate variable between the daily activity and health parameters during the COVID-19 pandemic, to see the influence between them. However, the current study used the duration of activity for both work and leisure-time physical activity instead of frequency. This is because the duration of physical activity provides richer information compared to the frequency of physical activity.
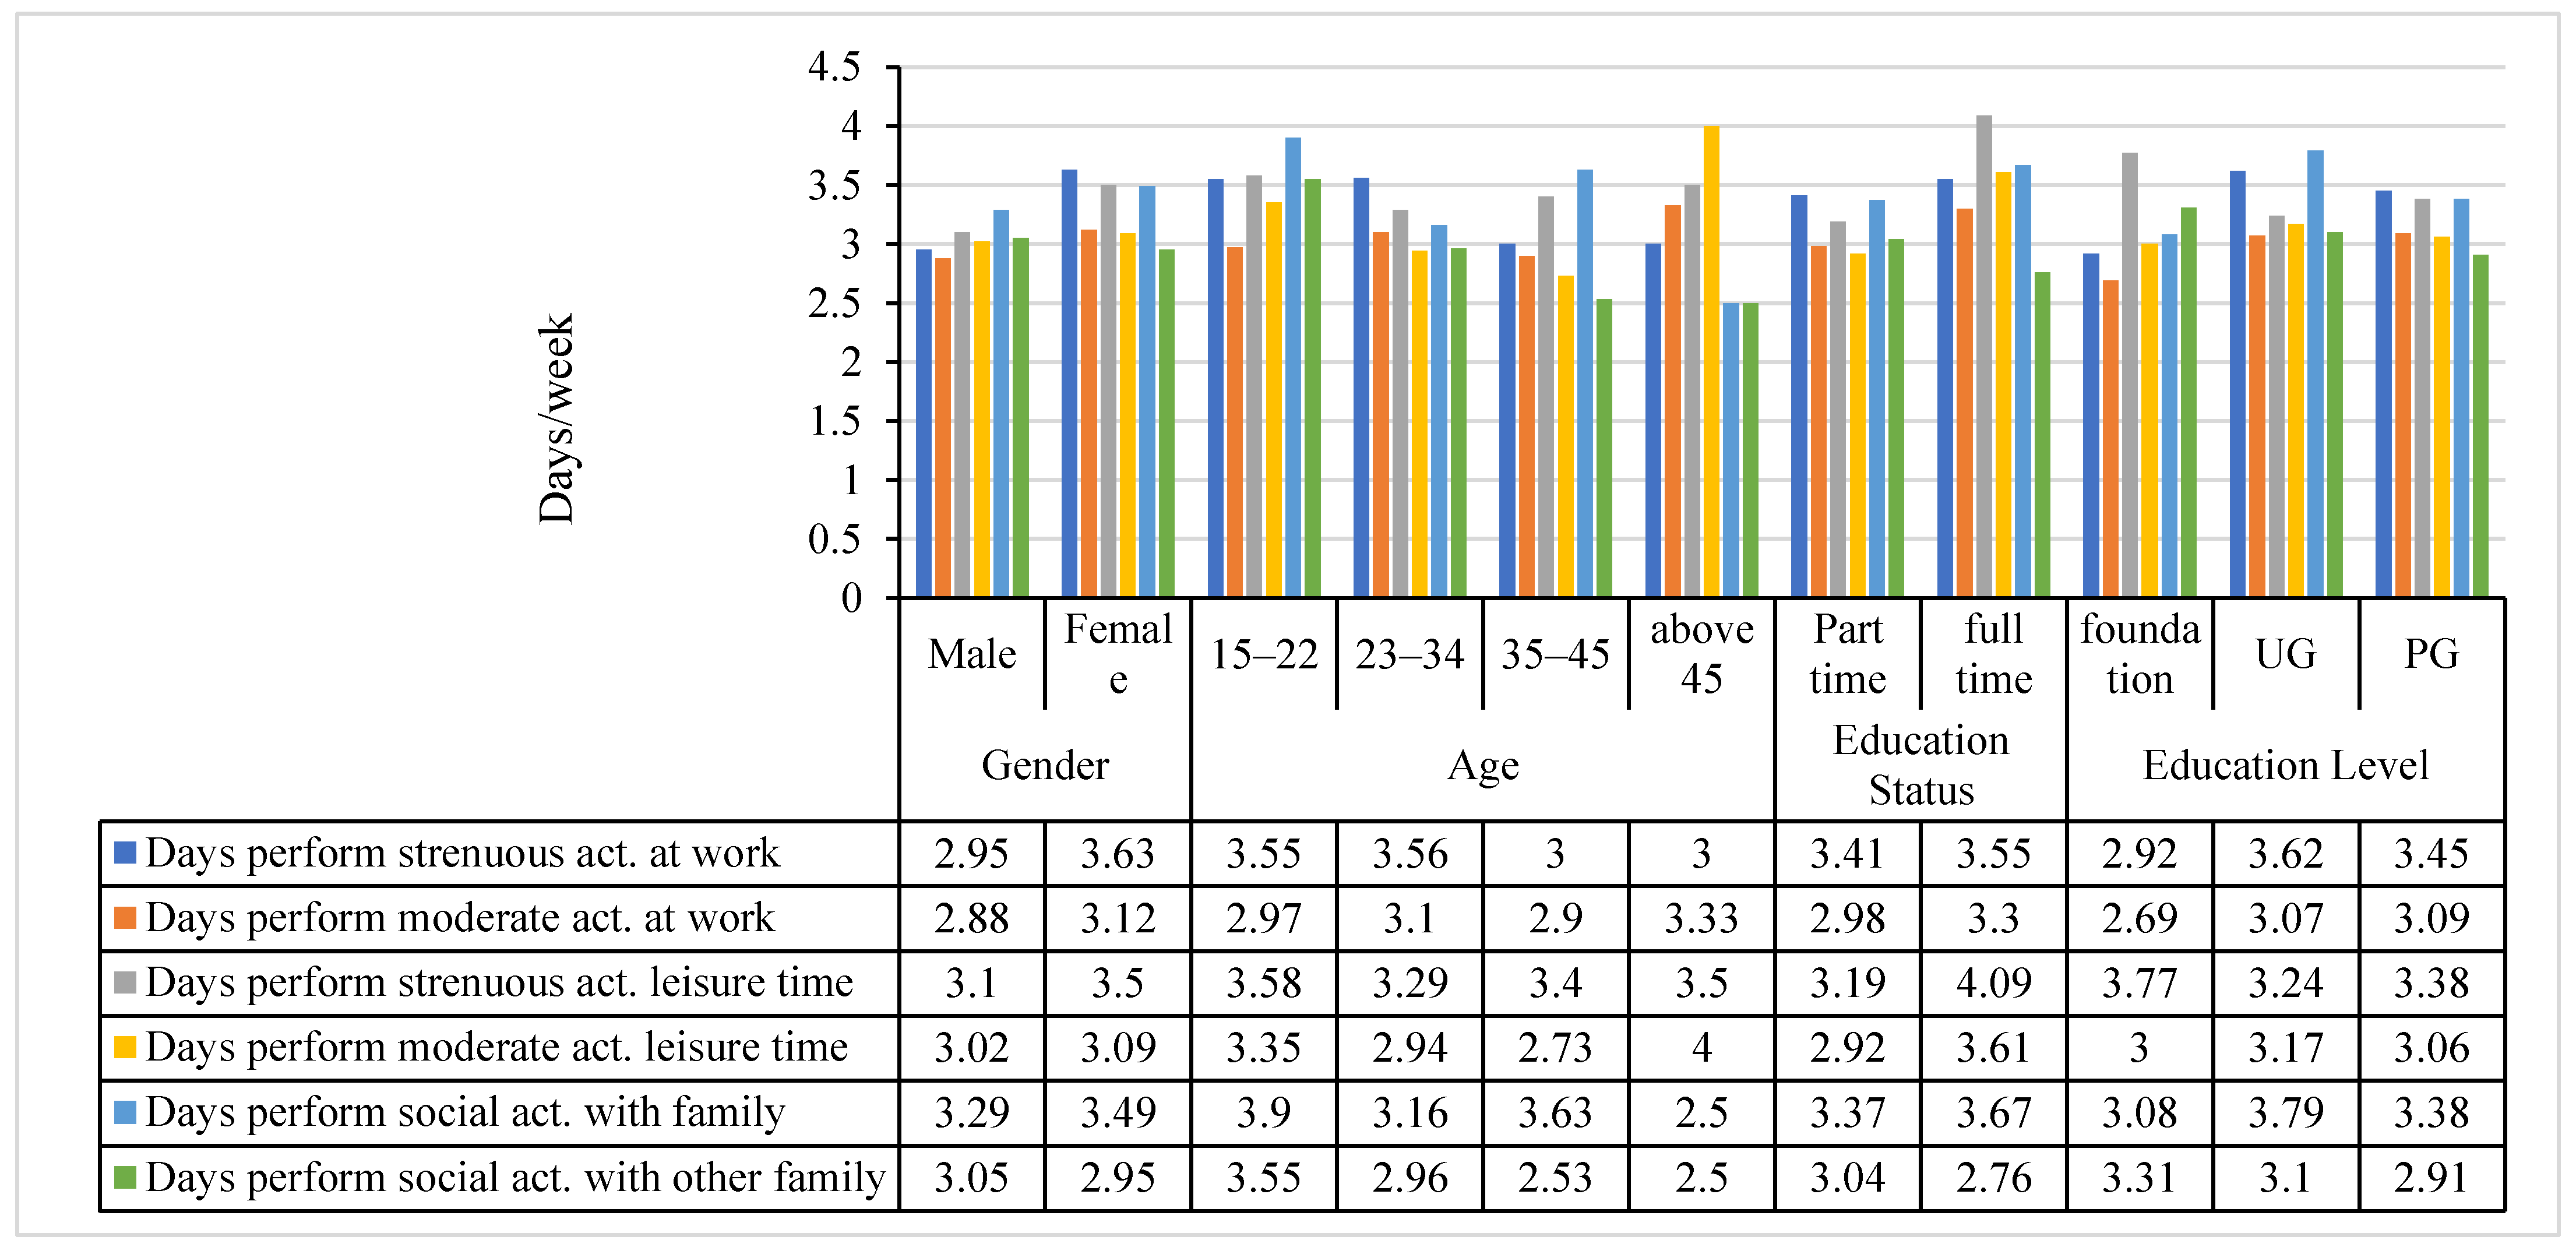
Figure 6 shows the frequency of strenuous and moderate-intensity physical activity at work, leisure time, and social activity with family and with other family members, with socio-demographic variables. Those aged 15–22 participate in more strenuous PA work and social activities, whereas those above 45 years participate in more moderate-intensity PA at leisure time. Compared to males, females are more involved in daily physical activity during the COVID-19 pandemic, which is opposite to the standard days. During the normal/standard days, males were involved in more daily out-of-home physical activities than females. However, during the COVID-19 pandemic, the individuals are forced to stay at home. Therefore, the work-from-home routine dramatically affects the males compared to the females. Moreover, those registered as full-time students show a high frequency compared to the part-time registered students. There is a slight variation in the foundation, undergraduate, and postgraduate students’ physical activity frequency at work and leisure time.
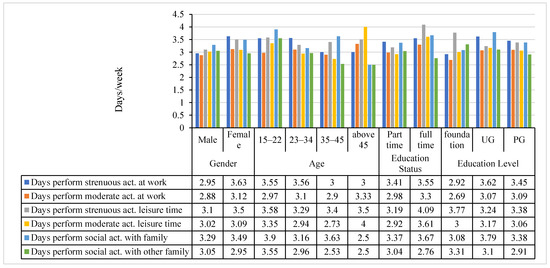
Figure 6.
Frequency of strenuous and moderate-intensity physical activity at the socio–demographic level.
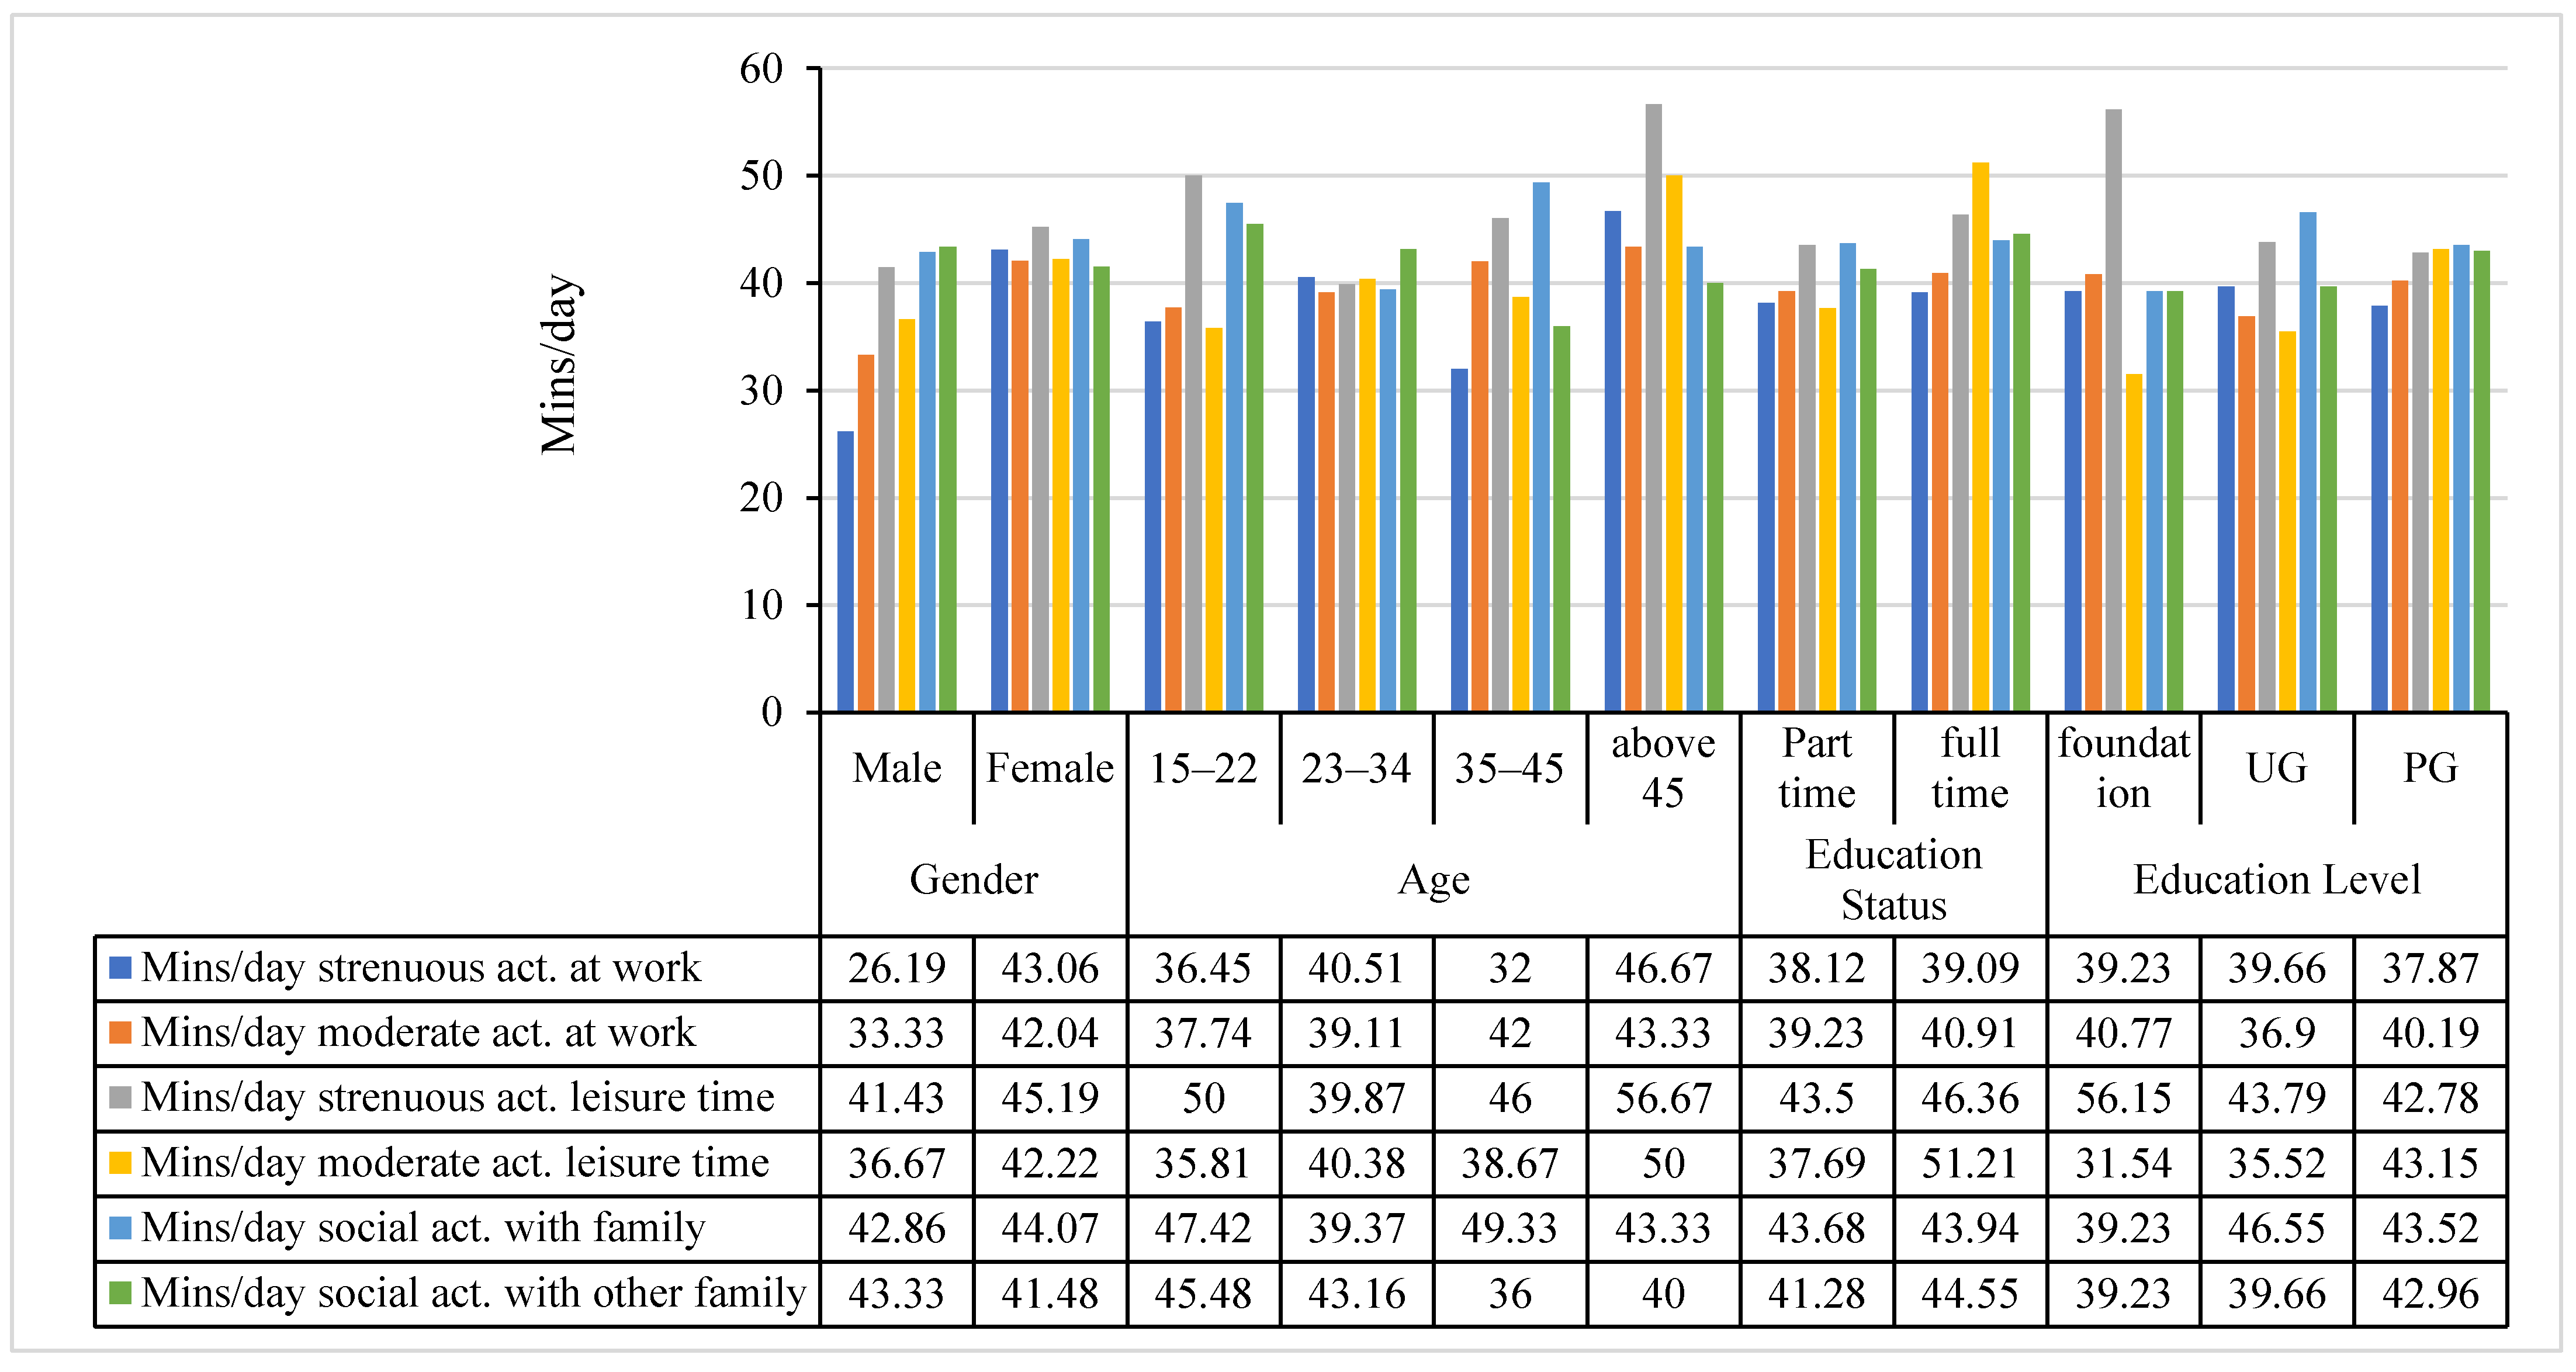
Figure 7 illustrates the duration of strenuous and moderate-intensity physical activity at work, leisure time, and social engagement with family and other family members. Regarding the duration of an individual’s physical activity at work and leisure time, females show more time spent in strenuous and moderate-intensity physical activity in both work and leisure time than males. Moreover, those aged 15–22 and above 45 years old show the highest involvement in the duration of strenuous-intensity physical activity at leisure time than the rest of ages whereas, those from the age of 23–34 years old show the highest moderate-intensity physical activity at work. In addition to that, those from the age of 35–45 years old are more involved in social activity with family and other family members. Regarding education, foundation degree students are more involved in leisure-time physical activity. In contrast, postgraduate students are more involved in strenuous and moderate-intensity physical activity at work and leisure time.
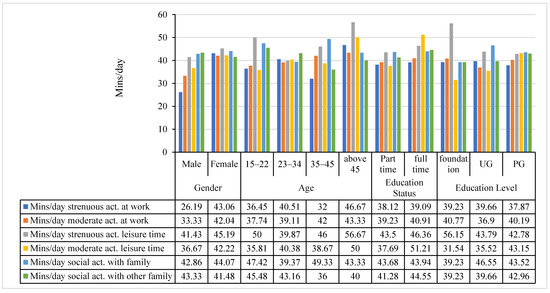
Figure 7.
Duration of strenuous and moderate-intensity physical activity at the socio–demographic level.
3.2. Daily Time-Use and Health Parameters
The time-use and activity diary is classified as in-home and out-of-home mandatory, leisure, and maintenance activities. However, the intensity of physical activity is categorized as strenuous-intensity physical activity and moderate-intensity physical activity. The time spent for in-home and out-of-home mandatory, leisure, and maintenance activities on strenuous and moderate-intensity physical activity and health parameters on a given day is evaluated.
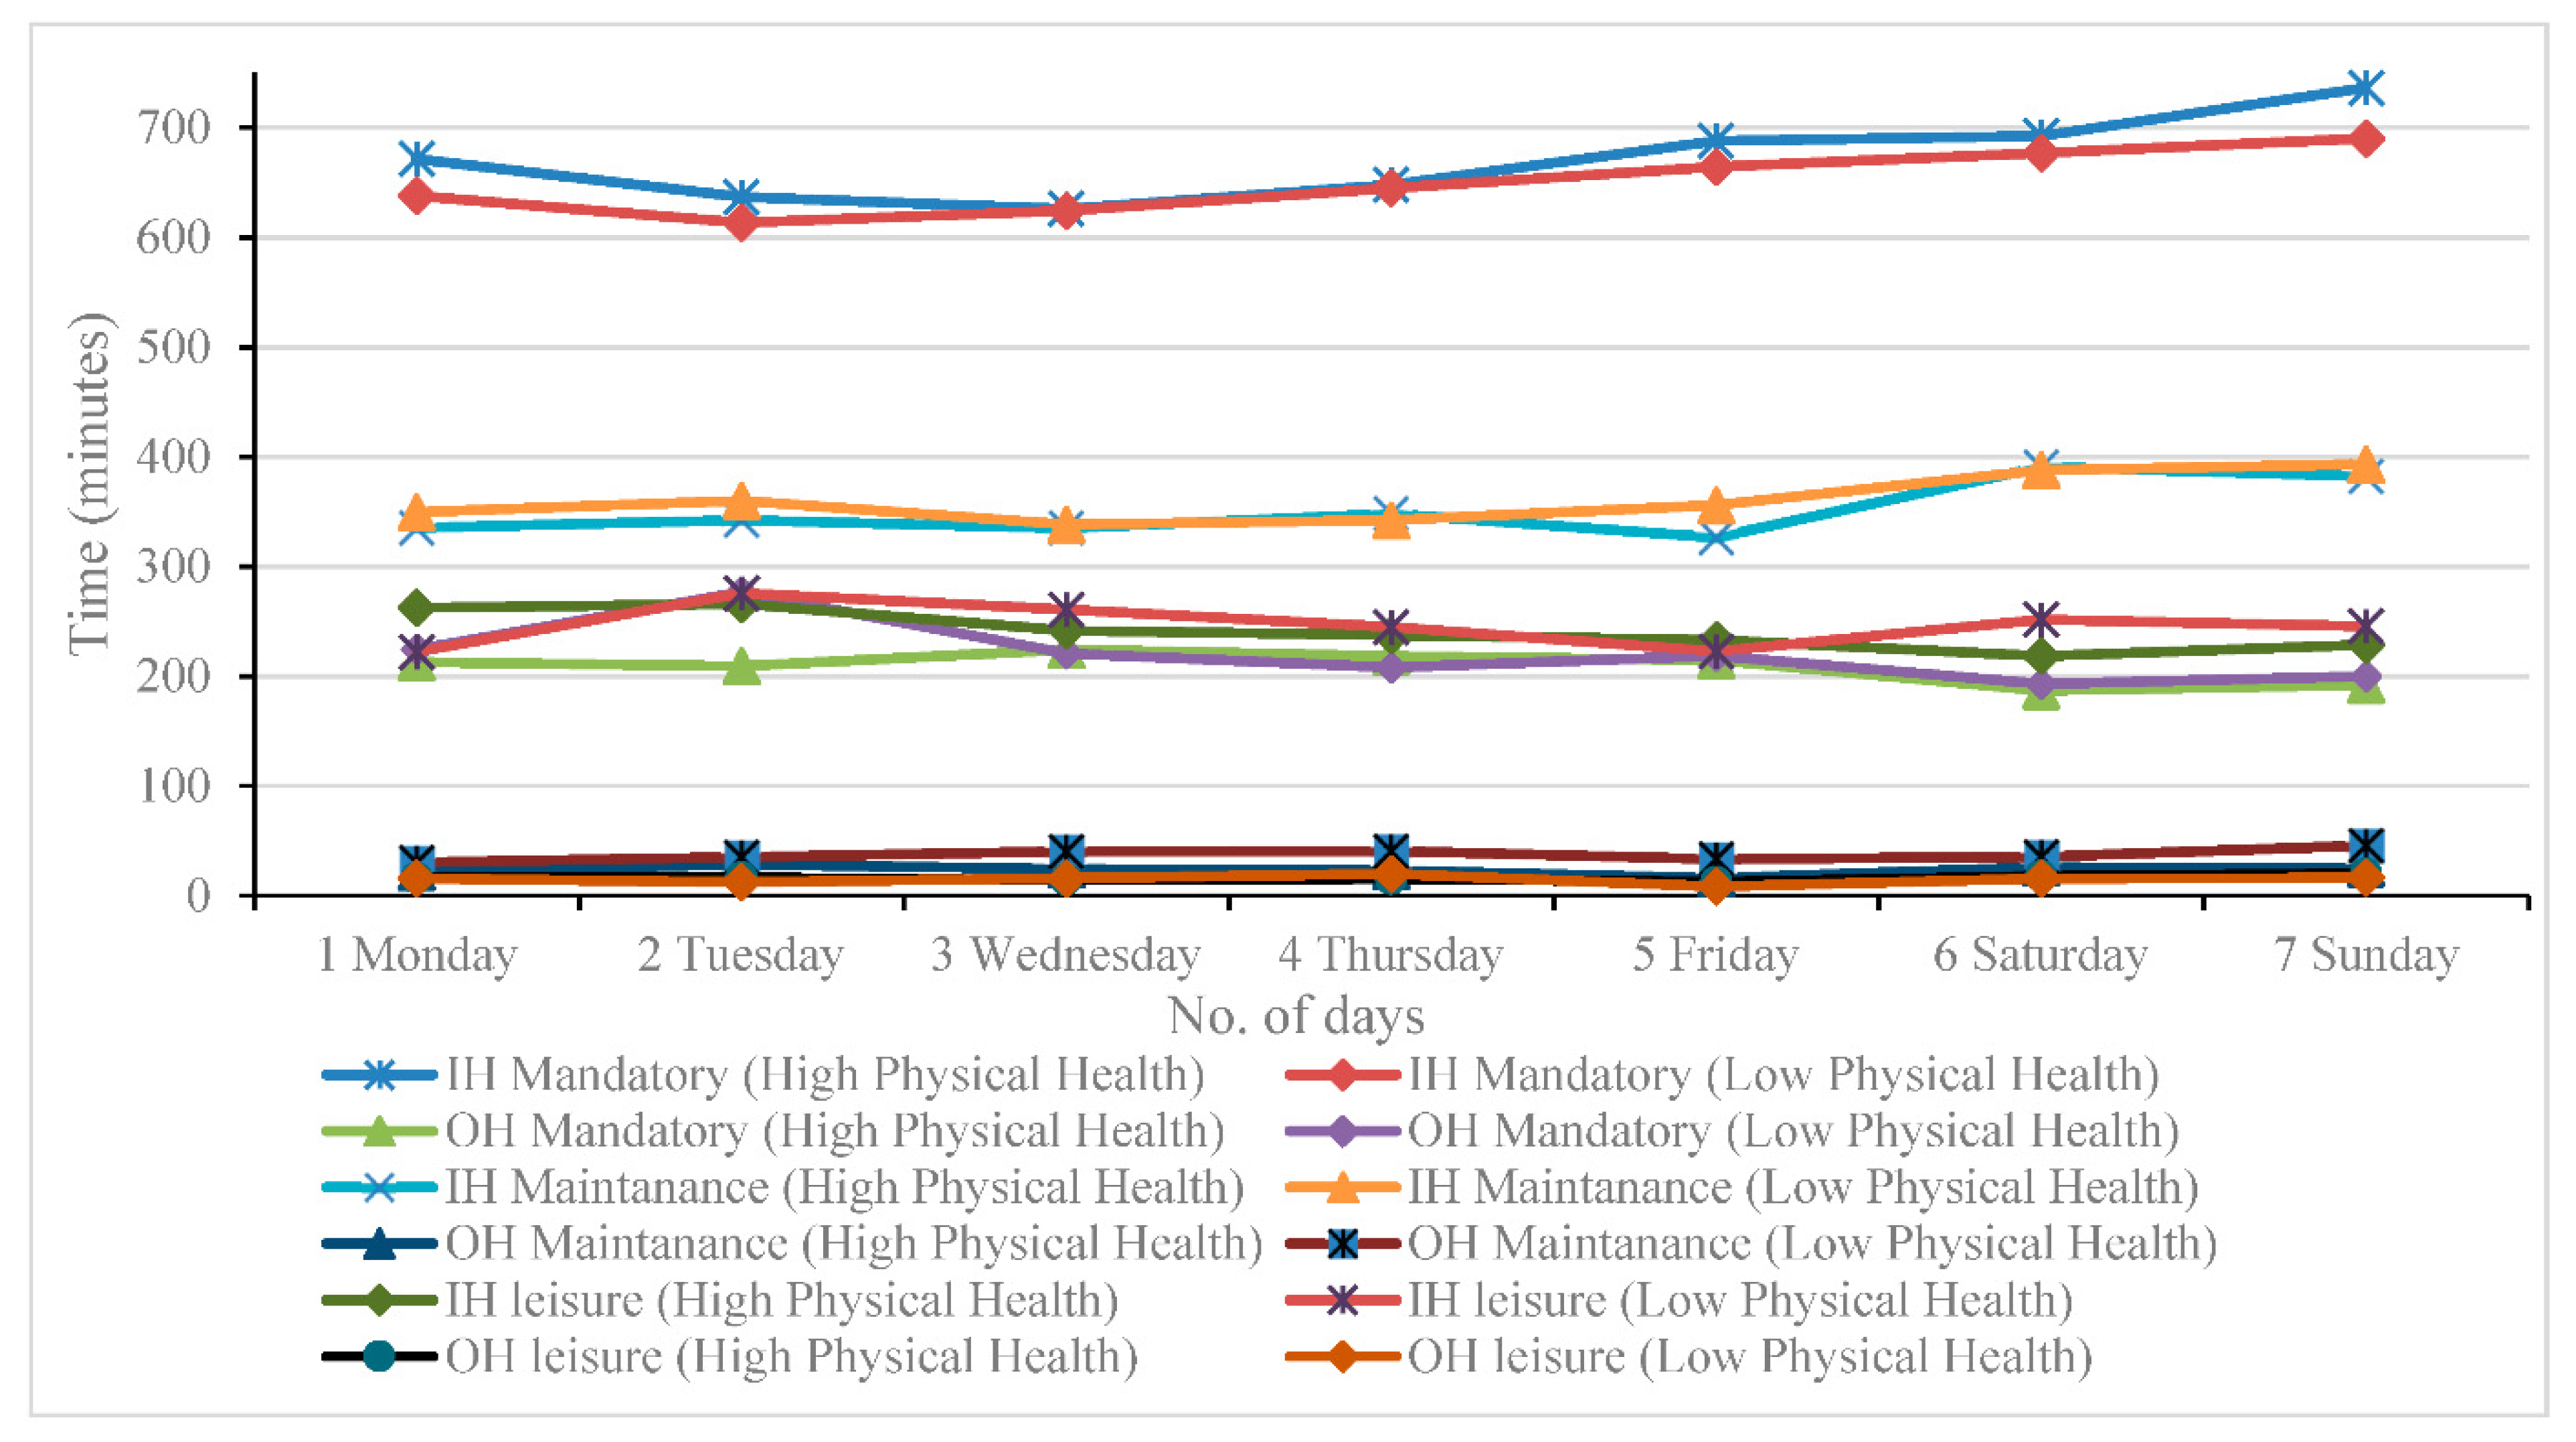
The relationship between an individual daily work, in-home, and out-of-home mandatory, leisure, and maintenance activity time used by physical health is shown in Figure 8. In this figure, high strenuous and moderate-intensity physical activity, physical and social health refers to those with an above-zero (positive value) strenuous and moderate-intensity physical activity, physical and social health index. On the other hand, low strenuous and moderate-intensity physical activity, physical and social health means someone with zero or less than zero (negative value) strenuous and moderate-intensity physical activity, physical and social health. The component score coefficient matrix is found in factor score analysis which contains the values above zero for high strenuous and moderate-intensity physical activity and physical and social health. In contrast, those below zero are used for low strenuous and moderate-intensity physical activity and physical and social health, as depicted in Figure 8 and Figure 9.
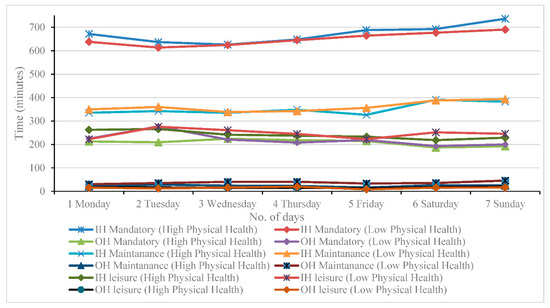
Figure 8.
Daily Time-use and Activity-Travel Pattern on Physical Health.

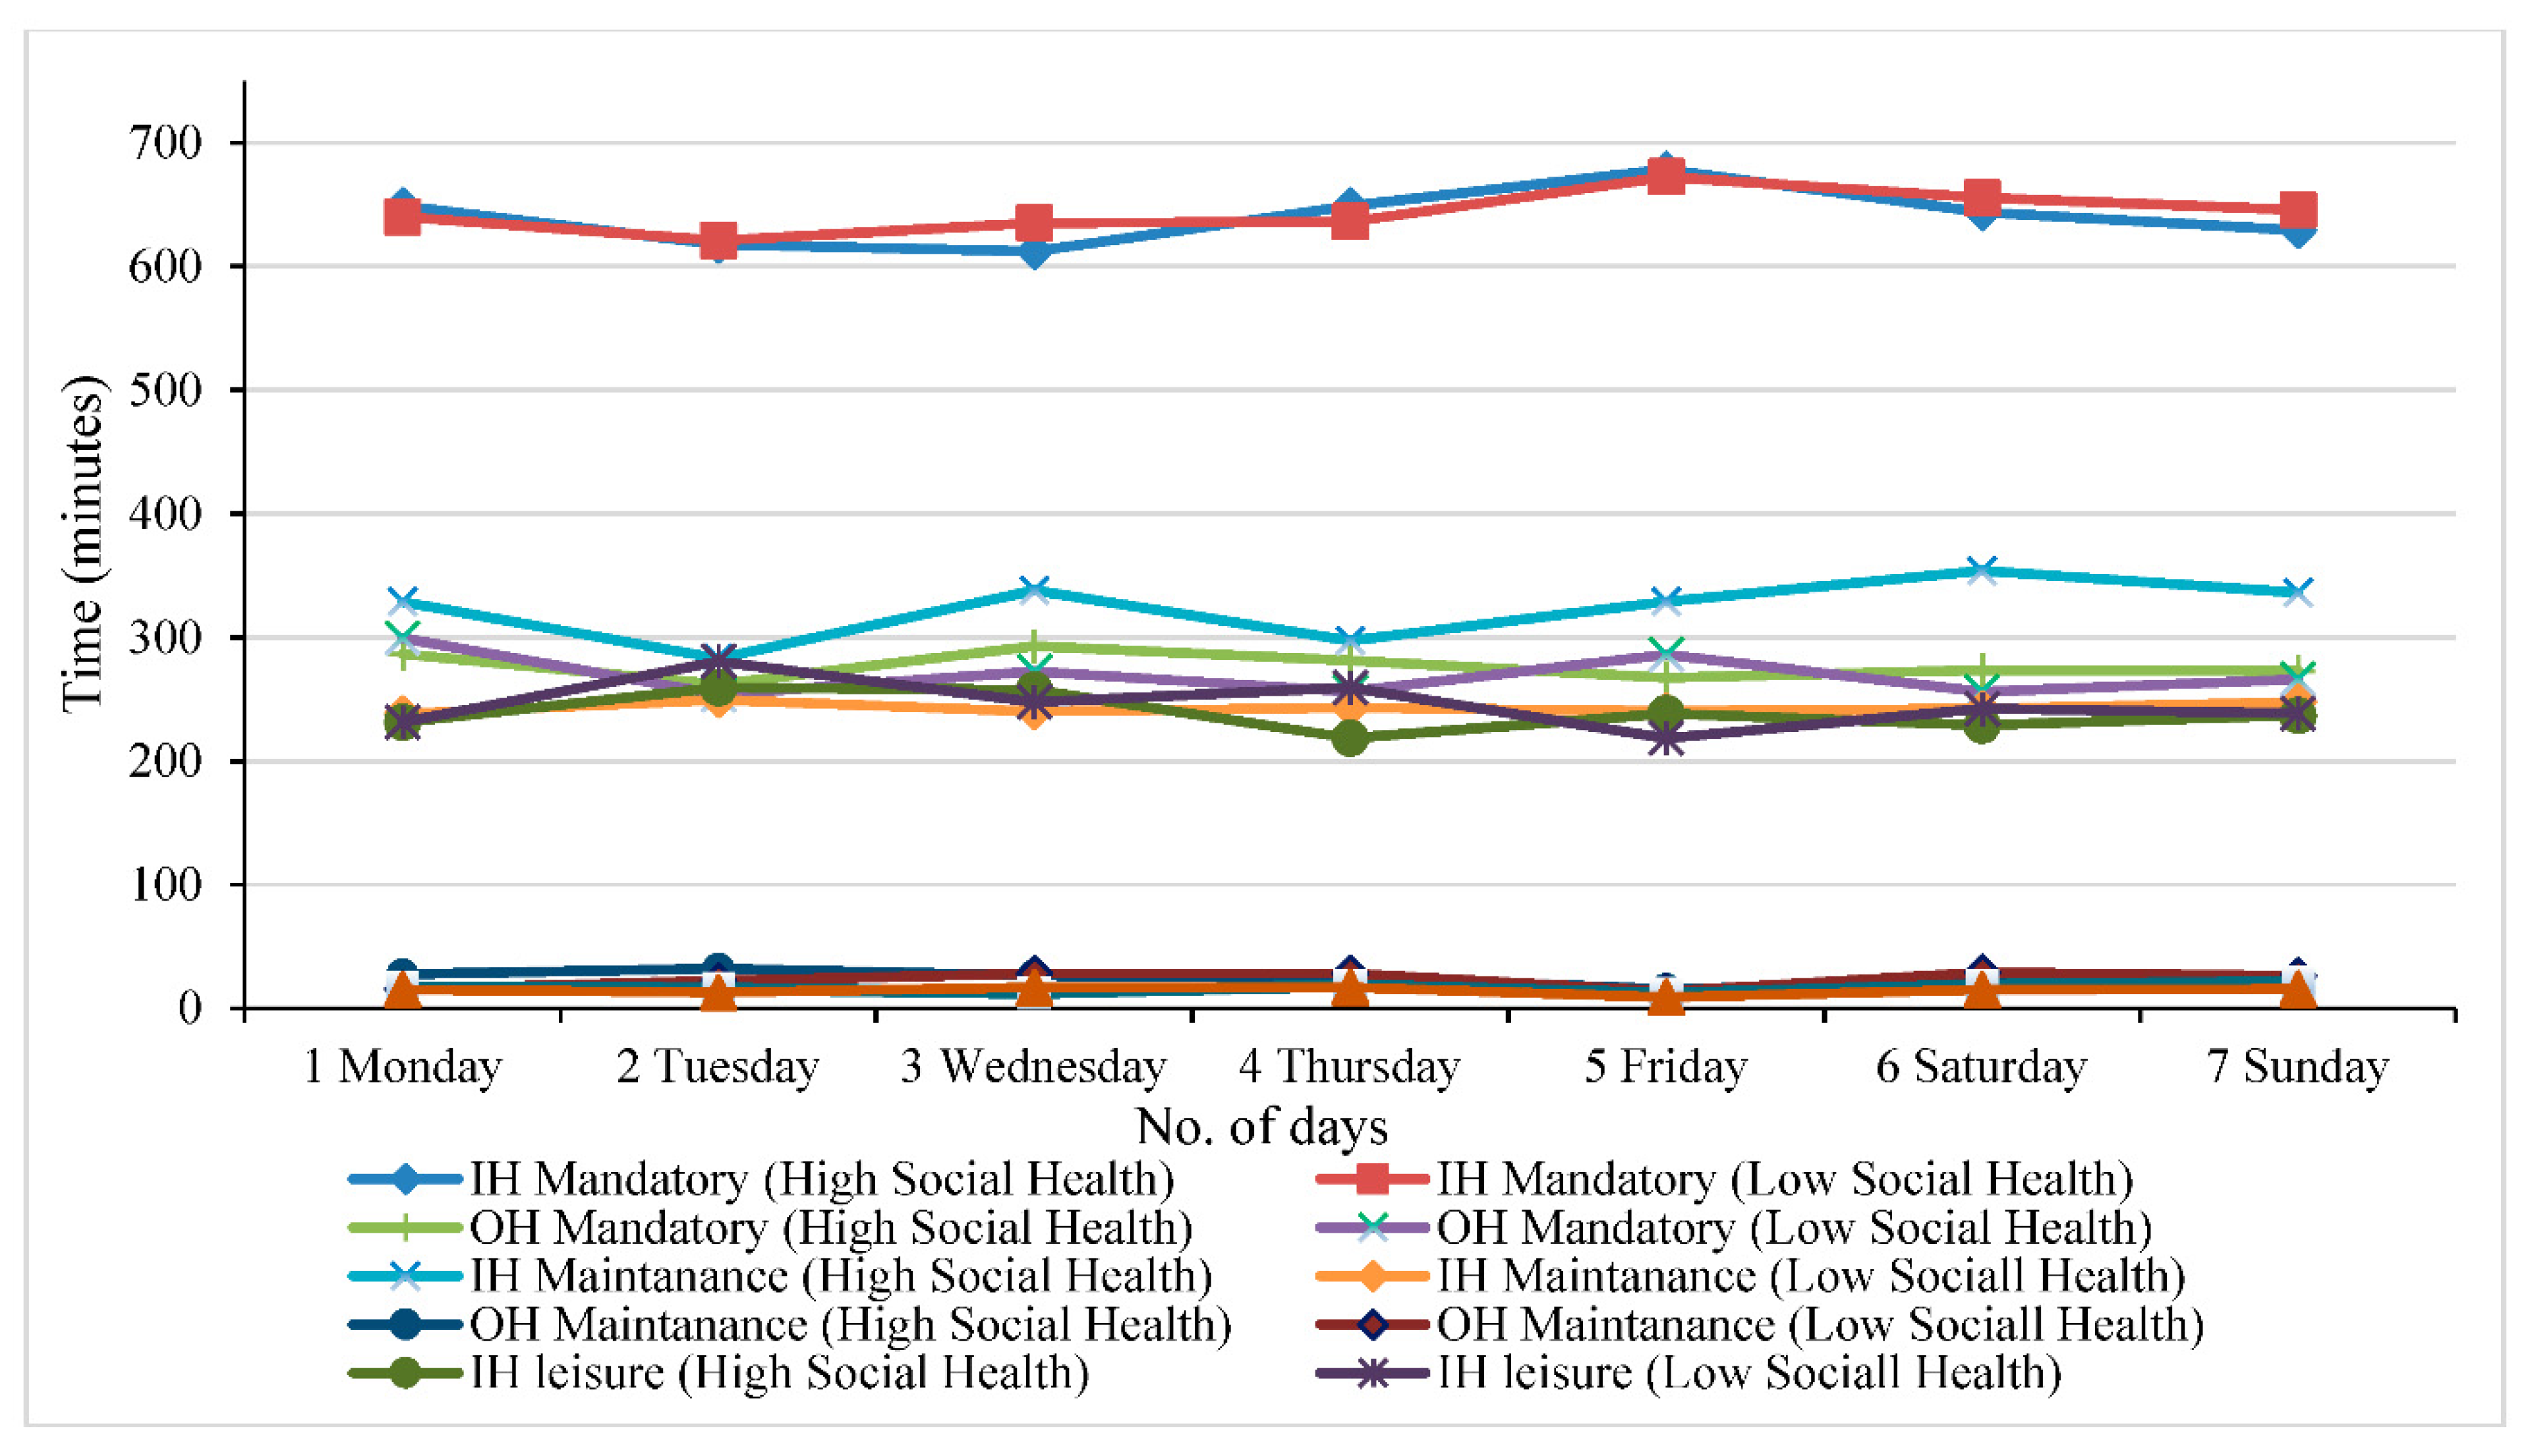
Figure 9.
Daily Time-use and Activity-Travel Pattern on Social Health.
Those people who have both the availability and accessibility of basic amenities at a walkable distance are significantly correlated with better physical and social health. Meanwhile, those who spend most of the time working by doing strenuous and moderate-intensity physical activity have better physical and social health conditions than those who have the opposite arrangement. As predictable, those who spent more time in-home and have shorter exposure to social activities retain reduced physical and social health conditions than those with the opposite sequence.
Figure 8 illustrates daily time spent for a different set of activities on a given day with physical health. Due to COVID-19, individuals spent most of the time in in-home mandatory, leisure, and maintenance activities compared to out-of-home activities. However, on weekends, the in-home activities increase, decreasing the out-of-home activities and significantly affecting individuals’ physical health. Moreover, there is a slight variation in the out-of-home leisure and maintenance activities on weekdays and weekends. Restricting individuals to do out-of-home mandatory, leisure, and maintenance activities increases in-home activities, negatively affecting physical health. All the out-of-home mandatory activities (job, pick/drop-up kids to school) are becoming online and from-home due to the COVID-19 which negatively influences individuals’ physical health.
Figure 9 illustrates the relationship between daily time use and activity participation on social health. It was impossible to do social activities during the COVID-19 pandemic and having a 1-m gap between the individuals negatively influences an individual’s social health. The in-home maintenance activities become more than the out-of-home mandatory activities due to the restriction of going outside to the reference location and participating in out-of-home activities. However, the participation in out-of-home leisure and maintenance social activities almost reaches zero due to the COVID-19 pandemic which negatively affects the social health of individuals living in UTP, Perak Malaysia.
Undertaking more physical and social activities on weekends (especially on Sunday) represents more meaningful physical and social activity participation than weekdays from Monday to Friday and Saturday. However, due to COVID-19, individuals are only allowed to fulfil their basic needs from the grocery shops and spend most of their time in in-home activities. Moreover, all the out-of-home mandatory activities also became online/virtual and restrict the interaction between the students and staff. By doing that, there is no doubt it develops the individual’s online and social skills but negatively affects social health. In contrast, the in-home and out-of-home mandatory activities become decreased on weekends and increase the in-home leisure and maintenance activities meaning that individuals are involved in working activities on weekdays and social activities on weekends from home.
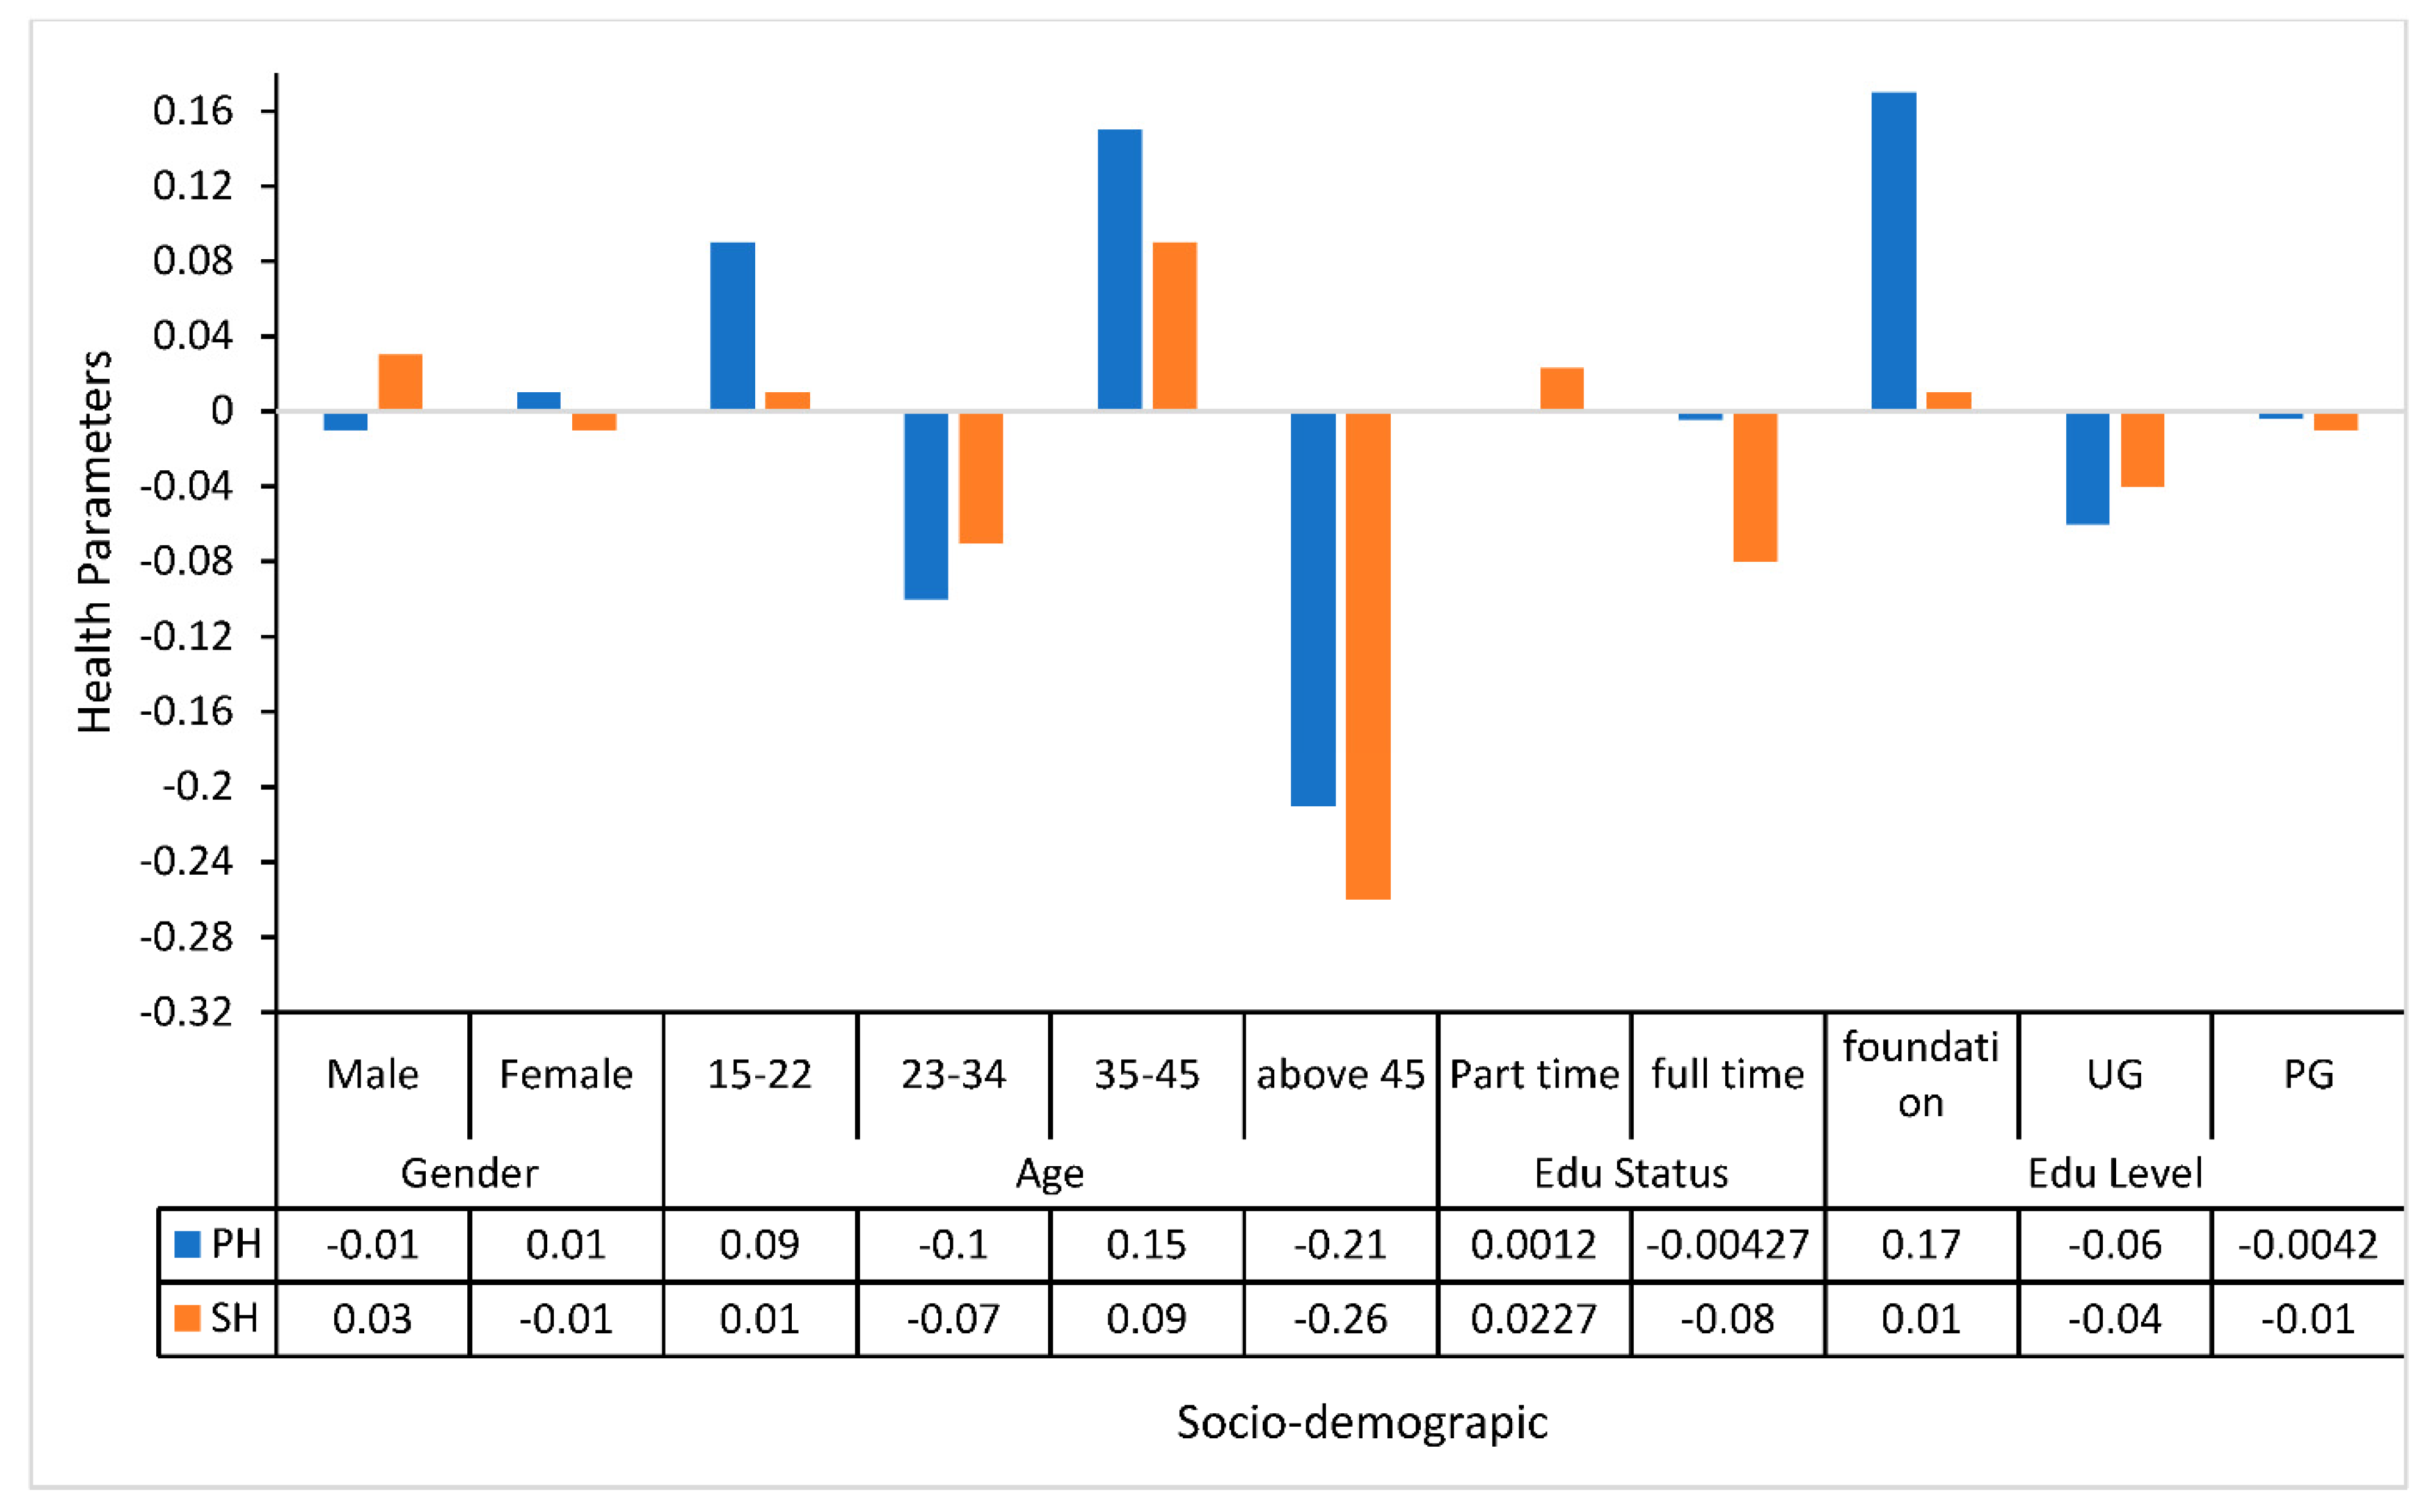
Figure 10 shows the effect of life stage variables such as socio-demographic variables on physical and social health. High physical and social health refers to someone with above zero (>0) physical and social health, whereas low physical and social health refers to those who have equal or less than zero (<0) physical and social health index. Those less than 15–22 years old show high physical and social health compared to those of 23–34 years old. This is because of participation in different physical and social activities. Those from the age of 35–45 years old have the highest physical and social health because of the family and work burden and participate in more physical and social activities, improving their physical and social health. However, those above 46 years old have the lowest physical and social health problems because of their workload, family burden, and weak body. As suggested by Rhodes et al. [37], age and gender are consistently related to physical activity. However, those above 50 years old have physical, social, and mental health problems.
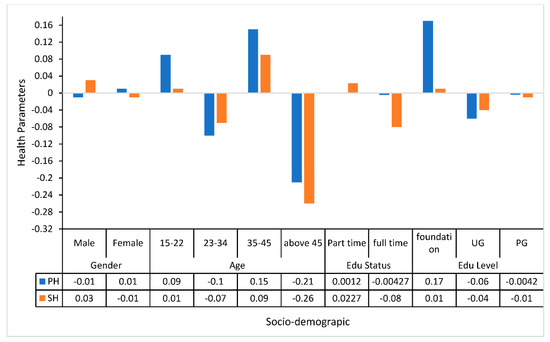
Figure 10.
Physical and social health score with socio-demographic variables.
As mentioned in recent studies [38], males participate in different activity levels (physical and social) outside their reference location, which improves their physical and social health. Due to COVID-19, working from home dramatically affects males compared to females and negatively influences their physical health. However, restricting the individual to do out-of-home mandatory, leisure, and maintenance activities negatively affects females’ social lives. Moreover, males participate in fewer in-home activities than females, which positively impacts their physical health [39].
Previous studies show that students participate in more physical and social activities, which can positively influence physical and social health [40,41]. However, this study confirms that restricting an individual to do physical and social activities outside of their reference location negatively impacts their physical and social health. Most of the students using non-motorized transport mode for their daily commuting routes to the school participate in more physical and social activities inside the school, which positively influence their physical and social health. However, during the COVID-19 pandemic, all the outside activities are closer, negatively impacting the students’ physical and social life/health. Moreover, those in foundation studies are not very affected by COVID-19. Still, those undertaking undergraduate and postgraduate studies are highly affected due to the stress and tension of their lab/experimental work and graduation requirements. Therefore, the COVID-19 pandemic negatively affects the physical and social health of both undergraduate and postgraduate students.
4. Model Estimation Results
Table 3 examines how socio-demographic variables, personal and spatial-temporal characteristics explain the average time engaged with physical activity, physical and social health at work. Meanwhile, the endogenous variable was supposed to interact with the time-use and activity travel participation, travel parameters, and average time engaged with social activities on physical and social health in a multivariate manner. Physical activity’s intensity (strenuous and moderate at work and leisure time) is used as a mediation variable between the time-use and activity-travel patterns and health parameters to solve the endogeneity problem using R-Studio, as shown in Figure 11.
Table 3.
Model estimation result for the moderate and strenuous-intensity PA at work, physical and social health (only significant variables with a p-value < 0.05 and estimated parameters of standardized variables are shown).
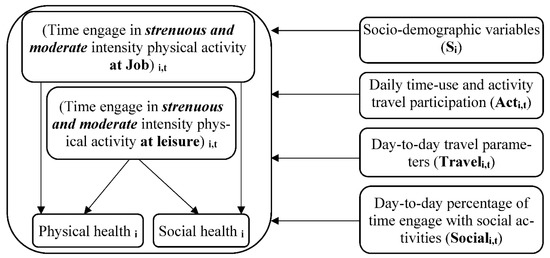
Figure 11.
The proposed model (Exogenous and endogenous variables may be nested by an individual (i) and day (t).
Table 4 illustrates the same characteristics but using strenuous and moderate-intensity physical activity at leisure time as mediating variables and evaluates the influence of daily activity participation on health parameters. In the first stage, the strenuous and moderate-intensity physical activity at work and leisure time was used as dependent variables. In contrast, all the daily time-use and activity travel participation and socio-demographic variables are used as independent variables, as shown in Equations (3) and (4) and Equations (7) and (8). Once the intermediate variable is evaluated, it is used as an exogenous variable with spatio-temporal variables and socio-demographic variables to assess the physical and social health through R-Studio as shown in Equations (5) and (6) and Equations (9) and (10). In those equations, the strenuous and moderate-intensity physical activity at work and leisure time mediate the relationship between spatio-temporal variables and health parameters to overcome the endogeneity problem, as graphically shown in Figure 11.
Table 4.
Model estimation result for the moderate and strenuous-intensity PA at leisure time, physical and social health (only significant variables with a p-value < 0.05 and estimated parameters of standardized variables are shown).
The results are estimated using 2-stage least square (2SLS) with instrumental variable (IV) and regression analysis in R-Studio by taking the standardized value to see the effect of exogenous variables on the endogenous variables, represented in positive and negative signs. In this model, the coefficient parameter (βn) is considered the individual day-to-day activity–travel participation variation made by the individual “i” on a day “t”. However, the uncorrelated and specific error term of an individual (ui) had a mean of zero. In contrast, the εi,t was the uncorrelated individual and time error component a mean value of zero. The strenuous and moderate-intensity physical activity at work, physical and social health is shown in Equations (3)–(6), whereas at leisure time is shown in Equations (7)–(10). To better explain the proposed model in Figure 11 using a mathematical form, Equations (3)–(10) can be written as follows;
- Strenuous and moderate-intensity PA at work/job, physical and social health
(Strenuous-Intensity Physical Activity at Job)i,t = (αi + ui) + β1 Si + β2 Acti,t + β3 Traveli,t + β4 Sociali,t + εi,t
(Moderate-Intensity Physical Activity at Job)i,t = (αi + ui) + β5 Si + β6 Acti,t + β7 Traveli,t + β8 Sociali,t + εi,t
(Physical-health)i = (αi + ui) + β9 Si + β10 Acti,t + β11 Traveli,t + β12 Sociali,t + ɣ1 (Moderate-intensity PA at work)i,t + ɣ2 (Strenuous-intensity PA at work)i,t + εi,t
(Social-health)i = (αi + ui) + β13 Si + β14 Acti,t + β15 Traveli,t + β16 Sociali,t + ɣ3 (Moderate-intensity PA at work)i,t + ɣ4 (Strenuous-intensity PA at work)i + εi,t
- Strenuous and moderate-intensity PA at leisure time, physical and social health
(Strenuous-Intensity Physical Activity at leisure)i,t = (αi + ui) + β17 Si + β18 Acti,t + β19 Traveli,t + β20 Sociali,t + εi,t
(Moderate-Intensity Physical Activity at leisure)i,t = (αi + ui) + β21 Si+ β22 Acti,t + β23 Traveli,t + β24 Sociali,t + εi,t
(Physical-health)i = (αi + ui) + β25 Si + β26 Acti,t + β27 Traveli,t + β28 Sociali,t + ɣ5 (Moderate-intensity at leisure)i,t + ɣ6 (Strenuous-intensity at leisure)i,t + εi,t
(Social-health)i = (αi + ui) + β29 Si + β30 Acti,t + β31 Traveli,t + β32 Sociali,t + ɣ7 (Moderate-intensity at leisure)i,t + ɣ8 (Strenuous-intensity at leisure)i,t + εi,t
Regarding the socio-demographic variables at work, males are more likely than females in moderate and strenuous-intensity PA [42]. Males have 8.70 times moderate and 18.25 strenuous-intensity physical activity than females, whereas 0.30 negatively correlates with social health and has no correlation with physical health. However, based on leisure-time physical activity, males positively correlate with 3.04 moderate and 3.15 strenuous-intensity physical activity, which is quite lower than physical activity intensity at work. Moreover, postgraduate students at work are positively correlated with strenuous-intensity PA, physical and social health. In contrast, no such correlation was found between foundation studies, physical activity intensity, and health parameters. For example, a unit increase in postgraduate studies is 22% positively correlated with physical health and 9% with social health. However, based on leisure-time physical activity, postgraduate students are positively correlated with moderate and strenuous-intensity physical activity, physical and social health. Moreover, foundation students negatively correlate with moderate-intensity physical activity and a positive correlation with strenuous activity and physical health but have no such correlation with social health. A unit increase in the leisure-time physical activity at postgraduate studies is 11% positively correlated with physical health and 12% with social health. The health parameters of the students are affected by financial circumstances [43]. Individuals from the low-income group will have longer working hours and will be involved more in both strenuous and moderate-intensity physical activity at work and leisure time, improving the physical and social health compared to the high-income individuals, which is the opposite.
Regarding the age, those aged 34–45 years old are positively correlated with moderate-intensity physical activity, while those aged 15–34 years old are positively associated with strenuous-intensity physical activity at work. However, physical health was the opposite, and no such correlation was found with social health at work. Moreover, those aged 22 years old and below are negatively correlated moderate and strenuous-intensity physical activity at leisure time and are positively associated with physical health. Previous studies show that younger people are involved in more strenuous and moderate-intensity physical activity [44,45,46], improving their physical, social, and mental health. Still, this study confirms that COVID-19 limits the individual to participate in a different set of activities that negatively influence their physical and social health. However, participating in various activities on a given day statistically positively influences physical health but negatively correlated with social health [47]. Those from 15 to 45 years of age participate in more moderate and strenuous-intensity physical activity with better physical and social health [42]. Moreover, this study confirms that restricting to do out-of-home activities is negatively influencing the physical activity intensity. A unit increase in the restriction to do out-of-home activities at leisure time is 24% negatively correlated with social health.
Regarding activity classification, in-home mandatory activities are positively correlated with physical activity intensity at work and physical health. However, suppose the individual is restricted to do out-of-home activities; in that case, they can improve their physical health by participating in different activities at home but have no relationship with social health. This study also confirms that participating in out-of-home physical and social activities at work and leisure-time physical activity positively correlates with better physical and social health. Furthermore, recent studies also show that participating in more out-of-home activities improves physical and social health. Therefore, this study confirms that if the individual is restricted to do out-of-home mandatory, leisure, and maintenance activities, it will negatively influence their physical activity intensity, physical and social health. For example, a unit restriction in out-of-home maintenance activities is 5% negatively correlated with moderate-intensity physical activity.
Table 3 and Table 4 show the statistically significant influence of time-use and activity travel participation and travel patterns on travellers’ physical and social health. Committing to using the non-motorized and public mode of transport for their daily activity are positive correlates with physical and social health. During the COVID-19 pandemic, those individuals who use any transport mode to do out-of-home activities are negatively influencing the intensity of their physical activities but have a positive correlation which social health and have no such correlation with physical because using the motorized transport mode negatively affect physical health and participating in any social activity are positively associated with social health. Previous studies confirm that participating in a different set of activities on a given day outside your residence by using non-motorized transport mode is positively associated with physical and social health [48]. In addition, participating in physical activities at leisure time can mediate the relationship between social relationships and social health [49]. This study confirms that using auxiliary time to participate in different physical and social activities is positively associated with physical and social health.
The social activities comprise the interactions within the family and other family members and with friends and colleagues. The model estimation results indicated that the frequency (number of days) of social activities at leisure had a 4% positive influence on physical health, whereas 9% positively impacted social health. Moreover, the duration (Min/day) of social activities at leisure time had an 8% positive influence on physical health, whereas 12% positively impacted social health, as shown in Table 4. The conclusions drawn by different researchers support the estimation results of the present study [50,51,52]. In this study, the frequency of social activities between a family member and other individuals is 2.16, 2.38 and 0.87, 2.09 negatives correlated with moderate and strenuous-intensity physical activity. Moreover, the duration of social activities between family members and other individuals are 0.22 and 0.12, positively associated with moderate and strenuous-intensity physical activity. However, due to the restriction of out-of-home physical and social activities, there is no such relation between the intensity of an activity and health parameters at the workplace.
Moreover, the duration of social activities at leisure time shows a positive correlation with physical health. On the other hand, the frequency of social activity shows a negative correlation with social health, which is why the current research uses the duration of physical activity intensity. However, there is no statistical correlation between social activity (with a family member and other individuals) and physical health.
5. Conclusions
The current study statistically evaluated the influence of time-use and activity travel participation, activity–travel patterns, travel parameters, social engagement within a family and other family members, and socio-demographic variables on health parameters using physical activity intensity at work and leisure time as mediation variables during the COVID-19 pandemic. The following conclusion can be drawn based on the model estimation results.
Both the strenuous and moderate-intensity physical activity at work and leisure time mediated the relationship between spatial–temporal variables and health parameters. However, moderate-intensity physical activity positively mediated the relationship between the time-use and activity travel participation and health parameters, whereas strenuous-intensity physical activity did the opposite. The relationship between spatial–temporal variables, intermediate variables, and health parameters was evaluated using multivariate analysis and structural equation modelling through R-Studio. Physical activity intensity was used as a dependent variable in the first level, whereas all the spatial–temporal variables were used as independent variables. However, in the second stage, the spatial–temporal variables were used as exogenous variables. In contrast, the physical activity intensity was used as a mediation variable for the endogenous variables (health parameters).
The survey results depicted that individuals spent 95% of their daily time for in-home mandatory (sleeping, bathing, and eating) and maintenance activities because of the lockdown in COVID-19, which negatively influenced their physical and social health. However, some individuals participated in in-home mandatory, maintenance, and leisure activities, which positively affected their physical health. The estimated results also indicated that a unit increase in the in-home maintenance activities during the COVID-19 pandemic introduced a daily increment of 0.005 (0.5%) in physical health. The COVID-19 restricted individuals from doing out-of-home mandatory, maintenance, and leisure activity, which negatively influenced their social health.
In terms of social activities within and with other family members, having more household members provided more opportunities to engage in more physical and social activities that improved one’s physical and social health. On the other hand, many households with low income caused psychological distress, which caused social health problems. Conversely, an individual from a large family being free from different household activities experienced a positive impact on his physical and social health. A 0.01 positive correlation between in-home social activities and social health was found for the individuals who spent more time in in-home social activities during leisure time. A unit increase in the in-home social activities at leisure time caused a 1% positive increment in social health. The individuals with more dependents experienced better physical and social health due to increased physical exercise and communication activities among the dependents.
During the COVID-19 pandemic, most individuals use personal motorized transport mode instead of public and non-motorized transport mode, negatively influencing their physical and social health. Individuals perform multitasking activities during public transport, such as using social media, replying to emails, chatting with friends, and talking to someone inside the public transport, improving their physical and social health. This study confirms that those who use motorized transport mode to go to grocery shops and government offices negatively influence their physical and social health. A unit increase in min/day using motorized transport mode 0.02 (2%) negatively influences physical health, whereas 0.01 (1%) negatively affects social health.
The estimated results show that the coefficient of determination (R2) values for moderate and strenuous-intensity physical activity were 0.185 (18.5%) and 0.189 (18.9%), whereas they were 0.207 (20.7%) and 0.148 (14.8%) for physical and social health at work. However, at leisure-time physical activity, the R2 value for moderate and strenuous-intensity physical activity was 0.188 (18.8%) and 0.227 (22.7%), whereas it was 0.205 (20.5%) and 0.190 (19%) for physical and social health. Moreover, in psychological research, travel behaviour studies, and health research, the coefficient of determination (R2) of 0.1 (10%) can be considered satisfactory for the endogenous variables, whereas the value of R2 0.20 that 20% is considered very high.
Although this research is quite significant in terms of theoretical contribution, there are certain limitations that can be addressed by future researchers. Firstly, the data used in this research are limited to a single institute, with a sample of 150 respondents. Therefore, future work can extend the current study by taking the sample from various institutes from Malaysia to increase the generalizability of the results. Secondly, the COVID-19 pandemic has impacted overall populations, not only students. Therefore, future researchers can collect the data from various organizations and households to delve into the influence of daily activities on health parameters. Lastly, the current study used a web-based questionnaire survey which caused possible bias. Hence, future researchers are advised to collect face-to-face and qualitative data to deepen the effect of COVID-19 on health parameters.
Author Contributions
M.A., A.R.G.d.A. and M.T.M.; Data curation, M.I.K., M.A., A.M.M., F.M., and N.M.Y.A.; Formal analysis, M.K.S., M.A.K., R.F., and R.T.; Funding acquisition, M.A., R.F., A.B. and A.R.G.d.A.; Investigation, M.T.M., M.I.K., A.M.M., and F.M.; Methodology, I.U.H., M.K.S., and M.A.K.; Project administration, M.A., R.F., A.B., R.T. and A.R.G.d.A.; Resources, R.F., M.A., A.B., R.T. and A.R.G.d.A.; Supervision, R.F., M.A., A.B., R.T. and A.R.G.d.A.; Validation, R.F., M.A., A.B., R.T. and A.R.G.d.A.; Visualization, M.A., R.F., A.B., R.T. and A.R.G.d.A.; Writing–original draft, M.A., R.F., A.B., R.T. and A.R.G.d.A.; Writing–review & editing, M.A., R.F., A.B., R.T. and A.R.G.d.A. All authors have read and agreed to the published version of the manuscript.
Funding
The research is partially funded by the Ministry of Science and Higher Education of the Russian Federation as part of World-class Research Center program: Advanced Digital Technologies (contract No. 075-15-2020-934 dated 17 November 2020).
Institutional Review Board Statement
Not applicable.
Informed Consent Statement
Not applicable.
Data Availability Statement
Data sharing not applicable.
Acknowledgments
Not applicable.
Conflicts of Interest
The authors declare no conflict of interest.
References
- Ghebreyesus, T.A. WHO Director-General’s Opening Remarks at the Media Briefing on COVID-19-11 March 2020; World Health Organization: Geneva, Switzerland, 2020; Available online: https://www.who.int/director-general/speeches/detail/who-director-general-s-opening-remarks-at-the-media-briefing-on-covid-19---11-march-2020 (accessed on 29 June 2021).
- Spina, S.; Marrazzo, F.; Migliari, M.; Stucchi, R.; Sforza, A.; Fumagalli, R. The Response of Milan’s Emergency Medical System to the COVID-19 Outbreak in Italy. Lancet 2020, 395, e49–e50. [Google Scholar] [CrossRef] [Green Version]
- Aristovnik, A.; Keržič, D.; Ravšelj, D.; Tomaževič, N.; Umek, L. Impacts of the COVID-19 Pandemic on Life of Higher Education Students: A Global Perspective. Sustainability 2020, 12, 8438. [Google Scholar] [CrossRef]
- Elengoe, A. COVID-19 Outbreak in Malaysia. Osong Public Health Res. Perspect. 2020, 11, 93–100. [Google Scholar] [CrossRef]
- Times, N.S. [Breaking] 3 Coronavirus Cases Confirmed in Johor Baru, In Internet. 2020. Available online: https://www.nst.com.my/news/nation/2020/01/559563/breaking-3-coronavirus-cases-confirmed-johor-baru (accessed on 29 June 2021).
- First Coronavirus Cases in Malaysia: 3 Chinese Nationals Confirmed Infected, Quarantined in Sungai Buloh Hospital. 2020. Available online: https://www.theborneopost.com/2020/01/25/first-coronavirus-cases-in-malaysia-3-chinese-nationals-confirmed-infected-quarantined-in-sungai-buloh-hospital/ (accessed on 29 June 2021).
- Chinese Girl Recovers from Coronavirus, Discharged from Hospital. 2020. Available online: https://www.bernama.com/en/general/news.php?id=1811559 (accessed on 29 June 2021).
- Yassin, M. Coronavirus: Malaysia in Partial Lockdown from March 18 to Limit Outbreak. 2020. Available online: https://www.scmp.com/week-asia/health-environment/article/3075456/coronavirus-malaysias-prime-minister-muhyiddin-yassin (accessed on 29 June 2021).
- Tang, K.H.D. Movement Control as an Effective Measure Against Covid-19 Spread in Malaysia: An Overview. J. Public Health 2020, 1–4. [Google Scholar] [CrossRef]
- Shah, A.U.M.; Safri, S.N.A.; Thevadas, R.; Noordin, N.K.; Rahman, A.A.; Sekawi, Z.; Ideris, A.; Sultan, M.T.H. COVID-19 Outbreak in Malaysia: Actions Taken by the Malaysian Government. Int. J. Infect. Dis. 2020, 97, 108–116. [Google Scholar] [CrossRef]
- Yau, E.K.B.; Ping, N.P.T.; Shoesmith, W.D.; James, S.; Hadi, N.M.N.; Lin, L.J.; Clinic, C.A.N.W.L.N.F.T.Q. The Behaviour Changes in Response to COVID-19 Pandemic within Malaysia. Malays. J. Med. Sci. 2020, 27, 45–50. [Google Scholar] [CrossRef]
- Gonzalez, T.; De La Rubia, M.A.; Hincz, K.P.; Comas-Lopez, M.; Subirats, L.; Fort, S.; Sacha, G.M. Influence of COVID-19 Confinement on Students’ Performance in Higher Education. PLoS ONE 2020, 15, e0239490. [Google Scholar] [CrossRef]
- Aucejo, E.M.; French, J.; Araya, M.P.U.; Zafar, B. The Impact of COVID-19 on Student Experiences and Expectations: Evidence from a Survey. J. Public Econ. 2020, 191, 104271. [Google Scholar] [CrossRef]
- Cao, W.; Fang, Z.; Hou, G.; Han, M.; Xu, X.; Dong, J.; Zheng, J. The Psychological Impact of the COVID-19 Epidemic on College Students in China. Psychiatry Res. 2020, 287, 112934. [Google Scholar] [CrossRef] [PubMed]
- Maugeri, G.; Castrogiovanni, P.; Battaglia, G.; Pippi, R.; D’Agata, V.; Palma, A.; Di Rosa, M.; Musumeci, G. The Impact of Physical Activity on Psychological Health during Covid-19 Pandemic in Italy. Heliyon 2020, 6, e04315. [Google Scholar] [CrossRef]
- Pragholapati, A. COVID-19 Impact on Students. 2020. Available online: https://edarxiv.org/895ed/ (accessed on 29 June 2021).
- Sahu, P. Closure of Universities Due to Coronavirus Disease 2019 (COVID-19): Impact on Education and Mental Health of Students and Academic Staff. Cureus 2020, 12, e7541. [Google Scholar] [CrossRef] [PubMed] [Green Version]
- Ali, M.; Abbas, S.; Khan, M.I.; Gad, M.A.; Ammad, S.; Khan, A. Experimental Validation of Mander’s Model for Low Strength Confined Concrete Under Axial Compression. In Proceedings of the 2020 Second International Sustainability and Resilience Conference: Technology and Innovation in Building Designs(51154), Sakheer, Bahrain, 11–12 November 2020. [Google Scholar] [CrossRef]
- Marelli, S.; Castelnuovo, A.; Somma, A.; Castronovo, V.; Mombelli, S.; Bottoni, D.; Leitner, C.; Fossati, A.; Ferini-Strambi, L. Impact of COVID-19 Lockdown on Sleep Quality in University Students and Administration Staff. J. Neurol. 2021, 268, 8–15. [Google Scholar] [CrossRef] [PubMed]
- Carter, S.J.; Baranauskas, M.N.; Fly, A.D. Considerations for Obesity, Vitamin D, and Physical Activity Amid the COVID-19 Pandemic. Obesity 2020, 28, 1176–1177. [Google Scholar] [CrossRef] [PubMed]
- Cheval, B.; Sivaramakrishnan, H.; Maltagliati, S.; Fessler, L.; Forestier, C.; Sarrazin, P.; Orsholits, D.; Chalabaev, A.; Sander, D.; Ntoumanis, N.; et al. Relationships between Changes in Self-Reported Physical Activity, Sedentary Behaviour and Health during the Coronavirus (COVID-19) Pandemic in France and Switzerland. J. Sports Sci. 2021, 39, 699–704. [Google Scholar] [CrossRef] [PubMed]
- Dwyer, M.J.; Pasini, M.; De Dominicis, S.; Righi, E. Physical Activity: Benefits and Challenges during the COVID-19 Pandemic. Scand. J. Med. Sci. Sports 2020, 30, 1291–1294. [Google Scholar] [CrossRef] [PubMed]
- Jakobsson, J.; Malm, C.; Furberg, M.; Ekelund, U.; Svensson, M. Physical Activity during the Coronavirus (COVID-19) Pandemic: Prevention of a Decline in Metabolic and Immunological Functions. Front. Sports Act. Living 2020, 2, 57. [Google Scholar] [CrossRef] [PubMed]
- Hammami, A.; Harrabi, B.; Mohr, M.; Krustrup, P. Physical Activity and Coronavirus Disease 2019 (COVID-19): Specific Recommendations for Home-Based Physical Training. Manag. Sport Leis. 2020, 1–6. [Google Scholar] [CrossRef]
- Ali, M.; Room, S.; Khan, M.I.; Masood, F.; Memon, R.A.; Khan, R.; Memon, A.M. Assessment of Local Earthen Bricks in Perspective of Physical and Mechanical Properties Using Geographical Information System in Peshawar, Pakistan. Structues 2020, 28, 2549–2561. Available online: https://www.sciencedirect.com/science/article/pii/S2352012420306329 (accessed on 29 June 2021). [CrossRef]
- Shahidi, S.H.; Williams, J.S.; Hassani, F. Physical Activity during COVID-19 Quarantine. Acta Paediatr. 2020, 109, 2147–2148. [Google Scholar] [CrossRef]
- Woods, J.A.; Hutchinson, N.T.; Powers, S.K.; Roberts, W.O.; Gomez-Cabrera, M.C.; Radak, Z.; Berkes, I.; Boros, A.; Boldogh, I.; Leeuwenburgh, C.; et al. The COVID-19 Pandemic and Physical Activity. Sports Med. Health Sci. 2020, 2, 55–64. Available online: https://www.sciencedirect.com/science/article/pii/S2666337620300251 (accessed on 29 June 2021). [CrossRef]
- Zhang, J. Urban Forms and Health Promotion: An Evaluation Based on Health-Related QOL Indicators. In Proceedings of the 13th World Conference on Transportation Research, Rio de Janeiro, Brazil, 15–18 July 2013. [Google Scholar]
- Van Wee, B.; Ettema, D. Travel Behaviour and Health: A Conceptual Model and Research Agenda. J. Transp. Health 2016, 3, 240–248. [Google Scholar] [CrossRef] [Green Version]
- Barreto, E.D.; Stafanato, K.V.; Marvila, M.T.; De Azevedo, A.; Ali, M.; Pereira, R.; Monteiro, S.N. Clay Ceramic Waste as Pozzolan Constituent in Cement for Structural Concrete. Materials 2021, 14, 2917. [Google Scholar] [CrossRef]
- Israel, G.D. Determining Sample Size. 1992. Available online: https://www.researchgate.net/profile/Subhash-Basu-3/post/how_could_i_determine_sample_size_for_my_study/attachment/5ebaa4924f9a520001e613b6/AS%3A890361492811785%401589290130539/download/samplesize1.pdf (accessed on 29 June 2021).
- Krejcie, R.V.; Morgan, D.W. Determining Sample Size for Research Activities. Educ. Psychol. Meas. 1970, 30, 607–610. [Google Scholar] [CrossRef]
- Axhausen, K.W.; Zimmermann, A.; Schönfelder, S.; Rindsfüser, G.; Haupt, T. Observing the Rhythms of Daily Life: A Six-Week Travel Diary. Transportation 2002, 29, 95–124. [Google Scholar] [CrossRef]
- Suzukamo, Y.; Fukuhara, S.; Green, J.; Kosinski, M.; Gandek, B.; Ware, J.E. Validation Testing of a Three-Component Model of Short Form-36 Scores. J. Clin. Epidemiol. 2011, 64, 301–308. Available online: https://www.ncbi.nlm.nih.gov/pubmed/20800993 (accessed on 29 June 2021). [CrossRef]
- DiStefano, C.; Zhu, M.; Mindrila, D. Understanding and Using Factor Scores: Considerations for the Applied Researcher. Pract. Asses. Res. Eval. 2009, 14, 20. [Google Scholar] [CrossRef]
- Yong, A.G.; Pearce, S. A Beginner’s Guide to Factor Analysis: Focusing on Exploratory Factor Analysis. Tutor. Quant. Methods Psychol. 2013, 9, 79–94. [Google Scholar] [CrossRef]
- Rhodes, R.E.; Blanchard, C.M.; Blacklock, R.E. Do Physical Activity Beliefs Differ by Age and Gender? J. Sport Exerc. Psychol. 2008, 30, 412–423. [Google Scholar] [CrossRef]
- Azevedo, M.R.; Araújo, C.L.P.; Reichert, F.F.; Siqueira, F.V.; Da Silva, M.C.; Hallal, P.C. Gender Differences in Leisure-Time Physical Activity. Int. J. Public Health 2007, 52, 8–15. [Google Scholar] [CrossRef] [Green Version]
- Kenyon, S. What Do We Mean by Multitasking?-Exploring the Need for Methodological Clarification in Time Use Research. Electron. Int. J. Time Use Res. 2010, 7, 42–60. [Google Scholar] [CrossRef]
- Hodgson, S.; Namdeo, A.; Araújo-Soares, V.; Pless-Mulloli, T. Towards an Interdisciplinary Science of Transport and Health: A Case Study on School Travel. J. Transp. Geogr. 2012, 21, 70–79. [Google Scholar] [CrossRef] [Green Version]
- Lacy, K.E.; Allender, S.E.; Kremer, P.J.; De Silva-Sanigorski, A.M.; Millar, L.M.; Moodie, M.L.; Mathews, L.B.; Malakellis, M.; Swinburn, B.A. Screen Time and Physical Activity Behaviours are Associated with Health-Related Quality of Life in Australian Adolescents. Qual. Life Res. 2012, 21, 1085–1099. Available online: https://www.ncbi.nlm.nih.gov/pubmed/21932139 (accessed on 29 June 2021). [CrossRef]
- DiPietro, L. Physical Activity in Aging: Changes in Patterns and Their Relationship to Health and Function. J. Gerontol. Ser. A Boil. Sci. Med. Sci. 2001, 56 (Suppl. 2), 13–22. [Google Scholar] [CrossRef]
- Roberts, R.; Golding, J.; Towell, T.; Reid, S.; Woodford, S.; Vetere, A.; Weinreb, I. Mental and Physical Health in Students: The Role of Economic Circumstances. Br. J. Health Psychol. 2000, 5, 289–297. [Google Scholar] [CrossRef]
- Zemitis, J.; Bogdanovics, R.; Bogdanovica, S. The Study of Co2 Concentration in A Classroom During The Covid-19 Safety Measures. In E3S Web of Conferences; EDP Sciences: Les Ulis, France, 2021. [Google Scholar]
- Fediuk, R. High-strength Fibrous Concrete of Russian Far East Natural Materials. IOP Conf. Ser. Mater. Sci. Eng. 2016, 116, 012020. [Google Scholar] [CrossRef] [Green Version]
- Chernysheva, N.V.; Lesovik, V.S.; Drebezgova, M.Y.; Shatalova, S.V.; Alaskhanov, A.H. Composite Gypsum Binders with Silica-containing Additives. IOP Conf. Ser. Mater. Sci. Eng. 2018, 327, 032015. [Google Scholar] [CrossRef]
- Lum, T.Y.; Lightfoot, E. The Effects of Volunteering on the Physical and Mental Health of Older People. Res. Aging 2005, 27, 31–55. [Google Scholar] [CrossRef]
- De Hartog, J.J.; Boogaard, H.; Nijland, H.; Hoek, G. Do the Health Benefits of Cycling Outweigh the Risks? Environ. Health Perspect. 2010, 118, 1109–1116. [Google Scholar] [CrossRef]
- Chang, P.-J.; Wray, L.; Lin, Y. Social Relationships, Leisure Activity, and Health in Older Adults. Health Psychol. 2014, 33, 516–523. [Google Scholar] [CrossRef] [PubMed] [Green Version]
- Bouanan, Y.; El Alaoui, M.B.; Zacharewicz, G.; Vallespir, B. Using DEVS and CELL-DEVS for Modelling of Information Impact on Individuals in Social Network. In Transactions on Petri Nets and Other Models of Concurrency XV; Springer: Berlin/Heidelberg, Germany, 2014; pp. 409–416. [Google Scholar] [CrossRef] [Green Version]
- Bakshy, E.; Hofman, J.M.; Mason, W.A.; Watts, D.J. Everyone’s an Influencer. In Proceedings of the Fourth ACM International Conference on Web Search and Data Mining, Hong Kong, China, 9–12 February 2011; Association for Computing Machinery: New York, NY, USA; pp. 65–74. [Google Scholar] [CrossRef]
- Ding, W.; Pei, L.; Li, H.; Xi, N.; Wang, Y. The Effects of Time Delay of Internet on Characteristics of Human Behaviors. In Proceedings of the International Conference on Networking, Sensing and Control, Okayama, Japan, 26–29 March 2009; pp. 502–506. [Google Scholar] [CrossRef] [Green Version]

Publisher’s Note: MDPI stays neutral with regard to jurisdictional claims in published maps and institutional affiliations. |
© 2021 by the authors. Licensee MDPI, Basel, Switzerland. This article is an open access article distributed under the terms and conditions of the Creative Commons Attribution (CC BY) license (https://creativecommons.org/licenses/by/4.0/).