
Integrated GIS-Based Multi-Criteria Analysis for Groundwater Potential Mapping in the Euphrates’s Sub-Basin, Harran Basin, Turkey


Abstract
:1. Introduction
2. Materials and Methods
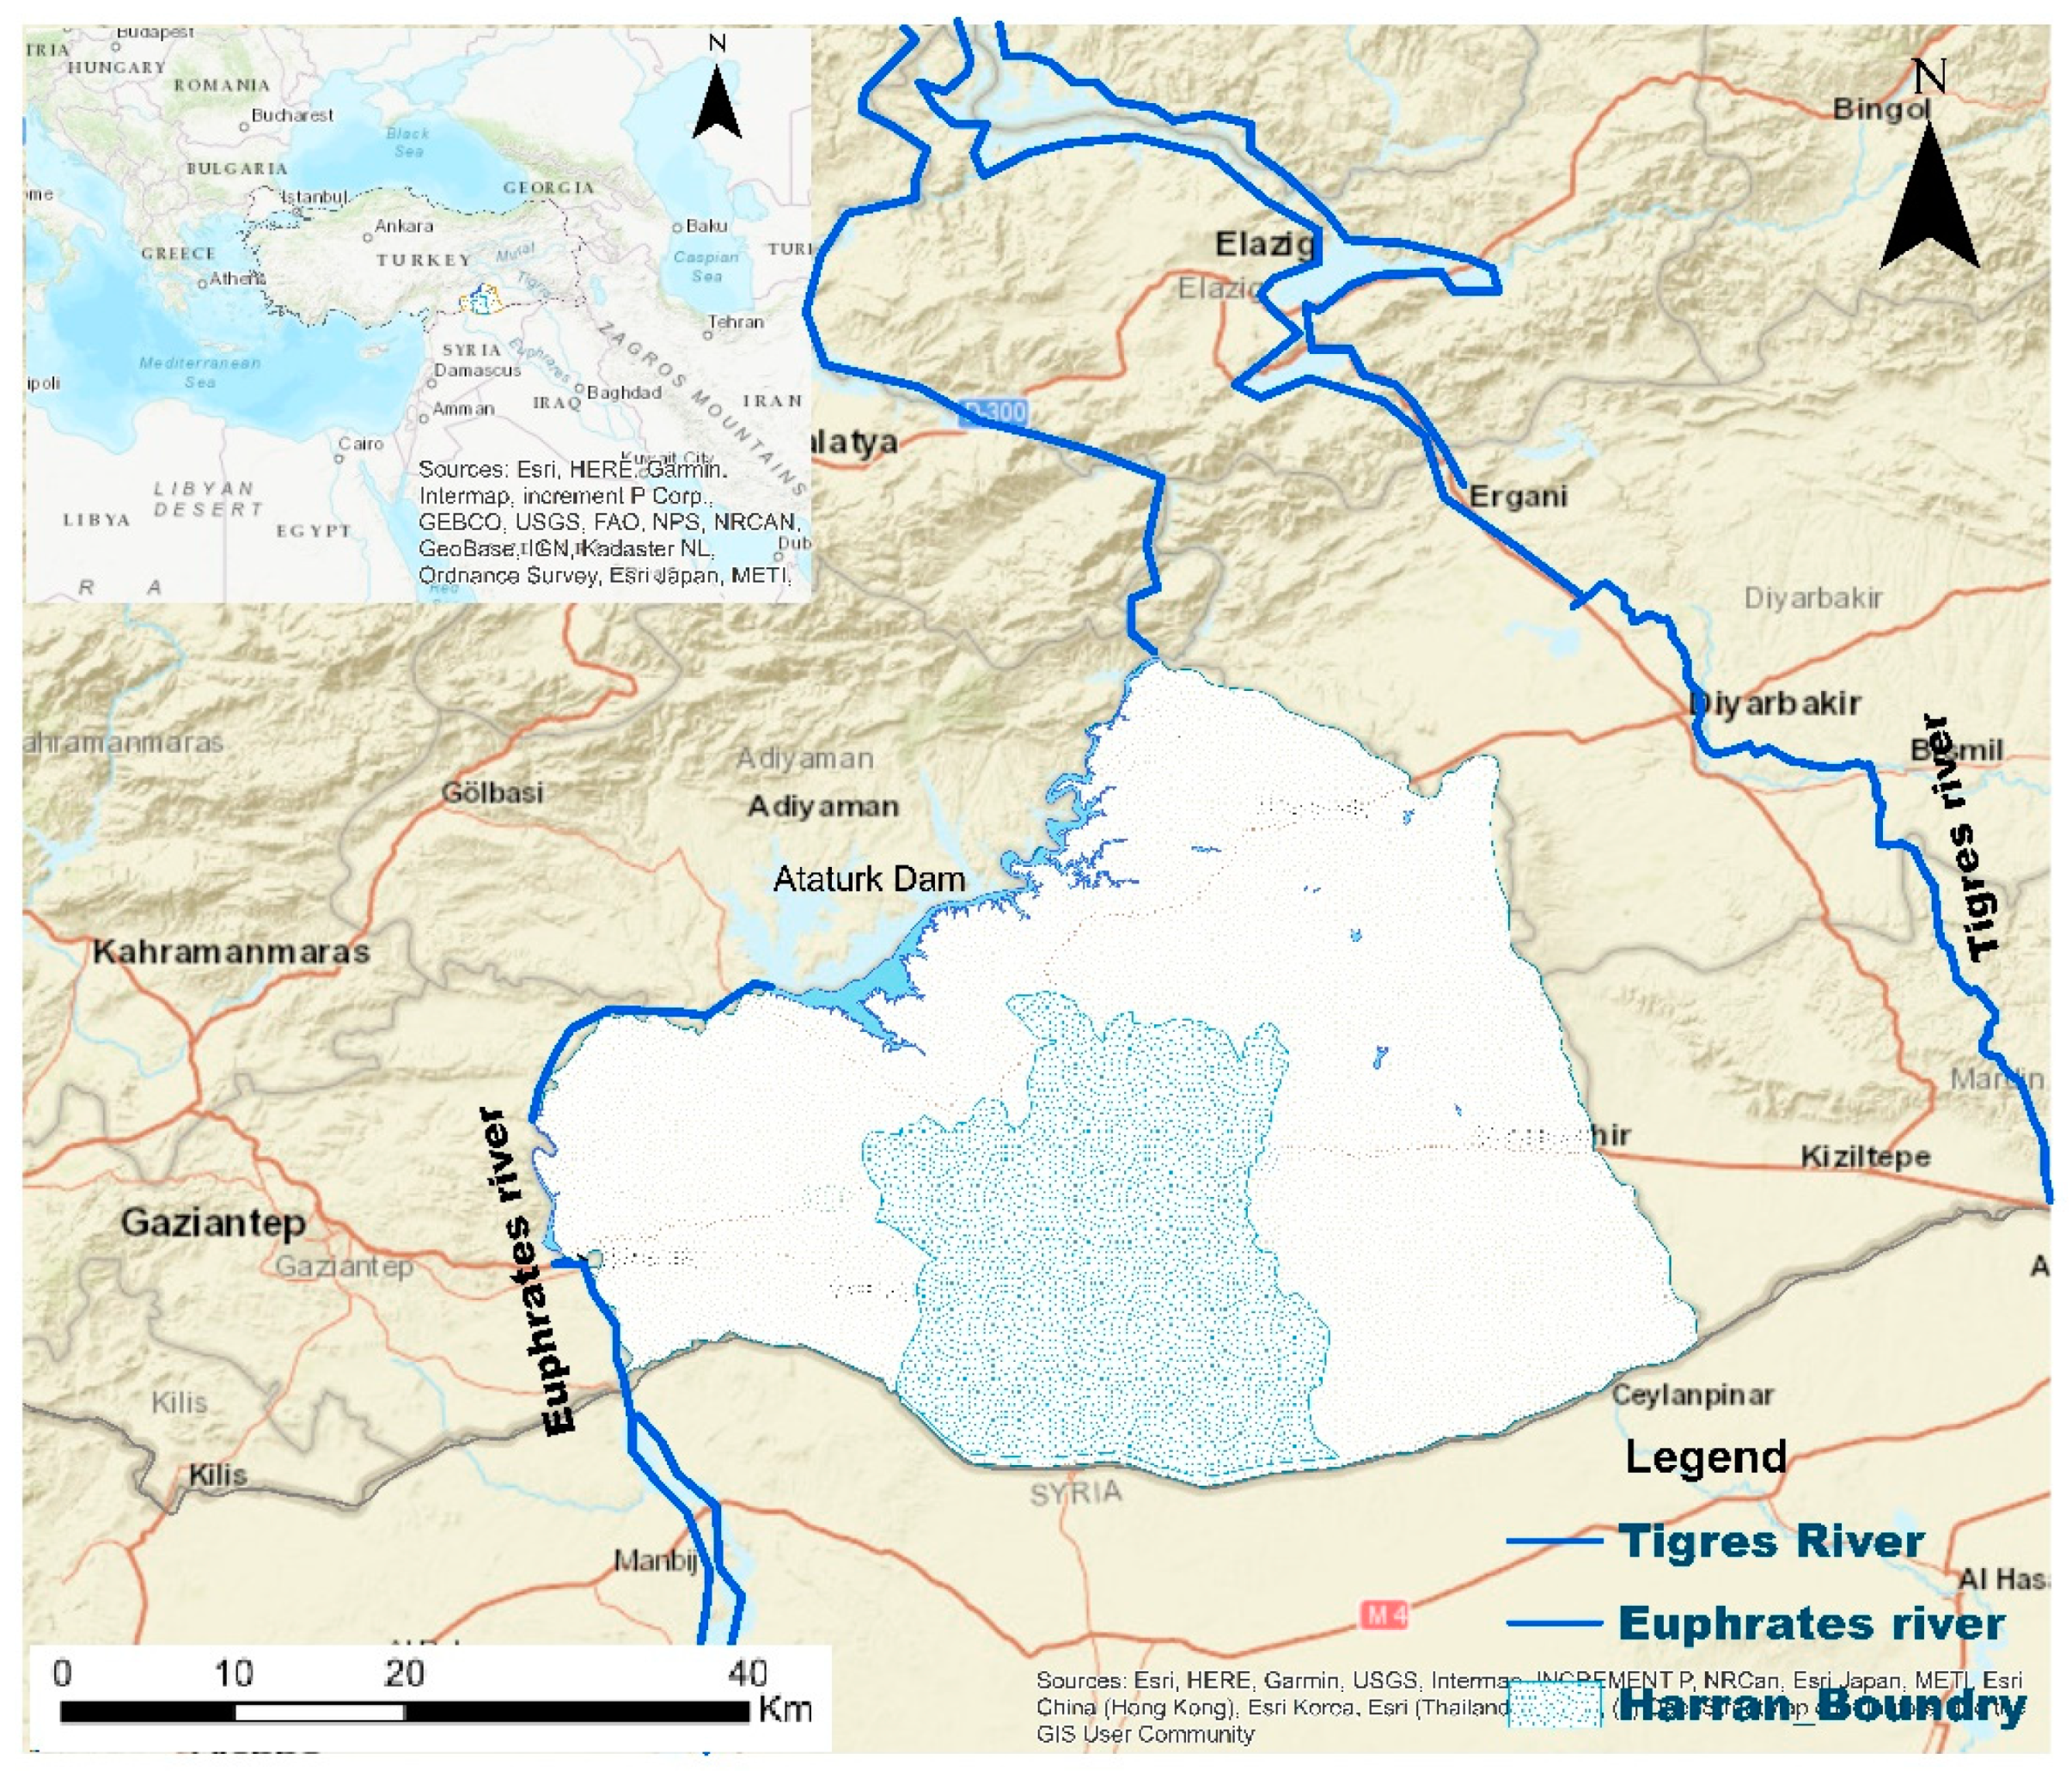
2.1. Study Area
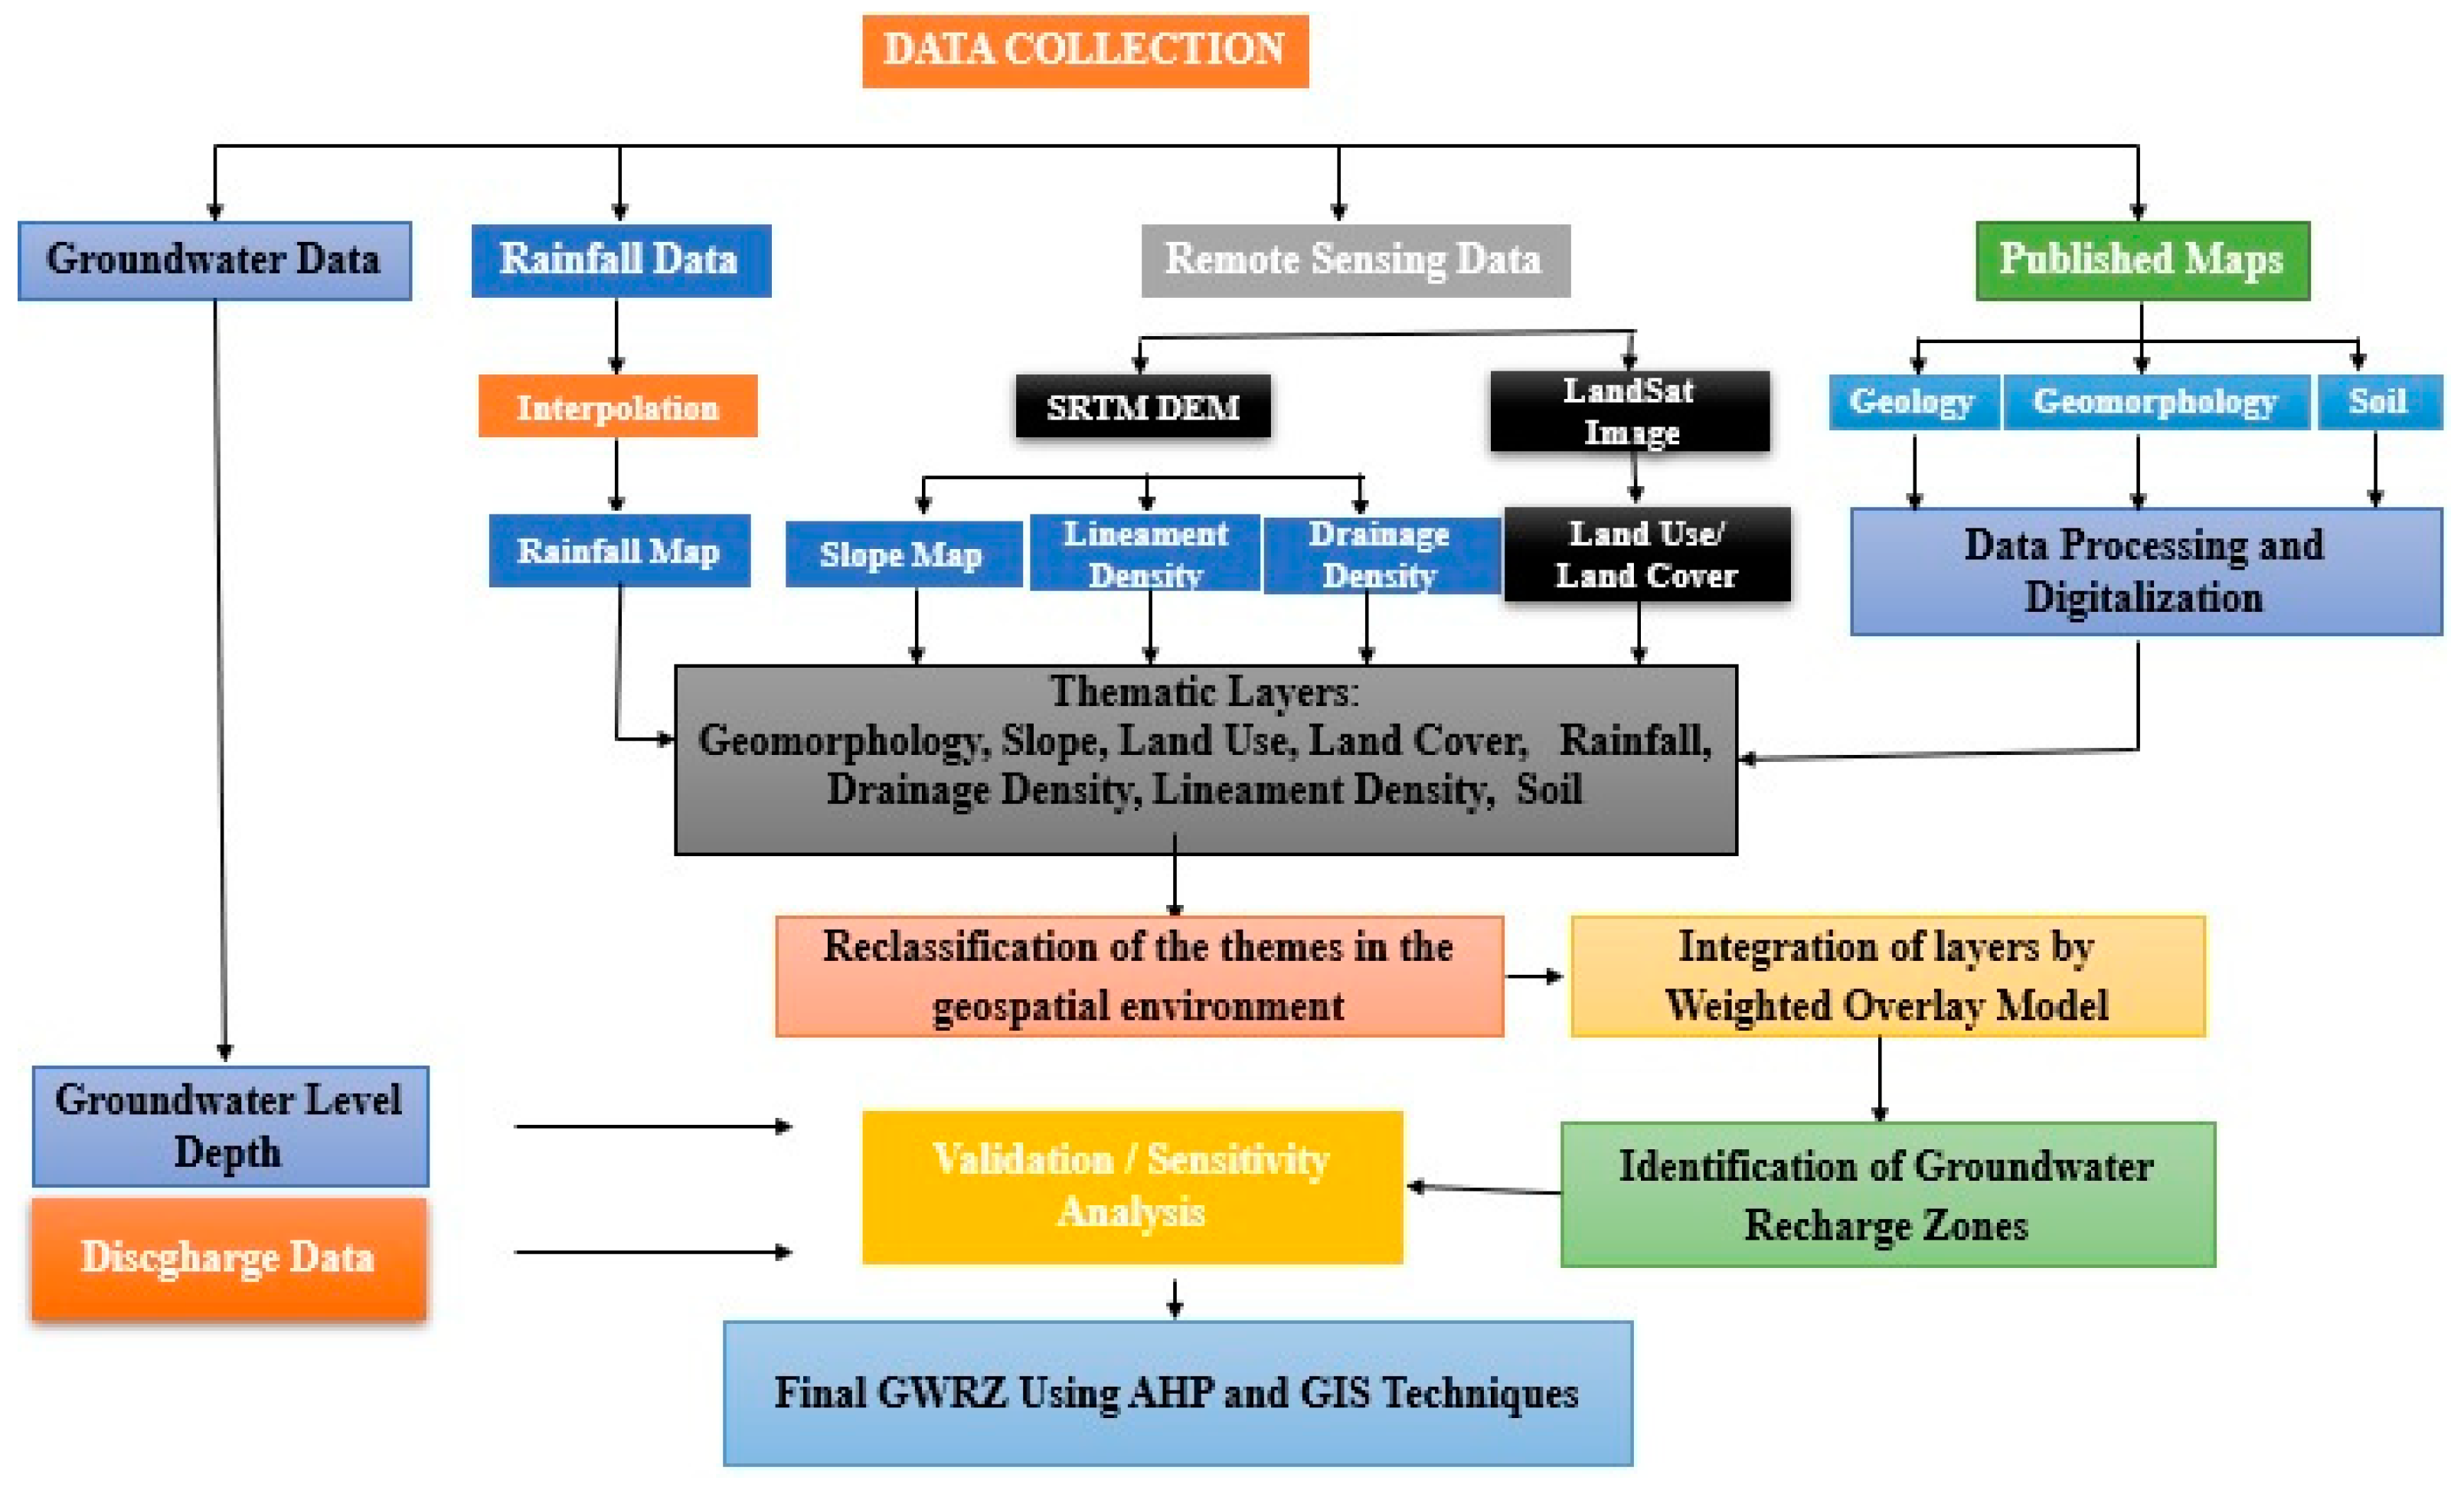
2.2. Method
GIS-Based AHP Method
2.3. Groundwater Potential Index (GWPI)
+ LDr.LDw + Tr.Tw
3. Results and Discussion
3.1. Land Use
3.2. Soil Type
3.3. Geomorphology
3.4. Geology
3.5. Aquifers
3.6. Drainage Density
3.7. Rainfall
3.8. Slope
3.9. Fault Density
3.10. Terrain Structure
3.11. The Distribution of the Groundwater Potential Regional Map
3.12. Validity
4. Conclusions
Author Contributions
Funding
Conflicts of Interest
References
- Kürkçüoğlu, A.C. İnançlar Diyarı Şanlıurfa; Şanlıurfa Valiliği Kültür Yayınları: Şanlıurfa, Turkey, 2000. [Google Scholar]
- Çelik, B. An early neolithic settlement in the center of Sanliurfa, Turkey. Neo-Lithic 2000, 2–3, 4–6. [Google Scholar]
- Benek, S. GAP Bölgesi’nde tarımsal faaliyetlerin tarihsel gelişimi ve günümüzdeki durumu. Marmara Coğrafya Derg. 2012, 195–215. [Google Scholar]
- Şahinalp, M.S. Şanlıurfa şehri’nin kuruluşuna etki eden etmenler. Coğrafi Bilimler Derg. 2006, 4, 105–127. [Google Scholar]
- Şahin, G.; Taşlıgil, N. Güneydoğu Anadolu Projesi (GAP)’nin dünü bugünü yarını. Akademik Bakış 2013, 36. [Google Scholar]
- Bilgen, A. 1977’den 2017’ye güneydoğu anadolu projesi (GAP): GAP’ın 40 yılı üzerine nitel ve çok boyutlu bir değerlendirme. Ankara Üniversitesi SBF Dergisi 2018, 73, 811–840. [Google Scholar]
- Yu, H.L.; Chu, H.-J. Recharge signal identification based on groundwater level observations. Environ. Monit. Assess. 2011, 184, 5971–5982. [Google Scholar] [CrossRef] [PubMed]
- Halder, S.; Roy, M.B.; Roy, P.K. Analysis of groundwater level trend and groundwater drought using Standard Groundwater Level Index: A case study of an eastern river basin of West Bengal, India. SN Appl. Sci. 2020, 2, 1–24. [Google Scholar] [CrossRef] [Green Version]
- Chu, H.-J. Drought detection of regional nonparametric standardized groundwater index. Water Resour. Manag. 2018, 32, 3119–3134. [Google Scholar] [CrossRef]
- Sophocleous, M. Review: Groundwater management practices, challenges, and innovations in the High Plains aquifer, USA—lessons and recommended actions. Hydrogeol. J. 2009, 18, 559–575. [Google Scholar] [CrossRef]
- Shah, T. Groundwater and human development: Challenges and opportunities in livelihoods and environment. Water Sci. Technol. 2005, 51, 27–37. [Google Scholar] [CrossRef]
- Chung, I.-M.; Kim, Y.J.; Kim, N.W. Estimating the temporal distribution of groundwater recharge by using the transient water table fluctuation method and watershed hydrologic model. Appl. Eng. Agric. 2021, 37, 95–104. [Google Scholar] [CrossRef]
- Danielopol, D.L.; Griebler, C.; Gunatilaka, A.; Notenboom, J. Present state and future prospects for groundwater ecosystems. Environ. Conserv. 2003, 30, 104–130. [Google Scholar] [CrossRef] [Green Version]
- Morris, B.L.; Lawrence, A.R.; Chilton, P.J.C.; Adams, B.; Calow, R.C.; Klinck, B.A. Groundwater and its Susceptibility to Degradation: A Global Assessment of the Problem and Options for Management; United Nations Environment Programme: Nairobi, Kenya, 2003. [Google Scholar]
- De Stefano, L.; Lopez-Gunn, E. Unauthorized groundwater use: Institutional, social and ethical considerations. Hydrol. Res. 2012, 14, 147–160. [Google Scholar] [CrossRef] [Green Version]
- Chowdhury, A.; Jha, M.K.; Chowdary, V.M. Delineation of groundwater recharge zones and identification of artificial recharge sites in West Medinipur district, West Bengal, using RS, GIS and MCDM techniques. Environ. Earth Sci. 2010, 59, 1209–1222. [Google Scholar] [CrossRef]
- Rahmati, O.; Samani, A.N.; Mahdavi, M.; Pourghasemi, H.R.; Zeinivand, H. Groundwater potential mapping at Kurdistan region of Iran using analytic hierarchy process and GIS. Arab. J. Geosci. 2015, 8, 7059–7071. [Google Scholar] [CrossRef]
- Çelik, R. Evaluation of Groundwater Potential by GIS-Based Multicriteria Decision Making as a Spatial Prediction Tool: Case Study in the Tigris River Batman-Hasankeyf Sub-Basin, Turkey. Water 2019, 11, 2630. [Google Scholar] [CrossRef] [Green Version]
- Srivastava, P.K.; Bhattacharya, A.K. Groundwater assessment through an integrated approach using remote sensing, GIS and resistivity techniques: A case study from a hard rock terrain. Int. J. Remote Sens. 2006, 27, 4599–4620. [Google Scholar] [CrossRef]
- Prasad, R.K.; Mondal, N.; Banerjee, P.; Nandakumar, M.V.; Singh, V.S. Deciphering potential groundwater zone in hard rock through the application of GIS. Environ. Earth Sci. 2008, 55, 467–475. [Google Scholar] [CrossRef]
- Çelik, R. Temporal changes in the groundwater level in the Upper Tigris Basin, Turkey, determined by a GIS technique. J. Afr. Earth Sci. 2015, 107, 134–143. [Google Scholar] [CrossRef]
- Adiat, K.; Nawawi, M.; Abdullah, K. Assessing the accuracy of GIS-based elementary multi criteria decision analysis as a spatial prediction tool—A case of predicting potential zones of sustainable groundwater resources. J. Hydrol. 2012, 440–441, 75–89. [Google Scholar] [CrossRef]
- Agarwal, E.; Agarwal, R.; Garg, R.; Garg, P.K. Delineation of groundwater potential zone: An AHP/ANP approach. J. Earth Syst. Sci. 2013, 122, 887–898. [Google Scholar] [CrossRef] [Green Version]
- Agarwal, R.; Garg, P. Remote Sensing and GIS Based Groundwater Potential & Recharge Zones Mapping Using Multi-Criteria Decision Making Technique. Water Resour. Manag. 2016, 30, 243–260. [Google Scholar]
- Madrucci, V.; Taioli, F.; de Araújo, C.C. Groundwater favorability map using GIS multicriteria data analysis on crystalline terrain, São Paulo State, Brazil. J. Hydrol. 2008, 357, 153–173. [Google Scholar] [CrossRef]
- Kumar, T.; Gautam, A.K.; Kumar, T. Appraising the accuracy of GIS-based multi-criteria decision making technique for delineation of groundwater potential zones. Water Resour. Manag. 2014, 28, 4449–4466. [Google Scholar] [CrossRef]
- Dhar, A.; Sahoo, S.; Dey, S.; Sahoo, M. Evaluation of Recharge and Groundwater Dynamics of a Shallow Alluvial Aquifer in Central Ganga Basin, Kanpur (India). Nat. Resour. Res. 2014, 23, 409–422. [Google Scholar] [CrossRef]
- Zaidi, F.K.; Nazzal, Y.; Ahmed, I.; Naeem, M.A.; Jafri, M.K. Identification of potential artificial groundwater recharge zones in Northwestern Saudi Arabia using GIS and Boolean logic. J. Afr. Earth Sci. 2015, 111, 156–169. [Google Scholar] [CrossRef]
- Pinto, D.; Shrestha, S.; Babel, M.S.; Ninsawat, S. Delineation of groundwater potential zones in the Comoro watershed, Timor Leste using GIS, remote sensing and analytic hierarchy process (AHP) technique. Appl. Water Sci. 2017, 7, 503–519. [Google Scholar] [CrossRef] [Green Version]
- DSİ (Devlet Su İşleri). Harran Ovası Hidrojeolojik Etüdü; DSI: Ankara, Turkey, 1972; p. 49. [Google Scholar]
- Celik, R.; Aslan, V. Evaluation of hydrological and hydrogeological characteristics affecting the groundwater potential of Harran Basin. Arab. J. Geosci. 2020, 13, 1–13. [Google Scholar] [CrossRef]
- Atasoy, A.D.; Yesilnacar, M.I. Effect of high sulfate concentration on the corrosivity: A case study from groundwater in Harran Basin, Turkey. Environ. Monit. Assess. 2010, 166, 595–607. [Google Scholar] [CrossRef]
- Çullu, M.A.; Aydemir, S.; Qadir, M.; Almaca, A.; Öztürkmen, A.R.; Bilgic, A.; Ağca, N. Implication of groundwater fluctuation on the seasonal salt dynamic in the Harran Basin, south-eastern Turkey. Irrig. Drain. 2010, 59, 465–476. [Google Scholar] [CrossRef]
- Ucar, D.; Cokgor, E.U.; Sahinkaya, E.; Cetin, U.; Bereketoglu, C.; Calimlioglu, B.; Goncu, B.; Yurtsever, A. Simultaneous nitrate and perchlorate removal from groundwater by heterotrophic-autotrophic sequential system. Int. Biodeterior. Biodegrad. 2017, 116, 83–90. [Google Scholar] [CrossRef]
- Yesilnacar, M.I.; Gulluoglu, M.S. Hydrochemical characteristics and the effects of irrigation on groundwater quality in Harran Basin, GAP Project, Turkey. Environ. Geol. 2008, 54, 183–196. [Google Scholar] [CrossRef]
- Tardu, T.; Başkurt, T.; Güven, A.; Us, E.; Dinçer, A.; Tuna, M.E.; Tezcan, U.S. Akçakale Grabeni’nin Yapısal-Stratigrafik Özellikleri ve Petrol Potansiyeli. Türkiye 1987, 7, 6–10. [Google Scholar]
- Jha, M.K.; Bongane, G.M.; Chowdary, V.M. Groundwater potential zoning by remote sensing, GIS and MCDM techniques: A case study of eastern India. In Hydroinformatics in Hydrology, Hydrogeology and Water resources, Proceedings of the Symposium JS. 4 at the Joint Convention of the International Association of Hydrological Sciences (IAHS) and the International Association of Hydrogeologists (IAH) held in Hyderabad, India, 6–12 September 2009; IAHS Press: Wallingford, UK, 2009; pp. 432–441. [Google Scholar]
- Mehrabi, H.; Zeinivand, H.; Hadidi, M. Site selection for groundwater artificial recharge in Silakhor Rangelands Using GIS Technique. J. Rangel. Sci. 2013, 2, 687–695. [Google Scholar]
- Nithya, C.N.; Srinivas, Y.; Magesh, N.; Kaliraj, S. Assessment of groundwater potential zones in Chittar basin, Southern India using GIS based AHP technique. Remote Sens. Appl. Soc. Environ. 2019, 15, 100248. [Google Scholar] [CrossRef]
- Patra, S.; Mishra, P.; Mahapatra, S.C. Delineation of groundwater potential zone for sustainable development: A case study from Ganga Alluvial Plain covering Hooghly district of India using remote sensing, geographic information system and analytic hierarchy process. J. Clean. Prod. 2018, 172, 2485–2502. [Google Scholar] [CrossRef]
- Saidi, S.; Hosni, S.; Mannai, H.; Jelassi, F.; Bouri, S.; Anselme, B. GIS-based multi-criteria analysis and vulnerability method for the potential groundwater recharge delineation, case study of Manouba phreatic aquifer, NE Tunisia. Environ. Earth Sci. 2017, 76, 511. [Google Scholar] [CrossRef]
- Dhar, A.; Sahoo, S.; Mandal, U.; Dey, S.; Bishi, N.; Kar, A. Hydro-environmental assessment of a regional groundwater aquifer: Hirakud command area (India). Environ. Earth Sci. 2015, 73, 4165–4178. [Google Scholar] [CrossRef]
- Brahim-Bathis, K.; Ahmed, S. Geospatial technology for delineating groundwater potential zones in Doddahalla watershed of Chitradurga district, India. Egypt. J. Remote Sens. Space Sci. 2016, 19, 223–234. [Google Scholar]
- Sikdar, P.K.; Chakraborty, S.; Adhya, E.; Paul, P.K. Land use/Land cover changes and groundwater potential zoning in and around Raniganj coal mining area, Bardhaman District, West Bengal-A GIS and Remote Sensing Approach. J. Spatial Hydrol. 2004, 4, 1–24. [Google Scholar]
- Yin, H.; Shi, Y.; Niu, H.; Xie, D.; Wei, J.; Lefticariu, L.; Xu, S. A GIS-based model of potential groundwater yield zonation for a sandstone aquifer in the Juye Coalfield, Shangdong, China. J. Hydrol. 2018, 557, 434–447. [Google Scholar] [CrossRef]
- Senanayake, I.; Dissanayake, D.; Mayadunna, B.; Weerasekera, W. An approach to delineate groundwater recharge potential sites in Ambalantota, Sri Lanka using GIS techniques. Geosci. Front. 2016, 7, 115–124. [Google Scholar] [CrossRef] [Green Version]
- Russell, R.S.; Taylor, B.W. Operations Management; Prentice Hall: Upper Saddle River, NJ, USA, 2003; Volume 3. [Google Scholar]
- Saaty, T.L. The Analytic Hierarchy Process; McGraw-Hill: New York, NY, USA, 1980. [Google Scholar]
- Saaty, T.L. Hierarchical-multi objective systems. Control Theory Adv. Technol. 1989, 5, 485–489. [Google Scholar]
- Saaty, T.L. Decision-making with the AHP: Why is the principal eigenvector necessary. Eur. J. Oper. Res. 2003, 145, 85–91. [Google Scholar] [CrossRef]
- Alonso, J.A.; Lamata, M.T. Consistency in the analytic hierarchy process: A new approach. Int. J. Uncertainty Fuzziness Knowl. Based Syst. 2006, 14, 445–459. [Google Scholar] [CrossRef] [Green Version]
- Shekhar, S.; Pandey, A.C. Delineation of groundwater potential zone in hard rock terrain of India using remote sensing, geographical information system (GIS) and analytic hierarchy process (AHP) techniques. Geocarto Int. 2014, 30, 402–421. [Google Scholar] [CrossRef]
- Scanlon, B.R.; Reedy, R.C.; Stonestrom, D.; Prudic, D.E.; Dennehy, K.F. Impact of land use and land cover change on groundwater recharge and quality in the southwestern US. Glob. Chang. Biol. 2005, 11, 1577–1593. [Google Scholar] [CrossRef]
- Kurtzman, D.; Scanlon, B.R. Groundwater Recharge through Vertisols: Irrigated Cropland vs. Natural Land, Israel. Vadose Zone J. 2011, 10, 662–674. [Google Scholar] [CrossRef]
- Schrick, B.; Hydutsky, B.W.; Blough, J.L.; Mallouk, T.E. Delivery vehicles for zerovalent metal nanoparticles in soil and groundwater. Chem. Mater. 2004, 16, 2187–2193. [Google Scholar] [CrossRef]
- Birkeland, P.W. Soils and Geomorphology; Oxford University Press: Oxford, UK, 1984. [Google Scholar]
- Bouwer, H.; Bouwer, H. Groundwater Hydrology; McGraw-Hill: New York, NY, USA, 1978; Volume 480. [Google Scholar]
- Gupta, M.; Srivastava, P.K. Integrating GIS and remote sensing for identification of groundwater potential zones in the hilly terrain of Pavagarh, Gujarat, India. Water Int. 2010, 35, 233–245. [Google Scholar] [CrossRef]
- Batelaan, O.; De Smedt, F. WetSpass: A Flexible, GIS Based, Distributed Recharge Methodology for Regional Groundwater Modelling; IAHS Press: Wallingford, UK, 2001; pp. 11–18. [Google Scholar]
- Avtar, R.; Singh, C.K.; Shashtri, S.; Singh, A.; Mukherjee, S. Identification and analysis of groundwater potential zones in Ken–Betwa river linking area using remote sensing and geographic information system. Geocarto. Int. 2010, 25, 379–396. [Google Scholar] [CrossRef]
- Sajikumar, N.; Remya, R. Impact of land cover and land use change on runoff characteristics. J. Environ. Manag. 2015, 161, 460–468. [Google Scholar] [CrossRef] [PubMed]
- Ghimire, C.P.; Bruijnzeel, L.A.; Lubczynski, M.W.; Bonell, M. Negative trade-off between changes in vegetation water use and infiltration recovery after reforesting degraded pasture land in the Nepalese Lesser Himalaya. Hydrol. Earth Syst. Sci. 2014, 18, 4933–4949. [Google Scholar] [CrossRef] [Green Version]
- Metzger, J.C.; Landschreiber, L.; Gröngröft, A.; Eschenbach, A. Soil evaporation under different types of land use in southern African savanna ecosystems. J. Plant Nutr. Soil Sci. 2014, 177, 468–475. [Google Scholar] [CrossRef]
- Ghosh, D.; Mandal, M.; Banerjee, M.; Karmakar, M. Impact of hydro-geological environment on availability of groundwater using analytical hierarchy process (AHP) and geospatial techniques: A study from the upper Kangsabati river basin. Groundw. Sustain. Dev. 2020, 11, 100419. [Google Scholar] [CrossRef]
- Zhu, Q.; Abdelkareem, M. Mapping Groundwater Potential Zones Using a Knowledge-Driven Approach and GIS Analysis. Water 2021, 13, 579. [Google Scholar] [CrossRef]
- Mukherjee, I.; Singh, U.K. Delineation of groundwater potential zones in a drought-prone semi-arid region of east India using GIS and analytical hierarchical process techniques. Catena 2020, 194, 104681. [Google Scholar] [CrossRef]


| Parameter | Data Source | Mode of Processing |
|---|---|---|
| Slope (S) | Topographic maps (N43, N44 layouts): 1/100,000), DEM | Digitalization/3D analyst ArcGIS |
| Lineament Density | Geological map,mta.gov.tr online maps | Online digitalization in .kml format, converted to .shp file via the Data Interoperability ext. |
| Geology | Geological maps; map,mta.gov.tr online maps | Online digitalization in .kml format, converted to .shp file via the Data Interoperability ext. |
| Geomorphology | DEM maps, topographic maps | Digitalization/3D analyst ArcGIS/classification |
| Land Use (LU) | Landsat&imagery | Classification in ENVI |
| Soil Type | (https://www.tarim.gov.tr (accessed on 1 December 2020)) | Digitalization/classification in ArcGIS |
| Rainfall (R) | Turkish State Meteorological Service (https://mgm.gov.tr (accessed on 12 October 2020)) | Interpolation/classification |
| Drainage Density | DEM maps, topographic maps | Stream generation with Arc Hydro Tools/density line calculation/validation |
| LU | S | GM | G | A | DD | R | SL | LD | TC | |
|---|---|---|---|---|---|---|---|---|---|---|
| Land Use | 1.00 | 0.86 | 0.75 | 0.75 | 0.75 | 1.00 | 0.67 | 0.75 | 1.50 | 1.00 |
| Soil | 1.17 | 1.00 | 0.88 | 0.88 | 0.88 | 1.17 | 0.78 | 0.88 | 1.75 | 1.17 |
| Geomorphology | 1.33 | 1.14 | 1.00 | 1.00 | 1.00 | 1.33 | 0.89 | 1.00 | 2.00 | 1.33 |
| Geology | 1.33 | 1.14 | 1.00 | 1.00 | 1.00 | 1.33 | 0.89 | 1.00 | 2.00 | 1.33 |
| Aquifer | 1.33 | 1.14 | 1.00 | 1.00 | 1.00 | 1.33 | 0.89 | 1.00 | 2.00 | 1.33 |
| Drainage Density | 1.00 | 0.86 | 0.75 | 0.75 | 0.75 | 1.00 | 0.67 | 0.75 | 1.50 | 1.00 |
| Rainfall | 1.50 | 1.29 | 1.13 | 1.13 | 1.13 | 1.50 | 1.00 | 1.13 | 2.25 | 1.50 |
| Slope | 1.33 | 1.14 | 1.00 | 1.00 | 1.00 | 1.33 | 0.89 | 1.00 | 2.00 | 1.33 |
| Lineament Density | 0.67 | 0.57 | 0.50 | 0.50 | 0.50 | 0.67 | 0.44 | 0.50 | 1.00 | 0.67 |
| Terrain class | 1.00 | 0.86 | 0.75 | 0.75 | 0.75 | 1.00 | 0.67 | 0.75 | 1.50 | 1.00 |
| Land Use | Soil | GM | Geology | Aquifer | DD | Rainfall | Slope | LD | Terrain Class | W | |
|---|---|---|---|---|---|---|---|---|---|---|---|
| Land Use | 0.09 | 0.09 | 0.09 | 0.09 | 0.09 | 0.09 | 0.09 | 0.09 | 0.09 | 0.09 | 0.09 |
| Soil | 0.10 | 0.10 | 0.10 | 0.10 | 0.10 | 0.10 | 0.10 | 0.10 | 0.10 | 0.10 | 0.10 |
| Geomorphology | 0.11 | 0.11 | 0.11 | 0.11 | 0.11 | 0.11 | 0.11 | 0.11 | 0.11 | 0.11 | 0.11 |
| Geology | 0.11 | 0.11 | 0.11 | 0.11 | 0.11 | 0.11 | 0.11 | 0.11 | 0.11 | 0.11 | 0.11 |
| Aquifer | 0.11 | 0.11 | 0.11 | 0.11 | 0.11 | 0.11 | 0.11 | 0.11 | 0.11 | 0.11 | 0.11 |
| Drainage Density | 0.09 | 0.09 | 0.09 | 0.09 | 0.09 | 0.09 | 0.09 | 0.09 | 0.09 | 0.09 | 0.09 |
| Rainfall | 0.13 | 0.13 | 0.13 | 0.13 | 0.13 | 0.13 | 0.13 | 0.13 | 0.13 | 0.13 | 0.13 |
| Slope | 0.11 | 0.11 | 0.11 | 0.11 | 0.11 | 0.11 | 0.11 | 0.11 | 0.11 | 0.11 | 0.11 |
| Lineament Density | 0.06 | 0.06 | 0.06 | 0.06 | 0.06 | 0.06 | 0.06 | 0.06 | 0.06 | 0.06 | 0.06 |
| Terrain Class | 0.09 | 0.09 | 0.09 | 0.09 | 0.09 | 0.09 | 0.09 | 0.09 | 0.09 | 0.09 | 0.09 |
| Sequence No. | Parameters | Rank | Sub-Parameters | Land Coverage Area (km2) | Groundwater Views | Degree |
|---|---|---|---|---|---|---|
| 1 | Land Use | 6 | Continuous Irrigated Area Woodland grassland Sand Area Wet area Agriculture, Planting Area Residential Agriculture, Fallow Land | 1414 | Very Good | 9 |
| 3 | Very Good | 8 | ||||
| 1530 | Very Good | 7 | ||||
| 1530 | Good | 7 | ||||
| 86 | Moderate | 6 | ||||
| 86 | Moderate | 6 | ||||
| 82 | Moderate | 5 | ||||
| 414 | Poor (Weak) | 4 | ||||
| 2 | Soil | 7 | Reddish brown territory | 4497 | Very Good | 8 |
| Brown territory | 516 | Very Good | 7 | |||
| Other areas | 41 | Good | 6 | |||
| Basalt lands | 174 | Moderate | 5 | |||
| 3 | Geology | 8 | Unspoiled Terrestrial Crumbs | 1986 | Very Good | 8 |
| Basalt | 3049 | Good | 7 | |||
| Terrestrial Crumbs | 55 | Good | 6 | |||
| Crumbs and Carbonates | 27 | Moderate | 5 | |||
| Unassisted Quaternary | 27 | Moderate | 5 | |||
| 4 | Geomorphology | 8 | Flat | 1768 | Very Good | 9 |
| Plain | 1323 | Good | 7 | |||
| Plateau | 955 | Moderate | 5 | |||
| Hill | 1097 | Poor | 3 | |||
| 5 | Aquifer Elevation (m) | 8 | 810–890 | 150 | Very Good | 9 |
| 740–810 | 2229 | Good | 8 | |||
| 671–740 | 742 | Good | 7 | |||
| 601–671 | 535 | Moderate | 6 | |||
| 531–601 | 465 | Moderate | 5 | |||
| 461–531 | 740 | Poor | 4 | |||
| 391–461 | 215 | Poor | 3 | |||
| 321–391 | 68 | Very Poor | 2 | |||
| 6 | Drainage Density (km/km2) | 5 | 0–1 | 42 | Good | 7 |
| 2–4 | 45 | Moderate | 5 | |||
| 5–7 | 48 | Poor | 3 | |||
| 8–12 | 5009 | Very Poor | 1 | |||
| 7 | Rainfall (mm/year) | 9 | 318–331 | 1754 | Poor | 3 |
| 331–350 | 1964 | Moderate | 4 | |||
| 350–381 | 4521 | Moderate | 5 | |||
| 8 | Slope (%) | 8 | 0.00–1.50 | 1791 | Very Good | 9 |
| 1.50–3.00 | 2322 | Very Good | 8 | |||
| 3.00–4.50 | 945 | Good | 7 | |||
| 4.50–6.00 | 66 | Moderate | 5 | |||
| 6.00–9.41 | 20 | Poor | 3 | |||
| 9 | Fault Density (km/km2) | 4 | 0.00–15.29 | 42 | Good | 7 |
| 15.29–30 | 45 | Moderate | 5 | |||
| 30–50 | 48 | Poor | 3 | |||
| 50–70 | 5009 | Very Poor | 1 | |||
| 10 | Terrain Class | 6 | I | 1662 | Moderate | 5 |
| II | 323 | Moderate | 4 | |||
| III | 581 | Poor | 3 | |||
| IV | 317 | Very poor | 2 | |||
| VI | 400 | Very good | 8 | |||
| VII | 1861 | Very | 9 |
| GWPI Values | Definition | Rating (%) | Area (km2) |
|---|---|---|---|
| 307–340 | Very Poor | 0.10 | 5.14 |
| 340–445 | Poor | 29.20 | 1501.17 |
| 445–530 | Moderate | 38.20 | 1963.86 |
| 530–580 | Good | 30.90 | 1588.57 |
| 580–617 | Very Good | 1.50 | 77.12 |
| Reference Number | X | Y | Z | Depth | SWL | DWL | Yield | GWPI | Evaluation | Compliance |
|---|---|---|---|---|---|---|---|---|---|---|
| 0 | 517,053 | 4,126,396 | 693 | 290 | 175 | 235 | 1,5 | 396 | Poor | Compatible |
| 1 | 502,400 | 4,135,099 | 760 | - | 110 | 165 | 1,5 | 435 | Poor | Compatible |
| 2 | 486,164 | 4,073,547 | 393 | 110 | 70 | 80 | 10 | 568 | Good | Compatible |
| 3 | 524,961 | 4,129,044 | 725 | - | 85 | 132 | 1 | 428 | Poor | Compatible |
| 4 | 525,951 | 4,074,609 | 480 | 205 | 160 | 180 | 10 | 574 | Good | Compatible |
| 5 | 471,773 | 4,094,228 | 609 | 254 | 120 | 175 | 2 | 435 | Poor | Compatible |
| 6 | 468,680 | 4,118,684 | 713 | 180 | 90 | 150 | 1,5 | 380 | Poor | Compatible |
| 7 | 489,424 | 4,090,377 | 388 | 200 | 60 | 100 | 6 | 576 | Good | Compatible |
| 8 | 504,327 | 4,093,563 | 384 | 170 | 3 | 64 | 10 | 561 | Good | Compatible |
| 9 | 497,742 | 4,101,438 | 422 | 220 | 40 | 110 | 10 | 577 | Good | Compatible |
| 10 | 493,394 | 4,142,126 | 798 | 250 | 60 | 180 | 1 | 419 | Poor | Compatible |
| 11 | 518,388 | 4,107,470 | 466 | 220 | 50 | 150 | 5 | 556 | Good | Compatible |
| 12 | 476,215 | 4,111,228 | 695 | 250 | 130 | 200 | 10 | 431 | Poor | Partially Compatible |
| 13 | 524,371 | 4,092,163 | 611 | 330 | 280 | 300 | 5 | 462 | Moderate | Compatible |
| 14 | 517,047 | 4,063,762 | 422 | 160 | 130 | 160 | 4 | 509 | Moderate | Compatible |
| 15 | 502,164 | 4,079,184 | 382 | 180 | 140 | 170 | 10 | 561 | Good | Compatible |
| 16 | 494,024 | 4,122,396 | 661 | 180 | 50 | 100 | 9 | 454 | Moderate | Partially Compatible |
| 17 | 503,607 | 4,118,421 | 524 | 150 | 25 | 120 | 3 | 435 | Poor | Compatible |
Publisher’s Note: MDPI stays neutral with regard to jurisdictional claims in published maps and institutional affiliations. |
© 2021 by the authors. Licensee MDPI, Basel, Switzerland. This article is an open access article distributed under the terms and conditions of the Creative Commons Attribution (CC BY) license (https://creativecommons.org/licenses/by/4.0/).
Share and Cite
Aslan, V.; Çelik, R. Integrated GIS-Based Multi-Criteria Analysis for Groundwater Potential Mapping in the Euphrates’s Sub-Basin, Harran Basin, Turkey. Sustainability 2021, 13, 7375. https://doi.org/10.3390/su13137375
Aslan V, Çelik R. Integrated GIS-Based Multi-Criteria Analysis for Groundwater Potential Mapping in the Euphrates’s Sub-Basin, Harran Basin, Turkey. Sustainability. 2021; 13(13):7375. https://doi.org/10.3390/su13137375
Chicago/Turabian StyleAslan, Veysel, and Recep Çelik. 2021. "Integrated GIS-Based Multi-Criteria Analysis for Groundwater Potential Mapping in the Euphrates’s Sub-Basin, Harran Basin, Turkey" Sustainability 13, no. 13: 7375. https://doi.org/10.3390/su13137375
APA StyleAslan, V., & Çelik, R. (2021). Integrated GIS-Based Multi-Criteria Analysis for Groundwater Potential Mapping in the Euphrates’s Sub-Basin, Harran Basin, Turkey. Sustainability, 13(13), 7375. https://doi.org/10.3390/su13137375