Article

Interactive Effects of Nitrogen and Sulfur Nutrition on Growth, Development, and Physiology of Brassica carinata A. Braun and Brassica napus L.

North Florida Research and Education Center, University of Florida, Quincy, FL 32351, USA
*
Authors to whom correspondence should be addressed.
Sustainability 2021, 13(13), 7355; https://doi.org/10.3390/su13137355
Submission received: 6 May 2021 / Revised: 7 June 2021 / Accepted: 19 June 2021 / Published: 30 June 2021
(This article belongs to the Special Issue Smart Farming and Bioenergy Feedstock Crops)

Abstract

:
Brassica carinata (carinata) has emerged as a potential biofuel source due to its high erucic acid content, making it desirable for various industrial applications. Nitrogen (N) and sulfur (S) are required as primary sources of nutrition for growth and development in different oilseed crops and their utilization is interdependent. The purpose of the study was to analyze the interactive effect of N and S nutrition on the growth and other physiological activities of carinata and B. napus (napus). Four treatments, i.e., optimum NS (+N+S, 100% N and 100% S); N limited (−N+S, 0% N, 100% S); S limited (+N−S, 100% N, 0% S), and NS limited (−N−S, 0% N and 0% S) of N and S in full-strength Hoagland solution were imposed in the current study. Effect of different NS treatments was observed on vegetative traits such as number of primary and secondary branches, total leaf area, total biomass production and allocation, and physiological traits such as production of photosynthetic pigments, net photosynthesis, electron transport, and other aspects for both carinata and napus. The traits of stem elongation, number of nodes, node addition rate, internode length, number of primary and secondary branches were 60%, 36%, 50%, 35%, 56%, and 83% lower, respectively, in napus in comparison to carinata. Different NS treatments also positively influenced the production of photosynthetic pigments such as chlorophyll (Chl) a and b and carotenoids in carinata and napus. The concentration of Chla was 11% higher in napus in comparison to carinata. The rate of net photosynthesis, electron transport, and fluorescence was 12%, 8%, and 5% higher based on overall value, respectively, in napus compared to carinata. On the other hand, the overall value for stomatal conductance decreased by 5% in napus when compared to carinata. Different growth-related traits such as vegetative (plant height, node number, internode length, leaf area, number of primary and secondary branches), reproductive (pod number, pod length, seeds per pod), and photosynthetic capacity in oilseed brassicas are correlated with the final seed and oil yield and chemical composition which are of economic importance for the adoption of the crop. Thus, the analysis of these traits will help to determine the effect of NS interaction on crop productivity of carinata and napus.

1. Introduction

Brassica carinata A. Braun (carinata) has emerged as a non-food, low carbon source of renewable fuel and bioproducts with multiple industrial applications. Carinata is a dedicated second-generation feedstock that is grown on winter fallow land in the Southeast United States (SE US) and other parts of the world. Adopting alternate crops that are primarily grown on underutilized land ensures low to no indirect land-use change or non-displacement of food crops. Carinata is a multi-purpose oilseed crop used for biofuel production and industrial purposes and is poised to help address the need for a sustainable renewable energy source. Efforts are being made to adopt carinata as a winter commodity cover crop in North America, especially in SE US [1,2,3,4] due to its rapid growth, great biomass production, nutrient scavenging ability (characteristic feature of Brassicaceae members), higher adaptability, and availability of large acreage of winter fallow land in the SE US (19.02 million hectares; [5]). For a newly introduced crop it is important to assess the nutrient requirements for its appropriate production in different environmental conditions.
Nitrogen along with sulfur is required as primary sources of nutrition for the growth and development in oilseed crops, and their utilization is interdependent [6,7]. NS interaction has been shown to affect different growth stages and influence yield potential in oilseed crops [8,9]. Cultivation of oilseed crops, especially brassicas, requires a higher amount of N and S for enhanced seed yield, better oil content, and oil quality [10,11,12,13]. Nitrogen is an essential component of amino acids and nucleic acids, forming the fundamental blocks of plant development. Nitrogen is also required for cell differentiation and elongation. Its deficiency results in restricted vegetative growth by impacting the development of leaf area, branching, and dry matter accumulation [14,15,16,17] along with affecting the reproductive performance and seed yield in brassicas [11,18,19]. Nitrogen concentration has shown a strong positive correlation with the photosynthetic ability of plants, where 75% of the total leaf N has been used for maintenance of the photosynthetic apparatus in C3 plants [14,20]. Sulfur is another important essential nutrient for oilseed crops, which require a higher amount of S (12 kg ranging from 5 to 20 kg) in comparison to cereals (3–4 kg ranging from 1 to 6 kg), and legumes (8 kg ranging from 5 to 13 kg; [21,22,23,24]) for their growth. Sulfur plays various important roles in oilseed crops, including the formation of amino acids methionine and cysteine with 21% and 27% S content, respectively. It is also involved in proteins and chlorophyll formation, regulates the oil content and fatty acid quality of the seeds, improves the nutritive value of forage, and is involved in the production of secondary metabolites such as glucosinolates, which are involved in protecting the plant against various stresses and pests [23,25]. Sulfur also plays an essential role in the formation of Fe/S cluster in enzymes and cofactors for vitamins [26]. Seed quality [27,28] and yield (around 40%) in napus are reported to be sensitive to S limitation. Oil and protein concentration of napus seeds increases with S fertilization [29,30].
Along with their individual roles, N and S are known to have an interactive effect on plant growth and development. The ratio of available N and S in soil impacts their utilization efficiency in plants [31,32]. In a report by Fazili et al., [7], the absence or limited presence of S for rapeseed and mustard leads to the inefficient utilization of nitrogenous fertilizer leading to nitrate leaching [6]. In addition, S is required for the maximum utilization efficiency of N. Similarly, in B. napus L. (rapeseed) and B. juncea L. Czern (mustard), only 27–31% of S is used in the absence of N while its utility is enhanced up to 37–38% with 60 kg N/ha under field conditions [33]. Thus, the deficiency of S has an impact on nitrogen use efficiency, and N deficiency impacts sulfur use efficiency, especially in oilseed crops [32]. Sulfur is known to maintain a sufficient seed oil concentration and fatty acid quality in napus [32,34,35]. On the other hand, a large pool of N in the soil also leads to S deficiency [36]. Significant positive interaction between N and S has been observed in various oilseed crops [21,32,37,38,39], Zea mays L. (maize) [38,40], and Triticum aestivum L. (wheat) [38,41,42]. N:S ratio of 15:6, 13:1, 14:8, and 7:1 in grain in maize, mustard, Arachis hypogaea L. (groundnut), and wheat, respectively, are recommended for maximum response to S [38]. It has been shown that the presence of S regulates nitrate reductase while N availability has a regulating role in ATP-sulfurylase enzyme activity [24,29].
Nitrogen and S are essential nutrients for plant growth and development and their interaction has been shown to directly influence various physiological and biochemical responses in various crops, which affects growth, development, photosynthesis, and reproduction. NS interaction and its effects have been studied to some extent in napus but none so far in the case of carinata. Therefore, the present study was conducted to investigate NS treatment effects in carinata and napus. These results will augment our understanding of nitrogen and sulfur nutrition in various physiological and biochemical processes in brassica oilseeds. The idea is to determine the relationship between N and S inputs for higher productivity in oilseed crops. As per our knowledge, this is the first report of its kind in carinata and will inform the community about the management guidelines for sustainable carinata production in the SE US and other parts of the world and will be helpful in its adoption.

2. Materials and Methods

2.1. Plant Culture

A greenhouse study was conducted at the University of Florida, Institute of Food and Agricultural Sciences, North Florida Research and Education Center, Quincy, FL (30°32′35.1″ N, 84°35′43.8″ W) from December 2015 to May 2016. Seeds of carinata cultivar AAC A110 and napus cultivar Canterra 1918 were planted (5 seeds pot−1) on 12 December 2015 in plastic pots (31.8 cm height, 19.7 cm diam., 7.65 L) filled with fine sand as the growth substrate and saturated, until free drainage, with full strength Hoagland solution. Canterra 1918 is an open-pollinated, spring-type, early- to mid-maturing napus variety. AAC A110 was the commercial carinata cultivar released by Nuseed (formerly Agrisoma Biosciences) when the study was conducted. Sand used for the study had a pH of 5.8, very low levels of P (17 kg ha−1), K (12 kg ha−1), Mg (17 kg ha−1), and Ca (294 kg ha−1), 0% organic matter, and 0.008% N (Waters Agricultural Labs). Pots were arranged in eight rows of eight pots oriented in an east-to-west direction on sliding benches as a randomized complete block design with eight replications per treatment. Plants were sequentially thinned to one plant per pot 7 to 14 days after planting (DAP). To minimize any border effects, pots were kept equidistant from each other after each harvest, and perimeter pots were not included in the measurements.
The mean daytime temperature averaged 21.1 ± 0.23 °C and night temperature averaged 15.4 ± 0.28 °C throughout the experiment. The daytime relative humidity (RH) was 69.2 ± 1.2% and night RH was 84.0 ± 0.8% throughout the experiment. Plants were grown under a 12/12 h light/dark photoperiod with supplemental lighting from high-pressure sodium lamps that provided a total flux of ~1200 µmol m−2 s−1. Pots were rotated within and across benches to minimize differences in temperature heterogeneity prior to treatment imposition. To further reduce the impact of greenhouse position effects, the pots were rotated among the four benches, three times during the experiment.
To ensure optimum water conditions, irrigation was supplied three times daily, at 0830 h, 1230 h, and 1630 h through a drip irrigation system metered by an ESP-LX BASIC 12 station modular irrigation controller (Rain Bird Corporation). Plants were irrigated with full-strength Hoagland solution until 38 DAP (at bolting when plants transitioned from vegetative to reproductive development, or growth stage 5.5 (inflorescence emergence) when the flower buds were elevated above the youngest leaves in both species), after which four treatments: 1. optimum NS (+N+S, 100% N and 100% S), 2. N limited (−N+S, 0% N, 100% S), 3. S limited (+N−S, 100% N, 0% S), and 4. NS limited (−N−S, 0% N and 0% S) of N and S in full-strength Hoagland solution were imposed on 9 January 2016 and continued until the termination of the study 132 DAP or 94 days after treatment (DAT). The Hoagland nutrient solution was modified by substituting Ca(NO3)2 with CaCl2 and KNO3 with KCl to achieve N-limited nutrient solution while MgSO4, CuSO4, and ZnSO4 were substituted with MgCl2, CuCl2, and ZnCl2 to achieve S-limited nutrient solution.

2.2. Phenology Measurements

Plant height, node numbers, and abscised leaves were recorded from 12 to 75 DAT at 7 days interval on five plants. Height was measured as the distance between the soil level and the uppermost visible main-stem node. The number of nodes and dropped leaves that were previously tagged on the main stem were recorded. At 94 DAT, five plants from each treatment were clipped at the soil level and hand threshed to determine seed yield and its components (reproductive branches, raceme length, raceme numbers, pod numbers, pod length, and seeds per pod). One thousand seeds were randomly subsampled from each plant and weighed. Roots were washed over a fine screen. Roots, stems, leaves, and reproductive structures were dried in a forced-air oven at 60 °C for 72 h before being weighed to determine dry matter accumulation partitioned into below- and above-ground organs. Dried roots, stems, leaves, and reproductive structures were ground separately to pass through a 2 mm stainless steel screen and analyzed for N and S content at Waters Agricultural Laboratories, Camilla, GA, USA.

2.3. Pigments and Gas Exchange Measurements

Leaf pigment concentrations (Chla, Chlb, and carotenoids) were estimated in the uppermost fully expanded leaf of four plants for each treatment at 55 DAT. Five leaf discs (each 38.5 mm2) were placed in vials containing 5 mL dimethyl sulphoxide and incubated in the dark at room temperature for 24 h for pigment extraction. Absorbance of the extract was measured using a 2.3 spectrophotometer (Cary BIO 50, Varian, CA, USA) at 470, 648, and 664 nm to calculate Chla, Chlb, and carotenoids concentrations, respectively, using equations developed by Lichtenthaler (1987) and expressed on a leaf area basis (µg cm−2).
Gas exchange processes ((net photosynthesis (Pn), stomatal conductance (Gs), and transpiration (Tr)) of the uppermost fully expanded leaf of four plants in each treatment were measured between 1000 h and 1400 h using an LI-6400 portable photosynthesis system integrated with a 6400-40 leaf chamber fluorometer (LI-COR Biosciences, Lincoln, NE). When measuring Pn, Gs, and Tr, the photosynthetically active radiation (PAR, provided by a 6400-02 LED light source) was set to 1200 µmol m−2 s−1 (based on measured PAR in the greenhouse), leaf cuvette temperature set at 20 °C, leaf chamber CO2 concentration set at 400 µL L−1, and relative humidity maintained at ambient conditions. Photosynthetic light response curves were measured on three plants in each treatment at 55 DAP. For photosynthetic light curves, the leaf cuvette temperature was set at 20 °C, leaf chamber CO2 concentration set at 400 µL L−1, and relative humidity maintained at ambient conditions while the PAR increased from 0 to 2000 µmol m−2 s−1. Leaves were dark adapted before logging the first measurement. All gas exchange parameters were automatically computed from the instrument software (details are available in LI–6400 Instruction Manual, version 5, Li-Cor Inc., Lincoln, NE, USA). Leaf SPAD readings were measured on the same leaf used to measure gas exchange processes using a Minolta-502 SPAD meter (Konica-Minolta Camera Co. Ltd., Osaka, Japan).

3. Results

Different stages of plant growth and development including vegetative factors, biomass accumulation, and photosynthesis were assessed to understand the effect of NS treatments on carinata and napus. The optimal NS (+N+S, 100% N and 100% S), N limited (−N+S, 0% N, 100% S), S limited (+N−S, 100% N, 0% S), and NS limited (−N−S, 0% N and 0% S) treatments of N and S in full-strength Hoagland solution were imposed for the study.

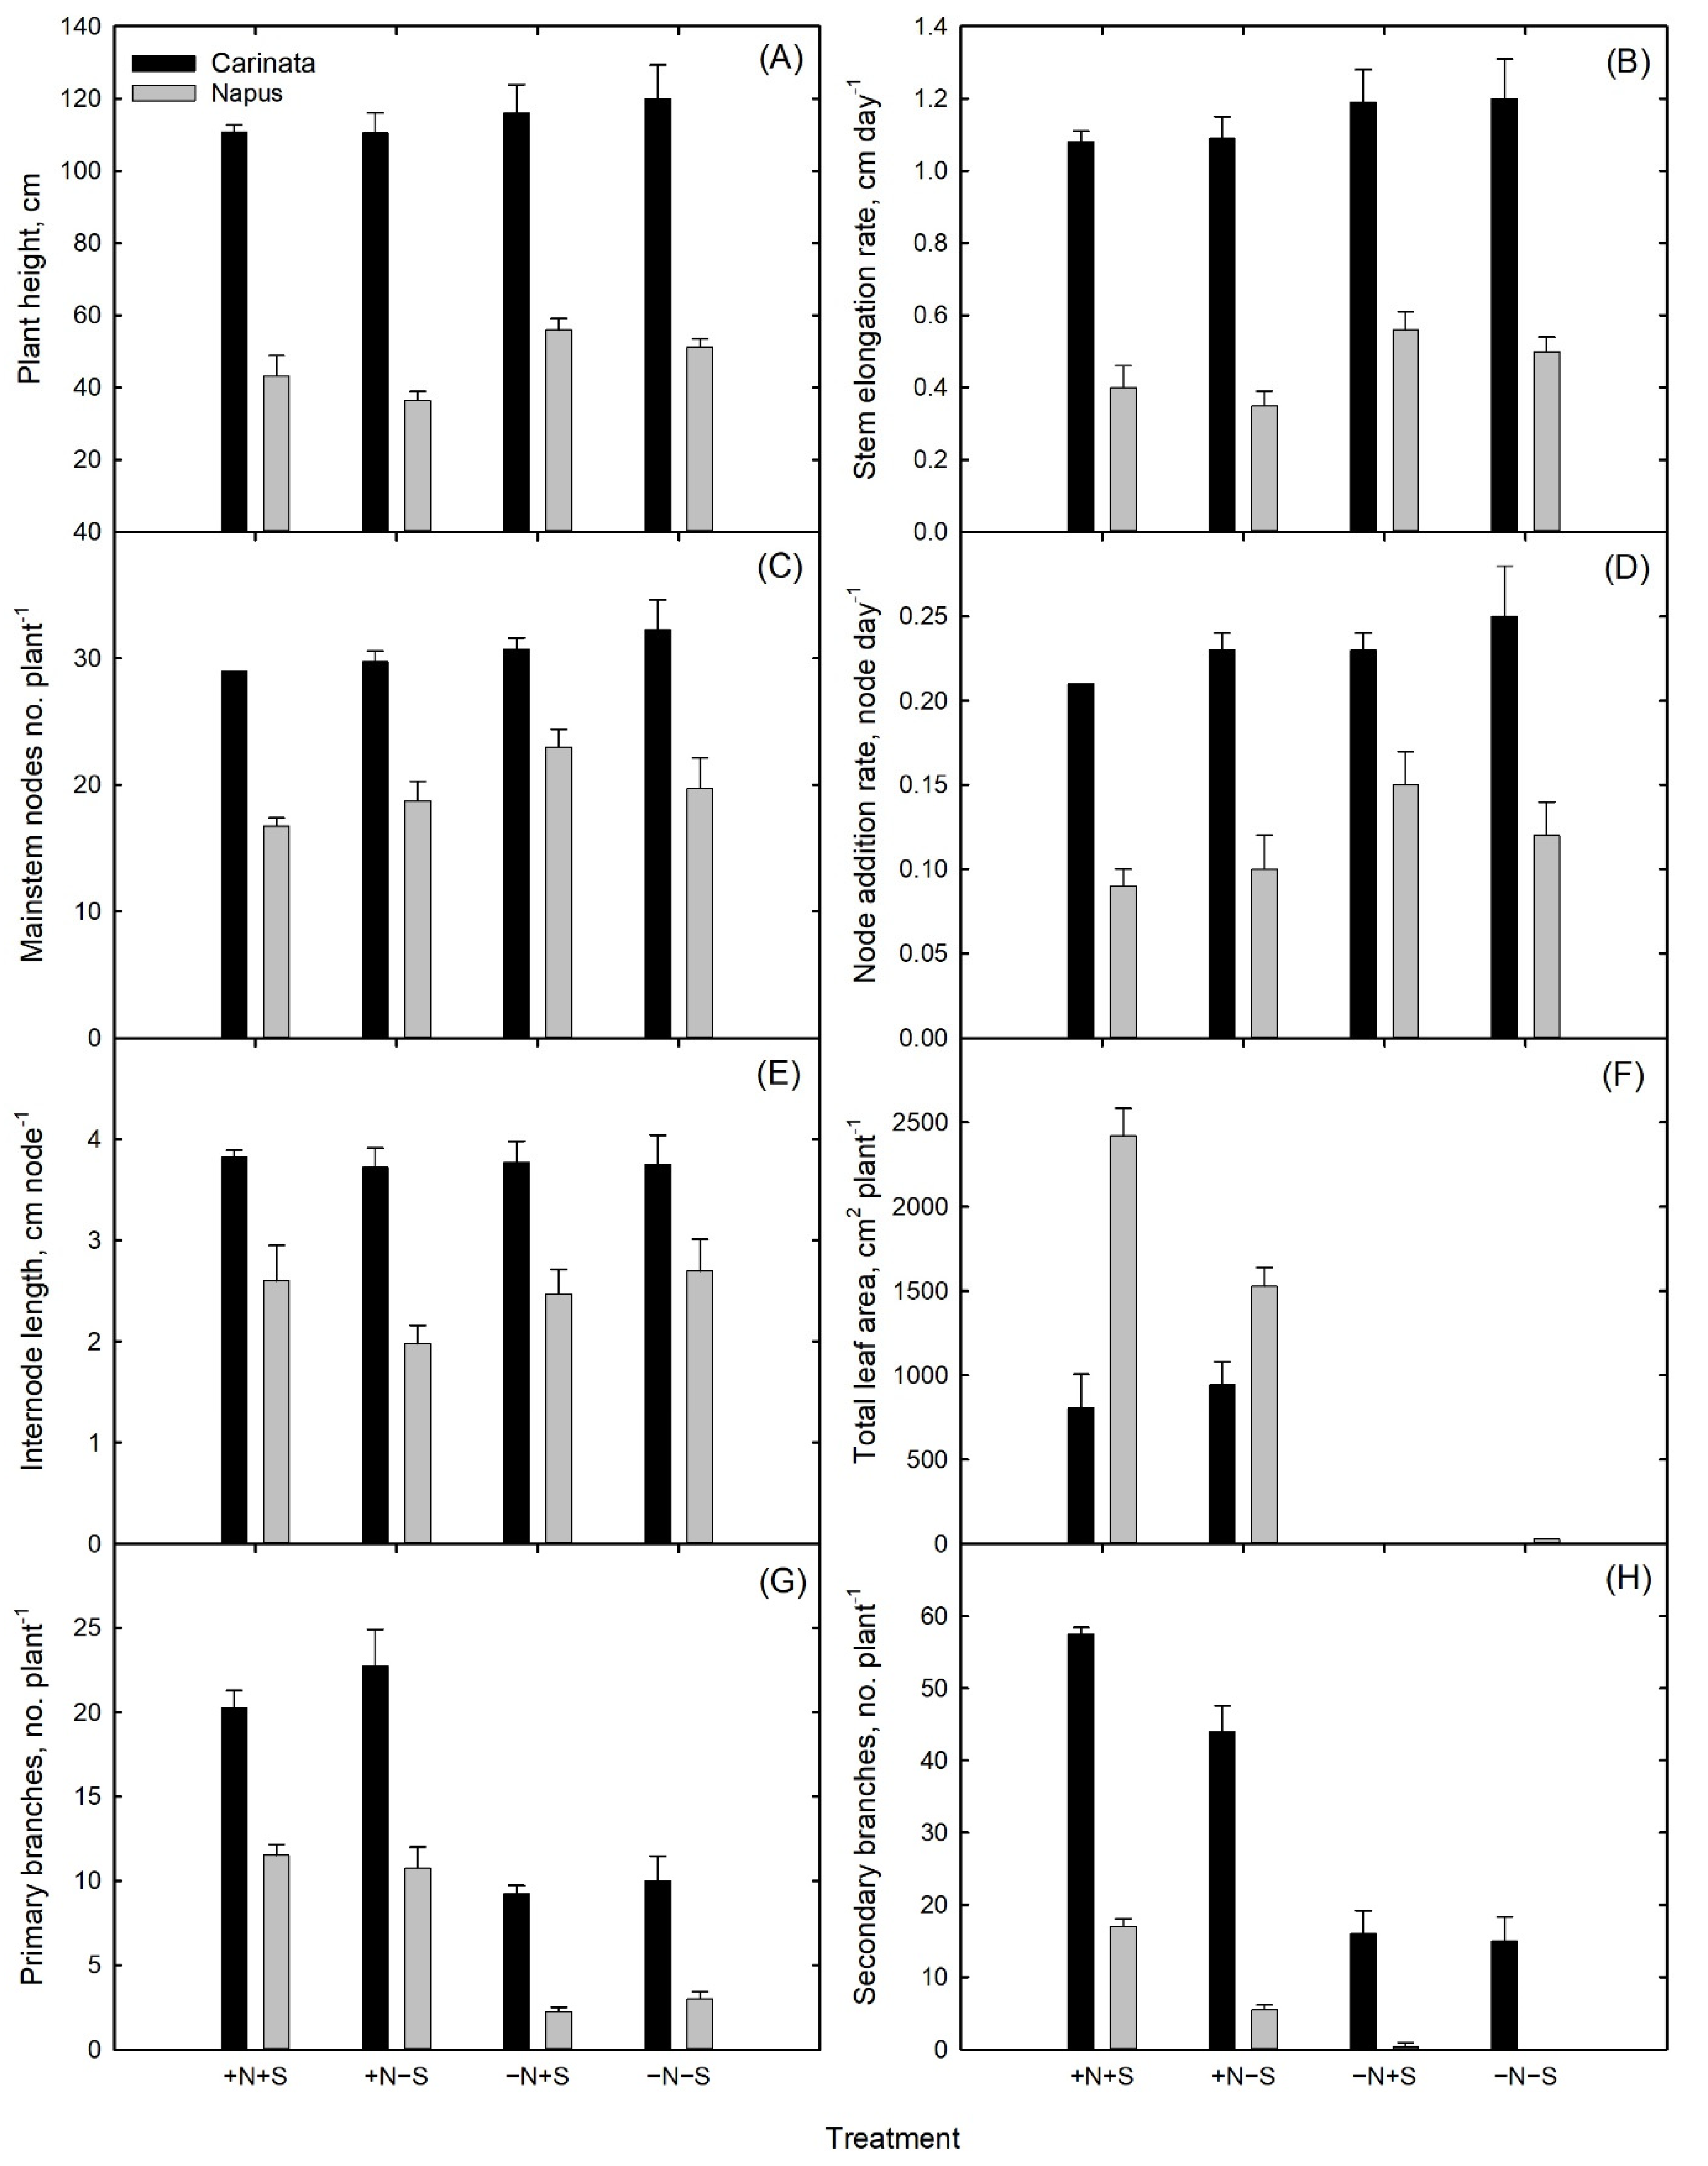
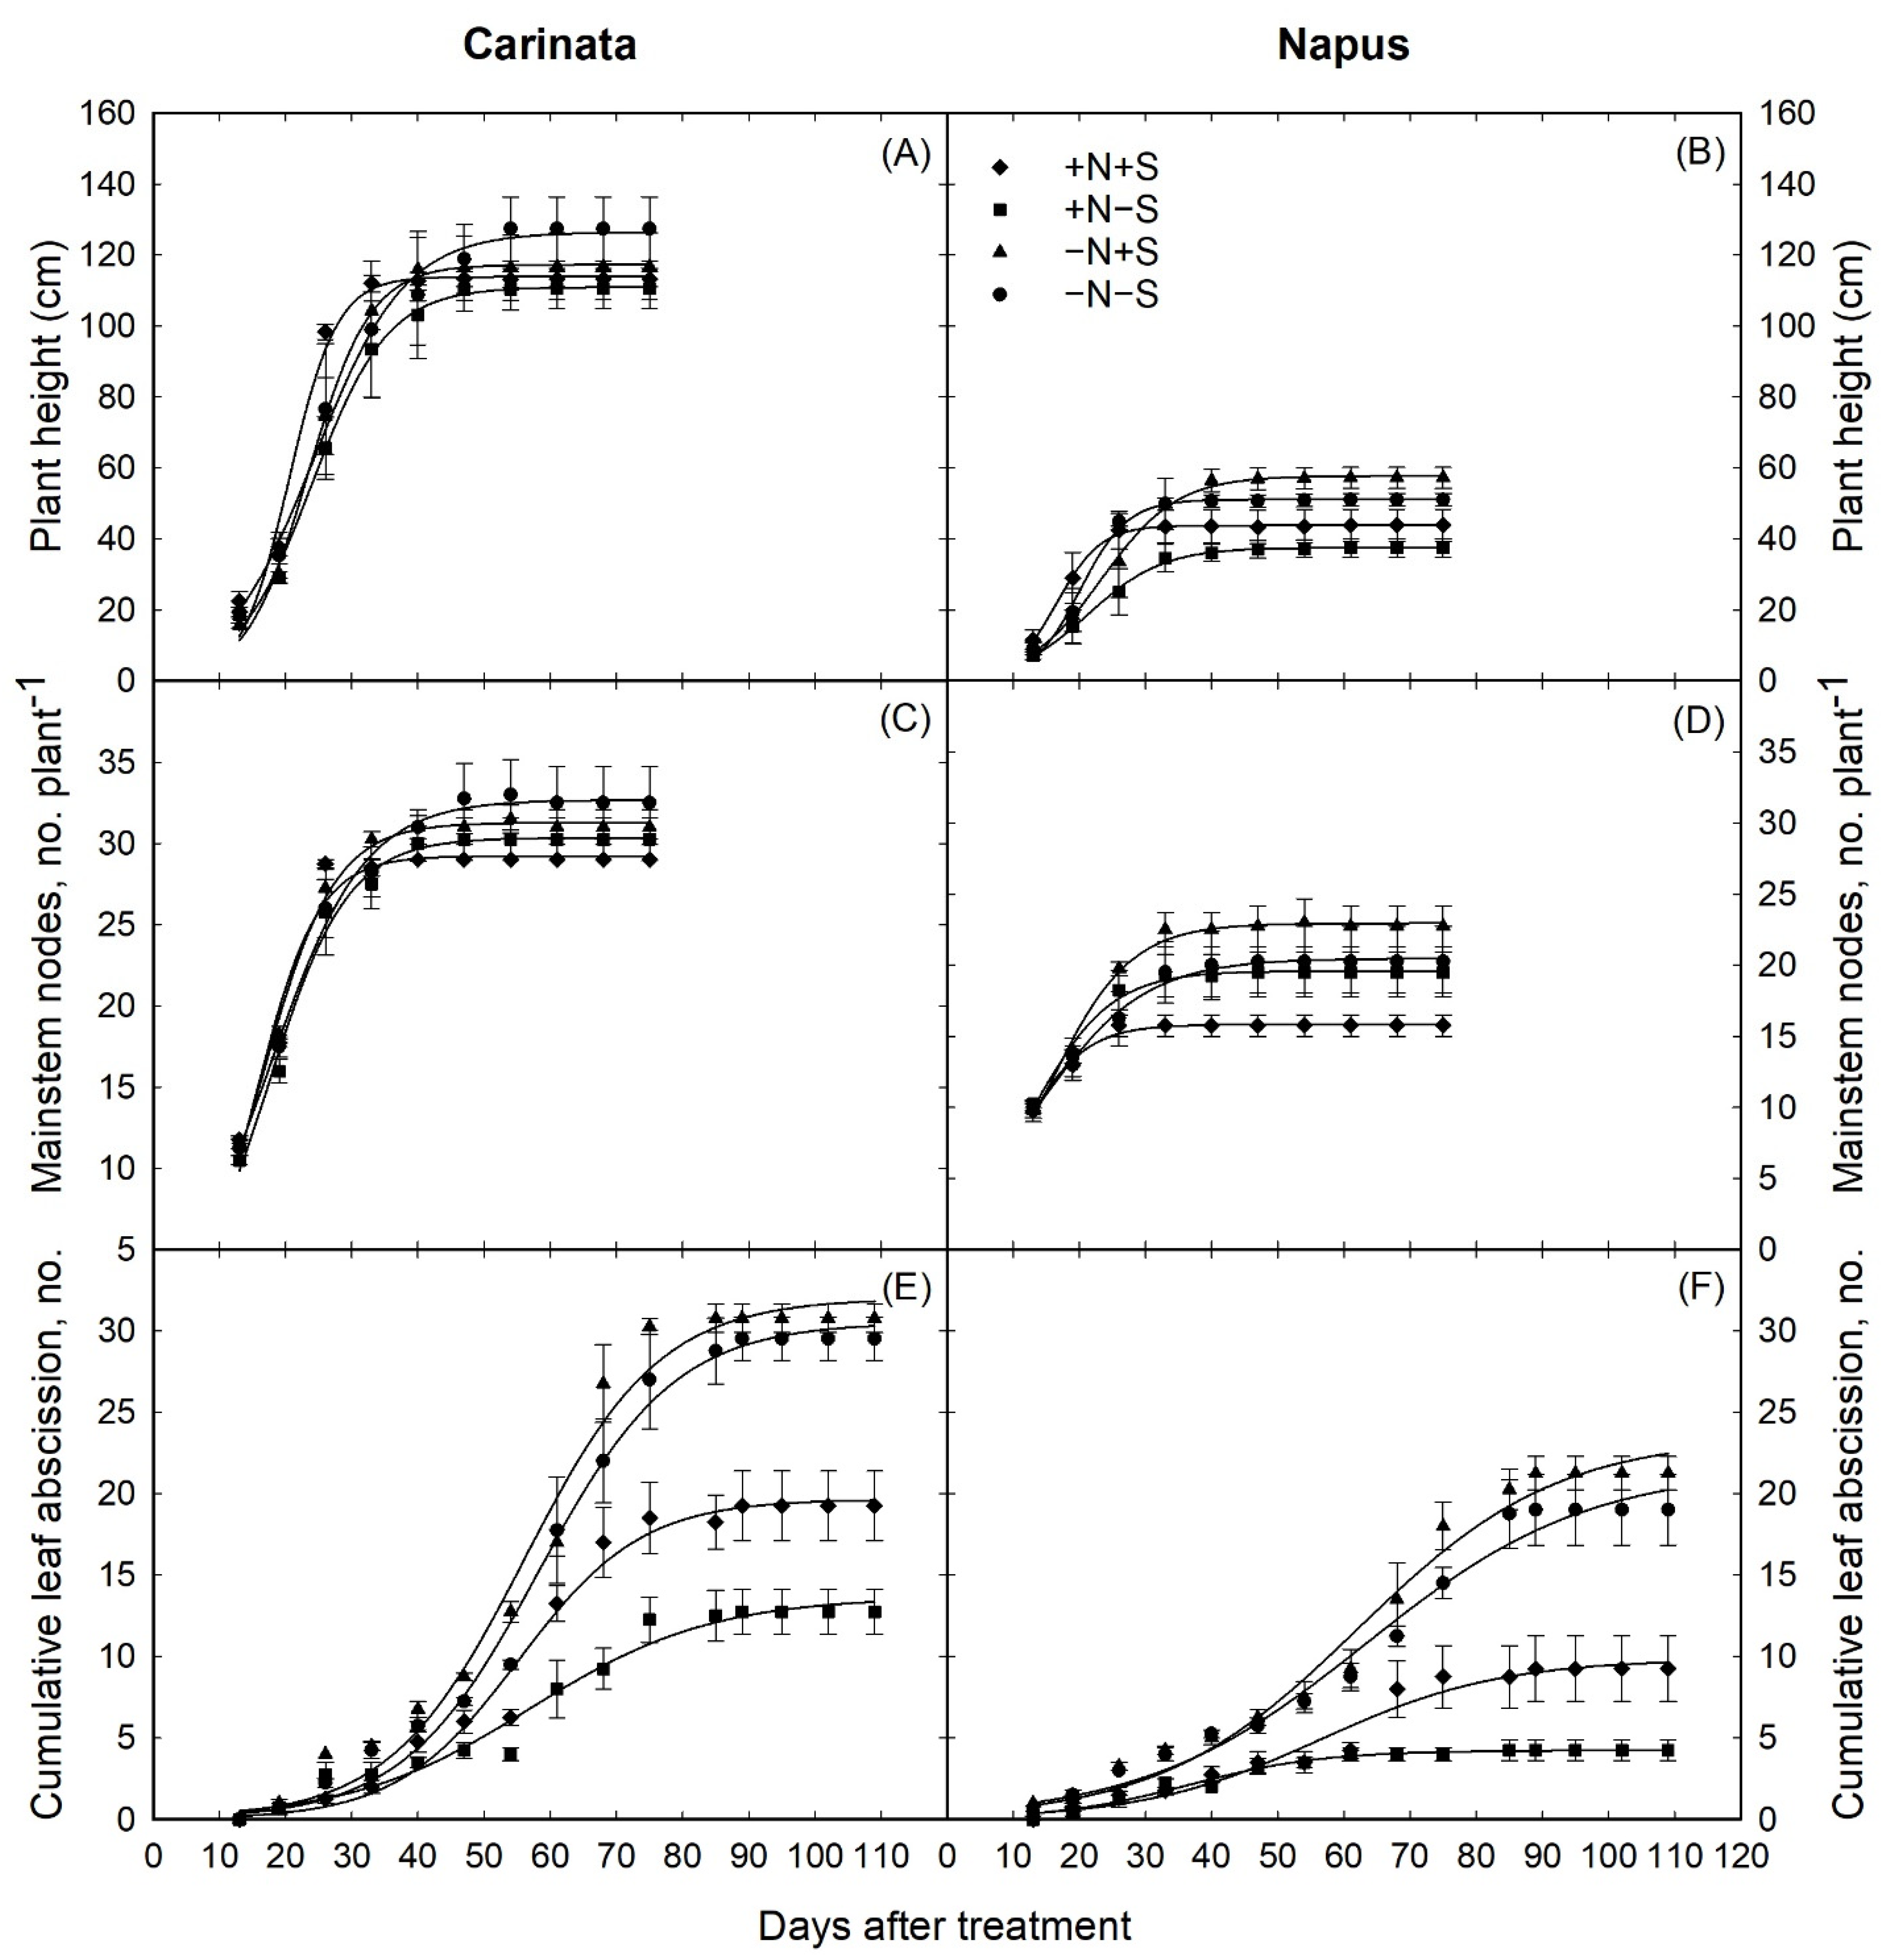
3.1. Plant Growth and Development

Vegetative traits such as plant height, stem elongation, mainstem nodes, node addition rate, total leaf area, primary and secondary branching were considered to estimate the effect of NS treatments on carinata and napus. ANOVA analysis showed significant species × treatment effect (p < 0.0001) for the traits of secondary branches and total leaf area (cm2/plant) in both carinata and napus based on different NS treatments at 94 days after treatment (DAT; Figure 1 and Table 1). The number of secondary branches varied significantly for all the treatments and was 24% (S limited; +N−S), 72% (N limited), and 74% (NS limited) lower than the optimal NS treatment in carinata. This trend showed a significant effect of N on secondary branching. The number of secondary branches varied significantly for all the treatments and was 68% (S limited) and 97% (N limited) lower than the optimal NS treatment in napus plants, showing similar trends as in carinata. The optimal NS treated napus had an average of 70% less secondary branches in comparison to carinata. The number of secondary branches for S limited and N limited napus was 87% and 97% lower, respectively, compared to similar treatments in carinata (Table 1). The NS limited treatment in napus did not produce any secondary branches. For the trait of total leaf area, the change was non-significant between S limited and optimal NS treated carinata plants, while in napus, the total leaf area (cm2/plant) was 37% and 99% lower for S limited and NS limited plants, respectively, relative to the optimal NS treatment. Total leaf area could not be estimated for N limited and NS limited carinata and N limited napus due to the absence of leaves at 94 DAT (Figure 1 and Table 1) emphasizing the importance of N in leaf development. The total leaf area (cm2/plant) for carinata for optimal NS and S limited treatment was 67% and 38% lower, respectively, compared to napus plants. Traits such as plant height, stem elongation rate (cm/day), number of nodes, node addition rate (node/day), internode length, and primary branches in carinata and napus did not show significant species × treatment effect (p < 0.0001) based on different NS treatments at 94 days after treatment (DAT; Figure 1 and Table 1). Plant height, stem elongation rate, number of nodes, internode length, and primary branches for carinata were higher for all corresponding treatments in comparison to napus. (Figure 2 and Table 1). Stem elongation (cm/day), number of nodes, node addition rate (node/day), internode length, and number of primary branches in napus were 60%, 36%, 50%, 35%, and 56% lower in comparison to carinata, respectively, when averaged across all the treatments. The cumulative leaf abscission for carinata was significantly greater for all treatments in comparison to napus. The average value of leaf abscission in carinata differed among treatments and ranged from 6.9 to 16.6 across the treatments (Figure 2). The average leaf abscission in napus varied from 2.9 to 10.9 with significant difference among treatments. The cumulative leaf abscission for napus was 42% lower in comparison to carinata (Figure 2).

3.2. Biomass Production and Allocation

Biomass production and allocation were significantly influenced by treatment interaction for different NS treatments (Table 2). Total biomass production (gm/plant) was greatest for the optimal NS treated carinata plants while S limited, N limited, and NS limited carinata plants had a decrease of 6%, 69%, and 64%, respectively, showing significant treatment effects (Table 2). A similar trend of total biomass production was observed for napus plants with the greatest value for optimal NS treatment and a significant decrease of 11% (S limited), 75% (N limited), and 76% (NS limited), respectively, for different treatments (Table 2) showing N as a limiting factor for production.
In optimally NS treated plants, reproductive structures accounted for 53.6 g of the biomass, constituting 51% of biomass allocation while S limited carinata constituted 50% of total biomass allocation. The value differed significantly for other treatments (N limited and NS limited) where reproductive structures comprised 36% and 35% of total biomass allocation, respectively, in carinata. Similar trends were observed for napus where optimal NS treated plants had reproductive structures accounting for 51% of biomass allocation. The value changed significantly for other treatments (N limited and NS limited) where reproductive structures comprised 43% and 44% of total biomass allocation, respectively (Table 2). Biomass production in the roots of carinata increased by 12% in S limited plants compared to optimal NS treated plants while the value decreased significantly by 54% (N limited) and 42% (NS limited) for other treatments. The percentage of biomass allocation for roots was 14% for optimally NS treated plants and increased to 17% (S limited), 21% (N limited), and 19% (NS limited) in different treatments for carinata. Biomass production in the roots of napus increased by 18% in S limited conditions compared to optimal NS treated plants while it decreased significantly by 61% (N limited) and 41% (NS limited) in napus. The percentage of biomass allocation for roots in napus was 14% in optimal NS treated plants and increased to 19%, 22%, and 24% in S limited, N limited, and NS limited treatments, respectively (Table 2).
Biomass production of stems for the optimal NS treatment was significantly greater at 31.6 g and decreased for S limited, N limited, and NS limited treatment by 16%, 56%, and 44%, respectively, in carinata. The biomass allocation for stems in carinata was significantly higher for NS limited and N limited conditions at 46% and 42% with respect to optimal NS treated carinata plants (31%). Biomass production for stems in optimal NS treated napus plants was significantly greater at 29.8 g and decreased for S limited, N limited, and NS limited plants by 31%, 67%, and 70%, respectively. The biomass allocation for stems was significantly greater for NS limited and N limited plants at 35% and 32% and lower for S limited at 20% with respect to the optimal NS treated napus plants (26%). Biomass production for leaves did not vary significantly between the optimally NS treated carinata plants (4.2 g) and S limited plants (5.9 g). Leaves were absent for other treatments (N limited and NS limited). Biomass allocation to leaves was 4% and 6% for optimal NS treatment and S limited, respectively, in carinata plants. Biomass production for leaves did not show any statistically significant difference between the optimal NS treated napus plants (10.2 g) and S limited plants (11.5 gm). Leaves were absent in the case of N limited and NS limited treatments. The total biomass allocation in leaves was 9% and 11% for optimal NS treatment and S limited napus plants. The biomass production of leaves differed significantly between the two species, with carinata having 53% lower overall biomass in leaves than napus (Table 2). The root:shoot ratio for S limited, N limited, and NS limited plants was significantly greater than the optimal NS treated carinata plants. The N limited carinata plants showed 59% greater root:shoot ratio followed by NS limited and S limited condition with 41% and 18% higher root:shoot ratio, respectively, compared to the optimal NS treated plants. A similar trend of root:shoot ratio for S limited, N limited, NS limited, and optimal NS treatment was observed for napus plants. The NS limited napus plants showed 88% greater root:shoot ratio followed by N limited and S limited plants with 71% and 35% higher root:shoot ratio, respectively, than the optimally NS treated plants (Table 2).

3.3. Nitrogen-Sulfur Uptake

The concentration of N and S in different plant parts such as roots, stems, leaves, and reproductive structures for different NS treatments was assessed for carinata and napus with reference to optimal NS condition. Both carinata and napus were significantly influenced by a treatment effect for different NS treatments (Table 3). The nitrogen uptake for carinata differed among NS treatments (Table 3). The greatest nitrogen uptake was observed in reproductive structures among all the plant parts of carinata and napus. The nitrogen uptake in reproductive parts of carinata was greatest for optimal NS treated plants at 3.37 g and significantly differed from S limited plants by 43%, N limited plants by 88%, and NS limited plants by 89%. Similarly, in napus, the nitrogen uptake in reproductive parts was highest for optimal NS treated plants at 3.75 g and significantly differed by 36% for S limited, 90% for N limited, and 87% for NS limited plants (Table 3). The nitrogen uptake value for roots was highest at 0.22 g for optimal NS treated carinata with no significant variation from S limited carinata having a value of 0.21 g. The nitrogen uptake significantly decreased by 67% for both N limited and NS limited plants in roots for carinata. In the case of napus, the nitrogen uptake value for roots was highest at 0.2 gm for optimal NS treated napus with no significant variation from S limited napus having a value of 0.19 g. The nitrogen uptake significantly decreased by 97% and 96% for N limited and NS limited plants, respectively, showing N as the primary limiting factor while the presence or absence of S did not have an effect. For stems, the nitrogen uptake was similar between optimally NS treated (0.36 gm) and S limited (0.33 gm) plants while a significant decrease of 78% was observed among N limited and NS limited carinata plants. In napus, the nitrogen uptake in the stem was similar between optimal NS treated (0.34 gm) and S limited (0.28 gm) plants, while a significant decrease of 82% and 88% was observed for N limited and NS limited plants, respectively. The nitrogen uptake for leaves in carinata was highest in optimally NS treated plants (0.30 g) followed by a decrease of 13% in S limited, 97% in N limited, and 93% in NS limited plants. In napus, nitrogen uptake for leaves was highest in optimally NS treated plants (0.35 g) followed by a decrease of 26% in S limited, 94% in N limited, and 97% in NS limited plants. The weighted average value for nitrogen uptake was highest for optimally NS treated carinata (2.37 g) and decreased by 47%, 88%, and 89% for S limited, N limited, and NS limited treatments, respectively. The weighted average value for nitrogen uptake in napus was highest for optimal NS treated napus (2.83 g) and decreased by 36%, 90%, and 86% for S limited, N limited, and NS limited plants, respectively.
Sulfur uptake in carinata and napus showed a significant difference among treatments. The highest sulfur uptake was observed in reproductive structures among all the plant parts of carinata. The sulfur uptake in reproductive parts was highest for optimally NS treated plants at 0.89 g and significantly differed by 82% for S limited plants and by 84% for both N limited and NS limited plants (Table 3). Sulfur uptake in the reproductive parts of napus was highest for optimal NS treated napus plants at 0.72 g and significantly differed by 76%, 82%, and 79% for S limited, N limited, and NS limited plants. The sulfur uptake value for roots was highest at 0.05 g for optimally NS treated carinata and decreased significantly by 56%, 52%, and 60% for S limited, N limited, and NS limited plants, respectively. In napus, the sulfur uptake value for roots was highest at 0.046 g for optimal NS treated napus and decreased significantly by 57%, 52%, and 57% for S limited, N limited, and NS limited plants, respectively. In stems, the sulfur uptake value differed significantly among optimally NS treated (0.11 g) and S limited, N limited, and NS limited plants with a decrease of 91%, 55%, and 64%, respectively. In stems of napus, the sulfur uptake value differed significantly among optimal NS treated (0.09 gm) and S limited, N limited, NS limited plants, demonstrated by a decrease of 78%, 67%, and 78%, respectively. The sulfur uptake for leaves was highest in optimally NS treated plants (0.07 g) followed by a decrease of 71% in S limited, 86% in both N limited and NS limited plants. Sulfur uptake in leaves of napus was highest in optimal NS treated plants (0.15 g) followed by a decrease of 87% in S limited, 80% in N limited, and 93% in NS limited plants. In both the species, S uptake in leaves was significantly affected by a species × treatment interaction. The weighted average value for sulfur uptake was highest for optimally NS treated carinata (0.62 gm) and decreased by 84% for both S limited and N limited and 87% for NS limited plants. The weighted average value for sulfur uptake was highest for optimal NS treated napus (0.54 g) and decreased by 76% for S limited, 83% for N limited, and 88% for NS limited plants (Table 3).
Sulfur uptake by stems differed significantly between the two species, with napus having 33% lower sulfur uptake in stems than carinata. A species × treatment interaction influenced sulfur uptake in stems. There was a 12%, 40%, and 50% lower S uptake in napus for optimal NS, N limited, and NS limited treatments, respectively, compared to carinata. Sulfur uptake in stems in napus under S limited condition was 100% higher with respect to carinata. Similarly, the S uptake in leaves in napus was 53% and 67% higher for optimal NS and N limited carinata (Table 3).

3.4. Pigments

The concentration of Chla, Chlb, total leaf chlorophyll, carotenoids, and SPAD was estimated to investigate the effect of nitrogen and sulfur treatments in carinata and napus. All pigment concentration was significantly influenced by different treatments. Chla concentration was found to be greatest in optimal NS treated carinata plants (18.5 µg/cm2) and did not vary for the S limited carinata (17.0 µg/cm2; Table 4) while a significant decrease of 42% and 37% in Chla concentration was observed for N limited and NS limited carinata plants showing the limiting effect of N. In napus, the concentration of Chla was greatest in optimal NS treated napus plants (18.6 µg/cm2) and did not differ significantly from the S limited (17.9 µg/cm2; Table 4) conditions. A significant decrease of 25% and 27% in Chla concentration was observed for N limited and NS limited napus plants with reference to the optimally NS treated plants. Chlb content of carinata plants showed a decrease of 11%, 54%, and 27% in its content among S limited, N limited, and NS limited treatments compared to the optimal NS treated (3.7 µg/cm2) plants. Estimation of Chlb content of different treatments on napus plants showed a significant decrease of 32% and 35% in Chlb content among N limited and NS limited conditions compared to the optimal NS treated plants.
The effect of NS treatment on leaf total chlorophyll content did not vary between optimal NS treated (22.4 µg/cm2) and S limited (20.5 µg/cm2) carinata plants. Significant decreases of 41% and 35% in leaf total chlorophyll content were observed for N limited and NS limited plants, respectively. Similarly, the effect of NS treatment on total leaf chlorophyll content did not vary between optimal NS treated (22.2 µg/cm2) and S limited (21.4 µg/cm2) napus plants. Significant decreases of 26% and 28% in leaf total chlorophyll content were observed for N limited and N S limited conditions, respectively. The carotenoid concentration decreased significantly by 16%, 35%, and 27% among S limited, N limited, and N S limited carinata plants, respectively, compared to the optimal NS treated carinata (5.1 µg/cm2). There were similar trends of carotenoid concentration decreasing significantly by 9%, 26%, and 24% among S limited, N limited, and NS limited plants, respectively, compared to the optimal NS treated (5.1 µg/cm2) observed in napus. The SPAD readings did not vary between optimally NS treated (47.7 µg/cm2) and S limited (50.5 µg/cm2) carinata plants while a significant decrease of 13% and 20% was observed for N limited and NS limited plants, respectively. A similar trend was observed for napus where SPAD readings did not differ between optimal NS treated (55.0 µg/cm2) and S limited (57.6 µg/cm2) napus plants while a significant decrease of 21% and 27% was observed for N limited and NS limited plants, respectively, indicating that N is the primary limiting factor while the presence or absence of S did not have an effect.
An overall comparison of the values of different pigment concentrations of carinata and napus with reference to different treatments showed that concentration of Chla, total leaf chlorophyll, and SPAD readings of napus were 11%, 8%, and 10% greater than carinata, respectively. In contrast, Chlb and carotenoids concentrations of napus were 2% and 4% less than carinata, respectively (Table 4). SPAD readings were 13%, 12%, 5%, and 4% lower for optimal NS, S limited, N limited, and NS limited treatment, respectively, in carinata in comparison to napus.

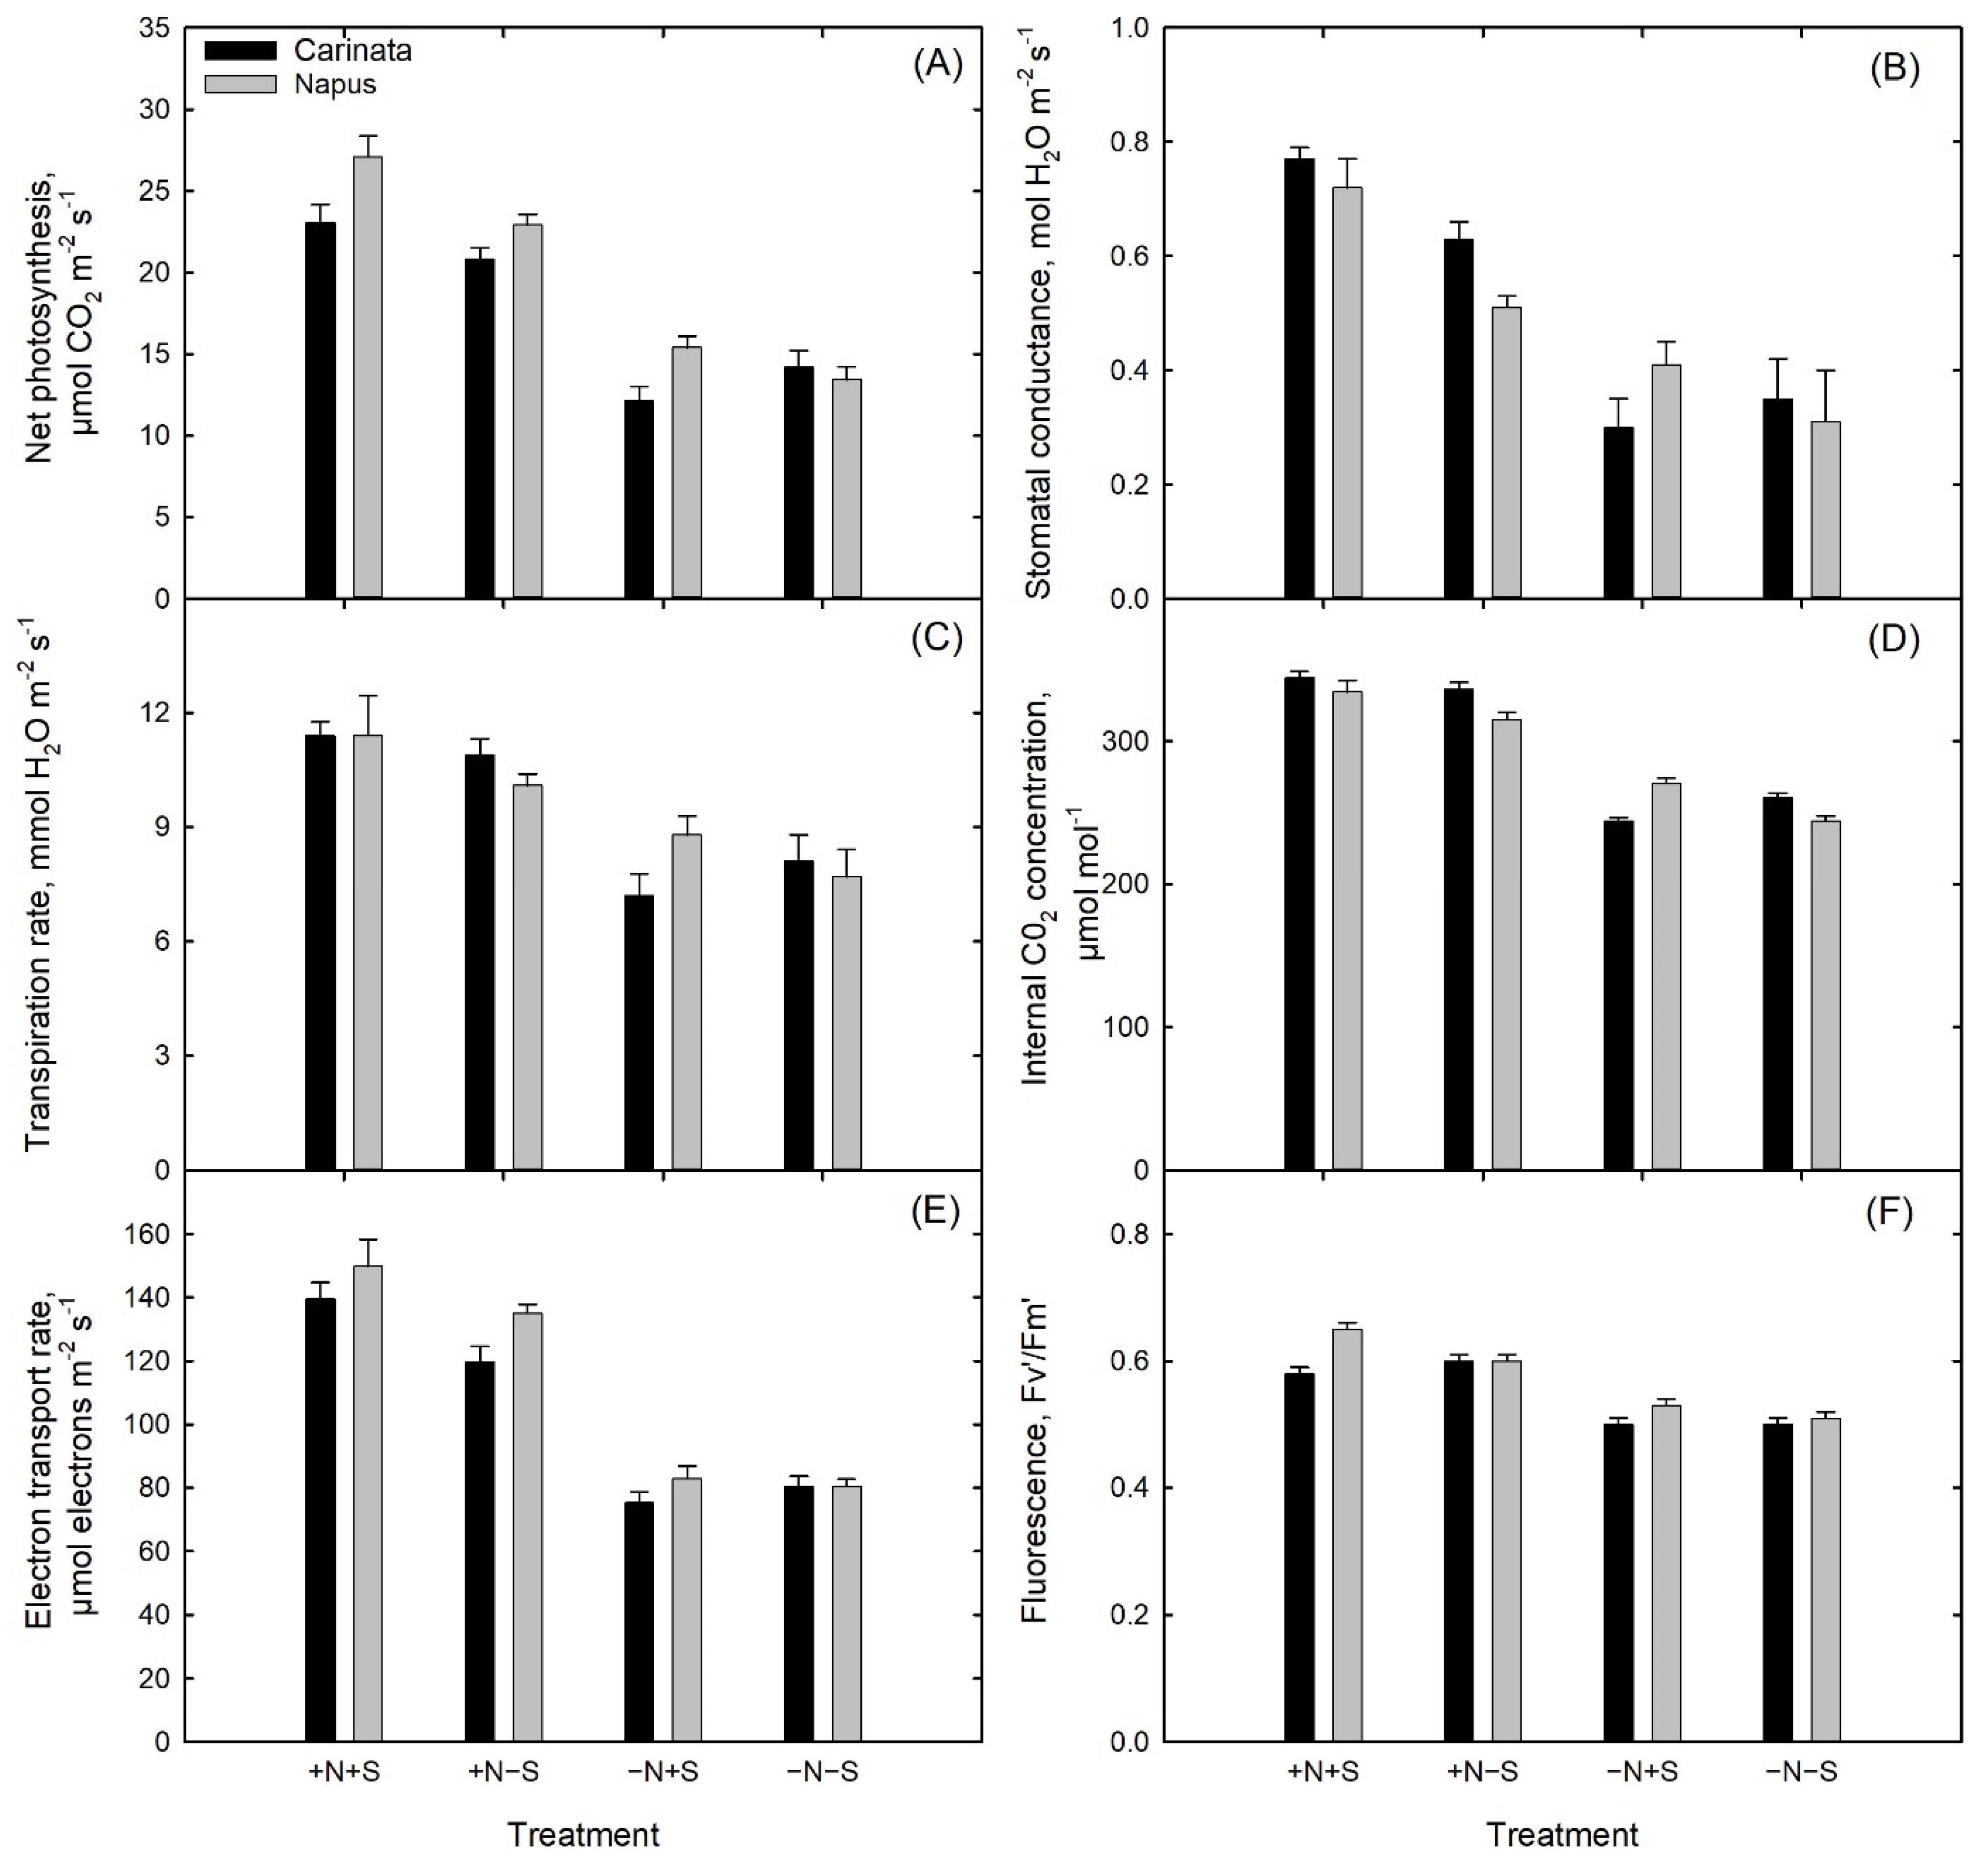
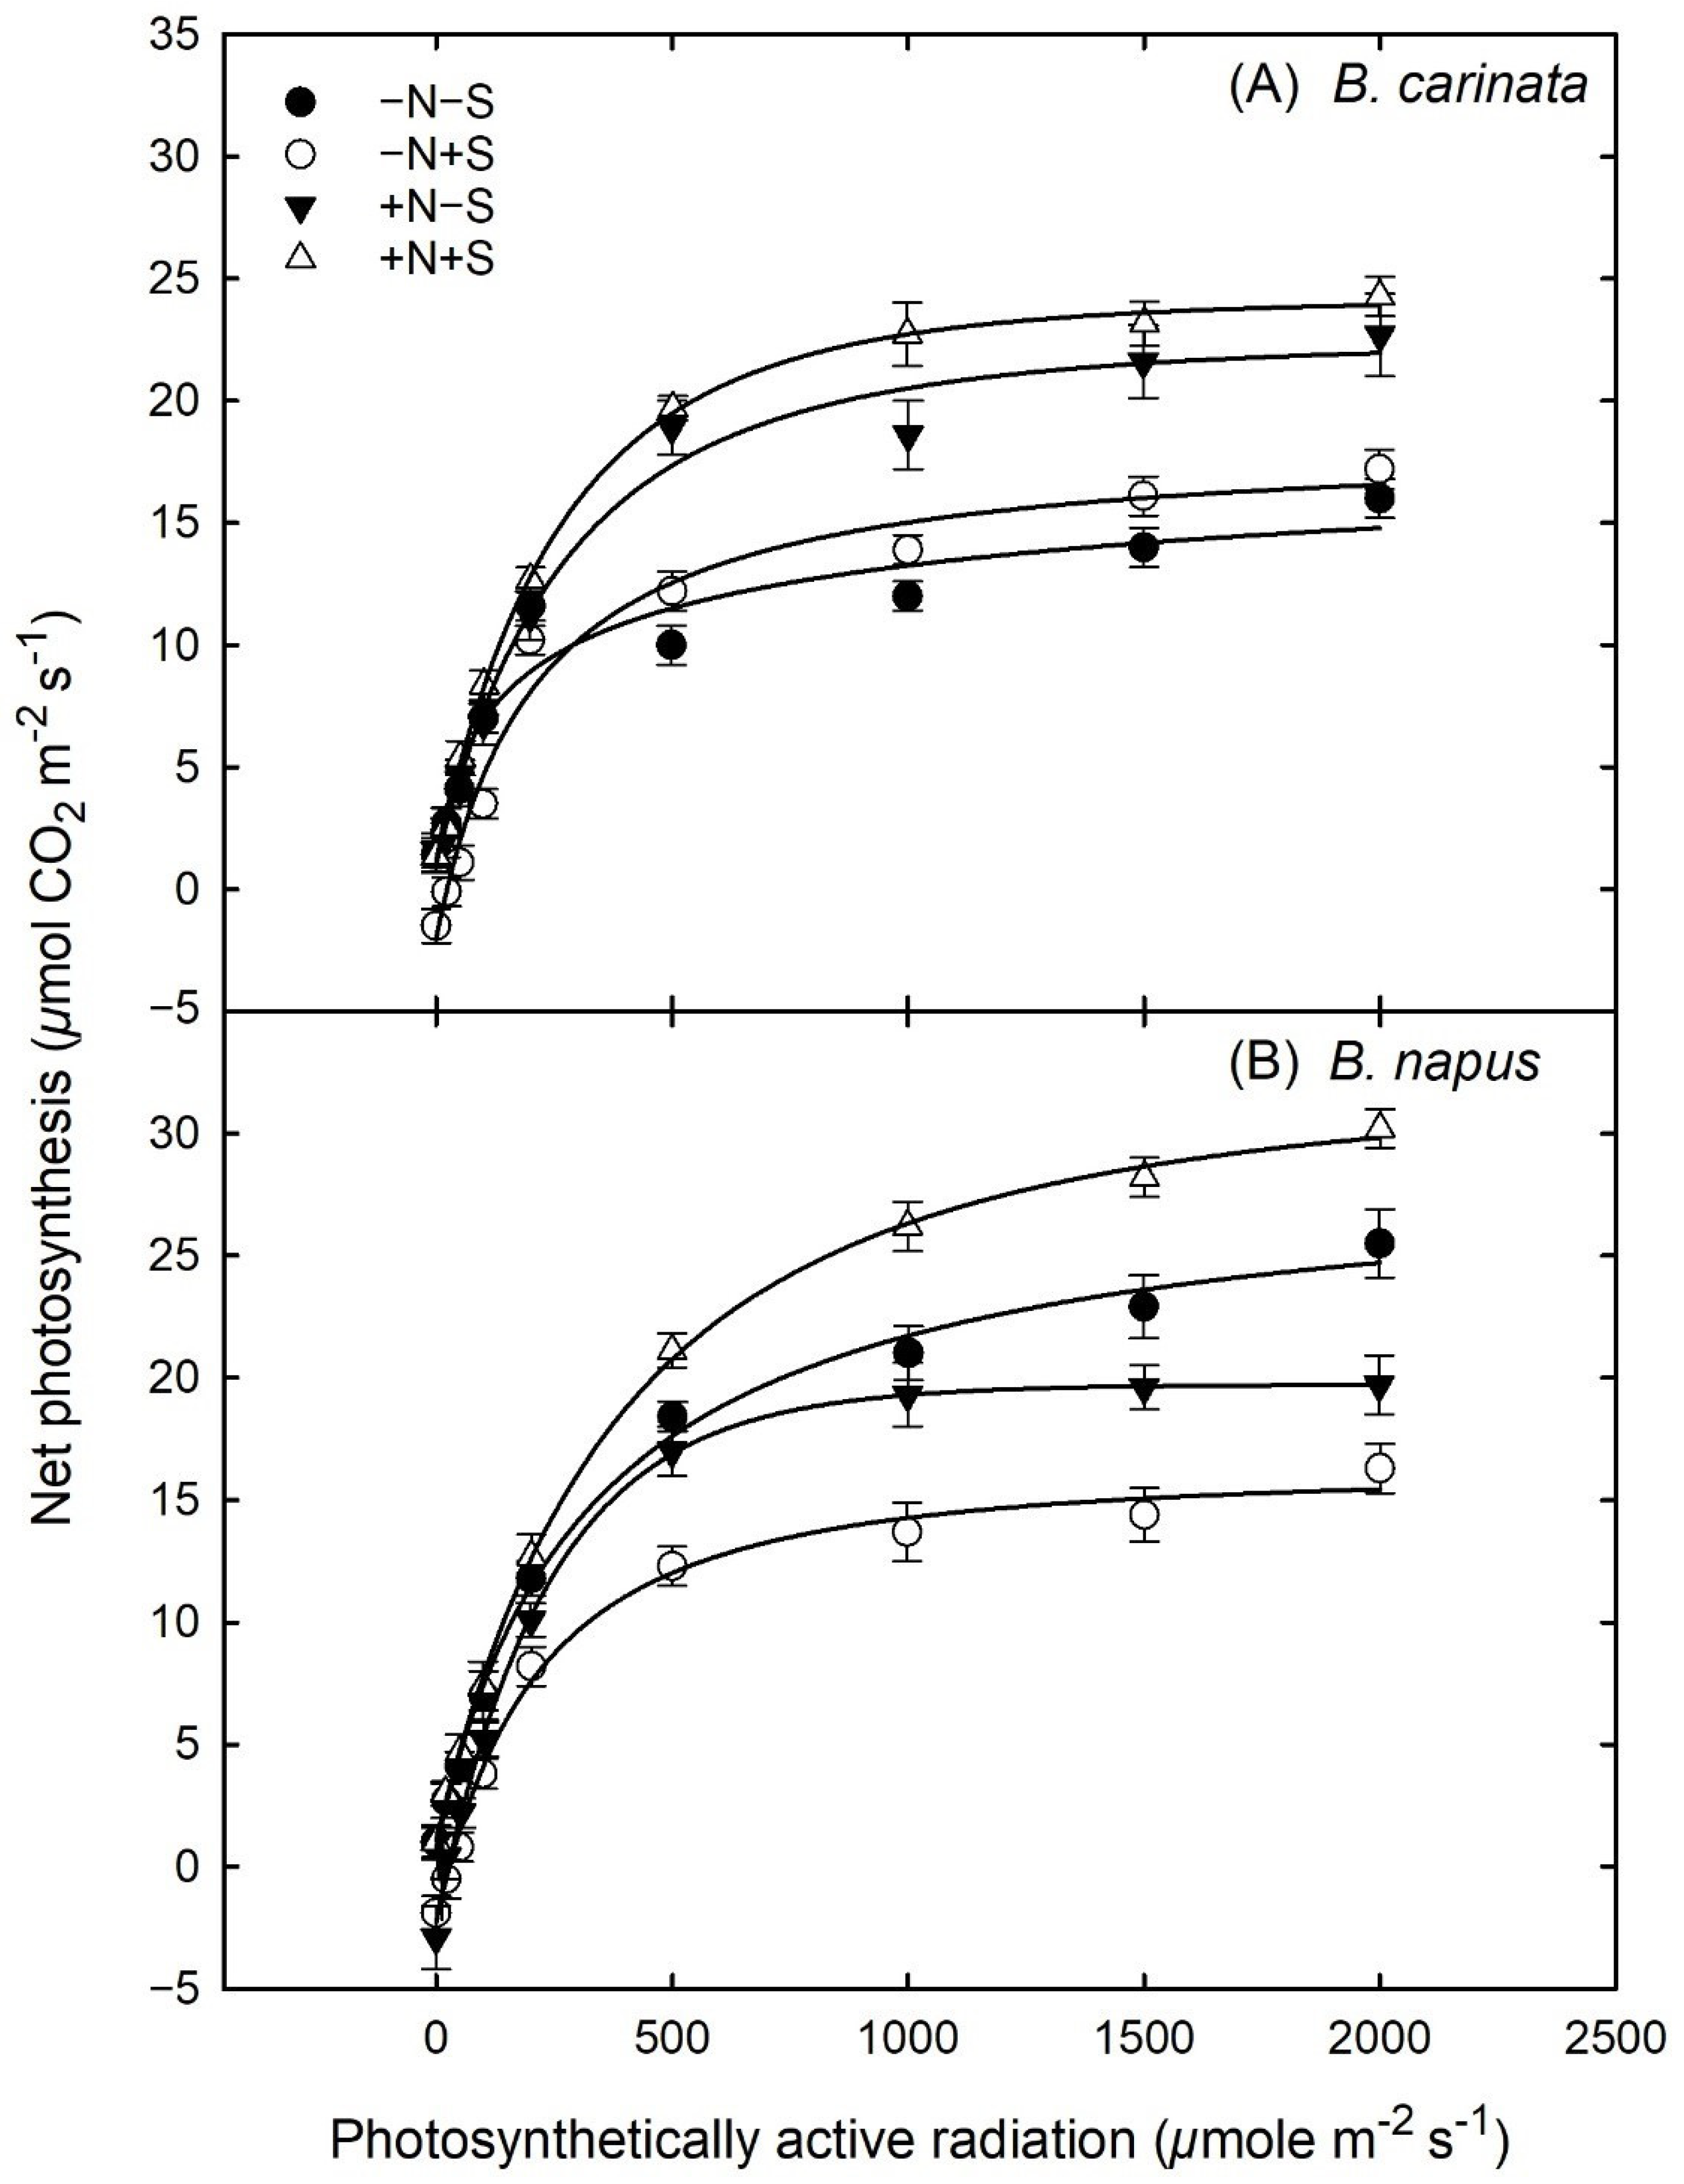
3.5. Gas Exchange and Light Response Curves

Gas exchange and photosynthesis parameters such as net photosynthesis rate, stomatal conductance, transpiration rate, internal CO2 concentration, electron transport rate, and fluorescence were measured for carinata and napus as a function of nitrogen sulfur treatments at 90 days after planting or 52 days after nutrient treatment. Both the species showed significant species × treatment interaction for different NS treatments as shown in Figure 3. The net photosynthesis rate for the optimally NS treated carinata was found to be highest, with a value of 23.1 µmol CO2 m−2 s−1 (Figure 3). A decrease of 10%, 48%, and 39% in the net photosynthesis was were observed for S limited, N limited, and NS limited plants, respectively, compared to optimally treated carinata plants. Similarly, in the case of napus, a significant decrease of 14%, 43%, and 57% in net photosynthesis rate was observed with respect to the optimally NS treated napus plants showing N as the primary limiting factor while the presence or absence of S did not have an effect (Figure 4). Estimation of stomatal conductance for different treatments in carinata plants showed a decrease of 18%, 61%, and 55% in stomatal conductance among S limited, N limited, and NS limited plants in comparison to the optimal NS treated (0.77 mol H2O m−2 s−1) carinata. The value of stomatal conductance decreased significantly by 29% for S limited, 43% for N limited, and 57% for NS limited plants compared to the optimal NS treated napus (0.72 mol H2O m−2 s−1). Transpiration rate for the optimal NS treated (11.4 mmol H2O m−2 s−1) and S limited (10.9 mmol H2O m−2 s−1) carinata did not vary while there was a decrease of 37% and 24% in transpiration rate for N limited and NS limited plants, respectively, in comparison to the optimally NS treated carinata plants. Transpiration rate decreased by 11% for S limited, 23% for N limited, and 32% for NS limited plants compared to the optimally NS treated (11.4 mmol H2O m−2 s−1) napus plants. Internal CO2 concentration decreased by 27% and 22% for N limited and NS limited treatments, respectively, compared to the optimal NS treated (334.7 µmol mol−1) carinata plants. Limiting S did not influence internal CO2 concentration for carinata. Internal CO2 concentration decreased by 6%, 19%, and 27% for S limited, N limited, and NS limited plants, respectively, compared to the optimally NS treated (335 µmol mol−1) napus plants. The electron transport rate of plants showed a decrease of 14% for S limited, 46% for N limited, and 42% for NS limited plants with respect to the optimal NS treated carinata plants (139.5 µmol electrons m−2 s−1), while the electron transport rate of experimental napus plants showed a decrease of 10% for S limited, 45% for N limited, and 46% for NS limited treatments with respect to the optimal NS treated napus plants (149.8 µmol electrons m−2 s−1). The Fv/Fm ratio for optimally NS treated (0.58 Fv’/Fm’) and S limited (0.60 Fv’/Fm’) carinata plants did not differ, while there was a decrease of 14% in the Fv/Fm ratio for N limited and NS limited plants with respect to the optimally treated carinata plants. The Fv/Fm ratio for napus showed a decrease of 8% for S limited, 18% for N limited, and 22% for NS limited plants with respect to the optimal NS treated napus plants (0.65 Fv’/Fm’; Figure 3).
At low photosynthetically active radiation (PAR; <200 µmol m−2 s−1), the net photosynthesis rate for all the NS treatments in carinata did not vary (Figure 4). Beyond PAR > 500 µmol m−2 s−1, the effect of the treatments was evident. The average net photosynthesis rate of NS limited carinata was 13 µmol CO2 m−2 s−1 and increased to 22.5 µmol CO2 m−2 s−1 for optimally NS treated carinata. The average net photosynthesis rate declined by 34% and 9% for N limited and S limited conditions, respectively, compared to optimal NS treated carinata (Figure 4). At low photosynthetically active radiation (PAR; <200 µmol m−2 s−1), the net photosynthesis rate for all the NS treatments in napus showed a similar trend as carinata (Figure 4). The effect was more significantly evident beyond PAR > 500 µmol m−2 s−1 when the average net photosynthesis rate of NS limited napus was 22 µmol CO2 m−2 s−1 which increased to 26.4 µmol CO2 m−2 s−1 for optimally NS treated napus. The average net photosynthesis rate declined by 47% and 28% for N limited and S limited conditions, respectively, in comparison to optimal NS treated napus (Figure 4).
An overall comparison of the average value of different gas exchange and photosynthesis parameters of carinata and napus for the different treatments showed that the rate of net photosynthesis, electron transport, and fluorescence in napus was 12%, 8%, and 5% greater than carinata, respectively. At the average net photosynthesis rate at PAR > 500 µmol m−2 s−1, the net photosynthesis rate of napus was 13% higher in comparison to carinata (Figure 4). In contrast, the overall value for stomatal conductance decreased by 5% in napus with respect to carinata (Figure 3).

3.6. Correlation Analysis between Traits

Pearson correlation analysis identified significant positive correlations among various traits in the current analysis. Photosynthesis and fluorescence were positively correlated (r = 0.91; p < 0.001) followed by the biomass and N content (r = 0.90; p < 0.001) and height and node number (r = 0.91; p < 0.001; Table 5). Other trait combinations with significant positive correlations were SPAD and N content (r = 0.88; p < 0.001), and Chla and carotenoids (r = 0.87; p < 0.001). Both N and S showed significant correlation with Chla, carotenoids, and net photosynthesis rate and fluorescence (r ≥ 0.80; p < 0.001; Table 5).

4. Discussion

Carinata has emerged as a biofuel source due to its high erucic acid content, making it desirable for various industrial applications. Nitrogen along with sulfur is required as a primary source of nutrition for the growth and development in oilseed crops, and their utilization is interdependent. The effect of S availability on seed yield and oil quality has been studied extensively in most oilseed crops, but its interactive impact with N remains poorly reported. Knowledge of the impact of NS interaction on different growth stages of carinata will help improve NS fertilization management strategy. The assimilatory pathway for N and S is functionally convergent in nature and interlinked as availability of one nutrient regulates the utilization of the other in plants. A synergistic and antagonistic relationship of N and S use efficiency at optimal and excessive level has been reported by Fismes et al. [32]. Nutrient deficiency at vegetative and reproductive stage can have a detrimental effect on the overall growth potential of the crops [3].
Branching is a key characteristic of plant architecture in different oilseed crops, including brassicas, and is an important determinant of seed yield [43,44]. Branch development in different oilseed brassicas is known to be affected by the supply of N [45]. Earlier reports in carinata have shown an increase in the number of primary (vegetative) and secondary (reproductive) branches in response to increased N fertilization [17]. An increase in the number of branches and pods per plant was also reported for napus with increased application of N fertilizer [46]. This trend was also observed in the current study, where the absence of N resulted in a significant decline in the number of primary and secondary branches for both carinata and napus. On the other hand, the presence of N and S (+N+S; optimal conditions) together increased lateral bud development and, in turn, the development of a significantly higher number of secondary branches compared to the treatment with S limited conditions for both carinata and napus. From the perspective of agronomic value, seed yield for oilseed brassica is usually determined by the number of branches and their distribution, i.e., primary and secondary branches, which in turn influences the number of siliques per plant [47,48,49,50]. Total leaf area is another important factor influencing the photosynthesis rate and ultimately seed yield in oilseed crops. Enhancement in leaf area is also known to minimize soil water loss through evaporation and weed growth [17]. Change in nutrient content during pre− or post−anthesis period influences the total number of leaves and leaf area in oilseeds [51]. The presence of N and S (+N+S; optimal conditions) showed higher leaf area in napus and carinata plants, depicting positive interaction between the nutrients. Leaf growth is particularly responsive to N fertilization in oilseeds [17,51,52] which was not evident in the case of carinata and napus in the present study where the leaf area for the treatment with high N or S limited was significantly lower in comparison to N and S together (optimal conditions) for napus and did not vary significantly in the case of carinata. Leaves play an important role in recycling foliar compounds to sustain seed filling and result in higher seed yield in napus. A decrease in 50% leaf content at the bolting stage resulted in a 30% decline in seed yield in oilseed napus [53]. Mobilization of S from vegetative tissue for seed filling is crucial and that is evident in the current analysis.
The present study revealed that N limitation had a significant impact on biomass production in both carinata and napus while the absence of S did not significantly impact the process. Significant NS effect was observed in the case of stem biomass production while the biomass production of other plant parts such as roots, leaves, and reproductive structures did not show such effect. In the current study, N was the main nutrient factor responsible for biomass production in roots, leaves, and reproductive structure and its absence led to a significant decline in the total biomass production for both carinata and napus. These results agree with Zhao et al. [54], findings where no significant interactions were observed with the presence or absence of S for biomass production in napus. Optimal N and S, which produced significantly higher stem biomass in the current study, emphasize the role of S in optimizing NUE and their interactive effect for management of N and S in oilseed crops [32,39,55,56,57]. Nitrogen stress in early growth stages can directly impact the yield potential of the plant by affecting plant biomass. The present study revealed that S limitation had no significant impact on N uptake in roots, stems, and leaves in carinata, but affected N uptake in reproductive structures. These results agree with the study conducted by Abdallah et al. [9] in napus. However, S limitations resulted in a significant impact on N uptake in stems, leaves, and reproductive structures of napus without affecting roots. The limited uptake of S in the absence of S and/or N in carinata and napus was reported in other brassica family members that are known to be sensitive to S limitation. Reproductive structures were found to have maximum uptake of N and S at 132 days after planting in the current study compared to other plant parts.
Chlorophylls (Chla and Chlb) are the primary pigment responsible for photosynthesis in plants. N is an essential component of the chloroplast tissue, and its limitation is known to significantly affect the process of photosynthesis in plants [58]. In this study, the impact of N on the pigment concentration of Chla, Chlb, and carotenoids was evident. The concentration of all pigments decreased significantly in the absence of N. This, in turn, impacted the different physiological activities of the plants in the current study. The rate of net photosynthesis, stomatal conductance, rate of transpiration, internal CO2 concentration, and electron transport rate declined significantly in the N limited conditions [59]. Reduction in the rate of photosynthesis is also known to impact the accumulation of dry matter and nutrient uptake in crops [60] which is evident in the current analysis. Some of the gas exchange parameters were significantly influenced by NS interaction such as net photosynthesis, stomatal conductance, internal CO2 concentration, and chlorophyll fluorescence where limitation of S had a significant effect in canola.

5. Conclusions

This study revealed a synergistic relationship between N and S when applied in optimal amount (+N+S) for different vegetative, biomass, and photosynthesis−related traits in carinata and napus. The study highlights the importance of balancing N and S input for higher productivity rather than using any single element to increase the productivity of the oilseed crops. It also provides a thorough understanding of the N and S uptake, assimilation, allocation, remobilization, and its impact on various physiological processes. It also highlights the importance of the NS interaction and the pivotal role it plays in NUE and SUE.

Author Contributions

Conceptualization, R.S., S.G., J.J.M. and D.L.W.; methodology, R.S., S.G., J.J.M. and D.L.W.; formal analysis, R.S. and S.K.; investigation, R.S. and G.K.O.; writing—original draft preparation, S.K. and R.S.; writing—review and editing, S.K., R.S., I.M.S., G.K.O., S.G., J.J.M., and D.L.W. All authors have read and agreed to the published version of the manuscript.

Funding

This research was funded by Florida Department of Agriculture and Consumer Services−Office of Energy; Grant # SRD0007 and USDA−NIFA Project No. 51625 (Southeast Partnership for Advanced Renewables from Carianta).

Data Availability Statement

Not Applicable.

Acknowledgments

We would like to thank Lydia Bolton and the staff at NFREC for their technical support throughout this project.

Conflicts of Interest

The authors declare that the research was conducted in the absence of any commercial or financial relationships that could be construed as a potential conflict of interest.

References

  1. Marillia, E.F.; Francis, T.; Falk, K.C.; Smith, M.; Taylor, D.C. Palliser’s promise: Brassica carinata, an emerging western Canadian crop for delivery of new bio-industrial oil feedstocks. Biocatal. Agric. Biotechnol. 2014, 3, 65–74. [Google Scholar] [CrossRef]
  2. Mulvaney, M.J.; Leon, R.G.; Seepaul, R.; Wright, D.L.; Hoffman, T.L. Brassica carinata seeding rate and row spacing effects on morphology, yield, and oil. Agron. J. 2019, 111, 528–535. [Google Scholar] [CrossRef] [Green Version]
  3. Kumar, S.; Seepaul, R.; Mulvaney, M.J.; Colvin, B.; George, S.; Marois, J.J.; Bennett, R.; Leon, R.; Wright, D.L.; Small, I.M. Brassica carinata genotypes demonstrate potential as a winter biofuel crop in South East United States. Ind. Crop. Prod. 2020, 112353. [Google Scholar] [CrossRef]
  4. Seepaul, R.; Kumar, S.; Iboyi, J.E.; Bashyal, M.; Stansly, T.L.; Bennett, R.; Boote, K.J.; Mulvaney, M.J.; Small, I.M.; George, S.; et al. Brassica carinata: Biology and Agronomy as a Biofuel Crop. GCB Bioenergy 2021. [Google Scholar] [CrossRef]
  5. Soil Health Census Report USA. Adoption of Soil Health Systems Based on Data from the 2017 U.S. Census of Agriculture. 2019. Available online: https://soilhealthinstitute.org/wp-content/uploads/2019/07/Soil-Health-Census-Report.pdf (accessed on 17 November 2020).
  6. Lakkineni, K.C.; Abrol, Y.P. Sulphur requirement of crop plants: Physiological analysis. Fertil. News 1994, 39, 11–18. [Google Scholar]
  7. Fazili, I.S.; Jamal, A.; Ahmad, S.; Masoodi, M.; Khan, J.S.; Abdin, M.Z. Interactive effect of sulfur and nitrogen on nitrogen accumulation and harvest in oilseed crops differing in nitrogen assimilation potential. J. Plant Nutr. 2008, 31, 1203–1220. [Google Scholar] [CrossRef]
  8. Franzen, D.W. Fertilizing Mustard and Canola. Available online: https://www.ag.ndsu.edu/publications/crops/fertilizing-canola-and-mustard (accessed on 15 April 2021).
  9. Abdallah, M.; Dubousset, L.; Meuriot, F.; Etienne, P.; Avice, J.C.; Ourry, A. Effect of mineral sulphur availability on nitrogen and sulphur uptake and remobilization during the vegetative growth of Brassica napus L. J. Exp. Bot. 2010, 61, 2635–2646. [Google Scholar] [CrossRef] [PubMed]
  10. Weisler, F.; Behrens, T.; Horst, W.J. The role of nitrogen-efficient cultivars in sustainable agriculture. Sci. World J. 2001, 1. [Google Scholar] [CrossRef]
  11. Malagoli, P.; Laine, P.; Rossato, L.; Ourry, A. Dynamics of nitrogen uptake and mobilization in field-grown winter oilseed rape (Brassica napus) from stem extension to harvest: I. Global N flows between vegetative and reproductive tissues in relation to leaf fall and their residual N. Ann. Bot. 2005, 95, 853–861. [Google Scholar] [CrossRef] [Green Version]
  12. Rathke, G.W.; Behrens, T.; Diepenbrock, W. Integrated nitrogen management strategies to improve seed yield, oil content and nitrogen efficiency of winter oilseed rape (Brassica napus L.): A review. Agric. Ecosyst. Environ. 2006, 117, 80–108. [Google Scholar] [CrossRef]
  13. Jamal, A.; Moon, Y.S.; Zainul Abdin, M. Sulphur-a general overview and interaction with nitrogen. Aust. J. Crop Sci. 2010, 4, 523. [Google Scholar]
  14. Gammelvind, L.H.; Schjoerring, J.K.; Mogensen, V.O.; Jensen, C.R.; Bock, J.G.H. Photosynthesis in leaves and siliques of winter oilseed rape (Brassica napus L.). Plant Soil 1996, 186, 227–236. [Google Scholar] [CrossRef]
  15. Momoh, E.J.; Song, W.J.; Li, H.Z.; Zhou, W.J. Seed yield and quality responses of winter oilseed of rape (Brassica napus) to plant density and nitrogen fertilization. Indian J. Agric. Sci. 2004, 74, 420–424. [Google Scholar]
  16. Albert, B.; Le Cahérec, F.; Niogret, M.F.; Faes, P.; Avice, J.C.; Leport, L.; Bouchereau, A. Nitrogen availability impacts oilseed rape (Brassica napus L.) plant water status and proline production efficiency under water-limited conditions. Planta 2012, 236, 659–676. [Google Scholar] [CrossRef] [Green Version]
  17. Seepaul, R.; George, S.; Wright, D.L. Comparative response of Brassica carinata and B. napus vegetative growth, development and photosynthesis to nitrogen nutrition. Ind. Crop. Prod. 2016, 94, 872–883. [Google Scholar] [CrossRef]
  18. Jackson, G.D. Effects of nitrogen and sulfur on canola yield and nutrient uptake. Agron. J. 2000, 92, 644–649. [Google Scholar] [CrossRef]
  19. Malagoli, P.; Lainé, P.; Le Deunff, E.; Rossato, L.; Ney, B.; Ourry, A. Modeling nitrogen uptake in oilseed rape cv Capitol during a growth cycle using influx kinetics of root nitrate transport systems and field experimental data. Plant Physiol. 2004, 134, 388–400. [Google Scholar] [CrossRef] [PubMed] [Green Version]
  20. Jensen, C.R.; Mogensen, V.O.; Mortensen, G.; Andersen, M.N.; Schjoerring, J.K.; Thage, J.H.; Koribidis, J. Leaf photosynthesis and drought adaptation in field-grown oilseed rape (Brassica napus L.). Funct. Plant Biol. 1996, 23, 631–644. [Google Scholar] [CrossRef]
  21. McGrath, S.P.; Zhao, F.J. Sulphur uptake, yield responses and the interactions between nitrogen and sulphur in winter oilseed rape (Brassica napus). J. Agric. Sci. 1996, 126, 53–62. [Google Scholar] [CrossRef]
  22. Zhao, F.J.; Salmon, S.E.; Withers, P.J.A.; Monaghan, J.M.; Evans, E.J.; Shewry, P.R.; McGrath, S.P. Variation in the breadmaking quality and rheological properties of wheat in relation to sulphur nutrition under field conditions. J. Cereal Sci. 1999, 30, 19–31. [Google Scholar] [CrossRef]
  23. Jamal, A.; Fazli, I.S.; Ahmad, S.; Abdin, M.Z.; Yun, S.J. Effect of sulphur and nitrogen application on growth characteristics, seed and oil yields of soybean cultivars. Korean J. Crop Sci. 2005, 50, 340. [Google Scholar]
  24. Jamal, A.; Fazli, I.S.; Ahmad, S.; Kim, K.T.; Oh, D.G.; Abdin, M.Z. Effect of sulfur on nitrate reductase and ATP sulfurylase activities in groundnut (Arachis hypogea L.). J. Plant Biol. 2006, 49, 513–517. [Google Scholar] [CrossRef]
  25. Tandon, H.L.S. Sulphur Research and Agricultural Production in India. Available online: http://eprints.icrisat.ac.in/13314/1/RP%203272.pdf (accessed on 20 April 2021).
  26. Ahmad, A.; Khan, I.; Anjum, N.A.M.; Diva, I.; Abdin, M.Z.; Iqbal, M. Effect of timing of sulfur fertilizer application on growth and yield of rapeseed. J. Plant Nutr. 2005, 28, 1049–1059. [Google Scholar] [CrossRef]
  27. Asare, E.; Scarisbrick, D.H. Rate of nitrogen and sulphur fertilizers on yield, yield components and seed quality of oilseed rape (Brassica napus L.). Field Crop. Res. 1995, 44, 41–46. [Google Scholar] [CrossRef]
  28. De Pascale, S.; Maggio, A.; Orsini, F.; Bottino, A.; Barbieri, G. Sulphur fertilisation affects yield and quality in friarielli (Brassica rapa L. subsp. sylvestris L. Janch. var. esculenta Hort.) grown in a floating system. J. Hortic. Sci. Biotechnol. 2008, 83, 743–748. [Google Scholar] [CrossRef]
  29. Ahmad, G.; Jan, A.; Arif, M.; Jan, M.T.; Khattak, R.A. Influence of nitrogen and sulfur fertilization on quality of canola (Brassica napus L.) under rainfed conditions. J. Zhejiang Univ. Sci. 2007, B8, 731–737. [Google Scholar] [CrossRef] [PubMed]
  30. Malhi, S.S.; Gan, Y.; Raney, J.P. Yield, seed quality, and sulfur uptake of Brassica oilseed crops in response to sulfur fertilization. Agron. J. 2007, 99, 570–577. [Google Scholar] [CrossRef]
  31. Baligar, V.C.; Fageria, N.K.; He, Z.L. Nutrient use efficiency in plants. Commun. Soil Sci. Plant Anal. 2001, 32, 921–950. [Google Scholar] [CrossRef]
  32. Fismes, J.; Vong, P.C.; Guckert, A.; Frossard, E. Influence of sulfur on apparent N-use efficiency, yield and quality of oilseed rape (Brassica napus L.) grown on a calcareous soil. Eur. J. Agron. 2000, 12, 127–141. [Google Scholar] [CrossRef]
  33. Sachdev, M.S.; Deb, D.L. Nitrogen and sulphur uptake and efficiency in the mustard-moong-maize cropping system. Fertil. News 1990, 35, 49–55. [Google Scholar]
  34. Schnug, E.; Haneklaus, S.; Borchers, A.; Polle, A. Relations between sulphur supply and glutathione and ascorbate concentrations in Brassica napus. Z. Für Pflanz. Und Bodenkd. 1995, 158, 67–69. [Google Scholar] [CrossRef]
  35. Dubousset, L.; Etienne, P.; Avice, J.C. Is the remobilization of S and N reserves for seed filling of winter oilseed rape modulated by sulphate restrictions occurring at different growth stages? J. Exp. Bot. 2010, 61, 4313–4324. [Google Scholar] [CrossRef] [PubMed]
  36. Eppendorfer, W.H. Effects of S, N and P on amino acid composition of field beans (Vidafabd) and responses of the biological value of the seed protein to S-amino acid content. J. Sci. Food Agric. 1971, 22, 501–505. [Google Scholar] [CrossRef] [PubMed]
  37. Aulakh, M.S.; Pasricha, N.S.; Sahota, N.S. Nitrogen-sulphur relationship in brown sarson and Indian mustard. Indian J. Agric. Sci. 1977, 47, 249–253. [Google Scholar]
  38. Dev, G.; Kumar, V. Secondary nutrients. In Review of Soil Research in India; Indian Society of Soil Science: New Delhi, India, 1982; Volume 1, pp. 342–360. [Google Scholar]
  39. Janzen, H.H.; Bettany, J.R. Sulfur nutrition of rapeseed: I. Influence of fertilizer nitrogen and sulfur rates. Soil Sci. Soc. Am. J. 1984, 48, 100–107. [Google Scholar] [CrossRef]
  40. Dev, G.; Jaggi, R.C.; Aulakh, M.S. Study of nitrate-sulphate interaction on the growth and nutrient uptake by maize using 35S. J. Indian Soc. Soil Sci. 1979, 27, 302–307. [Google Scholar]
  41. Randall, P.J.; Spencer, K.; Freney, J.R. Sulfur and nitrogen fertilizer effects on wheat. I. Concentrations of sulfur and nitrogen and the nitrogen to sulfur ratio in grain, in relation to the yield response. Aust. J. Agric. Res. 1981, 32, 203–212. [Google Scholar] [CrossRef]
  42. Gilbert, S.M.; Clarkson, D.T.; Cambridge, M.; Lambers, H.; Hawkesford, M.J. SO42-deprivation has an early effect on the content of ribulose-1, 5-bisphosphate carboxylase/oxygenase and photosynthesis in young leaves of wheat. Plant Physiol. 1997, 115, 1231–1239. [Google Scholar] [CrossRef] [Green Version]
  43. Kumar, S.; Ambreen, H.; Variath, M.T.; Rao, A.R.; Agarwal, M.; Kumar, A.; Goel, S.; Jagannath, A. Utilization of molecular, phenotypic, and geographical diversity to develop compact composite core collection in the oilseed crop, safflower (Carthamus tinctorius L.) through maximization strategy. Front. Plant Sci. 2016, 7, 1554. [Google Scholar] [CrossRef] [Green Version]
  44. Peng, D.; Tan, X.; Zhang, L.; Yuan, D.; Lin, J.; Liu, X.; Jiang, Y.; Zhou, B. Increasing branch and seed yield through heterologous expression of the novel rice S-acyl transferase gene OsPAT15 in Brassica napus L. Breed. Sci. 2018, 17126. [Google Scholar] [CrossRef] [Green Version]
  45. Ahanger, M.A.; MoradTalab, N.; Fathi Abd-Allah, E.; Ahmad, P.; Hajiboland, R. Plant growth under drought stress: Significance of mineral nutrients. Water Stress Crop. Plants A Sustain. Approach 2016, 2. [Google Scholar] [CrossRef]
  46. Khan, S.; Anwar, S.; Kuai, J.; Noman, A.; Shahid, M.; Din, M.; Ali, A.; Zhou, G. Alteration in yield and oil quality traits of winter rapeseed by lodging at different planting density and nitrogen rates. Sci. Rep. 2018, 8, 634. [Google Scholar] [CrossRef]
  47. Li, F.; Chen, B.; Xu, K.; Gao, G.; Yan, G.; Qiao, J.; Li, J.; Li, H.; Li, L.; Xiao, X.; et al. A genome-wide association study of plant height and primary branch number in rapeseed (Brassica napus). Plant Sci. 2016, 242, 169–177. [Google Scholar] [CrossRef]
  48. Seepaul, R.; Marois, J.; Small, I.; George, S.; Wright, D. Carinata dry matter accumulation and nutrient uptake responses to nitrogen fertilization. Agron. J. 2019, 111, 2038–2046. [Google Scholar] [CrossRef]
  49. Seepaul, R.; Small, I.; Marois, J.; George, S.; Wright, D. Brassica carinata and Brassica napus growth, nitrogen use, seed, and oil productivity constrained by post-bolting nitrogen deficiency. Crop Sci. 2019, 59, 2720–2732. [Google Scholar] [CrossRef]
  50. Seepaul, R.; Mulvaney, M.J.; Small, I.M.; George, S.; Wright, D.L. Carinata growth, yield and chemical composition responses to nitrogen fertilizer management. Agron. J. 2020. [Google Scholar] [CrossRef]
  51. Ogunlela, V.B.; Kullmann, A.; Geisler, G. Nitrogen distribution and dry matter accumulation in oilseed rape (Brassica napus L.) as influenced by N nutrition. J. Agron. Crop Sci. 1990, 164, 321–333. [Google Scholar] [CrossRef]
  52. Girondé, A.; Dubousset, L.; Trouverie, J.; Etienne, P.; Avice, J.C. The impact of sulfate restriction on seed yield and quality of winter oilseed rape depends on the ability to remobilize sulfate from vegetative tissues to reproductive organs. Front. Plant Sci. 2014, 5, 695. [Google Scholar] [CrossRef] [PubMed] [Green Version]
  53. Noquet, C.; Avice, J.C.; Rossato, L.; Beauclair, P.; Henry, M.P.; Ourry, A. Effects of altered source–sink relationships on N allocation and vegetative storage protein accumulation in Brassica napus L. Plant Sci. 2004, 166, 1007–1018. [Google Scholar] [CrossRef]
  54. Zhao, F.; Evans, E.J.; Bilsborrow, P.E.; Syers, J.K. Influence of sulphur and nitrogen on seed yield and quality of low glucosinolate oilseed rape (Brassica napus L.). J. Sci. Food Agric. 1993, 63, 29–37. [Google Scholar] [CrossRef]
  55. Schnug, E.; Haneklaus, S.; Murphy, D. Impact of sulphur fertilization on fertilizer nitrogen efficiency. Sulphur Agric. 1993, 17, 12. [Google Scholar]
  56. Kopriva, S.; Rennenberg, H. Control of sulphate assimilation and glutathione synthesis: Interaction with N and C metabolism. J. Exp. Bot. 2004, 55, 1831–1842. [Google Scholar] [CrossRef]
  57. Rossato, L.; Lainé, P.; Ourry, A. Nitrogen storage and remobilization in Brassica napus L. during the growth cycle: Nitrogen fluxes within the plant and changes in soluble protein patterns. J. Exp. Bot. 2001, 52, 1655–1663. [Google Scholar] [CrossRef] [PubMed] [Green Version]
  58. Tiancai, G.; Wei, F.; Huijie, Z.; Guodian, X.; Huacen, W.; Yonghua, W.; Zhanjun, Y. Photosynthetic characteristics of flag leaves and nitrogen effects in two winter wheat cultivars with different spike type. Zuo Wu Xue Bao 2004, 30, 115–121. [Google Scholar]
  59. Zhou, W.; Zhao, D.; Lin, X. Effects of waterlogging on nitrogen accumulation and alleviation of waterlogging damage by application of nitrogen fertilizer and mixtalol in winter rape (Brassica napus L.). J. Plant Growth Regul. 1997, 16, 47–53. [Google Scholar] [CrossRef]
  60. Men, S.; Chen, H.; Chen, S.; Zheng, S.; Shen, X.; Wang, C.; Yang, Z.; Liu, D. Effects of supplemental nitrogen application on physiological characteristics, dry matter and nitrogen accumulation of winter rapeseed (Brassica napus L.) under waterlogging stress. Sci. Rep. 2020, 10, 10201. [Google Scholar] [CrossRef] [PubMed]
Figure 1. Effects of nitrogen (N) and sulfur (S) nutrition on B. carinata and B. napus height (A), stem elongation rate (B), mainstem node number (C), node addition rate (D), internode length (E), total leaf area (F), primary branch numbers (G) and secondary branch numbers (H) at 132 days after planting and 94 days after nutrient treatment.
Sustainability 13 07355 g001
Figure 2. Effects of nitrogen (N) and sulfur (S) nutrition on temporal variation of plant height (A,B), meristem node number (C,D), and cumulative leaf abscission (E,F) in B. carinata and B. napus measured at 7 days interval till 132 days after planting and 94 days after nutrient treatment.
Sustainability 13 07355 g002
Figure 3. Leaf level net photosynthesis (A), stomatal conductance (B), transpiration rate (C), internal CO2 concentration (D), electron transport rate (E) and fluorescence (F) of B. carinata and B. napus as a function of nitrogen and sulfur nutrition measured at 90 days after planting and 52 days after nutrient treatment.
Sustainability 13 07355 g003
Figure 4. Light response curve of B. carinata (A) and B. napus (B) as a function of nitrogen and sulfur nutrition measured at 90 days after planting and 52 days after nutrient treatment.
Sustainability 13 07355 g004
Table 1. Effects of nitrogen (N) and sulfur (S) nutrition on B. carinata and B. napus growth and developmental traits at 132 days after planting and 94 days after nutrient treatment along with ANOVA Table. Means of a parameter within a column followed by the same letter were not statistically different (p > 0.05).
SpeciesTreatment *Plant HeightStem Elongation RateMainstem NodesNode Addition RateInternode LengthPrimary BranchesSecondary BranchesTotal Leaf Area
cmcm Day−1No.Node Day−1cm Node−1No.No.cm2 Plant−1
Carinata+N+S110.8 a1.08 a32.3 a0.21 a3.8 a20.3 a57.5 a805.6 c
+N−S110.5 a1.09 a30.8 a0.23 a3.7 a22.8 a44.0 b943.3 c
−N+S116.0 a1.20 a29.8 a0.23 a3.8 a9.3 b16.0 c0 d
−N−S120.0 a1.20 a29.0 a0.25 a3.8 a10.0 b15.0 c0 d
Napus+N+S43.3 bc0.40 bc16.8 c0.09 c2.6 bc11.5 b17.0 c2419.6 a
+N−S36.5 c0.35 c18.8 bc0.10 c2.0 c10.8 b5.5 d1528.7 b
−N+S56.0 b0.56 b23.0 b0.15 b2.5 bc2.3 c0.5 d0 d
−N−S51.3 bc0.50 bc19.8 bc0.12 bc2.7 bc3.0 c0 d29.2 d
ANOVASpecies<0.0001<0.0001<0.0001<0.0001<0.0001<0.0001<0.0001<0.0001
Treatment0.0680.05390.05630.05740.394<0.0001<0.0001<0.0001
Species * Treatment0.63760.87480.37730.31230.5370.1218<0.0001<0.0001
* +N+S denotes optimum NS treatment (100% N and 100% S), −N+S denotes N limited treatment (0% N, 100% S), +N−S denotes S limited treatment (100% N, 0% S), −N−S denotes NS limited treatment (0% N and 0% S).
Table 2. Effects of nitrogen (N) and sulfur (S) nutrition on B. carinata and B. napus biomass production, allocation, and root shoot ratio at 132 days after planting and 94 days after nutrient treatment along with ANOVA Table. Means of a parameter within a column followed by the same letter were not statistically different (p > 0.05).
SpeciesTreatment *Biomass ProductionBiomass AllocationRoot Shoot
Ratio
RootsStemsLeavesReproductiveTotalRootsStemsLeavesReproductive
StructuresStructures
gm Plant−1%
Carinata+N+S14.9 b31.6 a4.2 b53.6 ab104.3 ab14 de31 bc4 d51 a0.17 d
+N−S16.7 ab26.6 b5.9 b48.7 b97.9 b17 cde27 cd6 c50 a0.20 cd
−N+S6.9 c13.9 de-11.8 c32.5 c21 abc42 a-36 b0.27 ab
−N−S7.2 c17.2 cd-13.0 c37.4 c19 bc46 a-35 b0.24 bc
Napus+N+S16.4 ab29.8 ab10.2 a58.7 a115.1 a14 e26 cd9 b51 a0.17 d
+N−S19.4 a20.6 c11.5 a51.3 ab102.9 b19 bc20 d11 a50 a0.23 bc
−N+S6.4 c9.9 e-12.3 c28.6 c22 ab35 b-43 ab0.29 ab
−N−S6.8 c9.0 e-12.0 c27.8 c24 a32 bc-44 ab0.32 a
ANOVASpecies0.3890<0.000100.84910.0830.00010.0830.1190.0815
Treatment<0.0001<0.00010<0.0001<0.00010.0001<0.00010.00010.00140.0002
Species * Treatment0.530110.07560.37390.32920.37390.41330.3249
* +N+S denotes optimum NS treatment (100% N and 100% S), −N+S denotes N limited treatment (0% N, 100% S), +N−S denotes S limited treatment (100% N, 0% S), −N−S denotes NS limited treatment (0% N and 0% S).
Table 3. Nitrogen and sulfur uptake of B. carinata and B. napus roots, stems, leaves, and reproductive structures varied with nutrient availability 132 days after planting and 94 days after nutrient treatment. Whole plant nutrient uptake is the weighted average over all plant parts. Means of a parameter within a column followed by the same letter were not statistically different (p > 0.05).
SpeciesTreatment *Nitrogen UptakeSulfur Uptake
RootsStemsLeavesReproductive StructuresWeighted AverageRootsStemsLeavesReproductive StructuresWeighted Average
gm
Carinata+N+S0.22 a0.36 a0.30 ab3.37 a2.37 ab0.050 a0.11 a0.07 b0.89 a0.62 a
+N−S0.21 a0.33 ab0.26 b1.93 b1.25 c0.022 b0.01 d0.02 cd0.16 c0.10 b
−N+S0.06 b0.08 c0.01 c0.40 c0.29 d0.024 b0.05 c0.01 cd0.14 c0.10 b
−N−S0.06 b0.08 c0.02 c0.38 c0.25 d0.020 b0.04 c0.01 d0.14 c0.08 b
Napus+N+S0.20 a0.34 ab0.35 a3.75 a2.83 a0.046 a0.09 b0.15 a0.72 b0.54 a
+N−S0.19 a0.28 b0.26 b2.39 b1.81 bc0.020 b0.02 d0.02 cd0.17 c0.13 b
−N+S0.06 b0.06 c0.02 c0.36 c0.28 d0.022 b0.03 d0.03 c0.13 c0.09 b
−N−S0.07 b0.04 c0.01 c0.48 c0.40 d0.020 b0.02 d0.01 d0.15 c0.12 b
ANOVASpecies0.53250.09330.38760.20210.0680.351<0.0001<0.00010.1230.8626
Treatment<0.0001<0.0001<0.0001<0.0001<0.0001<0.0001<0.0001<0.0001<0.0001<0.0001
Species * Treatment0.86450.91670.65510.68130.53390.95430.0466<0.00010.03480.3865
* +N+S denotes optimum NS treatment (100% N and 100% S), −N+S denotes N limited treatment (0% N, 100% S), +N−S denotes S limited treatment (100% N, 0% S), −N−S denotes NS limited treatment (0% N and 0% S).
Table 4. Pigment concentration and SPAD measurements of B. carinata and B. napus as a function of nitrogen and sulfur nutrition at 132 days after planting and 94 days after nutrient treatment along with ANOVA Table. Means of a parameter within a column followed by the same letter were not statistically different (p > 0.05).
SpeciesTreatment *ChlaChlbChla + bCarotenoidsSPAD
µg cm−2
Carinata+N+S18.5 a3.7 a22.4 a5.1 a47.7 b
+N−S17.0 a3.3 ab20.5 a4.3 b50.5 b
−N+S10.7 c1.7 d13.2 c3.3 d41.3 cd
−N−S11.6 c2.7 bc14.5 bc3.7 d38.2 e
Napus+N+S18.6 a3.4 ab22.2 a4.6 b55.0 a
+N−S17.9 a3.3 ab21.4 a4.2 bc57.6 a
−N+S13.9 b2.3 c16.4 b3.4 d43.6 c
−N−S13.6 b2.2 c16.0 b3.5 d39.9 de
ANOVASpecies0.00280.90170.01790.1207<0.0001
Treatment<0.0001<0.0001<0.0001<0.0001<0.0001
Species * Treatment0.10870.17320.20170.42880.0105
* +N+S denotes optimum NS treatment (100% N and 100% S), −N+S denotes N limited treatment (0% N, 100% S), +N−S denotes S limited treatment (100% N, 0% S), −N−S denotes NS limited treatment (0% N and 0% S).
Table 5. Correlation analysis between different vegetative, pigments, and photosynthesis related traits.
Plant HeightNode NumberBiomassNitrogenSulfurChlaChlbCarotenoidsSPADPhotosynthesisChlorophyll
Fluorescence
Plant height-
Node number0.89-
Biomass−0.15−0.21-
Nitrogen−0.2−0.290.9-
Sulfur−0.26−0.370.850.87-
Chla−0.33−0.350.820.850.85-
Chlb−0.14−0.170.710.740.70.78-
Carotenoids0.03−0.060.770.810.80.870.82-
SPAD−0.45−0.490.780.880.760.790.620.59-
Photosynthesis−0.34−0.360.810.820.810.720.510.630.78-
Chlorophyll
Fluorescence
−0.36−0.410.760.810.70.740.490.560.830.91-
- denotes correlation between same traits. Highlighted numbers show significant interactions (r > 0.8, p < 0.001).
Publisher’s Note: MDPI stays neutral with regard to jurisdictional claims in published maps and institutional affiliations.

