Article

Agriculture Adaptation Options for Flood Impacts under Climate Change—A Simulation Analysis in the Dajia River Basin

National Science and Technology Center for Disaster Reduction, New Taipei City 23143, Taiwan
*
Author to whom correspondence should be addressed.
Sustainability 2021, 13(13), 7311; https://doi.org/10.3390/su13137311
Submission received: 7 May 2021 / Revised: 9 June 2021 / Accepted: 24 June 2021 / Published: 30 June 2021
(This article belongs to the Special Issue Climate Change Impacts on Hydrology, Water Quality and Ecology)

Abstract

:
Adaptation to climate change has become an important matter of discussion in the world in response to the growing rate of global warming. In recent years, many countries have gradually adopted adaption strategies to climate change, with the aim of reducing the impact of climate variabilities. Taiwan is in a geographical location that is prone to natural disasters and is thus very vulnerable to climate change. To explore an appropriate method for Taiwan to adapt to climate change, this study took Dajia River Basin as the simulation site to explore the potential climate change impact in the area. An impact study was conducted to identify the trend of flooding under climate change scenarios. We used the SOBEK model to simulate downstream inundation caused by the worst typhoon event of the 20th century (1979–2003) and for typhoon events that might occur at the end of the 21st century (2075–2099) in Taiwan, according to the climate change scenario of representative concentration pathways 8.5 (RCP8.5) and dynamical downscaling rainfall data. Agricultural lands were found to be the most affected areas among all land types, and the flooded area was forecast to increase by 1.89 times by the end of 21st century, when compared to the end of 20th century. In this study, upland crops, which are affected the most by flooding, were selected as the adaptation targets for this site and multiple engineering and non-engineering options were presented to reduce the potential climate change impacts. With respect to the results, we found that all adaptation options, even when considering the cost, yield higher benefits than the “do-nothing” option. Among the adaptation options presented for this site, utilizing engineering methods with non-engineering methods show the best result in effectively reducing the impact of climate change, with the benefit-to-cost ratio being around 1.16. This study attempts to explore useful and effective assessment methods for providing sound scientific and economic evidence for the selection of adequate adaption options for flood impacts in agriculture in the planning phase.

1. Introduction

In recent years, climate change has had increasingly noticeable impacts upon human society, and significantly affected livelihoods and the environment across the globe. Many countries have begun to funnel resources into developing strategies and actions in the hope of strengthening their resilience when responding to the growing climate change challenges.
The global effort to combat climate change has produced a boost in adaptation efforts since the establishment of the Cancun Adaptation Framework (CAF) at COP16, where the Adaptation Committee was officially formed. Of specific interest is the National Adaptation Plan (NAP) process, which was proposed to benefit the least developed countries (LCDs) for which other interested parties would critically identify their adaptation needs. To date, a total of 17 developing countries have submitted NAPs to UNFCCC [1], out of which 4 are LCD countries identified by the UNCTAD [2]. Although national conditions vary among countries of different economic scales and levels of development progress, these NAP documents commonly suggest that climate-induced flooding is one of the most serious and anticipated types of disaster requiring urgent adaptation efforts [3]. In the European region, 3% of the registered events caused more than 70% of economic losses, while more than 1/3 of the climate-related disasters are hydrological events such as floods [4]. The adaptation needs and preparations for flood hazards have shown a growing importance in the fight against climate change.
Not being different from the rest of the world, Taiwan has in recent years experienced substantial change in temperature and rainfall patterns as a consequence of climate change. Floods resulting from typhoons and intense rainstorms have had a severe impact on the safety and livelihoods of civilians. According to the latest record compiled by the National Science and Technology Center for Disaster Reduction (NCDR), the most recent intense rainstorm that occurred during 15–20 May 2019 caused flooding in 331 places in Taiwan, causing $2.96 million USD in economic damage and losses. The worst typhoon disaster event caused by Typhoon Morakot on 6 August 2009 resulted in 700 casualties and more than $647 million USD of agricultural damage and losses in the affected region [5]. Taiwan also expects to experience longer periods of rainfall with high precipitation under climate change scenarios [6]. According to the study [7], under the influence of climate change, the inundation area for the same Morakot-level typhoon event, will increase as much as 10.4%.
Agricultural adaptation is an important issue, but effective adaptation is even more important. Experience of extreme and projected flood hazards present a pressing need to develop proportional adaptation strategies. The assessment of future climate risks and flood impacts under climate change scenarios are therefore the core steps for evaluation prior to the actual adaptation actions. Adequate analysis of adaptation options can contribute effectively in providing scientific support and sound evidence to ensure that effective and cost-beneficial disaster reduction and adaption efforts are developed under climate change situations. Based on the scientific data, this study quantifies actual agricultural impacts and develops optimal options through cost-benefit analysis. The structure and results of this research can be applied in practice to other regions.

2. Study Area

The Dajia River is located in western Taiwan. While the Dajia River flows through the Yilan and Nantou Counties, its watershed is mainly located in Taichung City, which is one of the main municipalities in Taiwan. The main stream originates from the east peak of Nanhu Lake region, which is at an altitude of 3632m. Its rich water resources are often used for power generation and agricultural production. The Dajia River catchment covers an area of about 3157 km2 which is mainly made up of forest lands; about 61.52% of the entire basin is covered in forest. Agricultural land is located in the middle and downstream basin, accounting for about 20.32% of the entire basin (shown in Figure 1). The main crops cultivated are rice, along with other crops such as fruits, sweet potato, taro, and watermelon.
In 2009, Typhoon Morakot caused serious agricultural damage and losses within the local watershed. There was a total of 18 types of agricultural crop losses reported. Fruit drops occurred for pears in the Heping District of the Dajia River Basin across a large area. The estimated affected area was 450 hectares, and the loss accumulated to more than $2.3 million USD. In the downstream area, taro production was damaged by large-scale flooding, with the total estimated affected area being over 240 hectares.

3. Data and Method

3.1. Frameworks for Climate Change Impact, Adaptation, and Vulnerability Assessments

The assessment of future climate risks, impacts, and adaptation research are groundwork actions necessary for the success of adaption projects. They serve the function of informing and preparing stakeholders for action without constituting any actual modifications and changes in policy, programs, or action deliveries [8]. The characteristics of existing approaches to conducting climate change impact, adaptation, and vulnerability assessments described in the literature are presented in Table 1. Each approach represents a justifiable perspective for analysis in the climate change spectrum with different evaluation criteria and applicable scales. The impact assessment follows two types of logic: top-down and bottom-up. The classic “top-down” logic is mostly represented in the climate scenario-driven approach, where it usually involves the downscaling of global climate models to the local level before progressing to socioeconomic impact assessments [9]. Studies in Taiwan often utilize this “top-down” climate-scenario approach [10,11] due to the geographic fine scale that is required to reflect the climate variation and characteristics of different terrains. In this study, since we restricted the simulation site to the Dajia River Basin in Taiwan, the “top-down” climate-scenario also became the best method to address the needs of the study.
It is worth noting that the type of assessment approach and its analytical logic may also create variations in the composition of indicators selected within the assessment. No universal assessment method, nor a handful of “appropriate” indicators could cover all of the basic scales and target groups. For example, an assessment of the impact of floods under climate change scenarios may solely consider some primary indicators along with other direct socio-human factors [14]. On a national scale, even if the study only targets flood hazards, the integration of socioeconomic and climate change scenarios concerning multiple indicators from various sectors such as water, forestry, coastal zones, agriculture, health, and energy is also necessary [15].

3.2. Climate Change Scenarios Data

After we properly identified the assessment approach, we selected adequate climate change data to create future projections. In climate change studies, the global General Circulation Model (GCM) is one of the most advanced tools for simulating responses to climate systems under different levels of greenhouse gas concentrations. However, the GCM model outputs are too coarse in the context of Taiwan, where the total land area is only around 32,000 km2. Utilizing downscaling techniques to increase data resolutions has become necessary for climate change studies in Taiwan.
Therefore, the climate data used in this study were AR5 climate data with a spatial resolution of 5 km based on the dynamic downscaling data (MRI-WRF) produced by Japan’s Meteorological Department [16]. This set of data produces good simulation results for the numbers and location of typhoons, typhoon tracks, typhoon center-pressure-intensity, and precipitation intensity [17]. The impact assessment involves flood simulation analysis of future extreme typhoons using the largest rainfall events in the late 20th (1979–2003) and 21st (2075–2099) centuries to gain a better understanding of extreme flood impacts.

3.3. Flood Simulation Method

The SOBEK model (developed by the WL|Delft Hydraulics Company of Delft City in the Netherlands was further used in this study for flood simulations under climate change scenarios [18]. The model includes calculation modules such as rainfall runoff, canal flow, and flood overflow. The Dajia River Basin module was provided by the Water Conservancy Department of the Ministry of Economic Affairs with a spatial resolution of 40 m × 40 m. The SOBEK model integrates commercial hydrologic and hydrodynamic programs of urban drainage systems along with river and regional drainage data. This model contains three subtypes: rural, urban, and river, and includes control factors such as rainfall runoff (RR), channel flow (CF), sewer flow, overland flow (OF), water quality, river flow, emissions, and real-time control.
River flood routing is based on the dynamic wave transfer theory for 1D varied flow; that is, it incorporates de Saint-Venant’s gradually varied flow equation for describing water flow in rivers. This module can be set to simulate river bridges, reservoirs, and river crossing structures on channels such as weirs, culverts, orifices, and pump stations. Equations of continuity (1) and motion (2) were considered for flood routing on the basis of de Saint-Venant’s 1D gradually varied flow equation, which is the dynamic wave model:
A f t + Q x = q l a t
Q t + x ( Q 2 A f ) + g A f h x + g Q | Q | C 2 R A f B τ w ρ = 0
where Q is the discharge (m3/s), g denotes acceleration caused by gravity (m/s2), h is the water depth (m), t denotes time (s), x refers to distance (m), R is the hydraulic radius (m), qlat is the lateral discharge per unit length (m3/s), Af is the flooded area (m2), B is the flow width (m), C is Chezy’s coefficient, τw is the wind shear stress (N/m2), and ρw is the density of water (kg/m3).
The OF (2D) module of SOBEK-Rural is designed to calculate 2D flooding scenarios. The module is fully integrated with the 1DFLOW module for accurate flooding simulation. Surface rainfall is used to produce OF and thereby calculate outside channels. Equations of continuity (3) and motion (4), (5) were considered for flood routing on the basis of a 2D dynamic wave formula:
h t + ( u d ) x + ( v d ) y = 0
u t + u u x + v v y + g h x + g u | V | C 2 d + a u | u | = 0
v t + u v x + v v y + g h y + g v | V | C 2 d + a v | v | = 0
where u is x direction average flow (m/s), v is y direction average flow (m/s), V denotes velocity u 2 + v 2 (m/s), d is the surface depth (m), g denotes acceleration caused by gravity (m/s2), h is the surface water depth h = d + z (m), a is the coefficient of friction, and C is Chezy’s coefficient.
This study evaluated the inundation scenario of our study area by calculating the combined 1D CF module and 2D OF module of SOBEK.

3.4. Method of Impact Assessment

Based on the above flood simulation results, Taiwan Typhoon-flood Loss Assessment System (TLAS) [19] was applied to assess the direct economic losses of various lands under different flooding scales. TLAS is a regression loss model established by NCDR in Taiwan based on the disaster loss investigation data of typhoon-related flood disasters that have occurred in recent years. The statistical data of losses incurred in disasters, from the year 2005 until the present day, are calculated by ministries in Taiwan and thus were incorporated into this model. Factors such as the affected population, land loss, housing loss, loss of agriculture, forestry, fishery and animal husbandry, etc. were also integrated into the model. The land-use layer utilized for loss calculation was based on the survey map released by the Land Survey and Mapping Center. The resolution of land use area of each classification varies according to the attributes of different land uses, residential areas show a high resolution for a single resident home (about 5 m × 5 m). Since agricultural land is the main target affected in the downstream area of the Daija River Basin, the loss assessment of this study mainly focused on agricultural land. The formula of agriculture loss is shown as Table 2.

3.5. Existing Methods for Assessing the Costs and Benefits of Adaptation Options

Apart from the loss calculation models, we also identified the core principles in evaluating the adequacy of different adaptation options. In general, the Second Assessment Report of IPCC Working Group II mentioned around 228 different adaptation measures [20]. They can mainly be categorized according to structural/physical, social, and institutional measures [21]. Measures such as engineering, environmental construction, and technology measures are listed under the structural/physical category, but can also be implemented jointly with social and institutional measures such as regulations, education, and government programs.
Adaptation actions require resources in the stages of planning, designing, facilitating, and implementing. Unfortunately, evidence has shown that the changing climate is impacting the most vulnerable and poorest countries and communities within the developing world, which lack the resources, institutions, and technical capacity needed to facilitate efficient recovery from disasters [22]. Proper assessment of the costs and benefits of adaptation options would then allow policy-makers to make informed decisions on building resilience in relation to climate change and future development plans, and on an affordable and reasonable scale. The three most commonly used techniques: cost-benefit analysis (CBA), cost-effectiveness analysis (CEA), and multi-criteria analysis (MCA) are listed below in Table 3.
Limitations of knowledge and data exist in the aforementioned methods, therefore the assessments of adaptation may still produce difficulties when identifying the optimal option. In Taiwan, cost-and-benefit assessment tools for adaption options are shown to be lacking [24]. Only a handful of studies are available for comparing adaption options, with the majority of them using the CBA method [25,26]. In this study, the CEA method was not deemed appropriate because the preconditions of adaptation goals were not specified. In attempting to maintain our focus on the net benefit of different adaptation options, and after considering direct costs and benefits of each selected adaptation action, the CBA method was thus adopted.

4. Results and Discussion

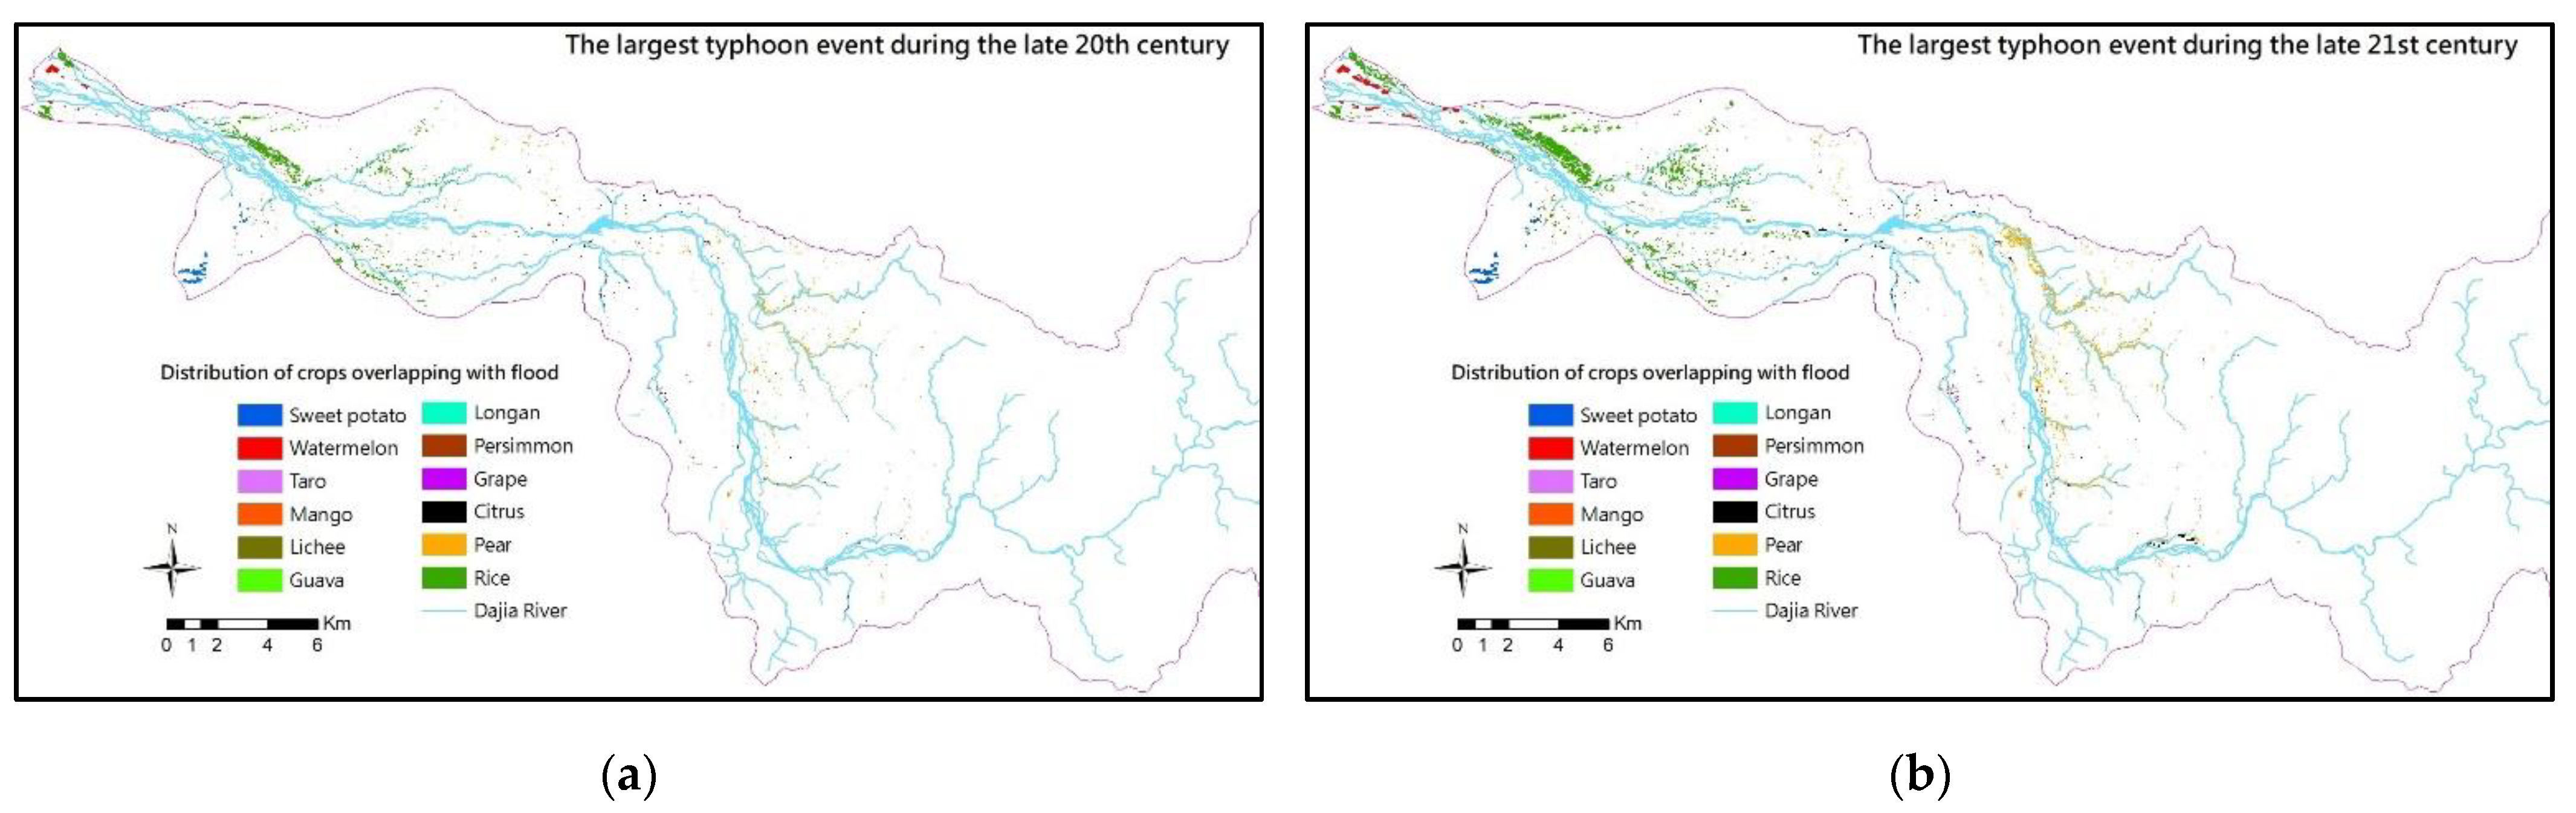
4.1. Simulation Results on Flooding in Downstream Dajia River Basin under Climate Change Scenarios

Prior to the identification of adaptation methods, we first looked at crop-specific losses for affected farmlands. According to flood simulations of the most extreme typhoon events, the total flooded area of agricultural lands will increase by 1.89 times by the end of the 21st century, when compared to the 20th century (shown in Figure 2 and Table 4). Rice production will suffer the most due to this increase in typhoon-related flood events. Fruit trees such as pears and citrus will also be significantly impacted through an increase of flooded areas. Sweet potato, watermelon, and taro that are considered as upland crops and vegetables would experience a noticeable increase in flood impacts as well. Compared to upland crops, rice and fruit trees have higher tolerance towards flooding, as an overflow of water often does not affect them unless the flood occurs during their mature period. Upland crops, however, regardless of the growth stage, will suffer losses as long as they are submerged under water. Watermelon, sweet potato, and taro are the three types of upland crops that are the most vulnerable, followed by rice and fruit trees. Therefore, this study considered upland crops and vegetables, such as sweet potatoes, watermelons, and taro, as the main agricultural adaptation targets.

4.2. Identification of Flood Disaster Adaption Methods for Agricultural Farmland

The adaptation methods were then assessed in relation to agricultural production types in order to identify the largest benefit of reducing flood-related impacts and agricultural damage and losses. The adaption benefit in this study refers to the difference between the economic loss in production of the agricultural product when adaption action “does” and “does not” present. For example, when an adaption option is selected and implemented, if the area then suffered less losses than after not utilizing any adaption strategy at all, then the adaptation action appears to have a positive benefit.
Engineering and non-engineering options such as improving farmland drainage, heightening farmland ridges, laying fallow farmland, and shifting to other kinds of crops were identified in this study. Table 5 lists the suitable methods and corresponding benefits for each agricultural plant.
Generally speaking, adaptation actions may receive less resistance from stakeholders when the methods are cheap to implement, economically sound, and require as little change as possible to the original farming pattern. Among the six methods identified in Table 6, heightening of farmland ridges, adjustment of agricultural production period or changing crops, and fallowing are the three most inexpensive methods that could be used in the Dajia River Basin. Fallowing, however, requires the farmers to stop agricultural plantation in their fields for a period of time. As this suggests a direct reduction in income for the stakeholders when a subsidy program is not in operation, fallowing is rarely favored by farmers. This study thus utilized the heightening of farmland ridges (an engineering method) and changing crops (a non-engineering method) as the two possible actions for evaluating the adaptation benefits to the existing upland farming system in the Dajia River Basin.

4.3. Assessment of Adaptation Options: Engineering Method

Generally speaking, the initial adaptation principle is to carry out reasonable adaptation actions without changing the original farming project. This is also a method that is more acceptable to stakeholders. The customary adjustment methods commonly used in the past are feasible engineering methods, among which heightening farmland ridges is the easiest engineering method to operate. This study carried out possible engineering actions to evaluate the adaptation benefits to the upland farming system.
Heightening of ridges is done through increasing the ridge by 25 cm on average and digging down 25 cm into the furrows (as shown in Figure 3). The differences in the flooded area before and after the adaption action for the largest event in the 21st century is shown in Table 6. Based on the flood simulation of this adaptation option, we found that heightening farmland ridges appears to make quite a difference for sweet potato, as the reduction ratio of the flooded area reached more than 25% due to climate change impacts (21st-TOP1 scenario). For watermelon and taro, the flooded area decreased by 11.6 to 14.3%.
According to the statistical annual report of the Council of Agriculture [27], the cost is $367 USD per hectare. The total cost of the action for individual crops is listed in preliminary CBA analysis in Table 7. Globally, the entire cost of the adaptation is $72,760 USD (summation of column C) while the total benefit of such an action is $362,279 USD (column F).
As shown in Table 6 and Table 7, this engineering adaptation method does have a positive effect and suggests a positive net economic benefit of $289,519 USD. However, according to the results in Table 7, regardless of the crop, more than 75% of the affected agricultural land would still be flooded, even after the adaptation technique is applied. This result highlights the limitations of an engineering adaptation method. While it is the easiest method to operate, it can only alleviate a small portion of the impact that climate change brings to this study site. This also means other non-engineering methods should be added to the mix to further reduce the residual loss for upland crops caused by climate change.

4.4. Assessment of Adaptation Options: Engineering plus Non-Engineering Method

According to the options in Table 5, suitable non-engineering methods include adjustment of agricultural production periods or changing cropping patterns, fallowing, or creating protected areas. Therefore, for this study, we chose to combine the non-engineering adaptation method of adjusting the agricultural production period or changing the cropping pattern with the existing engineering methods to reduce the climate change induced risks for upland crops.
Since upland crops and vegetables are susceptible to flooding, an ideal alternative would be replacing the three flood-sensitive crops that we identified with flood-tolerant plants that are suitable for local cultivation. In Table 4, we list the crops that are already planted in the local area, showing that the success rate of crop changing is higher, and the adaptability is also better. Among them, rice and fruit trees (guava) that have higher tolerance to flooding could definitely be considered as alternative cultivation options to the current upland crops and vegetables.
Table 8 lists the six potential actions that could be implemented in this study when considering the different combinations of engineering and non-engineering methods. Option 1 is the baseline, which is the do-nothing scenario. Option 2 involves conducting the engineering approach of heightening the farmland. Options 2–4 involve utilizing the engineering or/and non-engineering method, while options 5–6 combine the two to see how the residual losses can be minimized when both methods are applied to the site. In options 5 and 6, the first step is to use engineering method (heightening farmland) to adapt before the flood event, because it has the lowest operating cost. The second step is to use a non-engineering method (changing crops) to adapt the remaining losses that cannot be handled by engineering methods.
We further looked into the public information from the Council of Agriculture (Executive Yuan) and found that the costs and benefits per hectare of rice farming are $4042 and $4817 USD per hectare, respectively; the cost for guava is $22,115 USD per hectare, while the benefits can reach $31,594 USD per hectare. The preliminary cost and benefit of adaptation actions from option 2 to option 6 can therefore be calculated based on the same calculations done in Table 7.
However, as the largest scenario that we provided in Table 6 was the worst flood event at the end of last century, the return period for such an event is more than 200-years and the probability of occurrence is less than 0.005. We therefore assumed that, with the worst flood event (>200-year flood) creating an economic impact of 1, 100-to-200-year floods (the probability of occurrence is 0.005) would result in 1/2 the amount of damage, and events that are below 100-year floods (the probability of occurrence is 0.99) may create 1/4 of the damage. These probabilities were then addressed in the calculations when carrying out the final cost and benefit analysis.
The benefits of the project usually bring more than a one-time benefit. When the flood tolerance level of an area is higher than the rainfall received, then the project would successfully yield a positive benefit. On the other hand, if rainfall is greater than the protection level of the project, there could be a loss rather than a benefit. Such benefits and losses may persist over time. Therefore, for the final calculations of the CBA, we utilized the following formulas:
E x p e c t e d   a n n u a l   b e n e f i t = t > n X t [ p ( x t ) ]   t = n , n + 1 , .
N P V = t = t 0 t e [ ( B t C t ) / ( 1 + r ) t ] .
In Formula (6), we multiplied the preliminary benefit/loss value in relation to various rainfall occurrences by the probability factor, where p(Xt) is the probability of a certain precipitation event, which is in a probability distribution function, Xt is the annual benefit of each option for a different return period, t is the return period, and n is the designed capacity of individual flood protection we then attempted to find the net present value (NPV) for different adaptation options using Formula (7), where B represents benefits, C represents costs of project of year t, r defines the social discount rate, and t is the project’s ending year. For the purpose of calculation, we considered all projects to have a 30-year return period with a discount rate of 6%.
Results are presented in Table 9 and Figure 4, where column A in Table 9 is the total loss of the three crops of sweet potatoes, watermelons, and taro under the baseline scenario. Column D is the net benefit of each adaptation method and the last column (E) shows the residual loss that refers to the remaining loss after the adaptation action has been implemented.
From Figure 4, it is quite evident that the residual losses after applying engineering and non-engineering methods are smaller than for the “do-nothing” approach and can reduce the impacts of climate change. However, if we look at cost (the orange line) and the net benefit (blue line) among the different options, all the adaptation actions yield a positive net benefit over a 30-year period. It is also worth noting that options 4 and 6 are the ones that yield negative values in residual losses (column E). These negative values mean the results of the adaptation methods not only indicate the avoidance of the original crop losses due to flooding, but they also create more benefits than was previously possible. Both of these options are related to the conversion of crops from upland agriculture to flood-tolerant fruit trees (guava). Looking at the residual loss alone, option 4 does seem to provide the best way to create the highest net benefit. However, the cost of this option is not only the highest among all the options, but it also exceeds the original total loss experienced by the affected areas due to climate change impacts. Therefore, compared to option 4, option 6 would serve as a better adaptation solution to the problem on account of the fact that the cost of implementation is more reasonable and produces a relatively high return. As shown in Table 9, the benefits presented in option 6 are $9,681,349 USD (column C), which is 1.48 times the original total loss (column A). This result suggests that the traditional engineering methods certainly have some level of effect in reducing climate change impacts for the study area, but appropriate non-engineering methods could be added as complementary actions to further improve the results of adaptation actions.

5. Conclusions

In this study of the Dajia River Basin, it is apparent that adaption efforts need to focus on flood impacts upon agricultural land. This is true in many parts of the world where adaptation for the agricultural sector is often prioritized due to its vulnerable nature and adverse implications where chain reactions may follow if the industry fails to perform. This study aims to demonstrate an effective assessment method in identifying agricultural adaption for flood disaster by providing the best available evidence when making relevant policy decisions and in the adaptation planning process. Detailed assessments such as this one would also assist in closing the adaptation assessment gaps in Taiwan and throughout the world.
Flood simulations showed that in this study site, the flooded agricultural lands will increase by 1.89 times by the end of 21st century, when compared to the end of the 20th century. With upland crops being the most vulnerable to flooding, six adaptation options are identified in this study (including a “do-nothing” approach), and it was found that all methods are better than the “do-nothing” approach, as all options showed a decent reduction of agricultural losses. Engineering methods such as heightening farmland ridges is a relatively simple option to implement and will yield reasonable benefits over time. However, complications exist concerning the crop-changing method. Alternative crops to the existing ones should not be randomly chosen or simply selected for their market value. The alternative crops must suit the local environment and climate conditions. This means that plantations will more likely be successful if alternative crops are selected from crops that have been planted in the local area. Also, since the market value of different crops varies, the switch from a low value crop to a higher value crop (from watermelon, sweet potato, or taro to guava, as shown in this study) will result in significant net benefits for the adaptation project. However, it is important to note that the efficacy of adaptation options is also based upon the availability of resources. Sometimes, even though one option may yield the best benefit, stakeholders might not be able to carry out such an action in practice. This is especially true when monetary support is not in place (option 4 compared to option 6 in this study provides the perfect example of this issue).
Although the simulation analysis that this study presents has offered a gateway to evaluating potential adaptation actions under climate change, it is still important to note that adaptation is highly context-specific in nature. This means solutions from these assessments can never be thought to completely address the climate issue or alleviate the impacts entirely, meaning flexibility in adaptation measures is still necessary so that adaptation options can be customized according to changing circumstances to yield maximum benefits.

Author Contributions

Conceptualization, H.-C.L., Y.-H.H. and C.-W.C.; methodology, H.-C.L., Y.-H.H. and C.-W.C.; software, H.-C.L., Y.-H.H.; validation, H.-C.L., Y.-H.H. and C.-W.C.; formal analysis, H.-C.L., Y.-H.H. and C.-W.C.; investigation, H.-C.L., Y.-H.H. and C.-W.C.; resources, H.-C.L., Y.-H.H. and C.-W.C.; data curation, H.-C.L., Y.-H.H. and C.-W.C.; writing—original draft preparation, H.-C.L., Y.-H.H. and C.-W.C.; writing—review and editing, H.-C.L., C.-W.C. and Y.-H.H.; visualization, H.-C.L., Y.-H.H.; supervision, H.-C.L., Y.-M.C. and L.-Y.L.; project administration, Y.-M.C. and L.-Y.L.; funding acquisition, Y.-M.C. and L.-Y.L. All authors have read and agreed to the published version of the manuscript.

Funding

This research was funded by Ministry of Science and Technology of Taiwan (MOST, Taiwan) through Taiwan Climate Change Projection Information and Adaptation Knowledge Platform (TCCIP) project (TCCIP; MOST106-2621-M-865-001).

Institutional Review Board Statement

Not applicable.

Informed Consent Statement

Not applicable.

Data Availability Statement

The AR5 downscaling datasets utilized in this research can be found at the TCCIP platform: https://tccip.ncdr.nat.gov.tw/ds_03_mall.aspx, accessed on 7 May 2021.

Acknowledgments

We appreciate the support and assistance provided by members from the Taiwan Climate Change Projection Information and Adaptation Knowledge Platform project throughout our time in working on this research.

Conflicts of Interest

The authors declare no conflict of interest.

References

  1. United Nations Framework Convention on Climate Change (UNFCCC) Homepage. Available online: https://unfccc.int/topics/resilience/workstreams/national-adaptation-plans/overview (accessed on 3 January 2020).
  2. United Nations Conference on Trade and Development (UNCTAD). The Least Developed Countries Report 2019; United Nations Publication: New York, NY, USA, 2019; Chapter 1; p. 12. ISBN 978-92-1-112960-1. [Google Scholar]
  3. United Nations Framework Convention on Climate Change (UNFCCC). NAP Central. Available online: https://www4.unfccc.int/sites/NAPC/Pages/national-adaptation-plans.aspx (accessed on 3 January 2020).
  4. European Environment Agency (EEA). Green Infrastructure and Flood Management: Promoting Cost-Efficient Flood Risk Reduction via Green Infrastructure Solutions; Publication office of the European Union: Luxembourg, 2019; Chapter 2; pp. 24–27. ISBN 978-92-9213-894-3. [Google Scholar]
  5. National Science and Technology Center for Disaster Reduction. Global Disaster Event Portal. Available online: https://den.ncdr.nat.gov.tw/ (accessed on 27 December 2019). (In Chinese)
  6. National Science & Technology Center for Disaster Reduction (NCDR); Academia Sinica. The Past and Future of the Climate in Taiwan: An Executive Summary for the Scientific Report on Climate Change for Taiwan; NCDR: Taiwan, 2017; p. 17. (In Chinese) [Google Scholar]
  7. Li, H.-C.; Hsieh, L.-S.; Chen, L.-K.; Lin, L.-Y.; Li, W.-S. Disaster Investigation and Analysis of Typhoon Morakot. J. Chin. Inst. Eng. 2014, 37, 558–569. [Google Scholar] [CrossRef]
  8. Lesnikowski, A.C.; Ford, J.D.; Berrang-Ford, L.; Barrera, M.; Berry, P.; Henderson, J.; Heymann, S.J. National-level factors affecting planned, public adaptation to health impacts of climate change. Glob. Environ. Chang. 2013, 23, 1153–1163. [Google Scholar] [CrossRef]
  9. Intergovernmental Panel on Climate Change (IPCC). AR4 Climate Change: Impacts, Adaptation and Vulnerability; Cambridge University Press: Cambridge, UK, 2007; Chapter 2; pp. 136–139. [Google Scholar]
  10. Chu, T.Y.; Lee, J.L.; Huang, W.C. Impact of Climate Change on Shihmen Reservoir Water Supply. J. Mar. Sci. Technol. 2016, 24, 1093–1104. [Google Scholar]
  11. Lee, J.L.; Huang, W.C. Climate change impact assessment on Zhoshui River water supply in Taiwan. Terr. Atmos. Ocean. Sci. 2017, 28, 463–478. [Google Scholar] [CrossRef] [Green Version]
  12. United Nation Development Program (UNDP). Adaptation Policy Frameworks for Climate Change: Developing Strategies, Policies and Measures; Cambridge University Press: New York City, NY, USA, 2004; pp. 1–3. ISBN 0-521-61760-X. [Google Scholar]
  13. Smit, B.; Wandel, J. Adaptation, adaptive capacity and vulnerability. Glob. Environ. Chang. 2006, 16, 282–292. [Google Scholar] [CrossRef]
  14. Van Ackere, S.; Beullens, J.; Vanneuville, W.; De Wulf, A.; De Maeyer, P. FLIAT, an Object-Relational GIS Tool for Flood Impact Assessment in Flanders, Belgium. Water 2019, 11, 711. [Google Scholar] [CrossRef] [Green Version]
  15. United Nation Environment Program (UNEP); Vrije Universiteit. Handbook on Methods for Climate Change Impact Assessment and Adaptation Strategies; UNEP: Nairobi, Kenya, 1998; Chapter 5; pp. 10–12. [Google Scholar]
  16. Mizuta, R.; Yoshimura, H.; Murakami, H.; Matsueda, M.; Hirokazu, E.; Ose, O.; Kamiguchi, K.; Hosaka, M.; Sugi, M.; Yukimoto, S.; et al. Climate simulations using MRI-AGCM3.2 with 20-km grid. J. Meteor. Soc. Jpn. Ser. II 2012, 90A, 233–258. [Google Scholar] [CrossRef] [Green Version]
  17. Su, Y.-F.; Cheng, C.-T.; Liou, J.-J.; Chen, Y.-M. Bias correction of MRI-WRF dynamic downscaling datasets. Terr. Atmos. Ocean. Sci. 2016, 27, 649–657. [Google Scholar] [CrossRef] [Green Version]
  18. Hydraulics, W.L. SOBEK Software User’s Manual; Deltares: Delft, The Netherlands, 2006. [Google Scholar]
  19. Li, H.-C.; Chen, Y.-C.; Guo, M.J. The development and application of Taiwan typhoon loss assessment system (TLAS). J. Taiwan Agric. Eng. 2013, 59, 42–55. (In Chinese) [Google Scholar]
  20. Grover, V. Climate Change: Five Years after Kyoto; Grover, V., On, H., Eds.; CRC Press: Boca Ranton, FL, USA, 2004; p. 233. [Google Scholar]
  21. Intergovernmental Panel on Climate Change (IPCC). AR5 Climate Change 2014: Impacts, Adaptation, and Vulnerability, Part. A: Global and Sectoral Aspects; Cambridge University Press: Cambridge, UK, 2014; p. 27. [Google Scholar]
  22. Biagini, B.; Bierbaum, R.; Stults, M.; Dobardzic, S.; McNeeley, S. A typology of adaptation actions: A global look at climate adaptation actions financed through the Global Environment Facility. Glob. Environ. Chang. 2014, 25, 97–108. [Google Scholar] [CrossRef] [Green Version]
  23. United Nations Framework Convention on Climate Change (UNFCCC). Assessing the Costs and Benefits of Adaptation Options; United Nations Climate Change Secretariat: Bonn, Germany, 2011; pp. 12–29. ISBN 92-9219-085-7. [Google Scholar]
  24. Lee, S.-C.; Chu, P.-Y.; Tseng, P.-J.; Jen, Y.-T.; Dai, T.-C.; Wu, C.-R. Research of Climate Change Adaptation Action Plan of Railway and Highway Systems. Transp. Plan. J. 2018, 47, 245–270. (In Chinese) [Google Scholar]
  25. Water Resource Bureau. Research on Adaptation Indicators for Water Resources in High-Risk Areas in Taiwan; Water Resource Bureau: Taiwan, China, 2016. (In Chinese) [Google Scholar]
  26. Li, H.-C.; Kuo, S.-Y.; Chen, W.-B.; Lin, L.-Y. Benefit analysis of flood adaptation under climate change scenario. Nat. Hazards 2019, 95, 547–568. [Google Scholar] [CrossRef]
  27. Council of Agriculture. The Online Statistical Annual Report of Agriculture. 2019. Available online: https://agrcost.afa.gov.tw/pagepub/AppInquiryPage.aspx (accessed on 12 October 2020).
Figure 1. The land usage distribution of the Dajia River Basin.
Sustainability 13 07311 g001
Figure 2. Dajia River downstream flood distribution of 12 agricultural crops. (a) Largest typhoon event in the late-20th century; (b) Largest typhoon event in the late-21st century.
Sustainability 13 07311 g002
Figure 3. Engineering method: Increasing the height of the ridges.
Sustainability 13 07311 g003
Figure 4. Net benefit and residual loss analysis.
Sustainability 13 07311 g004
Table 1. Characteristics of various types of climate change impact, adaptation, and vulnerability assessments [9,12,13].
ApproachesConcept of EvaluationFocus
Natural hazard-basedClimate Scenario-drivenProvide fixed hazard level and assess by seeing how hazards change under climate change scenarios and how they affect different vulnerabilities.
Vulnerability-basedCriteria boundedSet criteria based on the level of harm to the system then link the criteria to a specific frequency, magnitude, and/or combination of climate events.
Adaptation basedAdaptive capacityExamine the adaptive capacity and adaptation measures required to improve the resilience or robustness of a system exposed to climate change.
IntegratedMultidisciplinePerform integrated assessment modeling and other procedures to investigate impacts across disciplines, sectors, and scales, and representing key interactions and feedback.
Table 2. TLAS Loss calculation module [19].
ModuleFormulaLoss Reference Data
Agriculture
loss
C L = i N α i [ C P A i × C L A i ] Agriculture losses caused by severe typhoon disasters (Council of Agriculture; 1991–2011).
C L : Cropper Loss per Aare(NT dollar/m2)
C P A i : Cropper Price (NT dollar/m2)
C L A i : Cropper Loss Area (hectare)
α i : Modify Coefficient
i: Different Crop
Table 3. Characteristics of the various methods for assessing adaptation options [21,23].
MethodsDecision-Making CriteriaFocus
Cost-Benefit Analysis (CBA)EfficiencyPrioritize possible adaptation measures and compare impacts using a single metric.
Cost-Effectiveness Analysis (CEA)EffectivenessFind the least costly adaptation option(s) aiming to meet physical targets.
Multi-Criteria Analysis (MCA)A number of criteriaSelect the adaptation option with the highest score under assessment by evaluating different adaptation options through a set of criteria with assigned weighting.
Table 4. Comparison of flooded areas in largest typhoon events for 12 agricultural crops in the Dajia River Basin.
Number (Area Ranking)AgriculturalCategoryArea (ha)Flooded Area (ha)
20th_TOP121st_TOP1
1PearFruit tree1732.8154.08306.61
2RiceRice1286.5306.53582.98
3CitrusFruit tree527.629.2157.17
4PersimmonFruit tree448.911.0217.2
5GrapeFruit tree188.78.217.34
6LicheeFruit tree185.513.1621.65
7Sweet potatoUpland crop111.3641.9548.95
8WatermelonVegetable crop81.2420.8654.48
9GuavaFuit tree7.51.893.63
10LonganFruit tree7.11.492.58
11TaroVegetable5.771.812.75
12MangoFruit tree3.40.841.22
Total591.041116.56
Table 5. Possible adaptation methods for reducing flood impacts in agricultural farmland in the Dajia River Basin.
MethodConceptApplicable PlantsBenefits
Engineering method
1. Improving drainage systemsImprove drainage and sewer systems.Rice
Fruit tree
Increase the infiltration volume of the paving and build a reservoir to reduce the chance of damage to agricultural products.
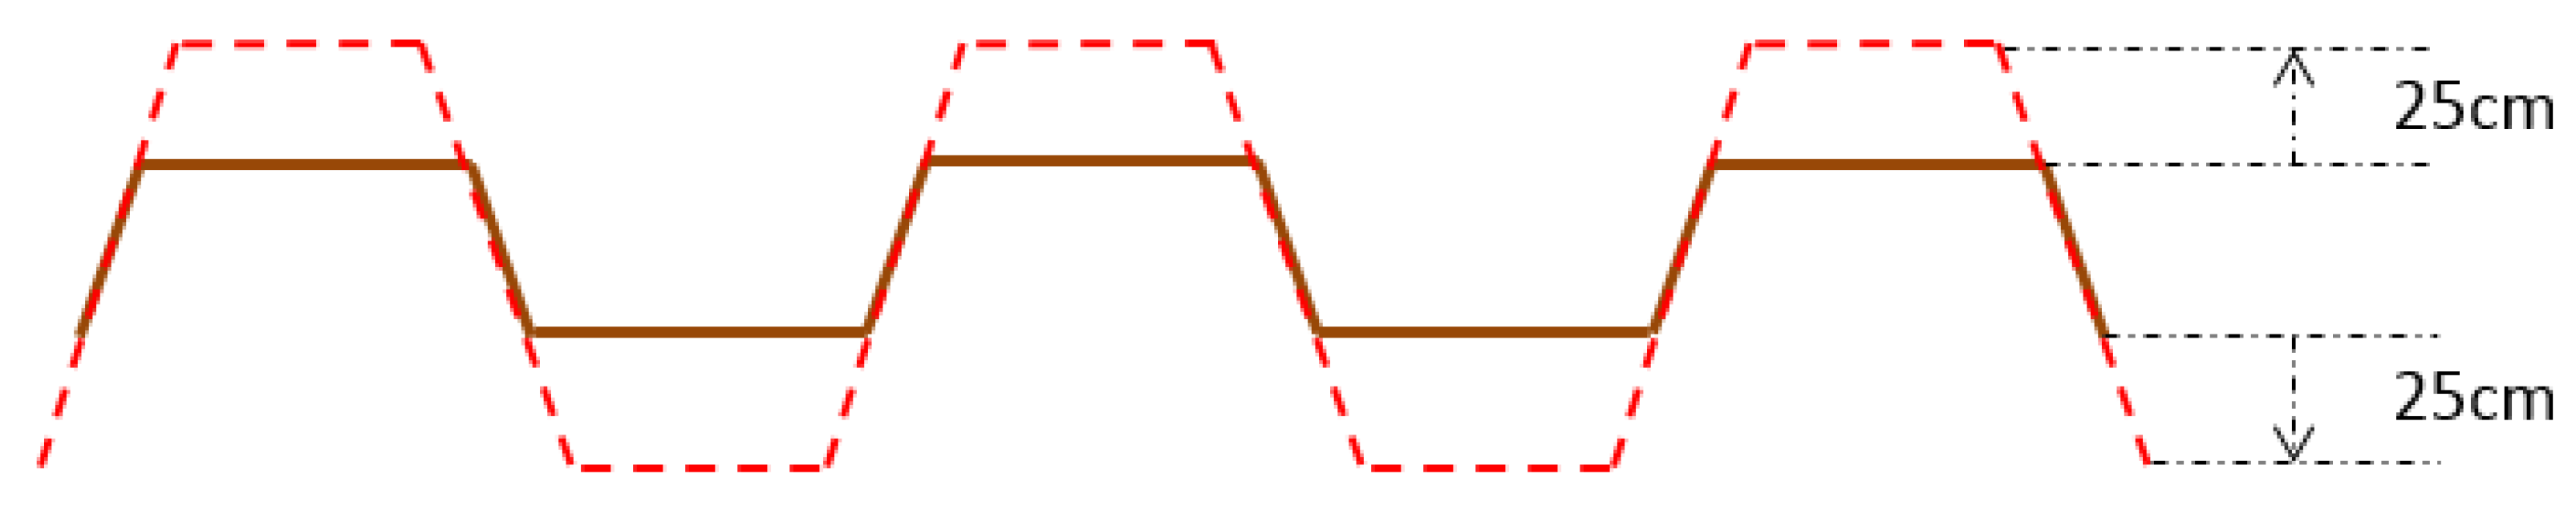
2. Heightening farmland ridgesAdd 10~60 cm more to the height of the farmland ridge.Upland cropReduce the flooded area.
3. Adding flood control and strengthening structural capacityAdd pumping stations in urban parks or wasteland.Rice
Fruit tree
Upland crop
Reduce flooding in key areas.
Non-engineering method
4. Adjustment of agricultural production period or changing cropsAvoid flood seasons or change cropping pattern in flood-prone areas.Rice
Fruit tree
Upland crop
Reduce the probability of losing agricultural output due to flooding.
5. FallowingEncourage fallowing in areas prone to flooding and provide subsidies.Rice
Fruit tree
Upland crop
Avoid losing agricultural output due to flooding.
6. Create protected areasLand acquisition program to delimit protected lands.Rice
Fruit tree
Upland crop
Restore flood-prone area to its ecological condition, therefore reducing agricultural losses due to flooding.
Table 6. Flooding area simulation by heightening farmland ridges.
ItemPlant Area (HA)21st_TOP1 Scenario
Flooded-Area without Adaptation (HA)Flooded-Area with Adaptation (HA)Reduced Area (%)Non-Reduced Area (%)
Watermelon81.254.548.211.688.4
Sweet potato111.44936.725.174.9
Taro5.82.82.414.385.7
Table 7. Preliminary result of cost and benefit analysis on adaptation option: heightening farmland ridges.
ItemCostBenefit
Area Adaptation Action Applied (HA)Cost of Action (USD/HA)Total Cost (USD)Flooded Area Reduced (HA)Production Value (USD/HA)Total Benefit (USD)
(A)(B)(C) = (A) × (B)(D)(E)(F) = (D) × (E)
Watermelon81.236729,7796.313,34184,047
Sweet potato111.436740,85412.321,923269,650
Taro5.836721270.421,4548582
Summation 72,760 362,279
Table 8. Adaptation options for agriculture.
OptionsItem
No.1No action taken
No.2Engineering Adaptation (Heightening farmland)
No.3Non-Engineering Adaptation (Changing crops-Rice)
No.4Non-Engineering Adaptation (Changing crops-Guava)
No.5Engineering plus Non-Engineering Adaptation (Changing crops-Rice)
No.6Engineering plus Non-Engineering Adaptation (Changing crops-Guava)
Table 9. Results of benefit analysis on all adaptation options.
No.ItemsAnnual Loss (USD)Annual Cost (USD)Annual Benefit (USD)Net Benefit (USD)Residual Loss (USD)
ABCD = C − BE = A − C
NO.1Non-Adaptation6,533,4260006,533,426
NO.2Engineering Adaptation (Heightening Farmland)6,533,426172,9131,271,6091,098,6975,261,816
NO.3Non-Engineering Adaptation (Changing cropping-Rice)6,533,426591,4701,797,2641,205,7944,736,162
NO.4Non-Engineering Adaptation (Changing cropping-Guava)6,533,4265,586,80411,788,4016,201,597−5,254,975
NO.5Engineering plus Non-Engineering Adaptation (Changing cropping-Rice)6,533,4261,011,5561,476,022464,4665,057,404
NO.6Engineering plus Non-Engineering Adaptation (Changing cropping-Guava)6,533,4264,761,1359,681,3494,920,214−3,147,923
Publisher’s Note: MDPI stays neutral with regard to jurisdictional claims in published maps and institutional affiliations.

