Article

Examining the Relationship between the Economic Performance of Technology-Based Small Suppliers and Socially Sustainable Procurement

by
Youngbok Ryu
1,* and
Toshiyuki Sueyoshi
2,3
1
College of Professional Studies, Northeastern University, 360 Huntington Ave, Boston, MA 02115, USA
2
Department of Management, New Mexico Institute of Mining & Technology, 801 Leroy Place, Socorro, NM 87801, USA
3
Tokyo Tech World Research Hub Initiative, Tokyo Institute of Technology, School of Environment and Society, 3-3-6 Shibaura, Minato-ku, Tokyo 108-0023, Japan
*
Author to whom correspondence should be addressed.
Sustainability 2021, 13(13), 7220; https://doi.org/10.3390/su13137220
Submission received: 26 April 2021 / Revised: 14 June 2021 / Accepted: 25 June 2021 / Published: 28 June 2021
(This article belongs to the Special Issue Innovation, Entrepreneurship, and the Making of Sustainable Change)

Abstract

:
Sustainable public procurement plays an important role in addressing not only environmental but also economic and social issues through government acquisitions from technology-based small suppliers. In this context, the objective of this study is to better understand the holistic public procurement process by assessing the operational efficiency of technology-based small suppliers and associating the economic aspect of public procurement with the social aspect, such as women-owned businesses. To this end, we analyzed U.S. Department of Defense Small Business Innovation Research grantees by combining network data envelopment analysis with bootstrap truncated regression analysis. Drawing on the analysis results, we found that (1) there is heterogeneity in the performance of research and development, network building, and commercialization sub-processes, and (2) there is a positive relationship between the overall performance and women-owned small suppliers who excel particularly in network building. The former implies that small suppliers may have different expertise in the chain of public procurement; the latter suggests that woman entrepreneurs with a business network may be able to outperform their counterparts in the public procurement market.

1. Introduction

Purchasing is a critical process for decision-makers to maintain the competitiveness of their organizations [1]. With the emergence of global and local value chains, it became particularly important from a perspective of supply chain management [2]. However, a great body of studies has focused on purchasing in the private sector, which dwarfs the importance of that in the public sector [3]. According to the Organization for Economic Cooperation and Development (OECD) study [4], industrial nations tend to spend about 12% of their gross domestic product (GDP) in public procurement. In the United States (US), specifically, purchasing in the public sector, as of 2017, accounts for about a quarter of government expenditure [4]. Considering the significant size of public procurement, it is meaningful to contribute to the relevant literature.
Recent extant literature on public procurement has embraced the concept of sustainability, often represented by the triple bottom line [5]. Despite its broad concept including not only environmental but also economic (or financial) and social dimensions, a majority of the sustainable public procurement literature has focused on green procurement that concerns purchasing environmentally-friendly products or services [6]. A paucity of literature has investigated the nexus of the economic and social dimensions of sustainable public procurement. In this vein, our study of small suppliers owned by minorities or women is meaningful in that small suppliers contribute significantly to the national economy by creating the majority of jobs and, particularly, socioeconomically disadvantageous small suppliers are closely related to the diversity, equity, and inclusivity issues (the social dimension of sustainable procurement) in the U.S. [7].
From a methodological lens, it is notable that most procurement studies tend to take a qualitative approach, particularly based on interviews with stakeholders in purchasing processes [8]. One of the probable reasons is the data availability and quality issue [9]. Purchasing data may not be easily accessible from outside of organizations. Even within the organizations, they are not readily sharable. Because of that, relatively fewer studies took a quantitative approach. Of them, data envelopment analysis (DEA) has been employed to better understand procurement processes [10]. It has proved its special usefulness in screening suppliers by measuring their efficiency or performance based on multiple input and output factors. Moreover, there are some gaps in the existing literature that explore determinants associated with technology-based small suppliers’ performance (e.g., operational or technical efficiency) in a more systemic and robust manner.
To address the aforementioned issues, we shed more light on the economic and social aspects of sustainable public procurement by looking into companies’ procurement processes through the combination of network DEA (N-DEA, a nonparametric technique) and bootstrap truncated regression analysis (B-TRA, a parametric technique). Through a two-stage analytic framework, we first assessed the public procurement performance of suppliers (economic aspects) and then associated the performance with multiple factors indicating socially sustainable purchasing (social aspects). At the first stage, particularly, we decomposed the public procurement process into three different sub-processes: research and development (R&D), network building, and commercialization. At the second stage, we used B-TRA instead of Tobit regression analysis that has been widely used in previous studies. As shown in Simar and Wilson’s study [11], the former generates more robust estimations (i.e., unbiased coefficients) than the latter does by addressing statistical issues stemming from the finite sample.
To solve data availability concerns and deal with the economic and social dimensions of sustainable public procurement issues, we looked into the U.S. Department of Defense (DoD) Small Business Innovation Research (SBIR) program. The program aims to promote technical innovations and efficiency (economic aspects) and facilitate participation from marginalized populations such as women- or minority-owned small businesses (social aspects) [12]. Particularly, the DoD SBIR program seeks to procure R&D results for national security purpose [13]. Additionally, the SBIR awards data are publicly available. Moreover, the previous studies tended to look into the DoD SBIR program from technological innovation or public venture perspectives, rather than the public procurement lens and by solving relevant issues through qualitative approaches. However, this study seeks to provide a new perspective of the DoD SBIR program by focusing on the sustainable public procurement aspects and utilizing rigorous quantitative approaches.
The remaining sections of this research are organized as follows: Section 2 surveys the literature on the DoD SBIR program and sustainable procurement. Section 3 describes the data, conceptual framework, and methodology with a focus on the N-DEA and B-TRA approaches. Section 4 demonstrates the results of quantitative analyses. Section 5 interprets research outcomes and discusses policy implications. Lastly, Section 6 concludes this study with a summary, limitations, and future research.

2. Study Context

This section describes the context of this study with a focus on the SBIR Program, particularly operated by the DoD. The SBIR program started in the mid-1980s as a public venture to capitalize on the technical capacity of small businesses in the attempt to regain the U.S. technological and economic leadership [14]. Evidenced by a series of successful reauthorizations, the SBIR program has contributed to the national competitiveness by achieving its four major goals: (1) stimulating technological innovation; (2) using small businesses to meet federal R&D needs; (3) fostering and encouraging participation by socially and economically disadvantaged small business concerns (including women-owned ones) in technological innovation; and (4) increasing private-sector commercialization of innovations derived from federal R&D [15]. In particular, as the private sector’s capacity surpasses the public sector’s in some technical areas (e.g., information and communication technology and biotechnology), the SBIR program functions as a conduit for transitioning the state-of-the-art technologies from technology-based small businesses to the DoD [13].
According to the Code of Federal Regulations (specifically, 13 CFR 121.702), the SBIR awardees, as suppliers to the federal agencies, need to meet the following criteria: (1) organized for profit, with a place of business located in the United States; (2) more than 50% owned and controlled by one or more individuals who are citizens or permanent resident aliens of the United States, or by other small business concerns that are each more than 50% owned and controlled by one or more individuals who are citizens or permanent resident aliens of the United States; and (3) no more than 500 employees, including affiliates. In terms of their demographics, only 24% of 2889 SBIR awardees, which have won SBIR Phase II awards from the DoD over the period of 2001 to 2010, were owned by either minorities, women, or veterans [13].
With the passage of multiple reauthorization acts, the SBIR program has been extended in terms of size and coverage [14]. The number of SBIR-participating agencies and the amount of their set-aside budgets both have increased over time. Currently, all federal agencies with a considerable R&D function (specifically, those who have more than USD 100 million of extramural R&D budget) are slated to take part in the SBIR program. Along with its sister program, Small Business Technology Transfer (STTR), the annual total budget of the SBIR program is greater than USD 2 billion. Of them, the DoD is responsible for about the half of total budget, followed by the Department of Health and Human Services (e.g., National Institutes of Health), Department of Energy, National Science Foundation, and National Aeronautics and Space Administration. Within the DoD, Air Force, Navy, and Army, as three major services, represent approximately 32%, 23%, and 18%, respectively, while all other components (e.g., Defense Advanced Research Projects Agency, Missile Defense Agency, and Chemical Biological Defense Program) account for the remaining 27% [13].
Although the overall program is harmonized by the Small Business Administration (SBA), the program is independently operated by each participating agency [16]. As such, each agency seeks to achieve its own objectives in addition to the aforementioned four common main goals. In particular, the DoD makes contracts with small businesses with an intent to procure technologies generated through its SBIR program while other federal agencies provide grants to SBIR awardees along with more research-oriented goals. In addition, DoD components and their laboratories (e.g., Army, Naval and Air Force Research Labs) take extensive measures to generate SBIR topics, encourage women- or minority-owned businesses to apply for their programs, assist selected firms in developing their new ideas and building entrepreneurial networks, and provide additional funds (e.g., Commercialization Readiness Program) to bridge the “valley of death” issue [17].
Drawing on the significant program budget and its contribution to the national competitiveness, the SBIR program has been assessed occasionally by chartered organizations such as the National Academies of Sciences, Engineering, and Medicine (NASEM) and RAND Corporation (see [17,18]) and has been studied by some scholars (see [19,20,21]). However, many of their viewpoints were based on the evaluation of a public venture program rather than public procurement. Thus, their foci were on the growth of SBIR awardees in the private market. Moreover, our study’s focus is on the public procurement market where government agencies act as buyers. For instance, the DoD is a primary purchaser (sometimes only one buyer in a monopsony market) in the market of weapons and munitions (e.g., fighter jets). Additionally, their approaches tend to rely on qualitative methods such as surveys of SBIR awardees, interviews with the SBIR program officers, and case studies of selected companies. Even within quantitative studies, a great body used parametric techniques only. Moreover, our study combines two different types of quantitative methods (parametric and nonparametric) to draw out more rigorous research results.

3. Literature Review

3.1. Small Business in Public Procurement

While there is a belief that small businesses play a pivotal role in the national economy and they need government support programs for entering the public procurement market (e.g., SBIR and 8(a) certification), the market has been dominated by large companies [22]. According to the U.S. General Services Administration’s “Top 100 Contractors Report” in 2019, the amount of top 10 contractors as of 2019 was over USD 170 billion (about 29% of total federal contracting), which was greater than the amount of total small contractors (about 27% of total federal contracting) [23]. In the DoD’s procurement, specifically, large businesses such as Boeing and Lockheed Martin accounted for three-fourths of total contracting, which dwarfed small businesses’ contributions to DoD procurement [24].
Although federal agencies, on occasion, have met their small business contracting goals, they have failed to meet their goals for disadvantaged small businesses [25]. For instance, a five percent goal for women-owned small businesses has not been fulfilled until 2015 since the goal was set in 1994 by the Federal Acquisition Streamlining Act, conceptualized in 2000 by the Equity in Contracting for Women Act, and materialized in 2011 by the Women-Owned Small Business Federal Contract Program [26]. According to Table 1, while the government-wide goal was achieved in 2019, the DoD’s prime contracting did not reach 5% yet. DoD’s prime contracting with service-disabled-veteran-owned or HUBZone-located small businesses is smaller than that with women-owned ones.

3.2. Sustainable Procurement and Data Envelopment Analysis Applications

A great body of procurement studies was focused on supply chain management in the private sector, while a relatively small portion of extant literature investigated public procurement [27]. Regardless of sectoral differences, sustainable procurement has emerged as an important subject since the environmental and social aspects of procurement became one of the criteria in selecting suppliers [28]. Particularly, the public sector has been asked to enhance economic efficiency while alleviating environmental and social footprints through sustainable procurement practices. In developing countries, for instance, ethical (e.g., bribery), safety (e.g., exposure to hazards), and human rights issues (e.g., working conditions) attracted attention from scholars [27]. In the developed countries, more emphasis was placed on the environment and diversity. In the US, particularly, social equity issues over women- or minority-owned suppliers have been critical [29].
To investigate relevant research questions, various research methods have been employed. Of them, most quantitative studies sought to find a better way to evaluate, rank, and select better suppliers. To that end, various techniques, represented by multi-criteria decision-making (MCDM) methods such as the Analytic Hierarchy Process (AHP) and Artificial Neural Network (ANN), have been proposed. For instance, Stević et al. [30] ranked sustainable suppliers in the healthcare industry in Bosnia and Herzegovina by employing Measurement of Alternatives and Ranking according to COmpromise Solution (MARCOS). Milosavljević et al. [31] used Composite I-Distance Indicator (CIDI) to assess the public procurement performance of 30 European countries.
Another stream of analytic methods is DEA, which can measure the efficiency or performance of decision-making units (DMUs; suppliers in this case) based on multiple input and output factors (as criteria). Table 2 summarizes some recent DEA applications in sustainable procurement. Based on the conventional DEA, for example, Niewerth et al. [32] looked into tenders in the construction industry. Yu and Su [33], Amindoust [34], and Ghoushchi [35] addressed the imprecise data issues by employing fuzzy DEA. Nemati et al. [36] incorporated undesirable (e.g., the number of sent defective parts) as well as desirable output (e.g., the number of on-time delivered goods) in their DEA model. Further, Zarbakhshnia and Jaghdani [37] proposed N-DEA to shed light on the black box of the sustainable procurement process and assessed the performance of suppliers in the plastic packing strap industry. In the realm of public procurement, Milosavljević et al. [38] and Dotoli et al. [39] applied DEA to assessed country- and bidder-level performance, respectively, using some technology-related factors (e.g., patent applications and functionality).
In this vein, we also used DEA to evaluate the performance of small suppliers for the DoD acquisition of goods and services. Unlike previous studies, however, we decomposed the public procurement process into three sub-processes, namely R&D, network building, and commercialization, by considering the unique characteristics of technology-based small suppliers. While most procurement-related DEA studies concentrated on the performance-based selection and ranking stage, we extended our study to the next stage where we examined the statistical relationships between the performance and sustainability-related factors with a focus on social equity.
Taking advantage of a good fit of the SBIR program with our research objectives, we tested the following research hypotheses:
Hypothesis 1.
Small suppliers may have different expertise in the chain of public procurement and thus their performance scores may vary across sub-processes of R&D, network building, and commercialization.
Due to the nature of small businesses that have limited resources, they may focus on one of the three sub-processes (e.g., network building sub-process) rather than all. As a result, the performance of a specific sub-process may be higher or lower than that of others.
Hypothesis 2.
Small suppliers owned by marginalized populations may be placed in a preferred position in the public procurement market, and thus their performance may be higher than their counterparts.
Since there are some policy programs targeted for women- or minority-owned small businesses (e.g., Small Business Administration’s 8(a) certification and DoD’s Mentor-Protégé Program), they may have more opportunities to exploit the government acquisition market.

4. Methodology

4.1. Data

This study kept track of 252 elite DoD SBIR grantees. The firms were awarded SBIR Phase II funding (as a follow-up of Phase I) from the DoD over the period of 2001–2010. Out of 2889 firms that won the DoD SBIR awards during the same period, the 252 firms filed more than 15 patents that meet the criteria of “serial innovators” [40]. Given that half of all SBIR awardees have filed no patent application at all and most of them have filed one single patent application, the 252 firms can be regarded as elite technology-based small suppliers.
To measure the economic performance of those small suppliers, we collected various secondary data related to (1) DoD SBIR awards from the SBA’s SBIR database; (2) federal procurement contracts from the Federal Procurement Data System—Next Generation; (3) SBIR grantees’ demographics from the System for Award Management; and (4) patent data from the U.S. Patent and Trademark Office (USPTO). See Figure 1 for the data sources of all variables.
In terms of data collection, it may be worth noting that there is a time lag between input-related data and output-related data to avoid simultaneity. While the former is based on the year 2010, the latter was collected at the end of 2015. Generally, it takes considerable time to transition technologies from the lab (i.e., R&D stage at SBIR Phase II) to market (i.e., commercialization stage at SBIR Phase III). To select the appropriate time lag, we referred to previous studies (see [16,41]).
Table 3 shows the descriptive statistics of data used in this study. The first six variables were used for N-DEA as input and output factors, while the last six variables were used for B-TRA as independent variables. The former is explained in more detail in the next subsection. The latter includes factors related to social sustainability, such as HUBZone_located, Urban_located (geospatial dimensions), and Minority_owned, Women_owned, Veteran_owned (ethnic/gender dimensions), as well as Age (control variable).

4.2. Variables and Proxies

Input and output factors, which were included in the N-DEA of the overall public procurement process, are described in more detail.
SBIR awards. The amount of SBIR awards is positively related to the number of patent filings [13]. As a public venture capital, the SBIR program provides a substantial amount of money to technology-based small suppliers. Generally, the program offers USD 150 thousand for Phase I grantees to assess technical feasibility and USD 1 million for Phase II grantees to carry out R&D [42]. Additionally, the DoD SBIR program provides Phase II+ funding to facilitate technology commercialization [17]. These financial resources are critical for technology-based small suppliers to secure funding for materializing their new ideas.
Number of employees. Talents with not only technical/commercial knowledge but also interpersonal skills are essential for R&D as well as network building [43]. Particularly, because valuable scientists or engineers contribute to firms’ specialized knowledge stocks, human resources play a pivotal role in the competitiveness of technology-based companies [44]. In addition, high-quality human resources can develop firms’ social capital by building and broadening their entrepreneurial networks that may be a conduit for financial resources, information, and other resources [45].
Technological distance. Technology-based collaborations (e.g., strategic alliances and joint ventures) tend to take place to fill the gap by supplementing complementary assets [46]. This may apply to the DoD in need of meeting warfighters’ demands that cannot be addressed with in-house capacity but can be solved externally. TBSBs with that capacity can be a solution to the DoD and be placed in an advantageous position in building networks with the DoD. In this regard, technological distance means how dissimilar technologies TBSBs have relative to the DoD. Following Choi and Yeniyurt [47], we calculate the technological distance (TD) using the following formula:
T D i j = 1 F i F j [ ( F i F i ) ( F j F j ) ] 1 / 2
where TDij = technological distance; Fi = vector of DoD’s patent portfolio (i.e., distribution of patent applications across patent classes); Fj = vector of small supplier j’s patent portfolio.
Number of patents. Results of R&D usually lead to the filing of patents because organizations want to protect their novel and non-obvious ideas with industrial utility and to recoup their R&D investment through intellectual property rights [48]. Thus, the number of patents (granted patents or patent applications) is widely used as an indicator for technological innovations. Specifically, this is true for small suppliers that seek to obtain external funding because filing more patents enables them to display their technological strength and attract investors [49].
Number of connections. Firms’ social capital may be manifested in the number of ties they have generated [50]. In the military technology market, particularly, connections with the DoD are critical in that the market is characterized by monopsony (i.e., the DoD is a single buyer in the market) [51]. However, all DoD components do not have equal capabilities to procure private-sector technologies; they may vary with their size. For instance, three services (i.e., Air Force, Army, and Navy) may have stronger purchasing power than other relatively small components (e.g., MDA and CBD). In this vein, we use the eigenvector centrality in the SBIR funding network rather than just the degree centrality [52]. Since the funding network is bipartite (i.e., connections between a group of small suppliers and a list of federal agencies without connections between small suppliers and between federal agencies), small suppliers with stronger links to more influential procurers (e.g., three services) may outperform their counterparts. In Figure 2, for instance, 3 Phoenix, Inc. has connections to both Navy and Air Force while 1st Detect Corp. has a connection only to the Office for Chemical and Biological Defense.
Federal procurement contracts. The final output of the overall public procurement is acquisition contracts such as delivery orders made by the DoD in the context of our study [18]. Small suppliers may be able to increase the number of contracts by developing more attractive technologies (represented by the number of patents) and/or by building wider and stronger networks with large DoD components (represented by the number of connections).

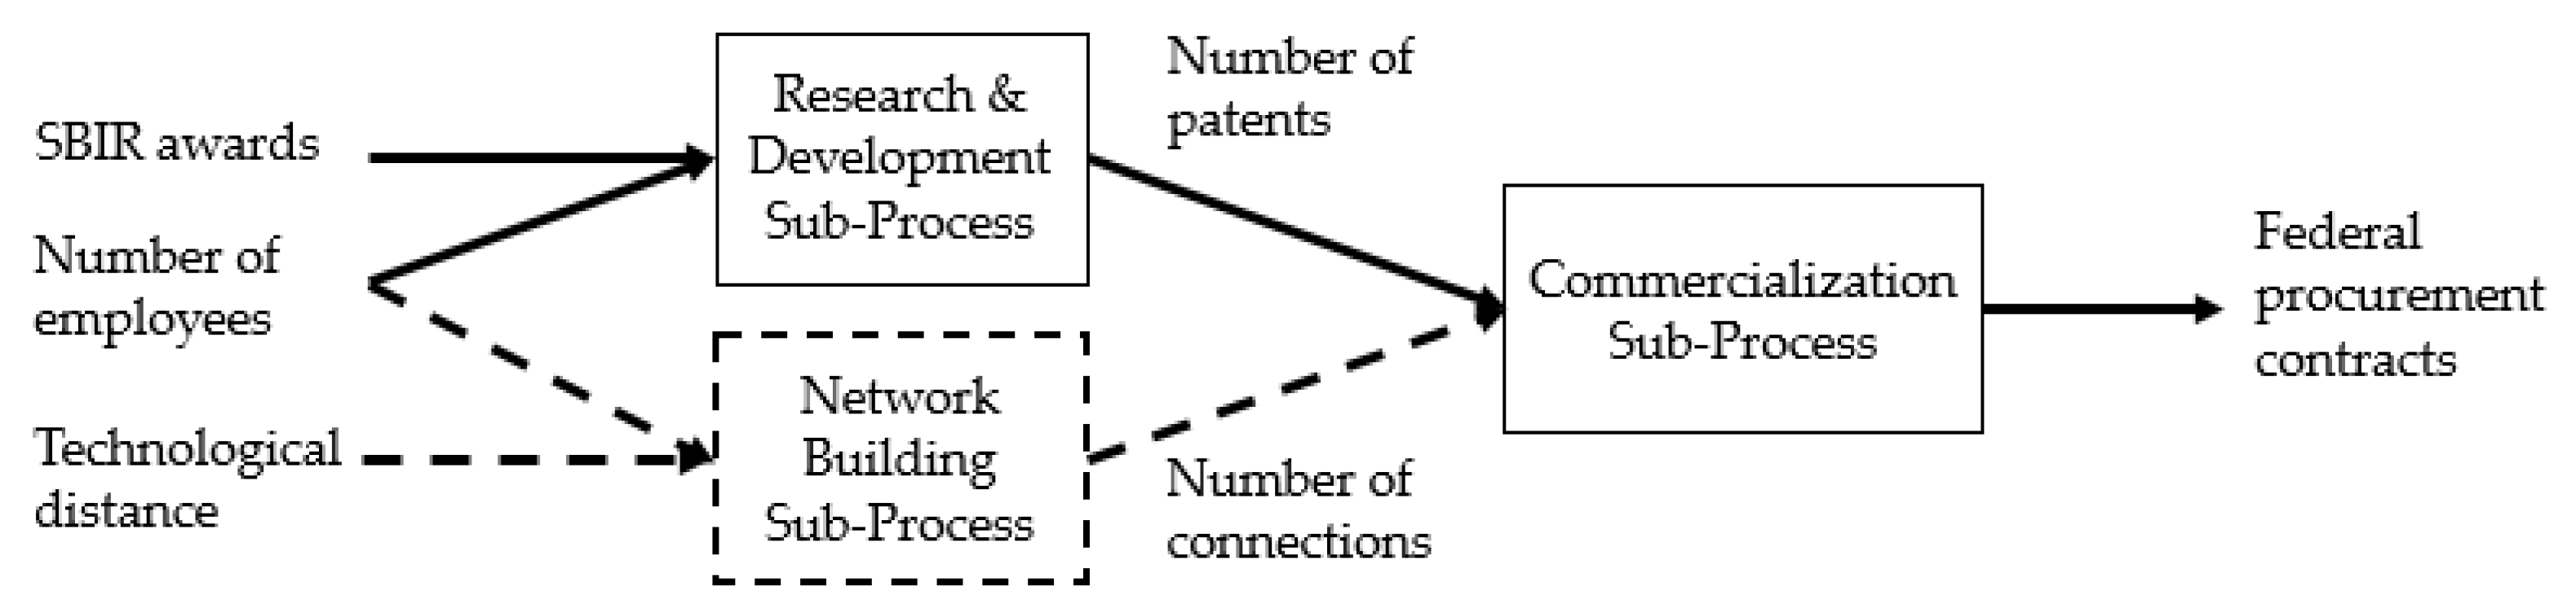
4.3. Two-Stage Analytic Framework
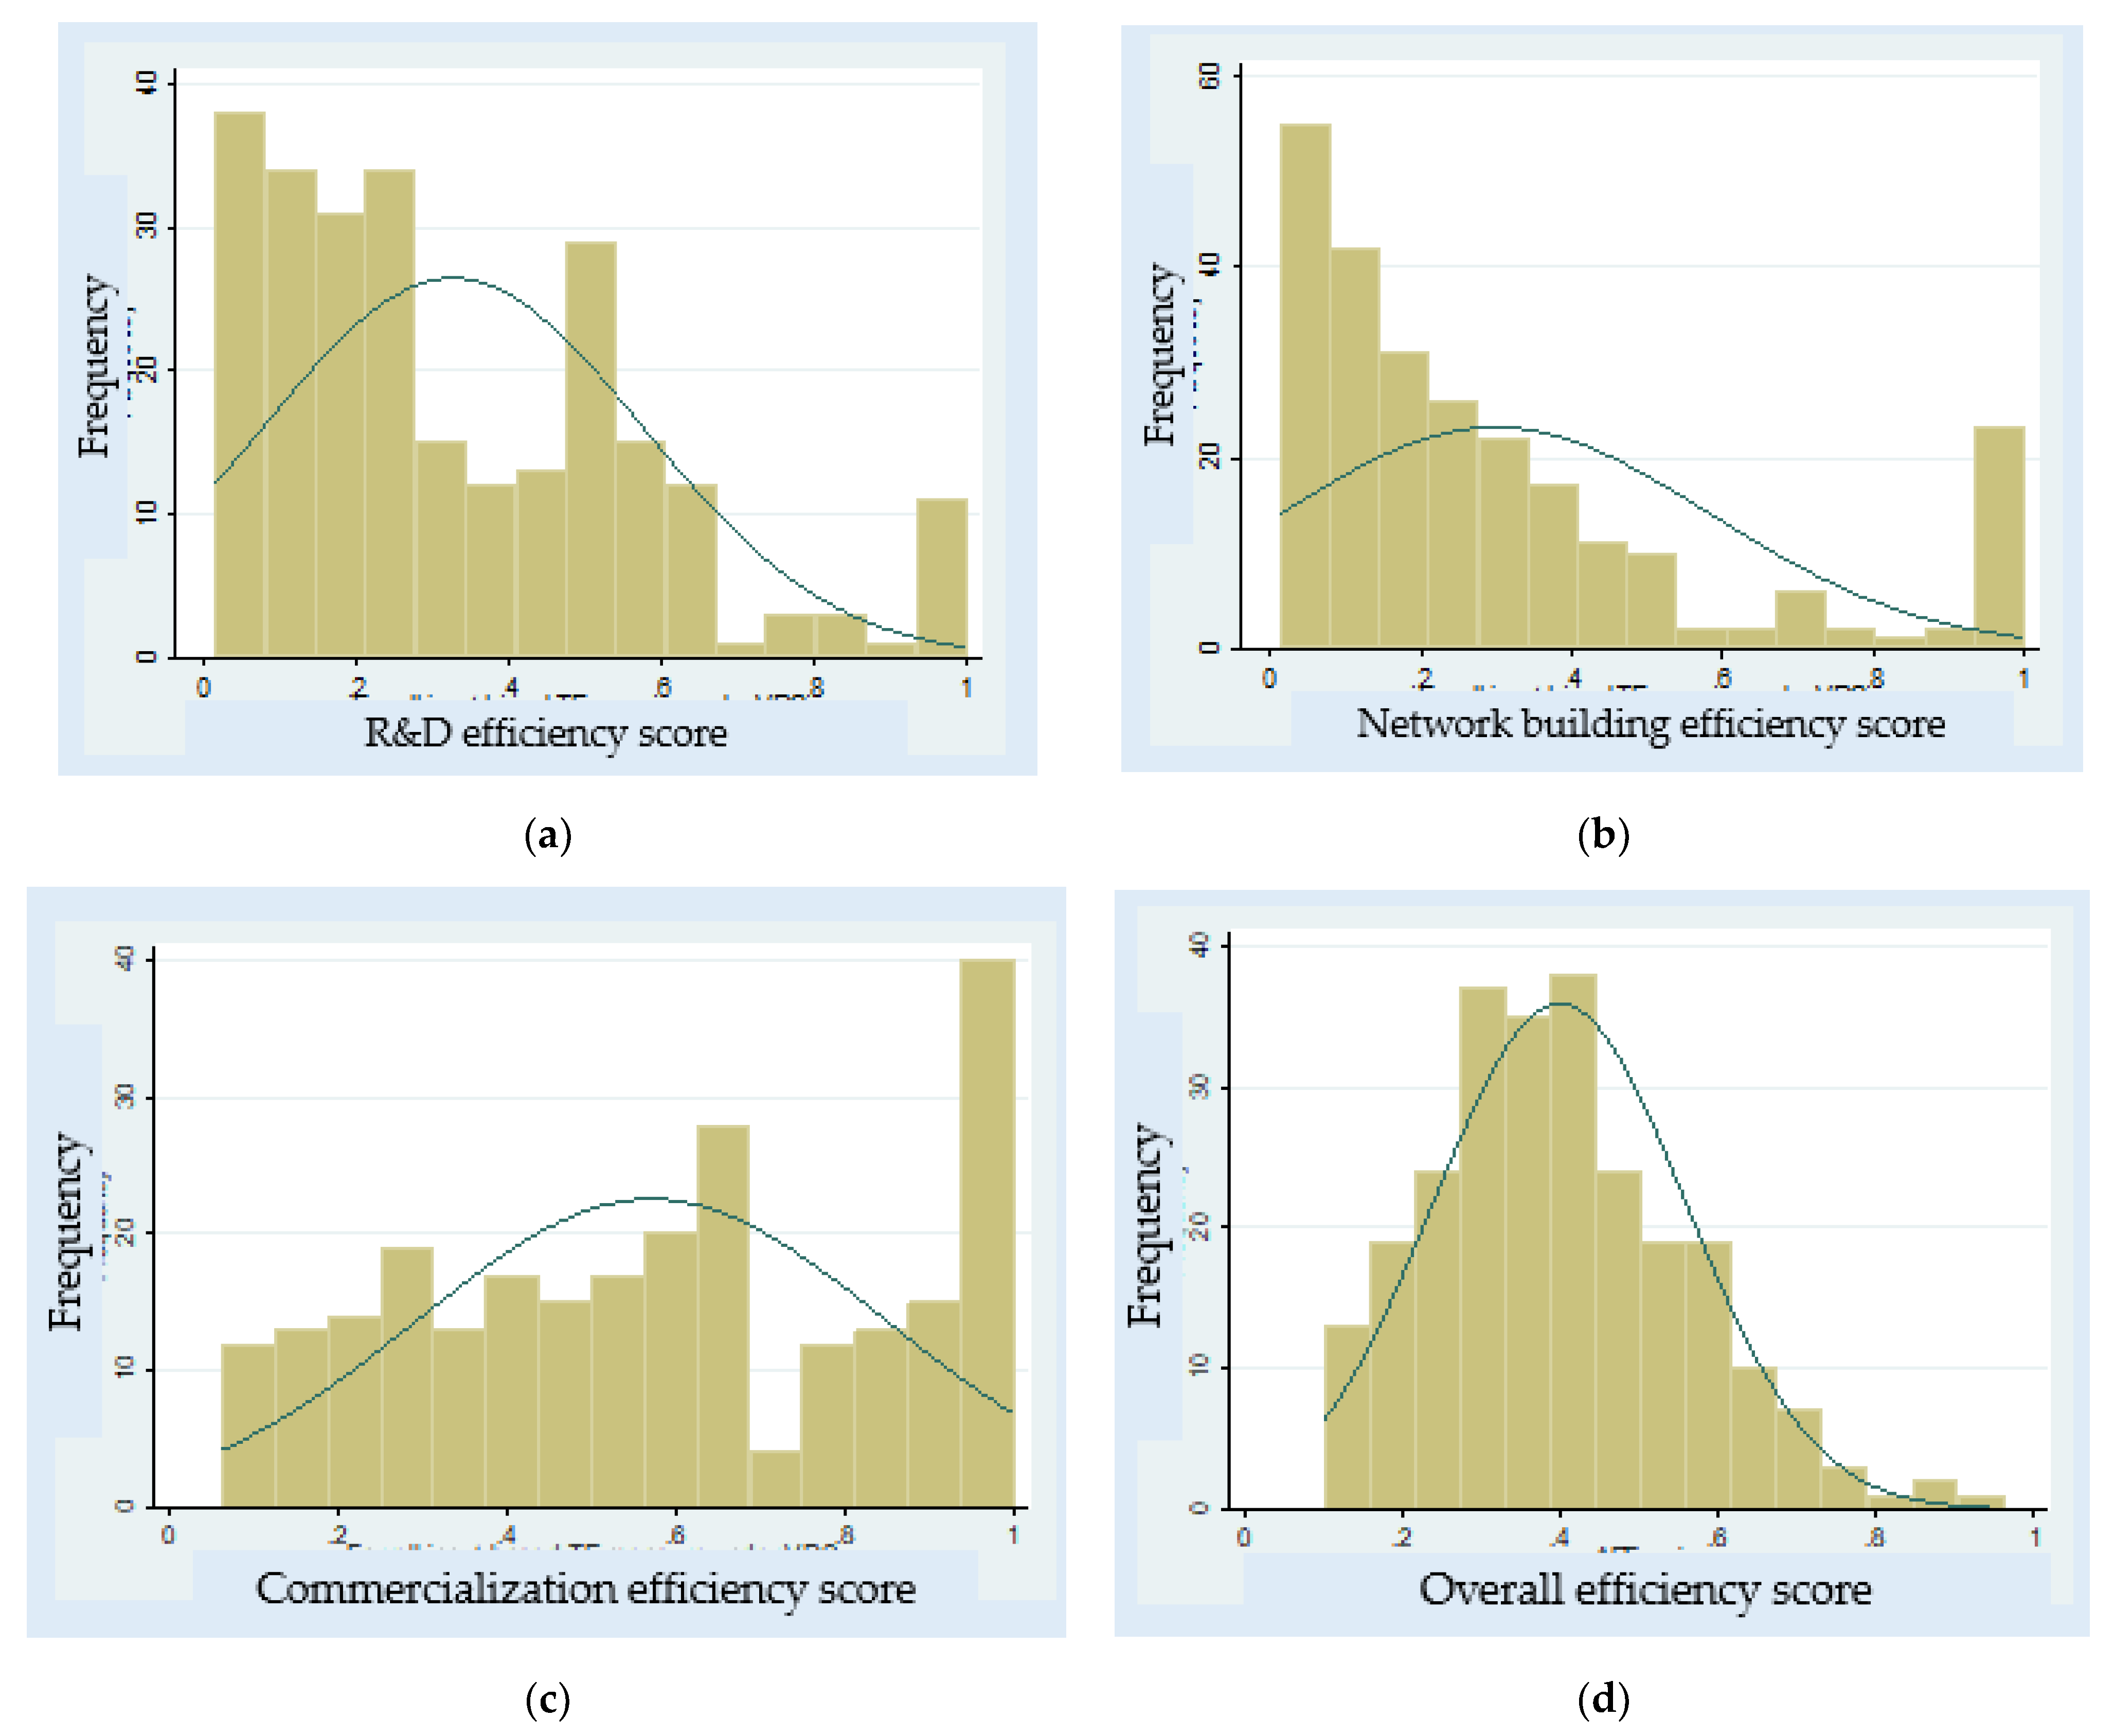
To test the first hypothesis, we dissected the process of the technology-oriented public procurement process into three sub-processes: R&D, network building, and commercialization. Most existing literature on public procurement, which applied DEA, used a single-process model by regarding the procurement process as a big black box. To take a more holistic viewpoint, we referred to some previous innovation studies that attempted to shed light on the black box by dividing the whole innovation process into two sub-processes such as R&D and commercialization sub-processes [53,54]. While those studies may work well with well-established large companies, their approach may not apply to relatively nascent small firms that have limited financial, human, and social capital. In start-ups, for instance, workers should have multi-tasking capacity (e.g., working for R&D and network building tasks simultaneously) [55]. In terms of financing, they tend to start with bootstrapping (i.e., minimal funding from personal savings or assistance from family, friend, and other acquaintances), and seek public venture programs (e.g., SBIR) before securing sufficient funding from private equity (e.g., Angels and venture capitals) and crowdfunding sources [56]. Further, some studies confirm that the receipt of SBIR funding provides a positive signal (in terms of technical excellence and market potential) to private-sector funders [57].
Given that the extant literature still does not fully reflect the complex innovation process initiated by small suppliers, we added the network building sub-process in tandem with the R&D sub-process, both of which are followed by the commercialization sub-process. That way, we can bridge the gap in the existing DEA literature that misses the role of social capital in a small business context. Although many studies have underlined the importance of entrepreneurial social networks for the better performance of small businesses, there is little literature that incorporates the network building component into the innovation process in the realm of DEA. As shown in Figure 3, specifically, we included the “Network Building Sub-Process” into the overall technology-based public procurement process.
To address our research hypotheses, we employed a two-stage approach: N-DEA at the first stage, and B-TRA at the second stage. DEA, a nonparametric technique, allows one to measure the performance without making assumptions about the form of the production function based on multiple inputs and outputs. Through network DEA, we further evaluated the economic performance of technology-based small suppliers at three different sub-processes. While a great body of studies (see [58,59]) illustrated the production function of the R&D sub-process (so-called knowledge production function), little literature has looked into the network building and commercialization sub-processes (i.e., network and market generation functions). Particularly, because of the lack of parametric studies on the network and market production functions, we sought to take advantage of DEA’s strength in dealing with any types of production functions.
At a subsequent stage, we applied B-TRA to examine how the economic performance is associated with factors concerning the social aspects of sustainability. To estimate less biased coefficients of parametric models, we applied the bootstrap technique to truncated regression models. Detailed descriptions of N-DEA and B-TRA are presented in Appendix A and Appendix B, respectively.

5. Results

Based on the results of N-DEA, Table 4 summarizes the performance scores at three different sub-processes and the overall score. The commercialization performance score (57%) was the highest, followed by R&D (33%) and network building (30%). The overall performance score was about 40%. More specific results of N-DEA are presented in Appendix C.
To examine the statistical difference between the three different types of efficiency scores, we conducted the Friedman test that is grounded in the nonparametric two-way analysis of variance along with Kendall’s coefficient of concordance [60]. Friedman’s χ2 of 115.3988 (p-value = 0.0000) means that the distributions of the three types of efficiency scores are statistically different. Additionally, Kendall’s coefficient of 0.2290 toward zero (against one) indicates little concordance across the efficiency scores.
Figure 4 graphically shows the difference in the distributions of the three efficiency scores and the approximately normal distribution of the overall score. The distributions of R&D and network building efficiency scores show a positive skew while that of commercialization efficiency scores indicate a somewhat negative skew. As a result, overall efficiency demonstrates a symmetrical distribution that looks like a normal distribution with left truncation.
Table 5 describes the results of TRAs with and without bootstrap. For the analyses, we used various firm-level variables, particularly related to social sustainability. They included not only demographics (e.g., Age), location (e.g., Urban_located and HUBZone_located), and ownership (e.g., Minority_owned, Women_owned, and Veteran_owned). Depending on the absence or presence of bootstrap and a list of independent variables, Models 1a, 1b, 2a, and 2b were constructed and tested. Models without bootstrap tended to underestimate the absolute value of coefficients when compared to ones with bootstrap. Across all models, input and output factors used in our DEA model were statistically significant. No_connections and Federal_procure were positively associated with performance score, whereas SBIR_awards, No_employees, Tech_distance, and No_patents were negatively associated. One notable point in Models 1b and 2b was that Women_owned was positively associated with performance score while the relationships between performance score and other factors regarding social sustainability were not statistically significant.
To further explore where the significance of Women_owned came from, we also present Table 6 where the coefficients of Women_owned at different sub-processes are summarized. Interestingly, Women_owned was statistically significant in relation to the network building sub-process only, which implies that women-owned small suppliers are more likely to be better performers, particularly in building networks with funders.

6. Discussion

Drawing on N-DEA, we first determined three different types of efficiencies (i.e., R&D, network building, and commercialization) of 252 small suppliers who have won DoD SBIR funding. In terms of R&D performance, they are “serial innovators” by meeting the criterion of more than 15 patent applications [40]. That being said, it may be questionable if they are also “serial entrepreneurs” who are successful in the public procurement market by achieving high efficiency in network building and commercialization sub-processes as well as R&D sub-process. As “efficiency-inducing change agents,” they need to optimize the efficiency of knowledge, network, and market productions by managing financial, human, and social capitals better [61].
Relative to efficient performers on the frontier, a majority of firms showed relatively low efficiency scores in R&D and network building (on average 32.65% and 29.83%, respectively) while demonstrating relatively high efficiency scores in commercialization (on average 57.01%). The results support our first research hypothesis. It is consistent with other studies that show a dramatic contrast in efficiency scores at different sub-processes. For instance, Lee et al. [62] assessed the efficiencies of Korean small firms at two sub-processes, such as R&D and commercialization, over the period of 2009–2014, and the average scores were 10.2–14.6% for R&D and 64.9–65.2% for commercialization.
Although it is not directly comparable, the commercialization efficiency of this study was somewhat smaller than those of other studies. In addition to Lee et al. [62], Alvarez and Crespi [63] explored the efficiency of Chilean small manufacturing firms, and the average score was 65%. Grilo and Santos [64] examined the efficiency of Portuguese technology-based start-ups from 2009 to 2011, and the average score was 75.15%. Overall, there is some room for improvement among the U.S. small suppliers to reduce inefficiencies (67.35%, 70.17%, and 42.99% for R&D, network building, and commercialization sub-processes, respectively).
To sustainably involve technology-based small businesses in the federal procurement market, it may need to correct the asymmetry of efficiencies in between R&D/network building and commercialization. The failure to address this issue may lead to negative stigma and risky prejudice against contracting with small businesses [22]. One potential solution would be to render inefficient firms benchmark the efficient ones on the frontier. It suggests some policy programs that seek to facilitate procurement knowledge and experience sharing among the DoD SBIR grantees.
Based on the results of TRAs (see Table 4), only Women_owned was statistically significant of the factors concerned with social sustainability, so our second research hypothesis was partially supported, and we focused on the interpretation of Women_owned. Women_owned had a positive association with overall efficiency, which primarily results from the superiority of women-owned small suppliers in network building. One probable reason is that government agencies have encouraged acquisitions from women-owned firms [65]. For instance, some public policy programs (e.g., SBA’s Women’s Business Centers) have assisted female entrepreneurs in participating in the public procurement market and growing their businesses. Additionally, the DoD has made over USD 230 billion of federal procurement contracts with women- and minority-owned businesses over the period of 2010–2016 [66]. While public policy is helpful for the empowerment of women-owned small suppliers, it does not explain everything in that Minority_owned was not statistically significant although minority-owned small suppliers have also received similar preferences in the public procurement market.
Some other explanations may be available from the network characteristics of women entrepreneurs relative to those of men. McGregor and Tweed [67] compared men- and women-owned small businesses from a networking and mentoring perspective and found that female entrepreneurs with a business network (and a business mentor) outperformed counterparts such as those without a business network or male entrepreneurs. Further, Manello et al. [68] demonstrated that as women in senior roles participated in formal networking activities, the firm’s economic efficiency increased. This reinforces the importance of network building, particularly for women-owned small suppliers. It also implies that public policy toward networking and/or mentoring programs can address gender-based economic and social inequity issues.
Overall, this study contributes to the extant knowledge on the sustainable public procurement domain by adding the following new findings: (a) there is significant room for improvement in network building in the technology-based public procurement market, and addressing this issue may be a critical means not only for the economic aspect but also the social aspect of sustainable procurement; and (b) the economic performance is related to the social dimension (particularly the gender equity issue in this study) of sustainable procurement, and facilitating the participation of women-owned small suppliers in the federal procurement may be an effective way to enhance the overall efficiency of the public procurement process.

7. Conclusions

Sustainable public procurement plays an important role in addressing not only environmental but also economic and social issues through government acquisitions from technology-based small suppliers. In this context, the objective of this study was to better understand the holistic public procurement process by assessing the operational efficiency of technology-based small suppliers and associating the economic aspect of public procurement with the social aspect, such as women-owned businesses. To that end, we analyzed U.S. DoD SBIR grantees by combining network DEA with bootstrap TRA. Drawing on the analysis results, we found that (1) there was heterogeneity in the performance of R&D, network building, and commercialization sub-processes; and (2) there was a positive relationship between the overall performance and women-owned small suppliers who excel particularly in network building. The former implies that small suppliers may have different expertise in the chain of public procurement; the latter suggests that women entrepreneurs with a business network may be able to outperform their counterparts in the public procurement market.
One of the concerns was that the overall performance of U.S. DoD SBIR grantees was relatively low. The overall efficiency based on the average of R&D, network building, and commercialization efficiency scores was about 40%. To improve the overall efficiency, the DoD may need to pay more attention to R&D and network building sub-processes. For example, the DoD would be able to better capitalize on its research laboratories in strengthening the R&D and network building capacity of small suppliers. Additionally, the selection of SBIR awardees needs to be more careful in that those with high potential to grow in a sustainable manner can contribute to efficiency enhancement. Particularly, women-owned small suppliers need to be offered more opportunities to develop their business networks and participate in the public procurement market. In this sense, the DoD needs to reinvigorate the current Mentor–Protégé program and develop new programs aiming at the improvement of sustainable public procurement.
While this study sought to be methodologically rigorous and informative not only to academics but also to practitioners, there are some limitations. First, more studies on the network building sub-process are needed. While a knowledge generation function for the R&D sub-process is well-documented in previous studies, literature on a network generation function is rarely found, particularly in the DEA field. We attempted to develop a network generation function using the number of employees and technological distance as inputs and the number of connections as an output, but it may need more theoretically-grounded justifications. Second, this study may not be generalizable to small suppliers in the traditional industries (e.g., food or construction) in that we focused on the technology-driven public procurement market. The conventional procurement market may have different sets of sub-processes and factors that determine the performance of suppliers. It is hoped that those limitations can be addressed in future studies.

Author Contributions

Conceptualization, Y.R.; methodology, T.S. and Y.R.; software, Y.R.; validation, T.S. and Y.R.; formal analysis, Y.R.; investigation, T.S. and Y.R.; resources, T.S.; data curation, Y.R.; writing—original draft preparation, Y.R.; writing—review and editing, T.S.; visualization, Y.R.; supervision, T.S.; project administration, Y.R.; funding acquisition, T.S. and Y.R. All authors have read and agreed to the published version of the manuscript.

Funding

This research was funded by the U.S. Department of Defense, grant number HQ0034-19-FOA-ARP-0001.

Institutional Review Board Statement

Not applicable.

Informed Consent Statement

Not applicable.

Data Availability Statement

Not applicable.

Acknowledgments

Portions of this manuscript were presented at the 18th Annual Acquisition Research Symposium, Monterey, CA, 13 May 2021.

Conflicts of Interest

The authors declare no conflict of interest. The funders had no role in the design of the study; in the collection, analyses, or interpretation of data; in the writing of the manuscript; or in the decision to publish the results.

Appendix A. Network Data Envelopment Analysis

To measure the technology transition performance, we particularly employ a modified network DEA. At the first production process, R&D and network building sub-processes take place in tandem. At the second production process, the commercialization sub-process follows. To understand better this whole process as a starting point, we intentionally use parsimonious DEA models with two inputs and one output across different sub-processes. For the R&D sub-process, specifically, a simplified knowledge production function with SBIR awards (as a financial capital input), the number of employees (as a human capital input), and the number of patent applications (as an intermediate R&D output) is used. For the network building sub-process, a novel network production function with technology distance (as a social capital input), the number of employees (as a shared human capital input), and the number of connections (as an intermediate network building output) is proposed. In other words, SBIR awards and technology distance act as a dedicated input that is devoted to a specific sub-process, while the human resources function acts as a shared input that is used for both sub-processes. For the commercialization sub-process, an integrative market production function with two intermediate outputs (the numbers of patents and connections) as inputs and federal procurement contracts (i.e., the ultimate goal of public procurement) as a final output is used.
DEA enables the performance measurement of decision-making units (DMUs; small suppliers in this study) based on linear programming. Our DEA model can be formulated as follows:
M a x i m i z e       ξ + ε s ( i = 1 m R i x d i x + r = 1 s R r g d r g ) s . t .     j = 1 n x i j λ j + d i x + ξ x i k = x i k     ( i = 1 , , m   ) j = 1 n g r j λ j d r g ξ g r k = g r k   ( r = 1 , , s ) , λ j 0     ( j = 1 , , n   ) ,     ξ : U R S ,   j = 1 n λ j = 1 , d i x 0     ( i = 1 , , m   )   &   d r g 0     ( r = 1 , , s ) .  
Nomenclatures used in this study are summarized as follows:
  • x i j : an observed i th input of the j th DMU (i = 1, … , m and j = 1, … , n),
  • g r j : an observed r th output of the j th DMU (r = 1, … , s and j = 1, … , n),
  • d i x : an unknown slack variable of the i th input,
  • d r g : an unknown slack variable of the r th output,
  • λ : an unknown column vector of intensity (or structural) variables,
  • ε s : a prescribed very small number,
  • ξ: inefficiency score, and
  • R: data range.
To avoid an occurrence of zero in dual variable (i.e., multipliers), this study specifies the following three types of data ranges (R) according to the upper and lower bounds of production factors:
R i x = ( m + s ) 1 ( m a x j { x i j | j = 1 , , n   } m i n j { x i j | j = 1 , , n } ) 1 & R r g = ( m + s ) 1 ( m a x j { g r j | j = 1 , , n   } m i n j { g r j | j = 1 , , n } ) 1 .
Under variable returns to scale, we determine the level of efficiency ( θ ( k ) ^ v ) of the k th DMU as follows: θ ( k ) ^ v = 1 O b j ( k ) , where Obj(k) is the optimized objective value of the k th DMU of Equation (A2). See [69,70,71,72,73,74,75,76] for recent DEA developments.
As shown in Figure 2, the public procurement process in our study consists of three sub-processes, so we apply Equation (A2) to all three and average them out to determine the overall efficiency ( θ ^ O V ):
  θ ^ O V = θ ^ R D + θ ^ N B + θ ^ C M 3    
where θ ^ R D , θ ^ N B , and θ ^ C M represent the efficiency scores at R&D, network building, and commercialization sub-processes, respectively.
It is worth noting that decomposing the whole process into several sub-processes and averaging them out in our proposed model have some advantages. In terms of subject, we can better understand the single black box of the public procurement process by dissecting them following the “divide and conquer” principle. We can measure the efficiency scores not only of each sub-process but also of the whole process. It is more informative than measuring a single overall efficiency. From a methodological perspective, our approach allows us to transform the distribution of efficiency scores. In general, the distribution tends to be skewed (to the right or left). With a small sample size, particularly, DEA tends to generate many unity values, so an estimated efficiency score is biased toward one. By taking the mean of the efficiency scores at multiple sub-processes, the skewness may be reduced. In the ideal case where the overall efficiency scores follow a normal distribution, it is more suitable for subsequent statistical analysis by enabling us to estimate more unbiased coefficients.

Appendix B. Bootstrap Truncated Regression Analysis

To ensure unbiased coefficients in the second-stage analysis, we employ bootstrap truncated regression analysis, which was suggested by Simar and Wilson [11], instead of Tobit regression analysis that has been widely used but criticized because of the lack of capacity to handle the finite sample issues. A primary issue is that the actual efficiency score ( θ O V ) is unobservable, so there may be a bias stemming from the difference between θ O V and θ ^ O V , an estimated efficiency score obtained from DEA. Additionally, θ ^ O V is truncated, so Tobit regression analysis may not be appropriate when θ ^ O V is used as a dependent variable.
In a linear regression model, an efficiency score ( θ O V j ) is explained by independent variables ( z j ):
θ O V j = z j β + γ ˜ j
where β is a vector of coefficients; and γ is an error term.
The error term is assumed to be normally distributed with parameters of the mean of zero (μ = 0) and constant variance (σ). It is also truncated at 1 z j β . In addition to our aforementioned decomposing and averaging strategy, the bootstrap can ensure the normality of the error term. Additionally, TRA can address the truncation of the error term.
While Simar and Wilson [11] suggested two different approaches (algorithms 1 and 2), we carry out the first algorithm rather than the second one (i.e., double bootstrap TRA) because we use the overall efficiency scores resulting from the average of three sub-process efficiency scores. For the first algorithm, we perform the following tasks:
(1)
Execute a truncated regression using only h DMUs whose θ ^ O V < 1 (with h < n) to estimate coefficients ( β ^ ) and variance parameter ( σ ^ );
(2)
Repeat the following steps 2000 times to compute bootstrap estimates β ^ b and σ b ^ :
  • (2a) Generate an artificial error γ ˜ j from the normal distribution, N(0, σ ^ ), with truncation at 1 z j β ^ for h DMUs;
  • (2b) Calculate artificial efficiency scores θ O V ˜ j based on z j β ^ + γ ˜ j for h DMUs;
  • (2c) Carry out a truncated regression truncated at 1 of θ O V ˜ j on z j to estimate β ^ b and σ b ^ .
(3)
Compute confidence intervals and standard errors for β ^ and σ ^ drawing on the bootstrap distribution of β ^ b and σ b ^ .

Appendix C. Results of Network Data Envelopment Analysis

Table A1 presents the detailed results of N-DEA. Specifically, it includes the efficiency scores of three sub-processes and overall efficiency scores of 252 small suppliers.
Table A1. Efficiency scores of small businesses.
Small BusinessEfficiency Score
R&DNetwork BuildingCommercializationOverall
1st Detect Corp.0.1900.4731.0000.554
Aculight Corp.0.0060.6220.5170.382
Ada Technologies, Inc.0.0250.7450.4690.413
Adaptive Materials, Inc.0.0670.1060.6250.266
Adesto Technologies0.1880.2150.6200.341
Advanced Ceramics Research, Inc.0.0210.2440.4170.227
ADVANCED CIRCULATORY SYSTEMS, INC.0.0960.2540.6000.317
Advanced Energy Systems, Inc.0.0430.1240.8330.333
Advanced Fuel Research, Inc.0.0311.0000.6000.544
Advanced Mechanical Technology, Inc.0.0620.2070.6000.290
Advanced Scientific Concepts, Inc.0.0270.4350.9380.467
AEC-ABLE ENGINEERING CO., INC.0.1910.0740.6820.315
Aeroastro, Inc.0.0140.0161.0000.344
AeroVironment, Inc.0.0180.0570.3040.126
AESOP, INC.0.0950.4450.4690.336
AGILE SYSTEMS, INC.0.0820.3510.3860.273
Alphatech, Inc.0.0040.0550.7140.258
American Gnc Corp.0.0140.2550.2830.184
American Superconductor Corp.0.3070.0400.0800.143
Anvik Corp.0.0630.4050.2630.244
AOPTIX TECHNOLOGIES, INC.0.1040.2100.6520.322
APPLIED MINDS0.0580.0590.3990.172
APPLIED NANOTECH, INC.0.0530.3160.4050.258
APPLIED OPTOELECTRONICS, INC.0.0810.2900.2170.196
APPLIED THIN FILMS, INC.0.0240.4520.9380.471
Architecture Technology Corp.0.0090.2390.6250.291
ARES, Inc.0.2320.0820.5110.275
Arete Associates0.0050.1060.6540.255
ARTANN LABORATORIES, INC.0.2100.2280.5000.313
ASCENSION TECHNOLOGY CORP.0.0860.1290.5360.250
ASCENT SOLAR TECHNOLOGIES0.1870.2670.3860.280
ASPEN AEROGELS, INC.0.0140.2910.2880.198
AST PRODUCTS, INC.0.0880.1561.0000.414
ATAIR AEROSPACE0.1920.1810.7140.362
Aurora Flight Sciences Corp.0.0190.0440.5170.194
Austin Info Systems, Inc.0.2660.0400.1170.141
Aveka, Inc.0.2160.2830.8820.460
Aware, Inc.0.1550.0740.0950.108
Banpil Photonics, Inc.0.0860.3780.8330.432
BEACON POWER CORP.0.1870.1580.9380.427
BENEDICT ENGINEERING CO., INC.0.2330.6780.8820.598
Benthos, Inc.0.0580.0390.6000.232
BIOARRAY SOLUTIONS0.1920.1530.2920.212
BIOCRYSTAL, LTD.0.1920.0570.4950.248
Biosearch Technologies, Inc.0.1160.0520.8330.334
Calspan Corporation0.1940.0330.3450.191
Cambridge Scientific, Inc.0.1890.2900.9380.472
Cape Cod Research, Inc.0.0351.0001.0000.678
Cascade Designs0.1080.0140.6050.242
Ceradyne, Inc.0.0960.0141.0000.370
Ceramatec, Inc.0.0430.1350.1330.104
CFD Research Corp.0.0031.0000.6820.562
CHEMIMAGE CORP.0.1020.0951.0000.399
CIPHERGEN BIOSYSTEMS, INC.0.1920.0200.2210.144
Cleveland Medical Devices, Inc.0.0490.0810.8330.321
Coherent Logix, Inc.0.0110.1420.5000.218
Coherent Technologies, Inc.0.0070.1490.7500.302
CONCEPTS ETI, INC.0.0930.0570.8820.344
Conductus, Inc.0.3730.2840.3850.347
Cornerstone Research Group, Inc.0.0070.1090.7890.302
Creare, Inc.0.0021.0000.5560.519
Cybernet Systems Corp.0.0090.5290.3260.288
Daylight Solutions0.2080.1220.6820.337
DEFT, INC.0.4780.0560.2160.250
Digital Optics Corp.0.1870.0820.1650.145
Displaytech, Inc.0.0930.1710.2270.164
Diversified Technologies, Inc.0.0280.0800.7890.299
Dynamet Technology, Inc.0.0530.2791.0000.444
Eic Laboratories, Inc.0.0130.5610.5000.358
Eltron Research, Inc.0.0320.4320.3950.286
EMAG Technologies, Inc.0.0130.2941.0000.436
Emcore Corp.0.5460.0960.1100.251
EnerG20.1920.3510.9380.493
Energy Focus, Inc.0.0930.0710.9380.367
Engineering Technology, Inc.0.1920.0941.0000.429
Envirogen, Inc.0.2050.2350.7500.397
Essex Corp.0.0570.3960.9380.463
EXCELLATRON SOLID STATE, LLC0.0620.8900.7500.567
Fiber Materials, Inc.0.0150.2370.5000.251
FIBERSTARS, INC.0.0930.0540.3260.158
FIRESTAR ENGINEERING, LLC0.1240.5430.7890.486
Florida Turbine Technologies, Inc.0.0290.0310.2270.096
Foster-Miller Inc.0.0310.3490.1990.193
Front Edge Technology, Inc.0.0570.2040.8820.381
FUELCELL ENERGY, INC.0.2150.0180.3320.188
GENOMATICA, INC.0.3340.1530.2500.246
GENOPTIX, INC.0.3720.1330.6280.378
Giner, Inc.0.0310.9831.0000.672
Guild Associates, Inc.0.1250.1380.6610.308
HANSEN ENGINE CORP.0.1930.4090.3860.329
HITTITE MICROWAVE CORP.0.0080.1280.4410.192
HI-Z TECHNOLOGY, INC.0.0330.9770.6520.554
Hypres, Inc.0.0080.2920.2730.191
IAP Research, Inc.0.0500.2740.6520.325
Idaho Technology, Inc.0.1870.0680.9580.405
Imaging Systems Technology0.1880.1830.8330.401
Implant Sciences Corp.0.0960.1240.4550.225
Indigo Systems Corp.0.1600.0750.8330.356
INFINERA CORP.0.1570.0210.0960.091
INFINIA CORP.0.0260.0440.5000.190
Information Systems Laboratories, Inc.0.0110.1030.7890.301
INFRAMAT CORP.0.0670.3140.7890.390
INNOVATIVE MICRO TECHNOLOGY0.1870.0860.4410.238
INSIGHT TECHNOLOGY, INC.0.1920.0260.8720.363
INTEGRAN TECHNOLOGIES USA, INC.0.2001.0000.4410.547
INTEGRATED MAGNETOELECTRONICS0.1690.3480.9380.485
INTERNATIONAL ELECTRONIC MACHINES0.0380.2330.4410.237
Interscience, Inc.0.0790.6920.7500.507
INTEVAC, INC.0.1040.0160.1830.101
INTRA-CELLULAR THERAPIES, INC.0.1920.2420.6000.345
IPITEK0.0230.6990.6820.468
IROBOT CORP.0.0560.0140.1930.088
IRVINE SENSORS CORP.0.0590.2550.1280.147
ISIS PHARMACEUTICALS1.0000.0230.1160.380
JAYCOR0.1890.2450.9170.450
JENTEK Sensors, Inc.0.0130.2700.2680.184
JOHNSON RESEARCH & DEVELOPMENT CO., INC.0.0930.4630.2460.267
JX CRYSTALS, INC.0.3731.0000.5770.650
KAZAK COMPOSITES, INC.0.0080.1890.8330.343
KENT DISPLAYS, INC.0.1920.1220.3750.230
KESTREL CORP.0.0420.4960.9380.492
KIGRE, INC.0.1210.0990.8820.367
KONARKA TECHNOLOGIES, INC.0.1870.1170.3480.217
Kopin Corp.0.2720.0580.0710.134
KULITE SEMICONDUCTOR PRODUCTS, INC.0.1580.0130.0710.081
KVH INDUSTRIES, INC.0.0960.0220.3750.164
LAKE SHORE CRYOTRONICS, INC.0.1920.4390.5000.377
LIGHTPATH TECHNOLOGIES0.1870.0380.6050.277
LIGHTSMYTH TECHNOLOGIES0.1151.0000.4170.510
Lightwave Electronics Corp.0.1870.5300.2880.335
LITHIUM POWER TECHNOLOGIES, INC.0.0620.2820.9380.427
LSP TECHNOLOGIES, INC.0.0230.1270.2630.138
LUMIDIGM, INC.0.0840.1450.4690.233
Luminex Corporation0.1920.0170.1720.127
Luna Innovations, Inc. (F&S)0.0021.0000.2300.411
Lynntech, Inc.0.0330.6910.1300.285
MagiQ Technologies, Inc.0.0390.2580.3660.221
MAINSTREAM ENGINEERING CORP.0.0070.5400.2210.256
MARLOW INDUSTRIES, INC.0.1920.0350.3850.204
MASSIVELY PARALLEL TECHNOLOGIES, INC.0.1870.2300.5050.307
Materials & Electrochemical Research0.0061.0000.8820.629
MATERIALS MODIFICATION, INC.0.0210.5310.8330.462
MAXDEM, INC.0.1400.3130.4290.294
MESOSCOPIC DEVICES, LLC0.0410.2370.6250.301
MESOSYSTEMS TECHNOLOGY, INC.0.0390.1110.5770.242
METAL STORM, INC.0.1420.4120.4420.332
MICROCHIP BIOTECHNOLOGIES0.1920.4380.7500.460
MICROCOATING TECHNOLOGIES, INC.0.0190.3900.4690.293
MICROFAB TECHNOLOGIES, INC.0.1240.1820.3750.227
MICROLINK DEVICES0.0621.0001.0000.687
MicroStrain, Inc.0.0490.1050.6520.269
Microvision, Inc.0.1200.0370.0950.084
MIDE TECHNOLOGY CORP.0.0110.3500.7500.370
MIKRO SYSTEMS, INC.0.1870.2241.0000.470
MILLENNIUM CELL0.1920.1680.6520.337
MISSION RESEARCH CORP.0.0080.9270.9250.620
MSP CORP.0.2410.2760.3000.272
Nano Terra, Inc.0.0460.2250.6000.290
Nanocomp Technologies Inc.0.0270.1770.6520.285
NANODYNAMICS, INC.0.0790.0420.4170.179
NANOSOLAR0.1870.3740.2370.266
NANTERO, INC.0.1990.1540.1640.172
NITRONEX CORP.0.0560.1150.6520.274
nLight Photonics0.0250.0460.2380.103
NOMADICS, INC.0.0230.2600.5770.287
Nonvolatile Electronics, Inc.0.0100.1900.2730.158
NP PHOTONICS, INC.0.0350.4970.4290.320
ObjectVideo, Inc.0.0280.0840.2890.134
Ocean Power Technologies, Inc.0.2330.2870.4170.313
OEWAVES, INC.0.1140.3530.6000.356
Omnitek Partners, LLC0.0160.3060.1640.162
OPEL0.0430.4911.0000.511
OPNET TECHNOLOGIES0.0670.0370.6820.262
OPTELECOM, INC.0.1760.0810.6820.313
OPTICAL RESEARCH ASSOC.0.1870.0930.6250.302
Opticomp Corp.0.0200.1070.9380.355
OPTOMEC DESIGN CO.0.0390.1940.7140.316
Orbital Research, Inc.0.0110.2930.6820.329
Pacific Wave Industries, Inc.0.0630.2650.9380.422
PEREGRINE SEMICONDUCTOR CORP.0.0470.0490.1500.082
PHOTOBIT CORP. (PHOTOBIT, LLC)0.1960.3770.5000.358
Photodigm, Inc.0.0570.4020.5770.345
Photon-X, Inc (AL)0.0300.4330.6000.355
PHYSICAL OPTICS CORP.0.0110.7610.1520.308
PHYSICAL SCIENCES, INC.0.0020.7260.2600.329
PIASECKI AIRCRAFT CORP.0.0930.0820.6520.276
POLARONYX, INC.0.0620.5220.8820.489
Precision Combustion, Inc.0.0280.2190.3490.198
Princeton Electronic Systems0.0600.2980.9380.432
Princeton Lightwave, Inc.0.0470.3300.6820.353
PROTONEX TECHNOLOGY CORP.0.0980.1410.6820.307
QD VISION, INC.0.1790.3240.3160.273
QorTek, Inc.0.0220.3890.6000.337
QRDC, INC.0.0630.1480.8820.364
QUALLION LLC0.0380.0550.2210.105
Quantum Magnetics, Inc.0.0850.8980.5000.494
Radiation Monitoring Devices, Inc.0.0120.3430.3660.240
RAPID PATHOGEN SCREENING, INC.0.2950.2520.9880.512
RAYDIANCE, INC.0.2330.1040.8330.390
RD INSTRUMENTS0.4670.0381.0000.501
RECHARGEABLE BATTERY CORP.0.1920.3750.8330.467
REVEO, INC.0.1800.1580.0950.144
Rf Monolithics, Inc.0.1300.1750.5170.274
Rocky Research0.0640.1640.1970.142
Ross-Hime Designs, Inc.0.1161.0000.9380.685
Satcon Technology Corp.0.0310.0290.3880.149
Science & Engineering Services, Inc.0.0420.0690.9630.358
Science Research Laboratory0.0081.0000.5560.521
SECURE COMPUTING CORP.0.3730.2050.3000.293
SemiSouth Laboratories0.0471.0001.0000.682
SENSIS CORP.0.1060.0370.6960.280
Sensor Electronic Technology, Inc.0.1381.0000.1550.431
SENSORS UNLIMITED, INC.0.0730.2100.6000.294
SEQUAL TECHNOLOGIES, INC.0.1870.0440.5450.259
Skion Corp.0.1870.1820.6250.331
SOUTHWEST SCIENCES, INC.0.0630.9400.4690.490
Spectra Group Limited, Inc.0.2000.3310.7500.427
Spectral Sciences, Inc.0.0051.0000.6520.552
SPIRE CORP.0.0430.3460.1840.191
STEIN SEAL CO.0.1870.0340.8330.351
STURMAN INDUSTRIES, INC.0.0960.0780.4420.205
T NETWORKS, INC.0.3500.0990.6040.351
TALLEY DEFENSE SYSTEMS0.1040.0300.8450.326
TDA RESEARCH, INC.0.0070.8600.3660.411
Technical Research Associates, Inc.0.0621.0000.9380.667
TECHNOLOGIES & DEVICES INTERNATIONAL0.0380.2130.6000.284
TESSERA, INC.0.9770.0570.0710.368
Thermacore, Inc.0.1870.0700.3260.194
Therox, Inc.0.3330.0900.3040.242
THESEUS LOGIC, INC.0.1870.4220.9380.515
TIAX LLC0.0090.7350.4410.395
TIME DOMAIN CORP.0.1460.0900.1090.115
TINI ALLOY CO.0.1870.4130.5770.392
TOPIA TECHNOLOGY, INC.0.1870.1620.9380.429
TOUCHSTONE RESEARCH LABORATORY, LTD.0.0120.1880.3190.173
TPL, Inc.0.0170.7370.8820.545
TRANSTECH PHARMA, INC.0.1960.0680.3600.208
TRANSTECH SYSTEMS, INC.0.1920.1400.8820.405
Trex Enterprises Corp.0.0110.0920.2530.119
TRITON SYSTEMS, INC.0.0020.9700.8820.618
UES, Inc.0.0100.5071.0000.506
ULTRAMET0.0120.2940.6250.310
ULTRA-SCAN CORP.0.0410.1860.5780.268
UNI-PIXEL DISPLAYS, INC.0.2040.2820.4300.305
UNIVERSAL DISPLAY CORP.0.5140.0690.0620.215
VISIDYNE, INC.0.0460.3320.6520.343
WARWICK MILLS0.3110.0440.4410.265
WAVEFRONT RESEARCH, INC.0.0331.0000.8820.638
X-RAY OPTICAL SYSTEMS, INC.0.1870.2030.3850.258
Zebra Imaging, Inc.0.1870.0810.2580.175
ZOLO TECHNOLOGIES, INC.0.0670.2020.8820.383
ZYVEX CORP.0.1870.1010.2950.194

References

  1. Thompson, M. Effective purchasing strategy: The untapped source of competitiveness. Supply Chain Manag. 1996, 1, 6–8. [Google Scholar] [CrossRef]
  2. Mehra, S.; Inman, R.A. Purchasing management and business competitiveness in the coming decade. Prod. Plan. Control 2004, 15, 710–718. [Google Scholar] [CrossRef]
  3. Mogre, R.; Lindgreen, A.; Hingley, M. Tracing the evolution of purchasing research: Future trends and directions for purchasing practices. J. Bus. Ind. Mark. 2017, 32, 251–257. [Google Scholar] [CrossRef]
  4. OECD. Government at a Glance 2019; OECD Publishing: Paris, France, 2019. [Google Scholar] [CrossRef]
  5. Faisal, M.N.; Al-Esmael, B.; Sharif, K.J. Supplier selection for a sustainable supply chain. Benchmarking 2017, 24, 1956–1976. [Google Scholar] [CrossRef]
  6. Cheng, W.; Appolloni, A.; D’Amato, A.; Zhu, Q. Green Public Procurement, missing concepts and future trends—A critical review. J. Clean. Prod. 2018, 176, 770–784. [Google Scholar] [CrossRef]
  7. Smith, C.R.; Fernandez, S. Equity in Federal Contracting: Examining the Link between Minority Representation and Federal Procurement Decisions. Public Adm. Rev. 2010, 70, 87–96. [Google Scholar] [CrossRef]
  8. Thai, K.V. Public procurement re-examined. J. Public Procure. 2001, 1, 9–50. [Google Scholar] [CrossRef] [Green Version]
  9. Hafsa, F.; Darnall, N.; Bretschneider, S. Estimating the True Size of Public Procurement to Assess Sustainability Impact. Sustainability 2021, 13, 1448. [Google Scholar] [CrossRef]
  10. Dutta, P.; Jaikumar, B.; Arora, M.S. Applications of data envelopment analysis in supplier selection between 2000 and 2020: A literature review. Ann. Oper. Res. 2021. [Google Scholar] [CrossRef]
  11. Simar, L.; Wilson, P.W. Estimation and inference in two-stage, semi-parametric models of production processes. J. Econom. 2007, 136, 31–64. [Google Scholar] [CrossRef]
  12. Joshi, A.M.; Inouye, T.M.; Robinson, J.A. How does agency workforce diversity influence Federal R&D funding of minority and women technology entrepreneurs? An analysis of the SBIR and STTR programs, 2001–2011. Small Bus. Econ. 2018, 50, 499–519. [Google Scholar]
  13. Ryu, Y. Accelerating the Transition of Technologies Created through the U.S. Department of Defense Small Business Innovation Research Program; RAND Corporation: Santa Monica, CA, USA, 2017. [Google Scholar] [CrossRef]
  14. Link, A.N.; Scott, J.T. Private Investor Participation and Commercialization Rates for Government-sponsored Research and Development: Would a Prediction Market Improve the Performance of the SBIR Programme? Economica 2009, 76, 264–281. [Google Scholar] [CrossRef] [Green Version]
  15. SBA. Small Business Innovation Research (SBIR) and Small Business Technology Transfer (STTR) Program: Policy Directive; U.S. Small Business Administration: Washington, DC, USA, 2019. Available online: https://www.sbir.gov/sites/default/files/SBIR-STTR_Policy_Directive_2019.pdf (accessed on 10 March 2021).
  16. National Research Council. An Assessment of the Small Business Innovation Research Program; National Academies Press: Washington, DC, USA, 2008. [Google Scholar]
  17. National Research Council. SBIR at the Department of Defense; National Academies Press: Washington, DC, USA, 2014. [Google Scholar]
  18. Held, B.J.; Edison, T.R.; Pfleeger, S.L.; Anton, P.S.; Clancy, J. Evaluation and Recommendations for Improvement of the Department of Defense Small Business Innovation Research (SBIR) Program; RAND Corporation: Santa Monica, CA, USA, 2006. [Google Scholar]
  19. Lerner, J. The government as venture capitalist: The long-run impact of the SBIR program. J. Priv. Equity 2000, 3, 55–78. [Google Scholar] [CrossRef]
  20. Audretsch, D.B.; Link, A.N.; Scott, J.T. Public/private technology partnerships: Evaluating SBIR-supported research. Res. Policy 2002, 31, 145–158. [Google Scholar] [CrossRef]
  21. Link, A.N.; Scott, J.T. Government as entrepreneur: Evaluating the commercialization success of SBIR projects. Res. Policy 2010, 39, 589–601. [Google Scholar] [CrossRef] [Green Version]
  22. Hawkins, T.; Gravier, M.; Randall, W.S. Socio-economic sourcing: Benefits of small business set-asides in public procurement. J. Public Procure. 2018, 18, 217–239. [Google Scholar] [CrossRef]
  23. U.S. Small Business Administration. Small Business Procurement Scorecard Overview. Available online: https://www.sba.gov/document/support-small-business-procurement-scorecard-overview (accessed on 10 June 2021).
  24. U.S. Small Business Administration. Department of Defense Contracting Scorecard. Available online: https://www.sba.gov/document/support-department-defense-contracting-scorecard (accessed on 10 June 2021).
  25. Clark, M.; Moutray, C. The future of small businesses in the U.S. federal government marketplace. J. Public Procure. 2004, 4, 450–470. [Google Scholar] [CrossRef]
  26. Herrington, R.N. Five years in: A review of the women-owned small business federal contract program. Public Contract Law J. 2016, 45, 359–382. [Google Scholar]
  27. Brammer, S.; Walker, H. Sustainable procurement in the public sector: An international comparative study. Int. J. Oper. Prod. Manag. 2011, 31, 452–476. [Google Scholar] [CrossRef]
  28. Walker, H.; Miemczyk, J.; Johnsen, T.; Spencer, R. Sustainable procurement: Past, present and future. J. Purch. Supply Manag. 2012, 18, 201–206. [Google Scholar] [CrossRef]
  29. Stritch, J.M.; Bretschneider, S.; Darnall, N.; Hsueh, L.; Chen, Y. Sustainability Policy Objectives, Centralized Decision Making, and Efficiency in Public Procurement Processes in U.S. Local Governments. Sustainability 2020, 12, 6934. [Google Scholar] [CrossRef]
  30. Stević, Ž.; Pamučar, D.; Puška, A.; Chatterjee, P. Sustainable supplier selection in healthcare industries using a new MCDM method: Measurement of alternatives and ranking according to COmpromise solution (MARCOS). Comput. Ind. Eng. 2020, 140, 106231. [Google Scholar] [CrossRef]
  31. Milosavljević, M.; Dobrota, M.; Milanović, N. A New Approach to the Evaluation of Public Procurement Efficiency among European Countries. Eur. Rev. 2018, 27, 246–259. [Google Scholar] [CrossRef]
  32. Niewerth, S.; Vogt, P.; Thewes, M. Tender evaluation through efficiency analysis for public construction contracts. Front. Eng. Manag. 2020. [Google Scholar] [CrossRef]
  33. Yu, M.-C.; Su, M.-H. Using Fuzzy DEA for Green Suppliers Selection Considering Carbon Footprints. Sustainability 2017, 9, 495. [Google Scholar] [CrossRef] [Green Version]
  34. Amindoust, A. Supplier selection considering sustainability measures: An application of weight restriction fuzzy-DEA approach. RAIRO Rech. Opér. 2018, 52, 981–1001. [Google Scholar] [CrossRef] [Green Version]
  35. Ghoushchi, S.J.; Milan, M.D.; Rezaee, M.J. Evaluation and selection of sustainable suppliers in supply chain using new GP-DEA model with imprecise data. J. Ind. Eng. Int. 2018, 14, 613–625. [Google Scholar] [CrossRef] [Green Version]
  36. Nemati, M.; Reza Farzipoor, S.; Reza Kazemi, M. A data envelopment analysis approach by partial impacts between inputs and desirable-undesirable outputs for sustainable supplier selection problem. Ind. Manag. Data Syst. 2020, 121, 809–838. [Google Scholar] [CrossRef]
  37. Zarbakhshnia, N.; Jaghdani, T.J. Sustainable supplier evaluation and selection with a novel two-stage DEA model in the presence of uncontrollable inputs and undesirable outputs: A plastic case study. Int. J. Adv. Manuf. Technol. 2018, 97, 2933–2945. [Google Scholar] [CrossRef]
  38. Milosavljevic, M.; Milanovic, N.; Benkovic, S. Politics, Policies and Public Procurement Efficiency: A Quantitative Study of 25 European Countries. Lex Localis 2016, 14, 537–558. [Google Scholar] [CrossRef]
  39. Dotoli, M.; Epicoco, N.; Falagario, M. Multi-Criteria Decision Making techniques for the management of public procurement tenders: A case study. Appl. Soft Comput. 2020, 88, 106064. [Google Scholar] [CrossRef]
  40. Hicks, D.; Hegde, D. Highly innovative small firms in the markets for technology. Res. Policy 2005, 34, 703–716. [Google Scholar] [CrossRef]
  41. Xue, J.; Klein, P.G. Regional determinants of technology entrepreneurship. Int. J. Entrep. Ventur. 2010, 1, 291–308. [Google Scholar] [CrossRef]
  42. SBIR/STTR America’s Seed Fund. Available online: https://www.sbir.gov/ (accessed on 10 January 2021).
  43. Man, T.W.; Lau, T.; Chan, K. The competitiveness of small and medium enterprises: A conceptualization with focus on entrepreneurial competencies. J. Bus. Ventur. 2002, 17, 123–142. [Google Scholar] [CrossRef]
  44. Balkin, D.B.; Gomez-Mejia, L.R. Determinants of R and D compensation strategies in the high tech industry. Pers. Psychol. 1984, 37, 635–650. [Google Scholar] [CrossRef]
  45. Stuart, T.E.; Sorenson, O. Strategic networks and entrepreneurial ventures. Strateg. Entrep. J. 2007, 1, 211–227. [Google Scholar] [CrossRef]
  46. Gilsing, V.; Nooteboom, B.; Vanhaverbeke, W.; Duysters, G.; van den Oord, A. Network embeddedness and the exploration of novel technologies: Technological distance, betweenness centrality and density. Res. Policy 2008, 37, 1717–1731. [Google Scholar] [CrossRef]
  47. Choi, J.; Yeniyurt, S. Contingency distance factors and international research and development (R&D), marketing, and manufacturing alliance formations. Int. Bus. Rev. 2015, 24, 1061–1071. [Google Scholar]
  48. Link, A.N.; Scott, J.T. Propensity to Patent and Firm Size for Small R&D-Intensive Firms. Rev. Ind. Organ. 2018, 52, 561–587. [Google Scholar]
  49. Conti, A.; Thursby, J.; Thursby, M. Patents as signals for startup financing. J. Ind. Econ. 2013, 61, 592–622. [Google Scholar] [CrossRef] [Green Version]
  50. Casson, M.; Giusta, M.D. Entrepreneurship and social capital: Analysing the impact of social networks on entrepreneurial activity from a rational action perspective. Int. Small Bus. J. 2007, 25, 220–244. [Google Scholar] [CrossRef]
  51. Adams, W.; Adams, W.J. The military-industrial complex: A market structure analysis. Am. Econ. Rev. 1972, 62, 279–287. [Google Scholar]
  52. Powell, W.W.; Koput, K.W.; Smith-Doerr, L.; Owen-Smith, J. Network position and firm performance: Organizational returns to collaboration in the biotechnology industry. Res. Sociol. Organ. 1999, 16, 129–159. [Google Scholar]
  53. Wang, Q.; Hang, Y.; Sun, L.; Zhao, Z. Two-stage innovation efficiency of new energy enterprises in China: A non-radial DEA approach. Technol. Forecast. Soc. Chang. 2016, 112, 254–261. [Google Scholar] [CrossRef]
  54. Carayannis, E.G.; Grigoroudis, E.; Goletsis, Y. A multilevel and multistage efficiency evaluation of innovation systems: A multiobjective DEA approach. Expert Syst. Appl. 2016, 62, 63–80. [Google Scholar] [CrossRef]
  55. Appelbaum, S.H.; Kamal, R. An analysis of the utilization and effectiveness of non-financial incentives in small business. J. Manag. Dev. 2000, 19, 733–763. [Google Scholar] [CrossRef]
  56. Cooper, R.S. Purpose and performance of the Small Business Innovation Research (SBIR) program. Small Bus. Econ. 2003, 20, 137–151. [Google Scholar] [CrossRef]
  57. Meuleman, M.; De Maeseneire, W. Do R&D subsidies affect SMEs’ access to external financing? Res. Policy 2012, 41, 580–591. [Google Scholar]
  58. Griliches, Z. Issues in assessing the contribution of research and development to productivity growth. Bell J. Econ. 1979, 92–116. [Google Scholar] [CrossRef]
  59. Jaffe, A.B. Real effects of academic research. Am. Econ. Rev. 1989, 957–970. [Google Scholar]
  60. Zimmerman, D.W.; Zumbo, B.D. Relative Power of the Wilcoxon Test, the Friedman Test, and Repeated-Measures ANOVA on Ranks. J. Exp. Educ. 1993, 62, 75–86. [Google Scholar] [CrossRef]
  61. Hsu, D.H. Technology-based entrepreneurship. In The Handbook of Technology and Innovation Management; Shane, S., Ed.; Wiley: New York, NY, USA, 2008; pp. 367–388. [Google Scholar]
  62. Lee, J.; Kim, C.; Choi, G. Exploring data envelopment analysis for measuring collaborated innovation efficiency of small and medium-sized enterprises in Korea. Eur. J. Oper. Res. 2019, 278, 533–545. [Google Scholar] [CrossRef]
  63. Alvarez, R.; Crespi, G. Determinants of technical efficiency in small firms. Small Bus. Econ. 2003, 20, 233–244. [Google Scholar] [CrossRef]
  64. Grilo, A.; Santos, J. Measuring efficiency and productivity growth of new technology-based firms in business incubators: The Portuguese case study of Madan Parque. Sci. World J. 2015, 936252. [Google Scholar] [CrossRef] [Green Version]
  65. Oluka, P.N.; Okoche, M.; Mugurusi, G. Public procurement and competitiveness of women-owned businesses: A structural equation model (SEM) for gender-responsive procurement in Uganda. World J. Entrepren. Manag. Sustain. Dev. 2020. [Google Scholar] [CrossRef]
  66. GAO. Minority- and Women-Owned Business Contracting: Analysis of DOD Contract Awards, Fiscal Years 2010–2016; U.S. Government Accountability Office: Washington, DC, USA, 2017.
  67. McGregor, J.; Tweed, D. Profiling a New Generation of Female Small Business Owners in New Zealand: Networking, Mentoring and Growth. Gend. Work Organ. 2002, 9, 420–438. [Google Scholar] [CrossRef]
  68. Manello, A.; Cisi, M.; Devicienti, F.; Vannoni, D. Networking: A business for women. Small Bus. Econ. 2019, 1–20. [Google Scholar] [CrossRef]
  69. Sueyoshi, T.; Goto, M. Performance assessment of Japanese electric power industry: DEA measurement with future impreciseness. Energies 2020, 13, 490. [Google Scholar] [CrossRef] [Green Version]
  70. Sueyoshi, T.; Goto, M. Environmental Assessment on Energy and Sustainability by Data Envelopment Analysis; John Wiley & Sons: London, UK, 2018. [Google Scholar]
  71. Sueyoshi, T.; Goto, M. Performance assessment of Japanese electricity and gas companies during 2002–2018: Three DEA approaches. Energies 2021, 14, 1705. [Google Scholar] [CrossRef]
  72. Sueyoshi, T.; Yuan, Y. Social sustainability measured by intermediate approach for DEA environmental assessment: Chinese regional planning for economic development and pollution prevention. Energy Econ. 2017, 66, 154–166. [Google Scholar] [CrossRef]
  73. Sueyoshi, T.; Yuan, Y.; Goto, M. A literature study for DEA applied to energy and environment. Energy Econ. 2017, 62, 104–124. [Google Scholar] [CrossRef]
  74. Sueyoshi, T.; Ryu, Y. Performance Assessment of the semiconductor industry: Measured by DEA environmental assessment. Energies 2020, 13, 5998. [Google Scholar] [CrossRef]
  75. Sueyoshi, T.; Liu, X.; Li, A. Evaluating the performance of Chinese fossil fuel power by data envelopment analysis: An application of three intermediate approaches in a time horizon. J. Clean. Prod. 2020, 227, 121992. [Google Scholar] [CrossRef]
  76. Sueyoshi, T.; Ryu, Y.; Yun, J.-Y. Coronavirus-19 response and prospects of clean/sustainable energy transition in industrial nations: New Environmental assessment. Energies 2021, 14, 1174. [Google Scholar] [CrossRef]
Figure 1. Data sources of variables.
Sustainability 13 07220 g001
Figure 2. SBIR funding network.
Sustainability 13 07220 g002
Figure 3. Process of public procurement from technology-based small suppliers.
Sustainability 13 07220 g003
Figure 4. Distribution of efficiency scores: (a) R&D; (b) network building; (c) commercialization; and (d) overall. Note y-axis: frequency; x-axis: efficiency score.
Sustainability 13 07220 g004
Table 1. Government-wide and DoD’s small business contracting achievement in 2019.
Small Business Contracting AchievementSmall BusinessWomen-Owned Small BusinessSMALL Disadvantaged BusinessService Disabled Veteran-Owned Small BusinessHUBZone Located Small Business
Government-widePrime contracting26.50%5.19%10.29%4.39%2.28%
Subcontracting33.27%5.25%4.17%1.95%1.37%
DoDPrime contracting24.16%4.25%8.56%3.25%1.88%
Subcontracting38.60%5.20%4.00%2.10%1.60%
Source: U.S. Small Business Administration [23,24].
Table 2. Applications of DEA to sustainable procurement.
Author(s)MethodSummaryFactors
Niewerth et al. [32]DEAThis study analyzed the performance of construction tenders in the European Union.Input: life-cycle costs; construction time
Output: environmental concept
Yu and Su [33]Fuzzy DEAThis study examined the performance of Taiwanese sustainable suppliers in the information and communication industry.Input: production costs; lead time; supply chain carbon footprints
Output: quality; demand quantity
Amindoust [34]Fuzzy DEAThis study assessed the performance of sustainable suppliers in the automotive parts industry in the Middle East.Criterion: quality; delivery; technology level; after-sales services; environmental management system; pollution control; work safety and labor health; ethics
Ghoushchi et al. [35]DEA with imprecise dataThis study explored the performance of Iranian sustainable suppliers in the petrochemical industry.Input: total cost of shipments; the number of shipments; work safety and labor health costs; supplier reputation; eco-design costs
Output: the number of the bills received from the supplier without errors; the number of the shipments to arrive on time; the interests and rights of employees; supplier’s green image; green management system
Nemati et al. [36]DEA with partial impacts between inputs, good and bad outputsThis study investigated the sustainability performance of Iranian cable suppliers.Input: eco-design cost; the number of shipments per month; total cost of shipments; cost of work safety and labor health
Output: the number of bills without error; the number of on-time delivered goods; the number of sent non-defective parts; the number of sent defective parts
Zarbakhshnia and Jaghdani [37]Network DEAThis study evaluated the performance of Iranian sustainable suppliers in the plastic packing strap industry.Input: eco-design costs; logistics costs; the number of tune raw materials; reliability costs
Intermediate: hazardous substances; the number of sustainable products; fuel cost; cost of labor healthOutput: the number of occupation opportunities; the number of delivered products; CO2 emissions
Milosavljević et al. [38]Benefit-of-doubts DEAThis study compared the public procurement efficiency of EU member states.Input (of technological dimension): high-tech exports; patent application; R&D exports
Output: one bidder; no calls for bids; aggregation; award criteria; decision speed; reporting quality
Dotoli et al. [39]Fuzzy DEA and other multi-criteria decision making techniquesThis study ranked the public procurement performance of tenders at the European Institution.Input: price
Output (quality factors): technical (e.g., ergonomics, functionality); certifications (e.g., product quality, production quality); conditions (e.g., warranty, post-sales)
Table 3. Descriptive data statistics.
VarDefinitionObsMeanSDMinMax
Federal_procureAction obligation of federal procurement contracts (USD million)25298.14292.7650.192433
No_patentsNumber of patent applications25249.6194.773151251
No_connectionsEigenvector centrality in the SBIR funding network2520.0240.0120.0010.045
SBIR_awardsAmount of SBIR awards (USD million)2525.7811.2070.29103.27
No_employeesNumber of employees25286.17109.1062480
Tech_distanceTechnological distance between suppliers and DoD2520.38450.2080.00020.8805
AgeAge of firms25222.1714.9342122
HUBZone_locatedDummy (0 or 1) whether located in HUBZone 1 or not2520.0120.10901
Urban_locatedDummy (0 or 1) whether located in urban areas 2 or not2520.3690.48401
Minority_ownedDummy (0 or 1) whether owned by minority2520.0400.19601
Women_ownedDummy (0 or 1) whether owned by women2520.0440.20501
Veteran_ownedDummy (0 or 1) whether owned by veteran2340.0340.18201
1 HUBZone: Historically Underutilized Business Zones. SBA and other federal agencies have policy programs to provide preferential access to more federal contracting opportunities to small businesses in the HUBZone; 2 urban areas: areas with a population of 50,000 or more following the U.S. Census definition.
Table 4. Statistics of efficiency scores.
EfficiencyObsMeanMinMax
R&D2520.32650.01551
Network building2520.29830.01331
Commercialization2520.57010.06191
Overall2520.39830.10090.9608
Table 5. Results of truncated regression analyses.
Variablewithout Bootstrapwith BootstrapDifference
Model 1aModel 1bModel 2aModel 2b
SBIR_awards −0.0323 ***(−4.46)−0.0387 ***(−5.09)−0.0333 ***(−4.40)−0.0391 ***(−4.95)−0.0004
No_employees−0.0624 ***(−10.34)−0.0732 ***(−9.57)−0.0634 ***(−10.07)−0.0741 ***(−9.41)−0.0009
Tech_distance−0.1237 ***(−3.85)−0.1302 ***(−3.91)−0.1302 ***(−3.96)−0.1364 ***(−3.98)−0.0062
No_patents−0.0756 ***(−7.65)−0.0793 ***(−7.74)−0.0845 ***(−7.60)−0.0882 ***(−7.86)−0.0089
No_connections2.3012 ***(3.12)1.6901 **(2.05)2.4362 ***(3.24)1.8013 **(2.15)0.1112
Federal_procure 0.0184 ***(3.16) 0.0184 ***(3.02)0.0000
Age 0.0045(0.34) 0.0052(0.38)0.0007
Urban_located −0.0152(−1.09) −0.0155(−1.06)−0.0003
HUBZone_located 0.0449(0.76) 0.0483(0.78)0.0034
Minority_owned 0.0134(0.39) 0.0117(0.34)−0.0017
Women_owned 0.0598 *(1.94) 0.0589 *(1.81)−0.0009
Veteran_owned −0.0232(−0.63) −0.0241(−0.65)−0.0009
AIC−416.80−392.42−424.43−399.46−7.04
BIC−392.09−344.05−399.73−351.09−7.04
natural log; *** significant at 1%, ** significant at 5%, * significant at 10%; values in the parenthesis: z score; AIC: Akaike’s information criteria; BIC: Bayesian information criteria.
Table 6. Coefficients of women-owned suppliers over public procurement process.
VariableR&DNetwork BuildingCommercializationOverall
Women_owned−0.0056 (−0.16)0.1287 *** (2.71)0.0013 (0.04)0.0598 * (1.94)
*** significant at 1%, * significant at 10%.
Publisher’s Note: MDPI stays neutral with regard to jurisdictional claims in published maps and institutional affiliations.

