Article

Study of the Tourism Competitiveness Model of the World Economic Forum Using Rasch’s Mathematical Model: The Case of Portugal

by
José Alberto Martínez-González
*,
Vidina Tais Díaz-Padilla
and
Eduardo Parra-López
Department of Business Management and Economic History, Faculty of Economics, Business and Tourism, Universidad de La Laguna, 38206 Santa Cruz de Tenerife, Spain
*
Author to whom correspondence should be addressed.
Sustainability 2021, 13(13), 7169; https://doi.org/10.3390/su13137169
Submission received: 31 May 2021 / Revised: 23 June 2021 / Accepted: 23 June 2021 / Published: 25 June 2021

Abstract

:
In this paper, the potential of the World Economic Forum (WEF) model to analyze tourism competitiveness is studied. The study aims to analyze the WEF model’s validity, reliability and dimensionality. It attempts to determine the WEF model’s potential for studying tourism destinations’ competitiveness in an integrated context. Finally, using the WEF model, Portugal’s competitiveness is analyzed in an integrated and benchmarking context. The methodology used in this study is the Rasch mathematical model, a methodology that has been effectively demonstrated in social sciences. Competitiveness data from the latest available WEF Travel and Tourism Competitiveness Report (TTCR-2019) has been used. The results show that the WEF model is statistically valid and reliable for studying competitiveness in tourism. Likewise, the WEF model’s high potential for the joint study of competitiveness and individual countries in an integrated and benchmarking context is confirmed. The study facilitates the development of policies to improve tourism competitiveness.

1. Introduction

Tourism is a catalyst for development, economic growth and employment in many countries [1,2]. (In this study, the terms country and tourist destination are used interchangeably.) Indeed, it is one of the most critical sectors for many countries as well as one of the fastest growing. Additionally, tourism favors the development of other sectors with which it is directly or indirectly related [3,4,5]. However, tourism destinations need to make continuous efforts to maintain favorable competitive positions in the world tourism market [3,4,6]. These efforts are driven by the growing, global competition in the industry, increasing consumer demands and the appearance of new destinations [7,8,9]. Thus, it is necessary to understand how competitiveness is generated and consolidated. This is why the study of tourism competitiveness currently has such high interest [10,11,12].
However, despite the interest in understanding and promoting tourism destinations’ competitiveness, there is currently no universally accepted definition of the construct, nor is there a globally agreed method of analysis or competitiveness measurement in the literature [6,13]. This is because competitiveness in tourism is a multidimensional, complex, comparative, and controversial reality [9,12,14]. Added to this, tourism destinations themselves are complex entities to manage due to the immaterial nature of tourism, as well as the wide variety of actors involved who have different concerns and interests [15,16,17].
Among the definitions of tourism competitiveness, those provided by Crouch and Ritchie [18] stand out in the literature. They define competitiveness as the capacity of a tourism destination to increase tourist spending, attract more visitors and provide them with satisfactory experiences profitably and sustainably [6,19,20]. For Hassan [21], a tourism destination’s competitiveness refers to its ability to create products with added value. This will allow a destination to maintain its position in the market in an efficient and sustainable way [1,22,23].
Numerous studies and models have been developed that address the competitiveness of tourism destinations, especially since the 1990s [24,25,26]. Most studies on tourism competitiveness have been based on the contributions of Crouch and Ritchie [18] and Dwyer and Kim [27], and they can be classified into three categories. First, there is a wide range of models that identify the forces or factors that drive competitiveness [28,29,30]. These studies are the most numerous and include various dimensions: economic, sociocultural, environmental, political and technological [31,32,33]. A second group comprises studies that have focused on a particular aspect of tourism destination competitiveness, such as visitor satisfaction or typology [34,35]. Finally, another group of studies have investigated the relative position or outstanding capabilities of a particular destination [36,37,38]. This study falls within the first and third groups.
It should be noted that many studies have been carried out using composite indicators [7,13,25]. Normally, these kinds of indicators are designed from secondary data from official statistics and soft data obtained through questionnaires applied to stakeholders [11,39,40]. The indicators have been prepared, either by certain authors or researchers or by renowned institutions, such as the World Economic Forum (WEF). The WEF annually produces the Travel and Tourism Competitiveness Index (TTCI), included in the periodic Travel and Tourism Competitiveness Report (TTCR-2019) [41,42,43].
Despite their popularity, studies on tourism competitiveness have been scarce and have received criticism, particularly those based on indicators [7,9,44]. Some criticism concerns the validity and reliability of the methodologies and mathematical tools used [39,45]. The excessively simplistic nature of certain studies has also been mentioned in the literature, either because of their popularity or because they are fashionable at a given time, and there seems to be a lack of an overall approach [7,21,46,47]. Criticism of studies’ simplistic nature is also related to the small number of variables included in certain studies [48,49]. Other authors comment that studies on the determinants of competitiveness in tourism lack applicability for policy formulation [8,50]. The criticisms have been particularly directed at the competitiveness model prepared by the WEF, its periodic TTCR-2019 and the TTCI indicator that the WEF elaborates [11,44,51].
In this study, the WEF competitiveness model’s statistical significance is analyzed using the Rasch model. Specifically, its validity, reliability, unidimensional nature and solidity of its categories are evaluated. The WEF model’s potential to analyze destinations’ competitiveness globally and in the overall context concerning the number of countries and pillars are also reviewed herein. Finally, the WEF model’s potential for the comparative study of a specific tourism destination in an overall context and through benchmarking is analyzed.
The country or tourism destination selected for our third objective is Portugal. This country ranks 14 in terms of global tourism competitiveness out of 140 countries (TTCR-2019), as verified by applying the Rasch model used in this study. The Rasch model is an effective mathematical-statistical methodology that has rarely been used in this field and is an alternative to the Classical Theory of the Test. In addition to the methodological advantages, the Rasch model has an essential characteristic for studying competitiveness at the regional level. Through this methodology, a global and integrated competitiveness model is generated from the observed data. The generated model, to which the initially observed data are adjusted, allows a joint study of competitiveness within a global framework of pillars and countries. Additionally, the Rasch model allows studying competitiveness in a specific country within a benchmarking framework and in a global context of countries and pillars. Therefore, this study is part of a set of works that aim to study the limitations and criticisms received by the WEF model, thereby answering some of the questions raised by authors [11,39].

2. Literature Review

Nowadays, competitiveness has become an essential element in the creation of policies and strategies that ensure the development of tourism destinations in response to the constant changes of a globalized world [44,51]. Research conducted since the early 1990s has gradually clarified the nature and structure of competitiveness of tourism destinations. Some of this research has focused on particular elements of destination competitiveness, such as price competitiveness. By contrast, other research has aimed at developing a more complete understanding of destination competitiveness. Thus, general competitiveness theories have been assimilated and adapted, and conceptual models have also been developed that adopt broad ideas and approaches to the specific features of the tourism industry [48,52]. The review of theoretical models of competitiveness in tourism carried out by Ortiz, Robles and Guzmá in 2018 [53] is particularly noteworthy. It can be affirmed that the literature identifies two groups of studies and models on the determining factors of tourism destination competitiveness: those developed by authors or researchers and those developed by institutions of recognized prestige [50,53].

2.1. Competitiveness Models Developed by Researchers

Regarding this group, the 1990 Porter model [54] has been widely used in initial studies on tourism competitiveness. Porter’s Diamond model comprises four main competitive advantage factors: strategy, structure, and company rivalry; demand conditions; supporting industries; and factor conditions. This model has been subject to criticism for its high level of abstraction and ambiguity, as well as its exclusion of independent variables (all the variables of the model are related to each other) [55]. In the literature, a great deal of attention has also been paid to the model of Crouch and Ritchie [18] and that of Dwyer and Kim [27]. The Crouch and Ritchie model is conceptual, not predictive, and is based on the works of Porter [54]. The model includes four essential factors of competitiveness: fundamental sources to build a successful tourism industry; main attractions and resources; management of destinations; and rating factors [49,55,56]. In 2010, Ritchie and Crouch added a fifth factor related to the management, planning and development of the tourism destination [33,57]. It should be noted that Crouch and Ritchie [18] warned of the rapidly changing and evolving nature of the environment and advised tourism destination managers to adapt the destination to the reality of the moment periodically. Dwyer and Kim [27] formulated their model on the competitiveness of tourism destinations, taking as a reference the Crouch and Ritchie model [18]. In their model, the authors consider that competitiveness is not a final objective but an intermediate objective to achieve economic prosperity in the tourism destination [58,59,60]. The authors differentiate between “legacy resources” and “created resources.” They consider that these two types of resources, together with the “complementary factors and resources,” have their own identities and determine whether a destination is attractive or not. Therefore, the tourism industry’s success in a destination must be based on these resources and factors since they constitute the basis of tourism competitiveness [50,61]. Other more recent models of tourism competitiveness and based on the previous two are [32]: the Hong model [47], the Navickas and Malakauskaite model [62], the Cvelbar, Dwyer, Koman and Mihalič model [63] and the Andrades, Caldito, Sánchez-Rivero and Pulido-Fernández model [64]. Instead of the predominantly economic or social approaches, today, the sustainable approach to competitiveness started with Ritchie and Crouch [18] and Hassan [21].

2.2. Models of Competitiveness by Institutions: The Model of the World Economic Forum

Regarding the second group of studies, the literature highlights the World Economic Forum (WEF) model. The WEF periodically prepares the annual Travel and Tourism Competitiveness Report (TTCR-2019) and the Travel and Tourism Competitiveness Index (TTCI), included in the said report [11,39,50]. Both the report and the index facilitate the evaluation of competitiveness in tourism, the decision-making process and the development of policies that make a destination attractive for international tourism [2,12,51]. Additionally, TTCR-2019 and TTCI are valuable tools to analyze destinations’ competitiveness in a benchmarking context and with a macro-level perspective [2].
The TTCI index is a central element of the WEF model. TTCI measures “the set of factors and policies that allow the sustainable development of the travel and tourism sector, which in turn, contributes to the development and competitiveness of a country” [5] (p. 3). Comparison between countries using this index is facilitated because the TTCI always uses the same variables and measures. As its structure and formulation are constant over time, TTCI allows a longitudinal perspective to be adopted [11,13,56]. The TTCI index structure is made up of 90 indicators grouped into 14 pillars classified into four sub-indexes: conducive environment; travel policies and conducive conditions; infrastructures; natural and cultural resources (Table 1). These four sub-indexes are aggregated in the TTCI by an unweighted average of the sub-indexes. Although the four sub-indexes are not weighted, the columns are implicitly weighted because the sub-indexes have different numbers of columns. Therefore, the sub-indexes with fewer pillars are more significant in the calculation of the general index (TTCI) [12,65]. Concerning obtaining data for the TTCI index preparation, the indicator integrates soft data from an executive opinion survey and hard data from other sources. Data are standardized in a range from 1 to 7 points, which correspond to the lowest and highest valuation, respectively [2,66,67]. Although not all authors agree [44] (p. 729), the combination of both types of data constitutes the best option for developing these types of indicators [39,68].

2.3. Limitations and Criticisms of the World Economic Forum Model

The literature has highlighted that both the TTCR-2019 and the TTCI index of the WEF have high credibility, high data precision and a high international presence, visibility and reputation [13,45]. However, despite the popularity of the model and the methodological and content reviews carried out by WEF (e.g., 2015), the WEF model has been subject to criticism, and some authors have highlighted certain limitations [25]. Criticisms and limitations have been basically related to methodological aspects and questions of content and applicability that could affect its validity and reliability [2,51,63]. Concerning the TTCI index, some authors have highlighted the variables’ arbitrary weighting within each pillar [45]. It has also been shown that the use of simple averages (not weighted) for the calculation of the TTCI index may not be appropriate since not all indicators have the same effect on competitiveness [1]. Additionally, it has been highlighted that the mean may not be representative because the pillars are made up of different numbers of indicators (between 3 and 12), with some indicators being able to contribute more to the index than others [11,39]. Regarding the limitations of content and applicability, criticisms have been related to the use of weakly justified variables at a theoretical level and comparing countries with different levels of development. The criticisms received by the WEF model have also been related to using the model in local destinations belonging to regions with a lower level of entity than a country [43,56]. Additionally, it has been suggested that the TTCI has low explanatory power because, once the global index is calculated, the backward analytical process is complicated. Finally, it has been argued that some relevant data for the comparative study of competitiveness could be hidden in the design of the indicators [2,3,44].
Some studies have been carried out to counteract the limitations and criticisms received by the WEF model, and particularly the TTCI indicator [39] (Gómez-Vega and Picazo-Tadeo, 2019). For example, Mazanec and Ring [44] used the square path modelling method to construct a pillar weighting scheme. Wu et al. [51] used neural network analysis for the same purpose. Croes and Kubickova [2] determined the pillars’ weighting based on their correlation with the TTCI. Pérez-Moreno et al. [52] and Pulido-Fernández and Rodríguez-Díaz [45] used a multi-criteria model as an alternative approach to solving the problem of adding the index. Rodríguez-Díaz and Pulido-Fernández [11] and Salinas-Fernández et al. [13] used exogenous weighting methods, such as factor analysis, proposing an aggregation system in different scenarios that allow correcting the decompensation in the context of the pillars.

3. Research Methodology

3.1. Data Collection, Variables and Sample Profile

Data have been obtained from the World Economic Forum (WEF) platform (Available online: www.weforum.org (accessed on 25 April 2021)). Specifically, the information included in the Travel and Tourism Competitiveness Report (TTCR-2019) and in the databases available in Excel for 2019 has been used; 2019 is the most recent year available.
The latent variable (not observed) is “competitiveness in tourism”. The observed variables are the Travel and Tourism Competitiveness Index (TTCI) and the 14 competitiveness pillars included in the TTCR-2019 that the WEF uses for the index calculations (Table 1). It was found that the inclusion of the TTCI index among the pillars, as one more pillar, did not affect the results obtained if only the 14 pillars were taken into account. The reason is that the TTCI is calculated exclusively from the pillars.
The total number of countries included in the TTCR-2019 report (N = 140) has been used. Therefore, the entire population included in the TTCR-2019 has been studied and not just a representative sample. In particular, and to achieve the third objective of this study, Portugal has been selected. This country occupies the 14th position in the TTCI ranking, leaving precisely 90% of the countries below that ranking. The tourism sector in Portugal has been a cornerstone in the country’s recovery after a prolonged economic and social crisis. The tourism sector is made up of many small companies that carry out a multitude of key activities for the country’s economic and social development [69]. Tourism in Portugal accounts for more than 25% of GDP, and it has grown since 2011 by more than 10% annually and contributes more than 15% to employment in the country. Regarding the sustainability agenda, the growth of tourism in Portugal has shown urban pressures with social and environmental effects, increasing greenhouse gas emissions, higher levels of pollution and pressure on ecosystems derived from the influx of tourists. Furthermore, as a consequence of expanding local accommodation in cities, real estate and rental prices increased, forcing residents to move out of city centers. Portugal has implemented a 2027 Tourism Strategy to promote sustainable development. The objective is to position itself as one of the world’s most competitive and sustainable tourist destinations. Among its pillars, the boost to the economy by increasing the tourism sector’s competitiveness stands out. Despite its importance, tourism and tourist competitiveness in Portugal have been little studied [70]. The results of this study, therefore, may be helpful for Portugal to overcome the pandemic crisis, implement the 2027 Tourism Strategy mentioned above, and achieve its objectives of sustainable tourism competitiveness.

3.2. Data Analysis

The Rasch model (RM) [71,72] has been used in this study. The ordered category or rating scale model developed by Andrich [73,74] has been selected. It is an ideal model for the treatment of information from ordinal multiple-category scoring scales, as is the case of Likert-type scales [75,76,77]. The application of the RM in the context of business, economy and tourism constitutes one of the most recent methodological contributions in this field, after its growth in other disciplines such as psychology, education and medicine [78,79,80]. The RM proposes that the observed data can be explained based on two parameters: the ability of the subjects (countries) and the difficulty of the items (pillars) [81,82,83]. The RM is a joint probability analytical model, as it uses a standard measure to analyze countries and pillars: the logit scale [84]. The logit transforms the natural logarithm of the probability of a correct answer or score. The logit scale can vary from minus to plus infinity, although in most cases, the values are in the range (−5.00, +5.00). Conventionally, point 0 corresponds to the mean of the pillars. Figure 1 represents, in a linear continuum, the parameters relative to the countries (β) and the pillars (δ) [76,85]. Therefore, β is a measure of the country’s competitive ability, while the logit δ indicates the difficulty that a pillar has in obtaining a high score or competitive valuation for a country.
Due to the logit scale’s interval properties, the interpretation of the differences in the scale is the same throughout the measured attribute [86]. Equal differences between a country and a pillar correspond to identical probabilities of a correct answer. The calculations of the logit measurements (β, δ) are carried out by the maximum likelihood method, which has been carried out using the Winsteps program in this study [87]. Winsteps considers the PROX and JMLE algorithms to determine the parameters that make the observed responses more likely. In estimating the parameters of countries, the procedure is similar to a search process: knowing the pillars’ data, the joint probability of the observed responses to these pillars is calculated for each score. Moreover, each country is assigned the most probable value for its response pattern. This value is called the maximum likelihood estimator [88,89]
In the RM, the probability of a certain category of pillar “I” by country “n” would be [76,79]:
P [   X n i = x   ] = 1 γ e [   x ( β n δ i ) k = 1 x τ k i   ]
where:
n: country;
i: pillar;
γ: the sum of all possible numerators that arise according to the number of categories of the pillars;
ki: the category of pillar i assumed by country n;
τ: thresholds of the categories. These are the cut-off points of the characteristic curves corresponding to the different categories of responses to the pillars, in which the probability of a response from one category to the next is equally likely. The number of thresholds is equal to the number of categories minus one.
Among the advantages of the RM, there is the creation of an ideal model that the methodology itself designs, synthesizing and consolidating disparate data from pillars and countries in a global, uniform and integrated analytical framework [79,90]. Unlike other methodologies, data conform to the ideal model built, which allows the researcher to identify those subjects (countries) and elements (pillars) that do not fit the ideal designed model. Thus, if the data obtained from WEF fit the model obtained through the RM and Winsteps, these data have the model’s characteristics. On the contrary, if the data from WEF do not fit the model generated through the RM and Winsteps, they do not acquire the model’s characteristics. In this case, the analysis of the imbalances that arise in the process can indicate the causes of this [76,91].
Other advantages of the RM are as follows. First, due to the principle of unidimensionality, in the RM, the pillars must measure a single construct or latent variable [92,93,94]. Second, in the application of the RM, it is not necessary to assume that the data follow a normal distribution [76,95,96]. In addition, the RM has a more realistic character and a greater wealth of nuances [97,98,99]. Fourth, the RM assumes a specific objectivity characteristic by which a measure can only be considered valid and generalizable if it does not depend on the specific conditions in which it was obtained. In other words, the difference between two countries should not depend on the specific pillars with which they are estimated. Likewise, the difference between two pillars should not depend on the specific countries used to quantify it [100,101,102]. The authors also highlight the robustness of the RM for small samples [103,104], similar to this study, as well as its predictive potential and the statistical quality of the analysis, which can be seen in the reliability and adjustment (validity) calculations provided by the model [105,106,107].
Moreover, the RM is an ideal model to develop a benchmarking analysis related to objectives 2 and 3 of this study. The WEF model itself offers the possibility of benchmarking analysis, as stated in the section entitled Benchmarking Travel and Tourism Competitiveness [57] (page 9) of the TTCR-2019 report: “the report provides a strategic benchmarking tool. In this way, companies and governments develop tourism by comparison between countries and comparative evaluation of competitiveness.” Benchmarking is a method of comparative evaluation of tourist destinations in order to establish priorities, objectives and improvements [108,109,110]. Although its use in tourism is limited [111,112], the technique has attracted considerable attention for its effectiveness in the context of competitiveness [113,114,115].
Finally, the software used is the Winsteps 4.8.0 program (Available online: www.winsteps.com (accessed on 15 May 2021)) [116].

4. Results and Discussion

To achieve the first objective and determine the statistical significance of the WEF model using the RM, a series of analyses has been carried out, the results of which are presented below. Such analyses are considered essential in the context of the RM. They address the suggestions of some authors regarding the statistical significance of the data from the WEF model [39,45].

4.1. Statistical Significance of the Model (Objective 1)

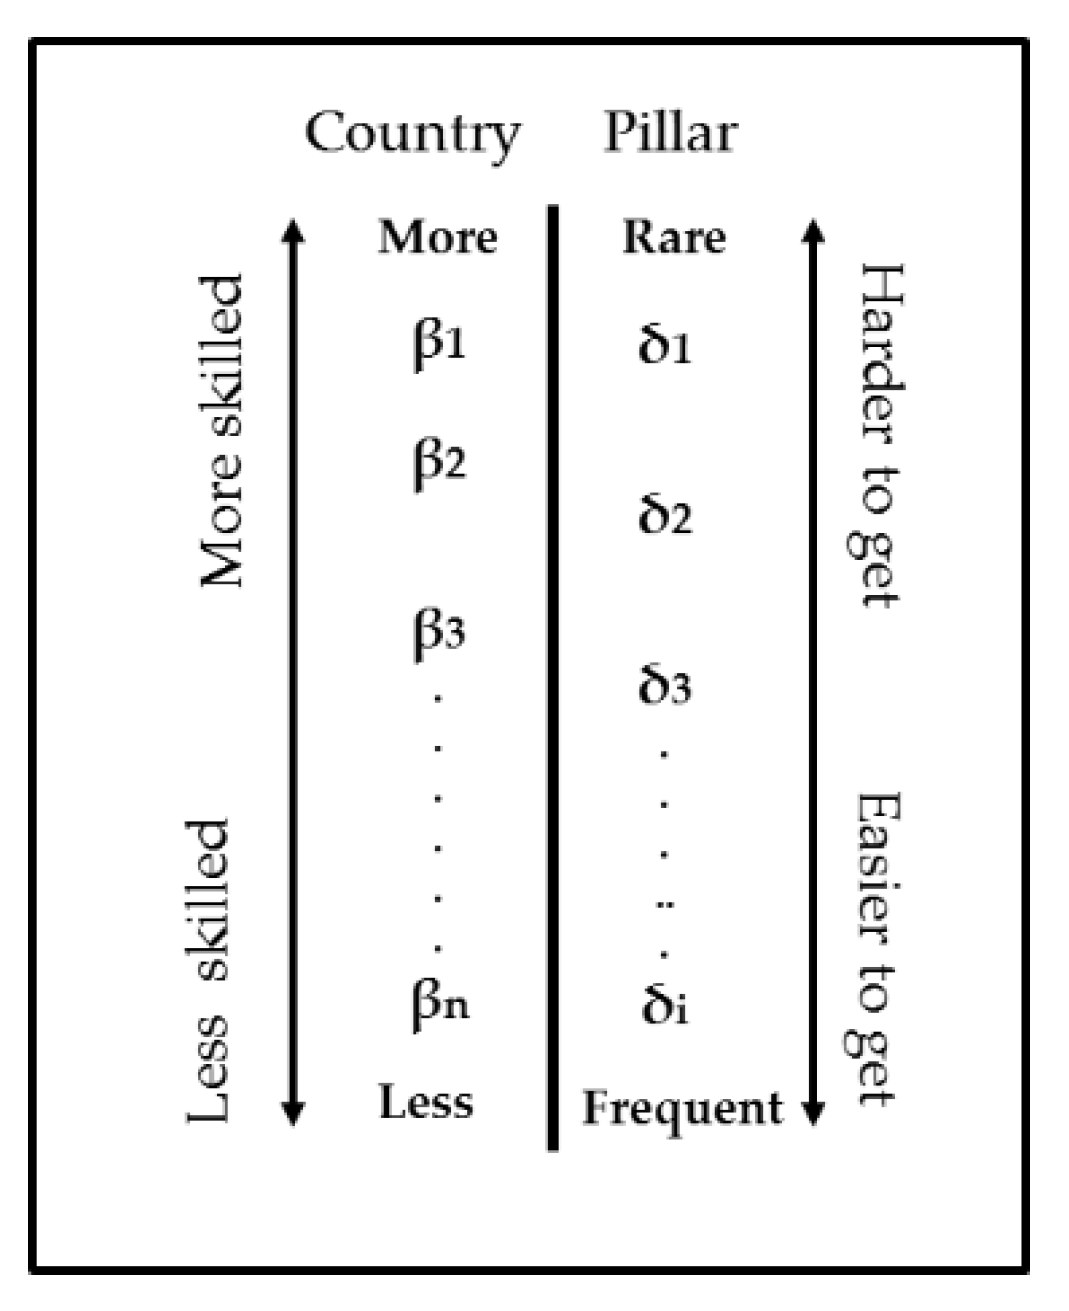
4.1.1. Unidimensionality

The existence of unidimensionality is a fundamental requirement of RM [80,86,107,117]. This is because the presence of several dimensions could lead to the existence of disturbances in the relationships between pillars or the presence of pillars that represent other dimensions [106,118,119].
The verification of the WEF model’s unidimensionality through RM and Winsteps is carried out by analyzing the principal components of the residuals (PICAR) of the pillars. This analysis allows the detection of other dimensionality factors once the “Rasch factor” has been removed [105,120,121]. The PICAR analysis applied to the residuals (not to the original data) involves decomposing the correlation matrix to find other latent factors with which the pillars could have a high correlation. To carry out this test, the “golden rule” of Linacre [122] is accepted in the literature. Linacre proposes to take into account the following criteria [76,123]: (i) The percentage of unexplained variance in the first test must be less than the percentage of variance explained by the items; (ii) The variance explained by the items must be greater than four times the unexplained variance in the first test; (iii) The unexplained variance in the first test must be less than 3 (in eigenvalues), and less than 5%; (iv) The variance explained by the measures must be greater than 50%.
According to the data in Table 2, the first three criteria are met, and the fourth criterion is not met, but only moderately so. Therefore, the unidimensional nature of the construct is admitted [76,107].

4.1.2. Summary Statistics

Next, the fit (validity) of the data from the WEF model to the Rasch model and its reliability was analyzed [80,107]. For this, the MNSQ and ZSTD indicators were observed, both in their INFIT and OUTFIT versions. The MNSQ indicator is the non-standardized mean square, transforming the residuals generated by the difference between the observation and the model estimate. The ZSTD data correspond to the standardized quadratic mean; that is, they refer to the normalized MNSQ values with mean 0 and variance 1. The OUTFIT indicator is an unweighted external estimate of the degree of fit of the observations to the model. It is sensitive to unexpected observations of the pillars whose difficulty is far from the country’s ability. The INFIT statistic constitutes the unweighted internal estimate of the degree of fit of the observations to the model sensitive to unexpected observations of the pillars, whose difficulty is close to that of the country’s competitive ability. MNSQ was calculated using chi-square statistics divided by their degrees of freedom. The values are always positive and must be within the interval (0.50, 1.50) (p < 0.05), with 1 being the expected mean value [86,117,124]. Table 3 and Table 4 show that the MNSQ statistics associated with INFIT and OUTFIT reached a value of 1 or very close to 1, both for pillars and countries, which proves the existence of fit or validity [119,120,121]. The fit was also corroborated by the mean values of the standardized statistic ZSTD since they did not exceed the value +/− 1.9 both in INFIT and OUTFIT. Therefore, the observed data of the WEF model’s pillars and countries fit the model proposed through RM [106,120,121].
The “Item/Person Reliability” statistics and the alpha coefficient were analyzed through the RM and Winsteps to determine the WEF model’s reliability or replicability. Values must be greater than 0.70 [106,121]. Reliability was calculated from the true standard deviation (TRUE SD) and the square root of the mean of the errors (RMSE). In this case, values higher than 90% were obtained, both in the pillars and countries. Taking into account that the indicators used may be in the interval (−1.00, +1.00), it can be said that the model is very accurate. Low reliability of countries would indicate that the pillars used did not quantify the countries’ true variability in competitive ability. In turn, the pillars’ low reliability would indicate that the size of the sample of countries was insufficient to estimate the true variability of the pillars. If that were the case, to increase the reliability of the pillars, a larger sample of countries would be necessary, and to increase the reliability of the countries, a greater number of pillars would be necessary [76,103,122]. Other additional data from Table 3 and Table 4 demonstrate the WEF model’s high statistical significance. First, the pillars’ maximum and minimum scores are between −2.31 and 3.06 logits, and that of the countries between −2.62 and 2.42 logits. These results show that, both in the case of the pillars and the countries, the data contemplate a wide range of cases [80,125]. Additionally, errors were reduced (0.11 in the case of pillars and 0.33 in countries). Finally, the correlations between data from the WEF TTCR-2019 and the logit measures were adequate (−1.00 in the case of the pillars and +1.00 in the case of the countries) [106,120,121].

4.1.3. Rating Scale (Summary of Category Structure)

To determine the statistical significance of WEF’s measurement instruments to obtain data from the pillars and from the TTCI, which the RM converts into categories, Linacre [122] proposes following a series of steps. The preliminary guideline establishes that both the pillars and the TTCI must correlate at least 30% with the latent variable: tourism competitiveness. Table 5, relative to the pillars and the TTCI, shows that all the correlations are greater than 0.30 (30%). In particular, 10 pillars and the TTCI correlate greater than 65%, and of them, seven correlate greater than 80%. It is noteworthy in Table 5 that the pillars are ordered in increasing order: pillar 14 is the one that has obtained the lowest valuation for the group of countries (RMTSP14 = 307; RMMP14 = 3.06 logits), with pillar 8 being the one with the highest valuation has been obtained for the group of countries (RMTSP8 = 757; RMMP8 = −2.31 logits). Although the TTCI indicator has been placed at the end of the table, so as not to mix it with the pillars, it is observed in Table 5 that the TTCI index has obtained a score very close to the mean (RMTSTTCI = 535; RMMTTCI = 0.43 logits), which confirms that said index constitutes an average of the values of the 14 pillars. Pillars 2, 3 and 8 are the ones that most influence competitiveness, and pillar 14 is the least influential as well as pillars 10 and 13. Therefore, it can be deduced from Table 5 that, in general, the pillars included in sub-indices 1 and 2 of the TTCI are the ones that most influence competitiveness and the pillars included in sub-indices 3 and 4 are the least influential.
Second, Table 6 shows that each of the seven categories includes at least ten observations (Freq. ≥ 10), as proposed by Linacre. Third, the column of percentages of the observations (Freq.%) reflects the existence of a regular distribution of the categories and a monotonic change in the categories’ measures. Fourth, MNSQ–OUTFIT is less than two, so there is no “noise,” that is, there is not more misinformation than information. Fifth, no disorder is perceived in the passage from one category to another about the “Andrich threshold” parameter. Finally, it is verified that the category’s distribution is coherent because the categories imply the measures (C→M), and the measures imply the categories (M→C). Parameter “M→C” reports the percentage of the measurements that the observations in a category were expected to produce and that this has been the case. On the contrary, parameter “C→M” expresses the percentage of the observations that correspond to a category produced by measures corresponding to that category. These data suggest consistency between the scale and the sample when the values are greater than 40% in categories 2–6. Finally, the step advance of a category is between 1 and 5 logits [106,119,121]. Therefore, as seen in Table 6, all the requirements proposed by Linacre [122] are met.
A series of analyses using MR tools and executable using Winsteps 4.8.0 has been used to achieve this study’s second and third objectives. These tools are the Wright map, the Guttman scalogram and the PKMAPs [76,79]. These analyzes are described below, and the results are presented. Only the first 14 countries (10%) and the last two are included in the Guttman scalogram.
Therefore, the doubts of some authors regarding the statistical significance of the WEF model are not confirmed. The model data is significantly valid and reliable, it forms a single dimension, and the category design is adequate [39,45]. Furthermore, the WEF model includes a greater number of pillars or variables than other studies [48,49].

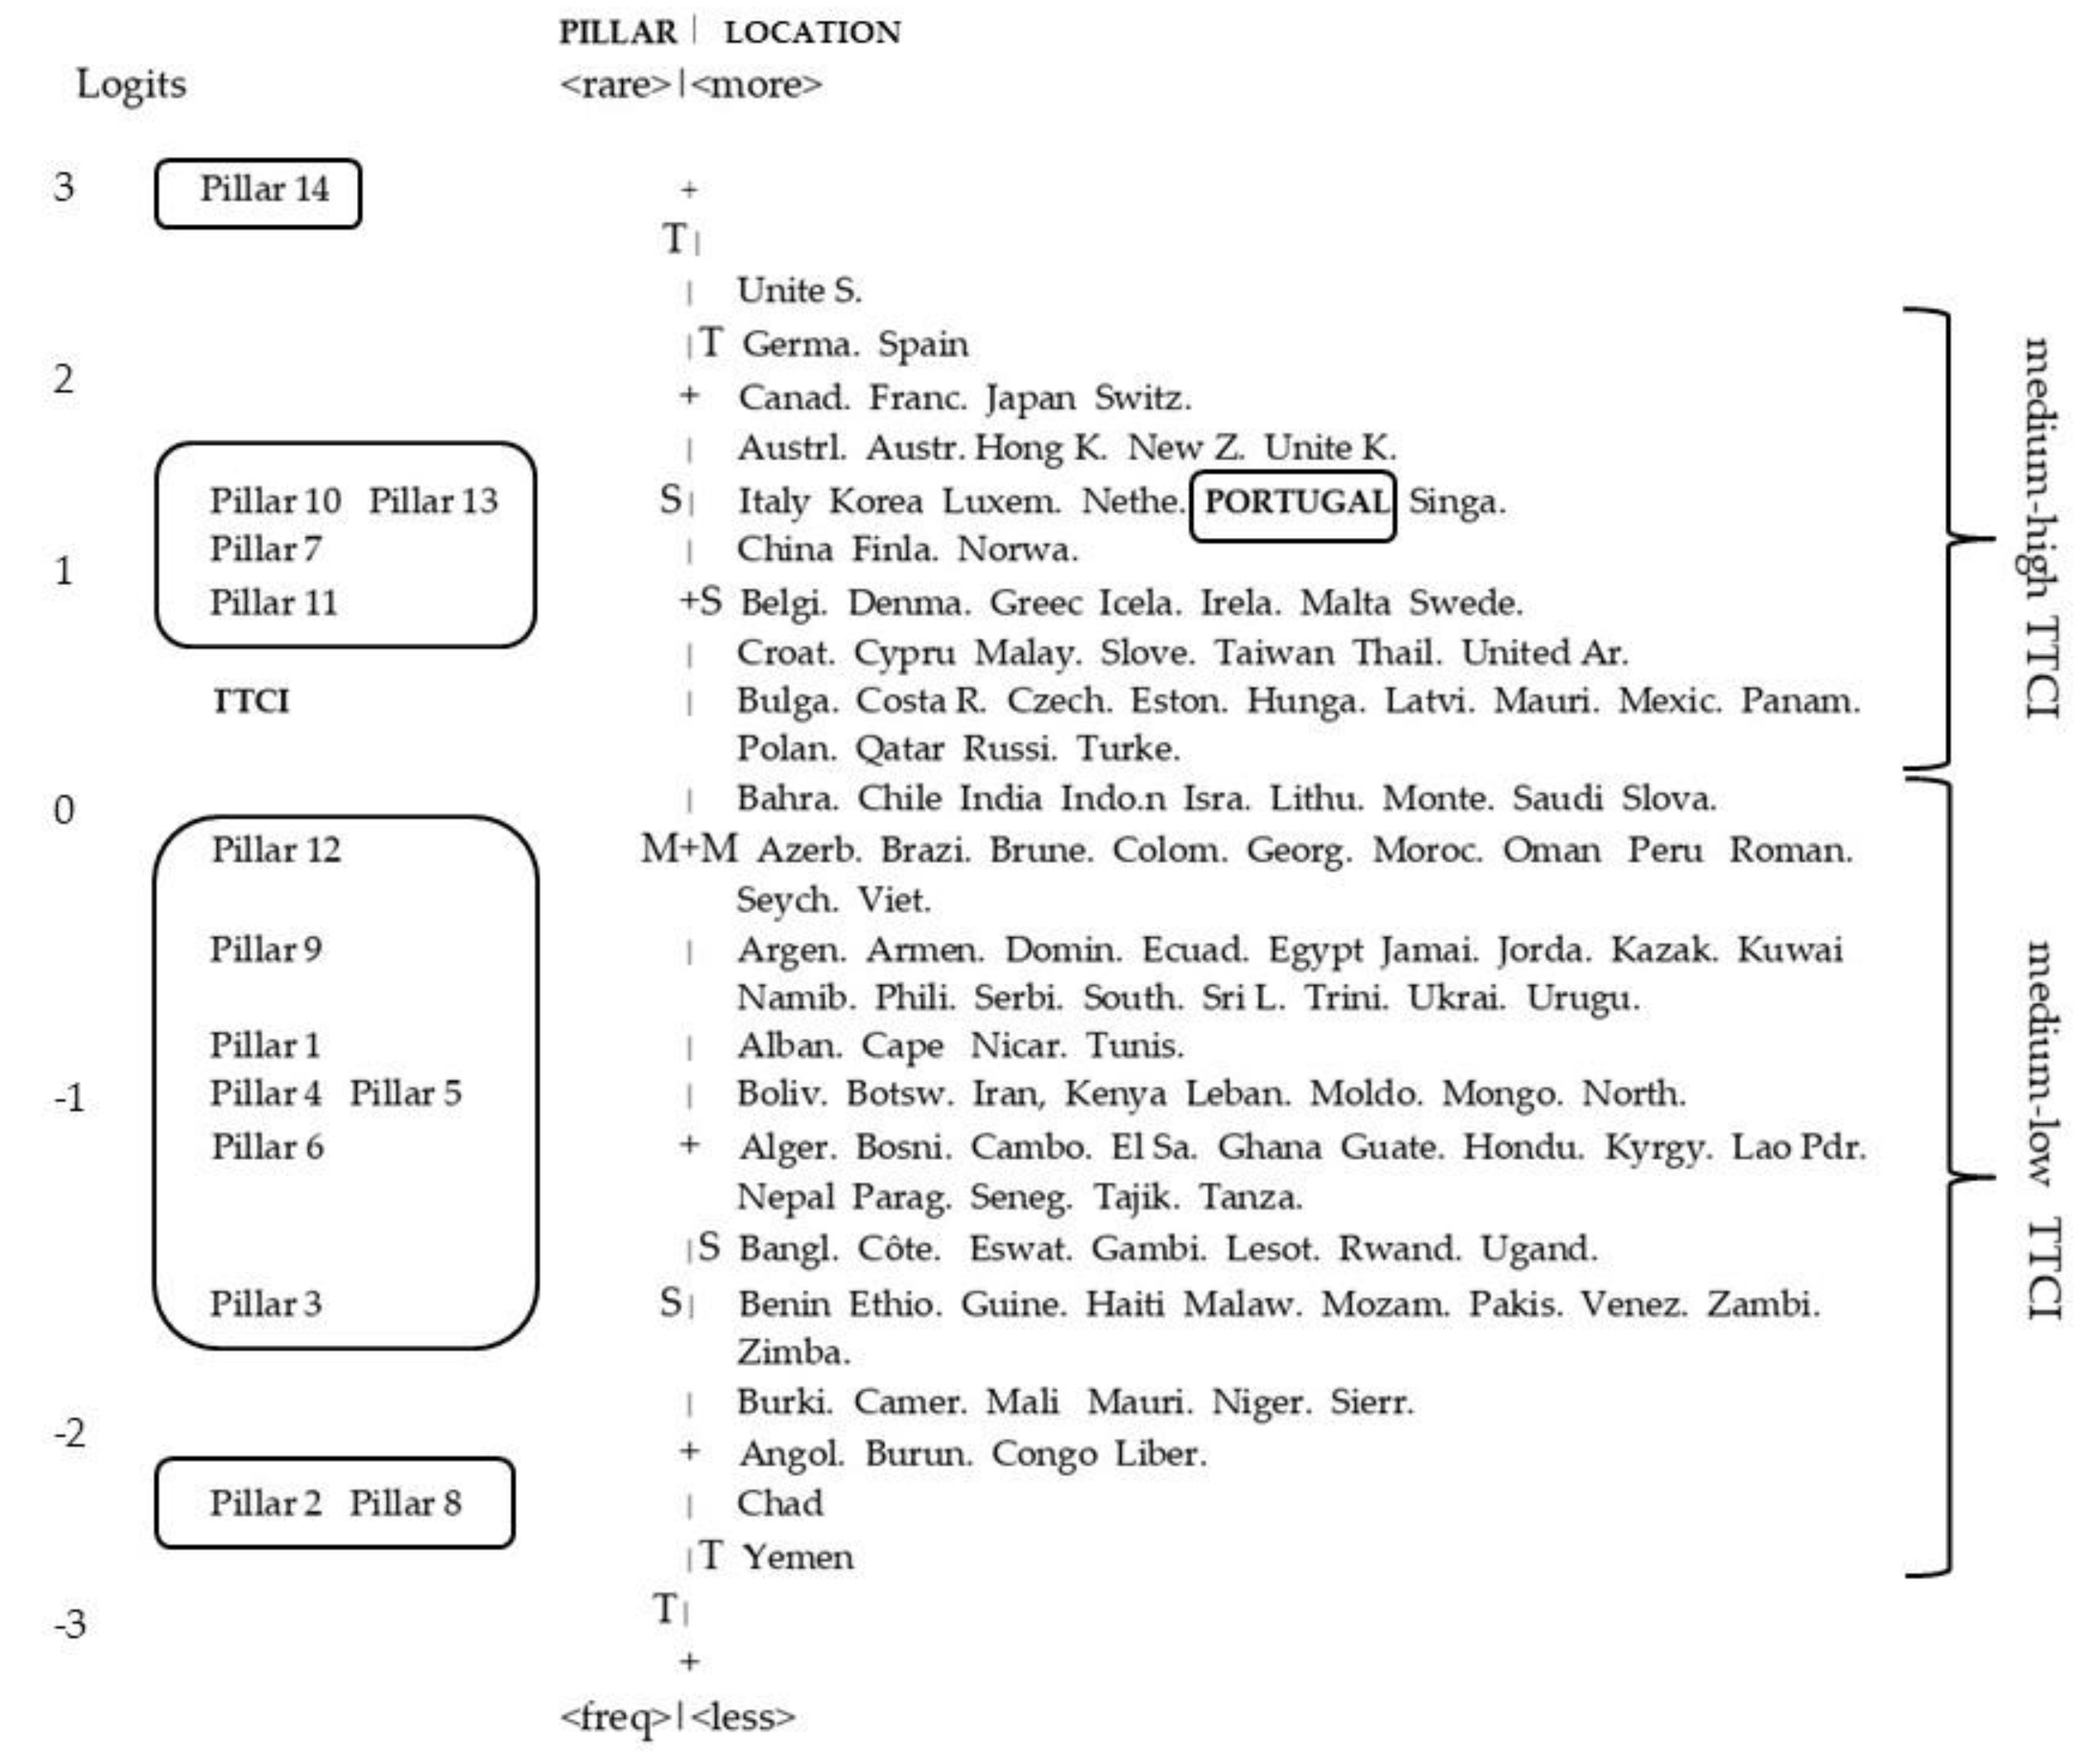
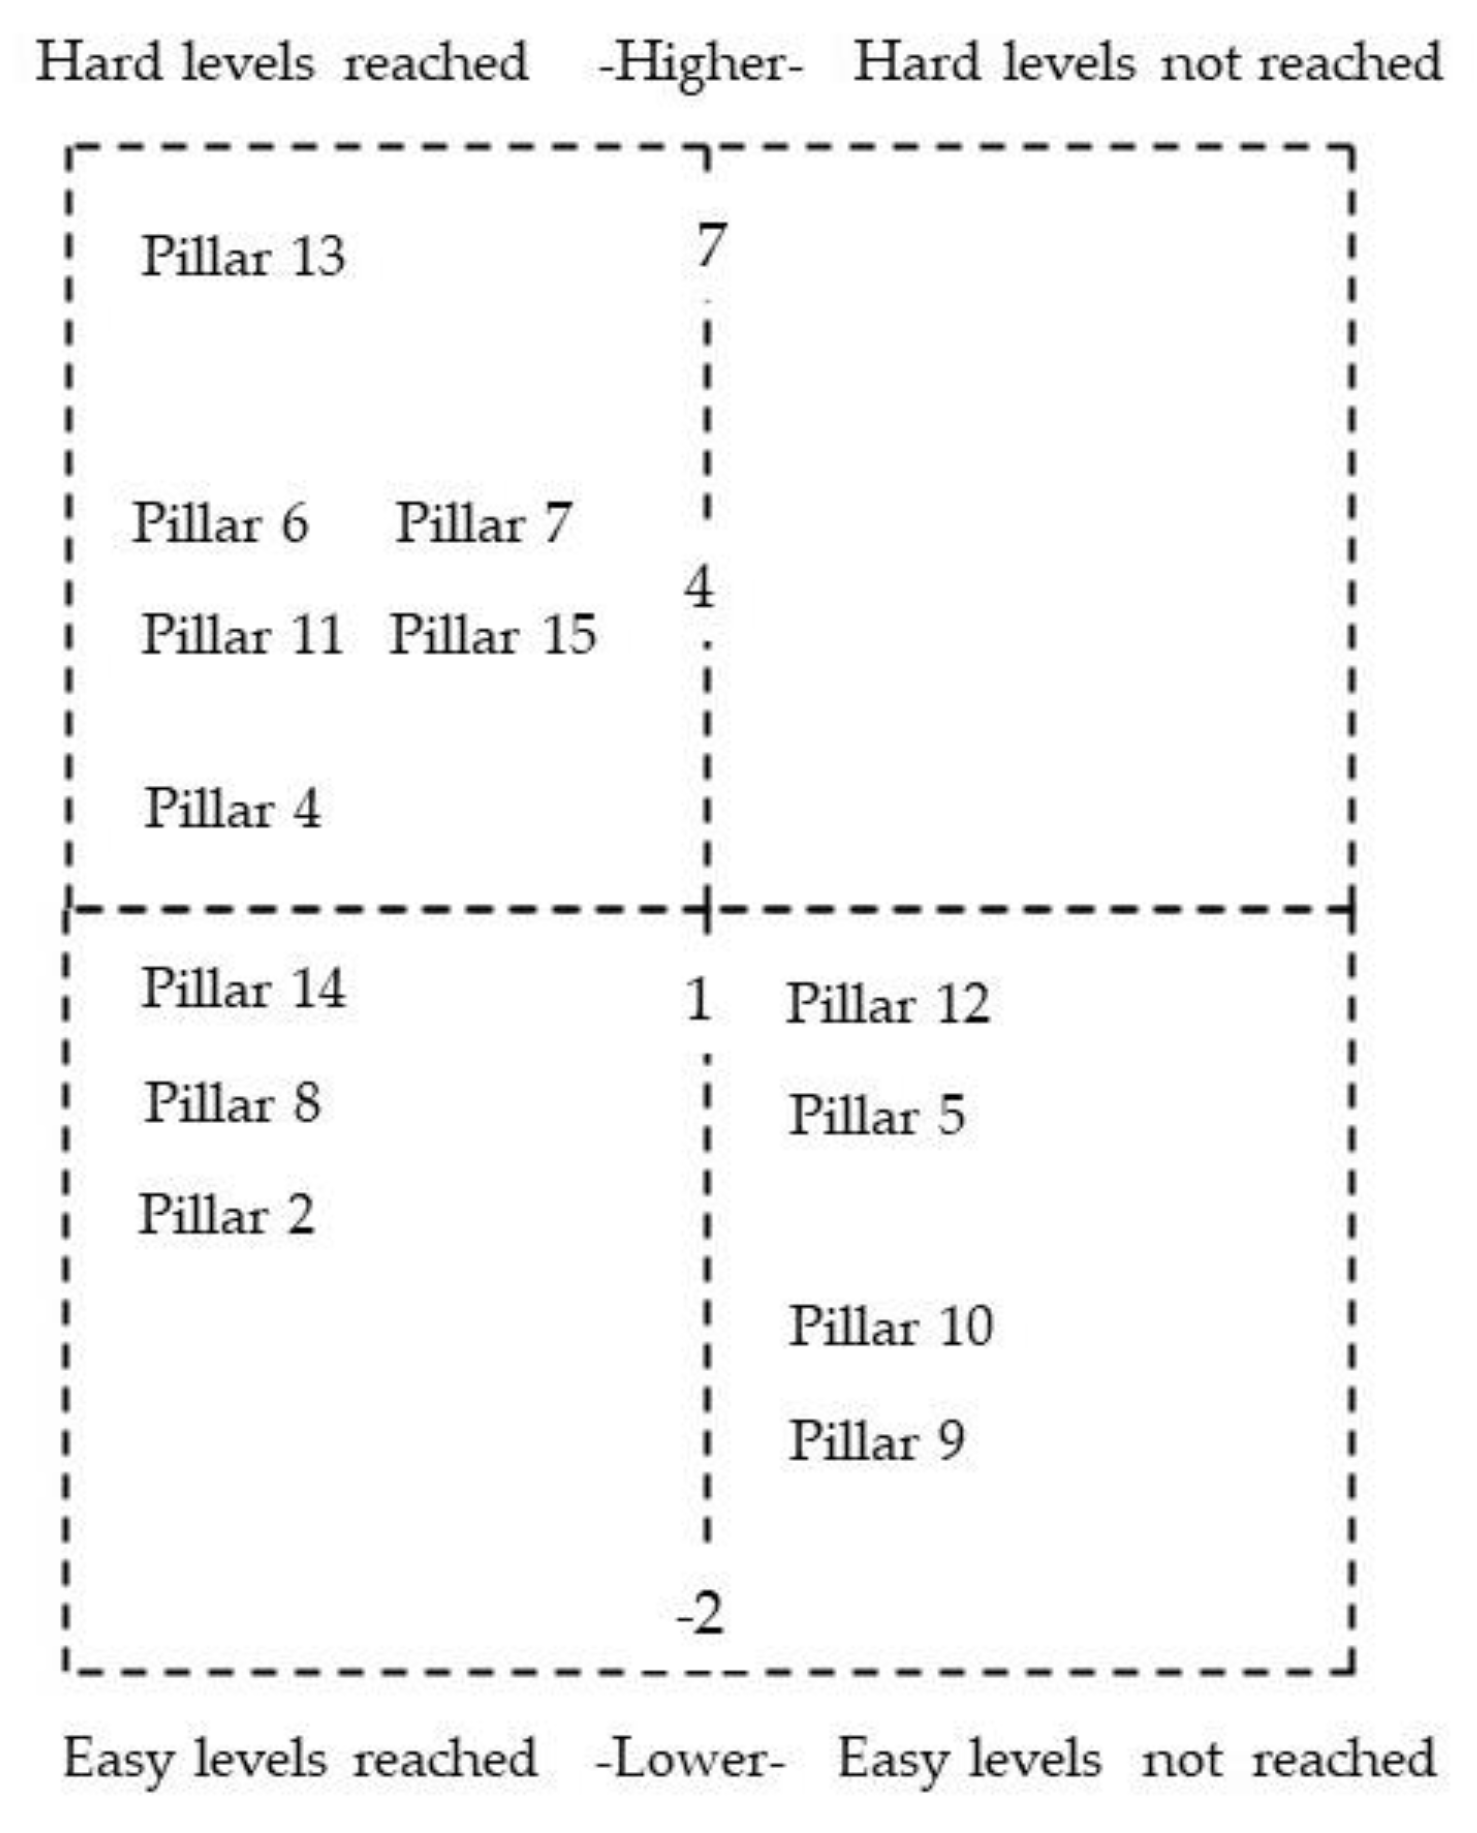
4.2. Competitive Position of the Countries (Objective 2)

Regarding objective 2 of this study, Figure 2 (Wright map in logit units) and Table 7 (Guttman scalogram with categories) demonstrate the WEF model’s potential to analyze the tourist competitiveness of countries in a global and overall context. Wright’s map integrates all countries (on the right) and all pillars (includes the TTCI index) (on the left). Countries usually present a distribution very close to the normal distribution.
Wright’s map results show that 14 countries, including Portugal (in the upper right-hand side of the figure), score high on all pillars, except for pillar 14, which scores poorly. Regarding the pillars, in Wright’s map, pillar 14 (Cultural Resources and Business Travel) is the least valued by most countries, while pillars 2 (Safety and Security) and 8 (Price Competitiveness) are the ones that have obtained the highest score by most countries. Pillar 3 (Health and Hygiene) is the third most valued or scored.
The Guttman scalogram (Table 7), which includes information on categories (from 1 to 7), not on logits, shows the joint ranking of countries and pillars with greater precision than the Wright map. The pillars’ ranking is shown in the upper part of Table 7, from left to right, with pillar 8 being the most valued. The top country in the ranking is the United States. It is noteworthy that the pillars included in sub-indices 1 and 2 of the WEF TTCR-2019 are the ones that most influence tourism competitiveness. Therefore, criticisms of the WEF model regarding the limitations of the model to analyze and manage tourism competitiveness in a global and integrated context of pillars and countries are not sustained [2,3,11]. Moreover, the WEF model is in accordance with other reference models of tourist competitiveness, whose primary objective is full knowledge and improvement of competitiveness in tourist destinations. Among these models, the model of Crouch and Ritchie [18] and the model of Dwyer and Kim [27] stand out in the literature.

4.3. Competitive Position of Portugal (Objective 3)

Regarding objective 3, Figure 2 and Figure 3 and Table 7 identify Portugal’s position in the tourism competitiveness ranking of the WEF model (position 14) through the Rasch model and in a global context of countries and pillars. It is noteworthy that the total score of Portugal (TSPO = 76) is only six points lower than that of the United States (TSUS = 82), which tops the ranking. These data allow benchmarking to be developed for any tourism destination to the extent that it informs which pillars are strengths and which are weaknesses of the better-positioned countries.
Analysis using PKMAPs (Figure 3) allows us to identify those pillars of tourism competitiveness that constitute a country’s strengths and weaknesses, in this case, Portugal, within the framework of the joint model of countries and pillars. PKMAPs are graphical representations of the individual diagnostic report of the results in a global and overall context of countries and pillars (the model). They were developed by Wright [126] and constitute useful information on the relationship between the country and the WEF pillars [76,79]. Figure 3 shows that Portugal obtained higher scores than expected by the model in pillars 4, 6, 7, 11, 13 and 15, which are strengths according to the model. However, only pillars 4 (Human Resources and Labor Market) and 6 (Prioritization of Travel and Tourism) have a strong influence on tourism competitiveness and the formation of the TTCI (Table 5). Interestingly, Portugal was expected to score higher in pillars 5, 9, 10 and 12, though these constitute the country’s weaknesses according to the model generated through the RM and Winsteps. Still, only pillar 5 (ICT Readiness) has a high impact on competitiveness according to the model (Table 5). The results show that the TTCI index of the WEF does not give a score higher or lower than expected by the model. These results affirm that the WEF model provides analysis and management of the tourist competitiveness of a given country within the global context of pillars and countries [13,44,51].

5. Implications

The purpose of this work is to study tourist competitiveness. In particular, the World Economic Forum (WEF) model has been studied. The study analyzes the WEF model’s validity and reliability using the RM and through Winsteps (objective 1). Likewise, the possibility of conducting joint studies on competitiveness (objective 2) and studying a specific tourist destination’s competitiveness in a joint and benchmarking context (objective 3) are also analyzed. The aim is to answer the questions associated with the limitations and criticisms that some studies on competitiveness in general and particularly the WEF model have received.

5.1. Methodological Implications

It has been shown in this study that, using the Rasch model, the WEF tourism competitiveness model is valid, reliable, unidimensional and statistically significant (study objective 1). Specifically, these aspects have been demonstrated about the countries, the pillars and the competitiveness index (TTCI) included in the periodic report published by the WEF (TTCR-2019). Therefore, the study is aligned with other works that have aimed to respond to the methodological limitations raised by other authors [11]. Some authors have suggested, for example, that the weighting of the variables within each pillar for the calculation of the TTCI is arbitrary. The consequent doubtful validity, reliability and unidimensionality of the WEF model data have also been highlighted [45]. However, in this study, the WEF model has high validity, reliability and unidimensional nature. Therefore, from the methodological point of view, the WEF model is helpful to research tourism competitiveness.

5.2. Theoretical Implications

The literature review carried out in this study has confirmed the importance of tourism competitiveness and the need to develop theoretical and practical models [11]. The models must be integrated by relevant pillars and indicators sufficiently supported at the theoretical level [10,12]. The study results have shown that the WEF model, analyzed through the Rasch model, is an integrated theoretical model that allows the joint study of competitiveness. Likewise, the WEF model allows for ranking and analyzing specific tourism destinations’ competitiveness in an integrated framework and a benchmarking context. Additionally, the WEF competitiveness model, which considers the theoretical and practical contributions of numerous authors in this field, can serve as the basis for developing future integrated models that address competitiveness in tourism. However, due to the nature and dynamics of the sector, the WEF should continue to make efforts to improve its model’s content validity. In this way, it is guaranteed that the WEF model will continue to include the key aspects of tourism competitiveness and the relevant theoretical contributions up to that moment, as suggested by other authors [43,56].

5.3. Practical Implications

On the one hand, it has been shown that the WEF model is statistically adequate for the development of global empirical studies, with a comprehensive and universal approach (objective 2 of the study). Our results have made it possible to generate a detailed, precise and overall map of all the countries (N = 140) and all the pillars (14 pillars + TTCI). By including all countries and pillars in this study, there is a response to some criticism that has been related to the simplicity of the studies that apply this model since the number of variables and the number of countries included in this study on competitiveness are not reduced [7,48,50]. Thus, tourism researchers, academics and professionals can study and improve competitiveness in a global context of countries and pillars using the WEF model.

6. Conclusions

In developing this study on tourism competitiveness, specifically on the WEF model, the relevance and nature of the tourism sector, the importance of tourism competitiveness, and criticisms and limitations have been taken into account. With all this, some questions posed in the literature have been answered. In the previous section, the study’s methodological, theoretical and practical implications have been commented on, and the following conclusions can be drawn.
First, it is concluded that the reports and models that study competitiveness in tourism must have content validity; that is, they must be theoretically well-founded. Content validity is as crucial as data validity. It is essential that a tourism competitiveness model specifies the determining factors or pillars of competitiveness and names them appropriately. In this way, they will reflect the key aspects of competitiveness in all the countries or regions studied. Additionally, the selected countries and tourist destinations must belong to the same administrative level. For example, the model does not study countries together with destinations or tourist regions with lower (or higher) identities than a country. Only in this way can a correct analysis and effectiveness be guaranteed in governments and professionals’ policies and decisions to promote a tourism destination’s competitiveness.
Second, researchers assigned to this academic field may consider content aspects more than the technicians and professionals who work in institutions such as the UNWTO, the OECD or the WEF itself when developing models and indices of tourism competitiveness. By contrast, these institutions probably have easier access to data to develop regular competitiveness models and indices. Institutions may also have greater funding, organizational structure and visibility than researchers belonging to an academic context. This allows us to conclude that joint work and cooperation between institutions and researchers is necessary.
Third, from a statistical point of view, competitiveness models must have validity, reliability and unidimensionality. In particular, the WEF model, analyzed through the Rasch model, is an example of a valid, reliable and unidimensional model, contrary to specific criticisms received by the model about these aspects. The WEF model’s statistical significance extends to its essential elements: the countries, the pillars and the competitiveness index that it incorporates. Therefore, the model can be used in scientific research at an academic level and in designing policies that promote destinations’ tourist competitiveness. This aspect had not been previously confirmed in the case of the WEF model.
Fourth, it is necessary to use different methodologies (e.g., the Rasch model) to study tourism competitiveness and develop new models. In the same way that tourism is a global, interconnected, complex and multidimensional sector, so is competitiveness in this sector. The methodological richness makes it possible to address better the broad spectrum of variables, tourism destinations and relationships that competitiveness entails. For example, the study of competitiveness in tourism is likely to include correlation analysis, discriminant analysis or causality studies, in the latter case through regression analysis or structural equations (e.g., SEM-PLS). The design of indicators and indices and sampling also requires adequate statistical and mathematical methods.
Fifth, models on tourism competitiveness, as is the case with the WEF model, should allow a longitudinal, global and joint study, both at the level of competitiveness pillars and at the country level. The literature specifies that these characteristics can provide an integrated map of tourism competitiveness and a ranking of pillars and countries available at different times. On the other hand, models must include a properly designed competitiveness indicator, which synthesizes the competitive reality of tourism destinations and establishes a ranking.
Sixth, in the context of the integrated and global study, tourism competitiveness models should facilitate the individualized analysis of competitiveness for different countries, as has been conducted in this study for Portugal. Tools such as benchmarking favor such analysis and promoting the adoption of policies that improve competitiveness in the sector. Additionally, a model must be friendly, clear, simple and easily usable. Therefore, models should consider the joint analysis of tourism competitiveness while facilitating the study of specific tourist destinations in a joint framework.
Despite the implications and conclusions of this study, this work is not without its limitations. First, adequate information has not been available to specify whether the WEF model’s content validity is high or medium, although we estimate that this validity is present due to the content of the WEF model and the study results. Second, the Rasch model has not been designed to carry out studies at a predictive or causal level but rather descriptive. For this reason, the extent to which certain pillars or other variables of the WEF model could predict the TTCI index or other variables internal or external to the TTCR-2019 (e.g., GDP, tourist movement) has not been studied. A future research line could be related to proposals to improve or enrich the WEF model’s theoretical foundations. Likewise, predictive or causal studies linked to the WEF model could be developed using other tools, such as regression analysis or the PLS methodology of structural equations.
Researchers and professionals can use WEF data to carry out their studies and manage the tourism competitiveness of destinations. The WEF data and the models designed by the researchers can be enriched and complemented to reflect better the tourism reality, which is dynamic, multidimensional and complex. Therefore, a future line of research could be directed to a joint study that integrates theoretical models with contributions from the WEF.

Author Contributions

Conceptualization, J.A.M.-G., V.T.D.-P. and E.P.-L.; methodology, J.A.M.-G. and V.T.D.-P.; software, J.A.M.-G. and V.T.D.-P.; validation, J.A.M.-G. and E.P.-L.; formal analysis, J.A.M.-G. and V.T.D.-P.; investigation, V.T.D.-P.; data curation, J.A.M.-G., V.T.D.-P. and E.P.-L.; writing—original, V.T.D.-P.; writing—review and editing, J.A.M.-G., V.T.D.-P. and E.P.-L.; supervision, J.A.M.-G. and E.P.-L. All authors have read and agreed to the published version of the manuscript.

Funding

This research received no external funding.

Institutional Review Board Statement

Not applicable.

Informed Consent Statement

Not aplicable.

Data Availability Statement

Not applicable.

Conflicts of Interest

The authors declare no conflict of interest.

References

  1. Roman, M.; Roman, M.; Prus, P.; Szczepanek, M. Tourism competitiveness of rural areas: Evidence from a region in Poland. Agriculture 2020, 10, 569. [Google Scholar] [CrossRef]
  2. Croes, R.; Kubickova, M. From potential to ability to compete: Towards a performance-based tourism competitiveness index. J. Dest. Mark. Manag. 2013, 2, 146–154. [Google Scholar] [CrossRef]
  3. Leung, X.Y.; Baloglu, S. Tourism competitiveness of Asia Pacific destinations. Tour. Anal. 2013, 18, 371–384. [Google Scholar] [CrossRef]
  4. Pike, S.S.; Page, S.J. Destination marketing organizations and destination marketing: A narrative analysis of the literature. Tour. Manag. 2014, 41, 202–227. [Google Scholar] [CrossRef] [Green Version]
  5. Woyo, E.; Slabbert, E. Tourism destination competitiveness: A view from suppliers operating in a country with political challenges. S. Afr. J. Econ. Manag. Sci. 2021, 24, 1–10. [Google Scholar] [CrossRef]
  6. Cronje, D.F.; Du Plessis, E. A review on tourism destination competitiveness. J. Hosp. Tour. Manag. 2020, 45, 256–265. [Google Scholar] [CrossRef]
  7. Blanco-Cerradelo, L.; Gueimonde-Canto, A.; Fraiz-Brea, J.A.; Diéguez-Castrillón, M.D. Dimensions of destination competitiveness: Analyses of protected areas in Spain. J. Clean. Prod. 2018, 177, 782–794. [Google Scholar] [CrossRef]
  8. Wang, X.; Liu, D. The coupling coordination relationship between tourism competitiveness and economic growth of developing countries. Sustainability 2020, 12, 2350. [Google Scholar] [CrossRef] [Green Version]
  9. Bazargani, R.H.Z.; Kiliç, H. Tourism competitiveness and tourism sector performance: Empirical insights from new data. J. Hosp. Tour. Manag. 2021, 46, 73–82. [Google Scholar] [CrossRef]
  10. Nadalipour, Z.; Khoshkhoo, M.H.I.; Eftekhari, A.R. An integrated model of destination sustainable competitiveness. Compet. Rev. 2019, 29, 314–335. [Google Scholar] [CrossRef]
  11. Rodríguez-Díaz, B.; Pulido-Fernández, J.I. Sustainability as a key factor in tourism competitiveness: A global analysis. Sustainability 2020, 12, 51. [Google Scholar] [CrossRef] [Green Version]
  12. Rodríguez-Díaz, B.; Pulido-Fernández, J.I. Analysis of the Worth of the Weights in a new Travel and Tourism Competitiveness Index. J. Travel Res. 2021, 60, 267–280. [Google Scholar] [CrossRef]
  13. Salinas-Fernández, J.A.; Serdeira-Azevedo, P.; Martín-Martín, J.M.; Rodríguez-Martín, J.A. Determinants of tourism destination competitiveness in the countries most visited by international tourists: Proposal of a synthetic index. Tour. Manag. Perspect. 2020, 33, 1–13. [Google Scholar] [CrossRef]
  14. Abreu-Novais, M.; Ruhanen, L.; Arcodia, C. Destination competitiveness: What we know, what we know but shouldn’t and what we don’t know but should. Curr. Issues Tour. 2016, 19, 492–512. [Google Scholar] [CrossRef]
  15. Ayikoru, M. Destination competitiveness challenges: A Ugandan perspective. Tour. Manag. 2015, 50, 142–158. [Google Scholar] [CrossRef] [Green Version]
  16. Chien-Minn, C.; Sheu-Hua, C.; Hong-Tau, L.; Tsung-Hsien, T. Exploring destination resources and competitiveness–A comparative analysis of tourists’ perceptions and satisfaction toward an island of Taiwan. Ocean. Coast. Manag. 2016, 119, 58–67. [Google Scholar] [CrossRef]
  17. Buhalis, D. Technology in tourism-from information communication technologies to eTourism and smart tourism towards ambient intelligence tourism: A perspective article. Tour. Rev. 2020, 75, 267–272. [Google Scholar] [CrossRef]
  18. Crouch, G.I.; Ritchie, J.R.B. Tourism, competitiveness and societal prosperity. J. Bus. Res. 1999, 44, 137–152. [Google Scholar] [CrossRef]
  19. Buhalis, D. Marketing the competitive destination of the future. Tour. Manag. 2000, 21, 97–116. [Google Scholar] [CrossRef] [Green Version]
  20. Dupeyras, A.; MacCallum, N. Indicators for measuring competitiveness in tourism: A guidance document. In OECD Tourism Papers; OECD Publishing: Paris, France, 2013; pp. 1–65. [Google Scholar] [CrossRef]
  21. Hassan, S. Determinants of market competitiveness in an environmentally sustainable tourism industry. J. Travel Res. 2000, 38, 239–245. [Google Scholar] [CrossRef]
  22. Cimbaljević, M.; Stankov, U.; Pavluković, V. Going beyond the traditional destination competitiveness. Reflections on a smart destination in the current research. Curr. Issues Tour. 2019, 22, 2472–2477. [Google Scholar] [CrossRef]
  23. Blanke, J.; Chiesa, T. The Travel & Tourism Competitveness Report 2013; World Economic Forum: Geneva, Switzerland, 2014. [Google Scholar]
  24. Mira, M.R.; Moura, A.; Breda, Z. Destination competitiveness and competitiveness indicators: Illustration of the Portuguese reality. Rev. Appl. Manag. Stud. 2016, 14, 90–103. [Google Scholar] [CrossRef]
  25. Montero-Muradas, I.; Oreja-Rodríguez, J.R. Factores competitivos determinantes del liderazgo turístico de España en 2015. Cuad. Turismo 2017, 40, 465–488. [Google Scholar] [CrossRef] [Green Version]
  26. Iamkovaia, M.; Arcila, M.; Martins, F.; Izquierdo, A.; Vallejo, I. Analysis and comparison of tourism competitiveness in Spanish coastal areas. Investig. Reg. 2020, 47, 161–178. [Google Scholar] [CrossRef]
  27. Dwyer, L.; Kim, C. Destination competitiveness: Determinants and indicators. Curr. Issues Tour. 2003, 6, 369–413. [Google Scholar] [CrossRef]
  28. Heath, E. Towards a model to enhance destination competitiveness: A Southern African perspective. Int. J. Hosp. Manag. 2003, 10, 124–142. [Google Scholar]
  29. Gooroochurn, N.; Sugiyarto, G. Competitiveness indicators in the travel and tourism industry. Tour. Econ. 2005, 11, 25–43. [Google Scholar] [CrossRef]
  30. Blanke, J.; Chiesa, T. The Travel & Tourism Competitiveness Report: Measuring Travel and Tourism Competitiveness; Furthering the Process of Economic Development; World Economic Forum: Geneva, Switzerland, 2007; pp. 1–28. [Google Scholar]
  31. Cucculelli, M.; Goffi, G. Does sustainability enhance tourism destination competitiveness? Evidence from Italian Destinations of Excellence. J. Clean. Prod. 2016, 111, 370–382. [Google Scholar] [CrossRef]
  32. Abreu-Novais, M.; Ruhanen, L.; Arcodia, C. Destination competitiveness: A phenomenographic study. Tour. Manag. 2018, 64, 324–334. [Google Scholar] [CrossRef]
  33. Hanafiah, M.H.; Zulkifly, M.I. Tourism destination competitiveness and tourism performance: A secondary data approach. Compet. Rev. 2019, 29, 592–621. [Google Scholar] [CrossRef]
  34. Ankomah, P.K.; Crompton, J.I.; Baker, D. Influence of cognitive distance in vacation choice. Ann. Tour. Res. 1996, 23, 138–150. [Google Scholar] [CrossRef]
  35. Teodorovic, M.; Popesku, J. Serbia’s competitive position in the regional tourism destination market. Eur. J. Appl. Econ. 2017, 14, 1–12. [Google Scholar] [CrossRef] [Green Version]
  36. Ahmed, Z.U.; Krohn, F.B. Reversing the United States’ declining competitiveness in the marketing of international tourism: A perspective on future policy. J. Travel Res. 1990, 29, 23–29. [Google Scholar] [CrossRef]
  37. Mazanec, J.A. Competition among European tourist cities: A comparative analysis with multidimensional scaling and self-organizingmaps. Tour. Econ. 1995, 1, 283–302. [Google Scholar] [CrossRef]
  38. Chon, K.; Mayer, K.J. Destination competitiveness models in tourism and their application to Las Vegas. J. Tour. Syst. Qual. Manag. 1995, 1, 227–246. [Google Scholar]
  39. Gómez-Vega, M.; Picazo-Tadeo, A. Ranking world tourist destinations with a composite indicator of competitiveness: To weigh or not to weigh? Tour. Manag. 2019, 72, 281–291. [Google Scholar] [CrossRef]
  40. Pérez León, V.E.; Pérez, F.; Contreras-Rubio, I.; Guerrero, F.M. An approach to the travel and tourism competitiveness index in the Caribbean region. Int. J. Tour. Res. 2020, 1–17. [Google Scholar] [CrossRef]
  41. Assaker, G.; Hallak, R.; Esposito, V.; O’Connor, P. An empirical operationalization of countries’ destination competitiveness using partial least squares modelling. J. Travel Res. 2014, 53, 26–43. [Google Scholar] [CrossRef]
  42. Zhou, Y.; Maumbe, K.; Deng, J.; Selin, W. Resource-based destination competitiveness evaluation using a hybrid analytic hierarchy process (AHP): The case study of West Virginia. Tour. Manag. Perspect. 2015, 15, 72–80. [Google Scholar] [CrossRef]
  43. Mendola, D.; Volo, S. Building composite indicators in tourism studies: Measurements and applications in tourism destination competitiveness. Tour. Manag. 2017, 59, 541–553. [Google Scholar] [CrossRef]
  44. Mazanec, J.A.; Ring, A. Tourism destination competitiveness: Second thoughts on the World Economic Forum reports. Tour. Econ. 2011, 17, 725–751. [Google Scholar] [CrossRef] [Green Version]
  45. Pulido-Fernandez, J.I.; Rodriguez-Diaz, B. Reinterpreting the World Economic Forum’s Global Tourism Competitiveness Index. Tour. Manag. Perspect. 2016, 20, 131–140. [Google Scholar] [CrossRef]
  46. D’Hauteserre, A. Lessons in managed destination competitiveness: The case of Foxwoods casino resort. Tour. Manag. 2000, 21, 23–32. [Google Scholar] [CrossRef]
  47. Hong, S.W.C. Global competitiveness measurement for the tourism sector. Curr. Issues Tour. 2009, 12, 105–132. [Google Scholar] [CrossRef]
  48. Hanafiah, M.; Hemdi, M.; Ahmad, I. Tourism destination competitiveness: Towards a performance-based approach. Tour. Econ. 2016, 22, 629–636. [Google Scholar] [CrossRef]
  49. Martins, L.F.; Gan, Y.; Ferreira-Lopes, A. An empirical analysis of the influence of macroeconomic determinants on World tourism demand. Tour. Manag. 2017, 61, 248–260. [Google Scholar] [CrossRef] [Green Version]
  50. Chin, W.L.; Haddock-Fraser, J.; Hampton, M.P. Destination competitiveness: Evidence from Bali. Curr. Issues Tour. 2020, 20, 1265–1289. [Google Scholar] [CrossRef]
  51. Wu, W.W.; Lan, L.; Lee, Y.T. Critiquing the World Economic Forum’s concept of destination competitiveness: A further analysis. Tour. Manag. Perspect. 2012, 4, 198–206. [Google Scholar] [CrossRef]
  52. Pérez-Moreno, S.; Rodríguez-Díaz, B.; Luque, M. Assessing global competitiveness under multi-criteria perspective. Econ. Model. 2016, 53, 398–408. [Google Scholar] [CrossRef]
  53. Ortiz, F.I.; Robles, V.H.; Guzmá, A. Análisis teórico de los modelos de competitividad de destinos turísticos. Un acercamiento para la competitividad de los destinos turísticos mexicanos. Int. J. Sci. Manag. Tour. 2018, 25, 195–221. [Google Scholar]
  54. Porter, M. The Competitive Advantage of Nations; Free Press: New York, NY, USA, 1990; pp. 1–875. [Google Scholar]
  55. Parra-López, E.; Oreja-Rodríguez, J.R. Evaluation of the competitive¬ness of tourist zones of an island destination: An application of a many-facet Rasch model (MFRM). J. Dest. Mark. Manag. 2014, 3, 114–121. [Google Scholar] [CrossRef]
  56. Andrades, L.; Dimanches, F. Destination competitiveness and tourism development in Russia: Issues and challenges. Tour. Manag. 2017, 62, 360–376. [Google Scholar] [CrossRef]
  57. Calderwood, L.U.; Soshkin, M. The Travel & Tourism Competitiveness Report; World Economic Forum: Cologny, Switzerland; Available online: https://www.weforum.org/reports/the-travel-tourism-competitiveness-report-2019 (accessed on 10 February 2021).
  58. De la Peña, M.R.; Núñez-Serrano, J.A.; Turrion, J.; Velazquez, F.J. A new tool for the analysis of the international competitiveness of tourist destinations based on performance. J. Travel Res. 2019, 58, 207–223. [Google Scholar] [CrossRef]
  59. Dogru, T.; Bulut, U.; Sirakaya-Turk, E. Modeling tourism demand: Theoretical and empirical considerations for future research. Tour. Econ. 2019, 20, 1–16. [Google Scholar] [CrossRef]
  60. Takahashi, K. Comparing the determinants of tourism demand in Singapore and French Polynesia: Applying the tourism demand model to panel data analysis. Tour. Anal. 2020, 25, 175–181. [Google Scholar] [CrossRef]
  61. Gunter, U.; Onder, I.; Smeral, E. Scientific value of econometric tourism demand studies. Ann. Tour. Res. 2019, 78, 1–16. [Google Scholar] [CrossRef]
  62. Navickas, V.; Malakauskaite, A. The possibilities for the identification and evaluation of tourism sector competitiveness factors. Eng. Econ. 2009, 1, 37–44. [Google Scholar]
  63. Cvelbar, L.K.; Dwyer, L.; Koman, M.; Mihalič, T. Drivers of destination competitiveness in tourism: A global investigation. J. Travel Res. 2016, 55, 1041–1050. [Google Scholar] [CrossRef]
  64. Andrades-Caldito, L.; Sanchez-Rivero, M.; Pulido-Fernandez, J.I. Tourism destination competitiveness from a demand point of view: An empirical analysis for Andalusia. Tour. Anal. 2014, 19, 425–440. [Google Scholar] [CrossRef]
  65. Crotti, R.; Misrahi, T. The Travel & Tourism Competitveness Report 2015; World Economic Forum: Geneva, Switzerland, 2016. [Google Scholar]
  66. Evren, S.; Kozak, N. Competitive positioning of winter tourism destinations: A comparative analysis of demand and supply sides perspectives–Cases from Turkey. J. Dest. Mark. Manag. 2018, 9, 247–257. [Google Scholar] [CrossRef]
  67. Goffi, G.; Cucculelli, M. Explaining tourism competitiveness in small and medium destinations: The Italian case. Curr. Issues Tour. 2018, 22, 1–31. [Google Scholar] [CrossRef]
  68. Zhang, H.; Gu, C.L.; Gu, L.W.; Zhang, Y. The evaluation of tourism destination competitiveness by TOPSIS & information entropy—A case in the Yangtze River Delta of China. Tour. Manag. 2011, 32, 443–451. [Google Scholar] [CrossRef]
  69. Tourais, P.; Videira, N. A participatory systems mapping approach for sustainability transitions: Insights from an experience in the tourism sector in Portugal. Environ. Innov. Soc. Transit. 2021, 38, 153–168. [Google Scholar] [CrossRef]
  70. Santos, L.D.; Vieira, A.C. Tourism and regional development: A spatial econometric model for Portugal at municipal level. Port. Econ. J. 2020, 19, 285–299. [Google Scholar] [CrossRef]
  71. Rasch, G. Probabilistic Models for Some Intelligence and Attainment Test; Danish Institute for Educational Research: Copenhagen, Denmark, 1960; pp. 1–199. [Google Scholar]
  72. Rasch, G. Probabilistic Models for Some Intelligence and Attainment Test. (Expanded Edition); University of Chicago Press: Copenhagen, Denmark, 1980; pp. 1–199. [Google Scholar]
  73. Andrich, D. A rating formulation for ordered response categories. Psychometrika 1978, 43, 561–573. [Google Scholar] [CrossRef]
  74. Andrich, D. Rasch Models for Measurement; Sage: Newbury Park, CA, USA, 1988; pp. 273–275. [Google Scholar]
  75. Yanes-Estévez, V.; Oreja-Rodríguez, J.R.; García-Pérez, A.M. Perceived environmental uncertainty in the agrifood supply chain. Br. Food J. 2010, 112, 688–709. [Google Scholar] [CrossRef]
  76. Yánez-Estévez, V.; García-Pérez, A.M.; Oreja-Rodríguez, J.R. The Strategic Behaviour of SMEs. Adm. Sci. 2018, 8, 61. [Google Scholar] [CrossRef] [Green Version]
  77. Fischer, A.R.H.; Frewer, L.F.; Nauta, M.J. Toward improving food safety in the domestic environment: A multi-item Rasch scale for the measurement of the safety efficacy of domestic food-handling practices. Risk Anal. 2006, 26, 1323–1338. [Google Scholar] [CrossRef] [PubMed]
  78. Oreja-Rodríguez, J.R.; Yanes-Estévez, V. Environmental scanning: Dynamism with rack and stack from Rasch model. Manag. Decis. 2010, 48, 260–276. [Google Scholar] [CrossRef]
  79. García-Pérez, A.M.; Yanes-Estévez, V.; Oreja-Rodríguez, J.R. Strategic reference points, risk and strategic choices in small and medium sized enterprises. J. Bus. Econ. Manag. 2014, 15, 562–576. [Google Scholar] [CrossRef] [Green Version]
  80. Oreja-Rodríguez, J.R. Mediciones, Posicionamientos y Diagnósticos Competitivos; Fundación Fyde Caja Canarias: Santa Cruz de Tenerife, España, 2015; pp. 1–166. [Google Scholar]
  81. Martin, J.; Mendoza, C.; Román, C. A DEA Travel–Tourism Competitiveness Index. Soc. Indic. Res. 2017, 13, 937–957. [Google Scholar] [CrossRef]
  82. Salzberger, T.; Fiona, F.J.; Newton, J.; Ewing, M.T. Detecting gender item bias and differential manifest response behavior: A Rasch-based solution. J. Bus. Res. 2014, 67, 598–607. [Google Scholar] [CrossRef]
  83. Oreja-Rodríguez, J.R.; Yanes-Estévez, V. Perceived environmental uncertainty in tourism: A new approach using the Rasch model. Tour. Manag. 2007, 28, 1450–1463. [Google Scholar] [CrossRef]
  84. Karabatsos, G. The rasch model, additive conjoint measurement, and new models of probabilistic measurement theory. J. Appl. Meas. 2001, 2, 389–423. [Google Scholar]
  85. Karabatsos, G.; Ullrich, J.R. Enumerating and testing conjoint measurement models. Math. Soc. Sci. 2002, 43, 485–504. [Google Scholar] [CrossRef]
  86. Moral, F.J.; Rebollo, F.J.; Valiente, P.; López, F. Modeling of atmospheric pollution in urban and rural sites using a probabilistic and objective approach. Appl. Sci. 2019, 9, 4009. [Google Scholar] [CrossRef] [Green Version]
  87. Linacre, J.M.; Winsteps®. Rasch Measurement Computer Program. Chicago 2018. Available online: Winsteps.com (accessed on 25 May 2021).
  88. Henson, S.; Blandon, J.; Cranfield, J. Difficulty of healthy eating: A rasch model approach. Soc. Sci. Med. 2010, 70, 1574–1580. [Google Scholar] [CrossRef]
  89. Moral, F.J.; Terrón, J.M.; Rebollo, F.J. Site-specific management zones based on the Rasch model and geostatistical techniques. Comput. Electron. Agric. 2011, 75, 223–230. [Google Scholar] [CrossRef]
  90. Andrich, D. Controversy and the Rasch model. A characteristic of incompatible paradigms? Med. Care 2004, 42, 1–10. [Google Scholar] [CrossRef]
  91. Boone, W.J.; Staver, J.R.; Yale, M.S. Rasch Analysis in the Human Sciences; Springer: Dordrecht, The Netherlands, 2014; pp. 1–227. [Google Scholar]
  92. Bond, T.G.; Fox, C.M. Applying the Rasch Model, Fundamental Measurement in the Human Sciences, 2nd ed.; LEA (Lawrence Erlbaum Associates): Mahwah, NJ, USA, 2007; pp. 1–12. [Google Scholar]
  93. Wright, B.D.; Mok, M. An overview of the family of Rasch Measurement models. In Introduction to Rasch Measurement; Smith, E., Smith, R., Eds.; AM Press: Maple Grove, MN, USA, 2004; pp. 1–24. [Google Scholar]
  94. Andrich, D.; Marais, I. Instrument Design with Rasch IRT and Data Analysis. Unit Materials; School of Education; Murdoch University: Murdoch, Australia, 2005. [Google Scholar]
  95. Engelhard, G. Thorndike, Thurstone, and Rasch: A comparison of their methods of scaling psychological and educational tests. Appl. Psychol. Meas. 1984, 8, 21–38. [Google Scholar] [CrossRef]
  96. Cecilio-Fernandes, D. Construcción de un Test. Informatizado Transmodal de Memoria de Reconocimiento. Tesis doctoral, Universidad de Salamanca, Salamanca, España, 2011; pp. 1–274. [Google Scholar] [CrossRef] [Green Version]
  97. Hong, S.; Min, S.Y. Mixed Rasch modeling of the self-rating depression scale: Incorporating latent class and Rasch rating scale models. Educ. Psychol. Meas. 2007, 67, 280–299. [Google Scholar] [CrossRef]
  98. Oreja-Rodríguez, J.R.; Parra-López, E.; Yanes-Estévez, V. The sustainability of island destinations: Tourism area life cycle and teleological perspectives. The case of Tenerife. Tour. Manag. 2008, 29, 53–65. [Google Scholar] [CrossRef]
  99. Embretson, S.E.; Reise, S.P. Item Response Theory for Psychologists; LEA: Mahwah, NJ, USA, 2000; pp. 1–384. [Google Scholar]
  100. Norra, C.; Böcker, M.; Wirtz, M.; Gauggel, S.; Forkmann, T. P01-385—A short screening for depression (desc) using rasch analysis: Development and validation of the new instrument. Eur. Psychiatry 2010, 25, 598. [Google Scholar] [CrossRef]
  101. Montero-Muradas, I.; Oreja-Rodríguez, J.R. La disponibilidad de los recursos tangibles de la oferta de productos de turismo cultural de las Islas Canarias. Aplicación del modelo probabilístico de Rasch. Cuad. Tur. 2005, 16, 135–151. [Google Scholar]
  102. Montero-Muradas, I.; Oreja-Rodríguez, J.R. Diseño de un instruimento de medida par el análisis comparativo de los recursos culturales tangibles. Pasos 2005, 3, 245–255. [Google Scholar] [CrossRef]
  103. Montero-Muradas, I.; Oreja-Rodríguez, J.R. Benchmarking interno en una central de compras de agencias de viajes. Cuad. Tur. 2010, 26, 177–199. [Google Scholar]
  104. Montero-Muradas, I.; Oreja-Rodríguez, J.R. Acciones de mejora del posicionamiento en recursos culturales tangibles de los municipios canarios. Pasos 2010, 8, 1–12. [Google Scholar] [CrossRef]
  105. Linacre, J.M. What do infit and outfit, Mean-Square and Standardized Mean? Rasch Meas. Trans. 2002, 16, 878. [Google Scholar]
  106. Miftahuddin, A.; Hermanto, B.; Raharja, S.J.; Chan, A. City brand attractiveness on tourism using rasch model approach. Int. J. Sup. Chain. Mgt. 2020, 9, 150–156. [Google Scholar]
  107. Linacre, J.M. Winsteps Rasch Measurement Computer Program User’s Guide. Beaverton, Oregon. 2021. Available online: Winsteps.com (accessed on 22 April 2021).
  108. Presley, A.; Meade, L. Benchmarking for sustainability: An application to the sustainable construction industry. Benchmarking 2010, 17, 435–451. [Google Scholar] [CrossRef]
  109. Kozak, M.; Baloglu, S. Managing and Marketing Tourist Destinations: Strategies to Gain a Competitive Edge; Routledge: New York, NY, USA, 2012; pp. 1–262. [Google Scholar]
  110. Hong, P.; Hong, S.W.; Roh, J.J.; Park, K. Evolving benchmarking practices: A review for research perspectives. Benchmarking 2012, 19, 444–462. [Google Scholar] [CrossRef]
  111. Assaf, G.A.; Dwyer, L. Benchmarking international tourism destinations. Tour. Econ. 2013, 19, 1233–1247. [Google Scholar] [CrossRef] [Green Version]
  112. De Castro, V.F.; Frazzon, E.M. Benchmarking of best practices: An overview of the academic literature. Benchmarking 2017, 24, 750–774. [Google Scholar] [CrossRef]
  113. Blancas, F.J.; Oyola, M.L.; Gonzalez, M.; Caballero, R. A dynamic sustainable tourism evaluation using multiple benchmarks. J. Clean. Prod. 2018, 174, 1190–1203. [Google Scholar] [CrossRef]
  114. Khazai, B.; Mahdavian, F.; Platt, S. Tourism Recovery Scorecard (TOURS)—Benchmarking and monitoring progress on disaster recovery in tourism destinations. Int. J. Disaster Risk Sci. 2017, 27, 75–84. [Google Scholar] [CrossRef]
  115. Vojtko, V.; Štumpf, P.; Rašovská, I.; McGrath, R.; Ryglová, K. Removing uncontrollable factors in benchmarking tourism destination satisfaction. J. Travel Res. 2020, 1–14. [Google Scholar] [CrossRef]
  116. Linacre, J.M. Winsteps Software (Version 4.8.0); Winsteps: Beaverton, Oregon, 2021. [Google Scholar]
  117. Arnold, J.C.; Boone, W.J.; Kremer, K.; Mayer, J. Assessment of competencies in scientific inquiry through the application of Rasch measurement techniques. Educ. Sci. 2018, 8, 184. [Google Scholar] [CrossRef] [Green Version]
  118. Park, E.Y.; Chae, S. Rasch analysis of the Korean Parenting Stress Index Short Form (K-PSI-SF) in mothers of children with cerebral palsy. Int. J. Environ. Res. Public. Health 2020, 17, 7010. [Google Scholar] [CrossRef]
  119. Shoahosseini, R.; Baghaei, P. Validation of the Persian translation of the Children’s Test Anxiety Scale: A multidimensional Rasch model analysis. Eur. J. Investig. Health Psychol. Educ. 2020, 10, 59–69. [Google Scholar] [CrossRef] [Green Version]
  120. Cho, E.H.; Jang, C.Y.; Kwak, Y.S.; Kim, E.J. The psychometric characteristic of the taekwondo electronic protector cognition scale: The application of the Rasch model. Int. J. Environ. Res. Public Health 2020, 17, 3684. [Google Scholar] [CrossRef] [PubMed]
  121. Choi, S.; Ham, Y.H.; Han, K.; Ryu, E. Knowing in nurses’ belief and attitude about patient activation: A validation of the korean clinician support for patient activation measure using Rasch analysis. Healthcare 2020, 8, 571. [Google Scholar] [CrossRef] [PubMed]
  122. Linacre, J.M. Unidimensional models in a multidimensional world. Rasch Meas. Trans. 2009, 23, 1209. [Google Scholar]
  123. Oreja-Rodríguez, J.R. Análisis de la dimensinoalidad en el Modelos de Rasch. Estudio comparaivo de dos casos. In Modelos de Rasch en Administracion de Empresas. Nuevos Desarrollos; Oreja-Rodríguez, J.R., Febles-Acosta, J., Eds.; Fyde CajaCanarias: Santa Cruz de Tenerife, España, 2010; pp. 23–47. [Google Scholar]
  124. Sumintono, B.; Widhiarso, W. Aplikasi Model Rasch Untuk Penelitian Ilmu-Ilmu Sosial; Trim Komunikata Publishing House: Cimahi, Indoonesia, 2014; pp. 1–27. [Google Scholar]
  125. Cadavid, N.; Delgado, A.R.; Prieto, G. Construcción de una escala de depresión con el modelo de Rasch. Psicothema 2007, 19, 515–521. [Google Scholar] [PubMed]
  126. Wright, B.D. Despair and hope for educational measurement. Contemp. Educ. Rev. 1984, 31, 281–288. [Google Scholar]
Figure 1. The Rasch methodology continuum of the latent variable called in this study as tourism competitiveness [76].
Sustainability 13 07169 g001
Figure 2. The Wright map. Note: M: Mean of location or pillar distribution; S: One standard deviation from the location or pillar mean; T: Two standard deviations from the location or pillar mean.
Sustainability 13 07169 g002
Figure 3. Portugal PKMAP.
Sustainability 13 07169 g003
Table 1. TTCI structure.
Travel and Tourism Competitiveness Index (TTCI): 4 Sub-Indexes, 14 Pillars
Enabling
Environment
(Captures the general conditions necessary for operating in a country)
25% Weight
T and T Policy and Enabling Conditions
(Captures specific policies or strategic aspects that impact the T and T industry more directly)
25% Weight
Infrastructure
(Captures the availability and quality of physical infrastructure of each
economy)
25% Weight
Natural and Cultural
Resources
(Captures the principal “reasons to travel”
25% Weight)
Pillar 1: Business
Environment
12 indicators
5% Weight
Pillar 6: Prioritization of Travel and Tourism
6 indicators
6.25% Weight
Pillar 10: Air Transport Infrastructure
6 indicators
8.33% Weight
Pillar 13: Natural Resources
5 indicators
12.5% Weight
Pillar 2: Safety and
Security
5 indicators
5% Weight
Pillar 7: International
Openness
3 indicators
6.25% Weight
Pillar 11: Ground and Port
Infrastructure
7 indicators
8.33% Weight
Pillar 14: Cultural Resources and Business Travel
5 indicators
12.5% Weight
Pillar 3: Health and Hygiene
6 indicators
5% Weight
Pillar 8: Price Competitiveness
4 indicators
6.25% Weight
Pillar 12: Tourist Service Infrastructure
4 indicators
8.33% Weight
Pillar 4: Human Resources and Labor Market
9 indicators
5% Weight
Pillar 9: Environmental Sustainability
10 indicators
6.25% Weight
Pillar 5: ICT Readiness
8 indicators
5% Weight
Table 2. Dimensionality data.
ContentEigenvalueObserved
Total raw variance in observations48.55100%
Raw variance explained by measures33.5569.10%
Raw Variance explained by items22.4946.30%
Unexplained variance in 1st contrast3.205.10%
Table 3. Pillars’ summary statistics.
Total ScoreCountMeasureModel S.E.INFITOUTFIT
MNSQZSTDMNSQZSTD
MEAN570.1140.00.000.111.00−0.941.01−0.88
MAX.757.0140.03.060.132.418.332.709.19
MIN.307.0140.0−2.310.100.15−9.900.15−9.90
REAL RMSE = 0.12TRUE SD = 1.42SEPARATION = 11.45PERSON RELIABILITY = 0.99
MODEL RMSE = 0.11TRUE SD = 1.42SEPARATION = 12.95PERSON RELIABILITY = 0.99
PILLAR RAW SCORE-TO-MEASURE CORRELATION = −1.00
Table 4. Countries summary statistics.
Total ScoreCountMeasureModel S.E.INFITOUTFIT
MNSQZSTDMNSQZSTD
MEAN61.115.0−0.110.330.98−0.201.01−0.12
MAX.82.015.02.420.393.063.643.444.06
MIN.38.015.0−2.620.320.20−3.340.22−3.23
REAL RMSE = 0.37TRUE SD = 1.07SEPARATION = 2.90PERSON RELIABILITY = 0.90
MODEL RMSE = 0.33TRUE SD = 1.08SEPARATION = 3.23PERSON RELIABILITY = 0.91
PERSON RAW SCORE-TO-MEASURE CORRELATION = 1.00
CRONBACH ALPHA (KR-20) PERSON RAW SCORE “TEST” RELIABILITY = 0.91 SEM = 3.11
Table 5. Pillars and TTCI analysis results.
Pillars and TTCIWEF Sub-IndexRM
Total Score
RM
Measure (Logits)
RM
Correlation with LV
Importance for Competitiveness
Pillar 14: Cultural Res. and Business Travel43073.060.66Low
Pillar 13: Natural Resources44321.530.41
Pillar 10: Air Transport Infrastructure34381.460.87
Pillar 7: International Openness24601.230.67Medium
Pillar 11: Ground and Port Infrastructure34811.000.83
Pillar 12: Tourist Service Infrastructure35640.120.88
Pillar 9: Environmental Sustainability2595−0.220.56High
Pillar 1: Business Environment1622−0.530.66
Pillar 4: Human Res. and Labor Market1636−0.690.80
Pillar 5: ICT Readiness1637−0.700.88
Pillar 6: Prioritization of Travel and Tourism2639−0.720.68Very high
Pillar 3: Health and Hygiene1699−1.470.75
Pillar 2: Safety and Security1749−2.180.57
Pillar 8: Price Competitiveness2757−2.310.45
-TTCI5350.430.91
Mean-5700.00-
Table 6. Category structure.
CategoryFrequency (Count.)Frequency (%)Observed
Average
OUTFIT MNSQAndrich ThresholdCategory MeasureCoherence
M→CC→M
1553−3.970.68NONE(−5.67)83%18%
227313−2.300.93−4.51−3.3858%47%
333216−1.370.80−2.00−1.7247%59%
461529−0.171.11−1.36−0.3360%61%
5475231.070.970.591.2649%61%
6331161.931.141.823.6961%42%
71911.981.735.46(6.58)0%0%
Table 7. Guttman scalogram.
Importancia Para La CompetitividadTTCITot.
Score
Muy AltaAltaMediaBaja
Pillars RM RankP8P2P3P6P5P4P1P9P12P11P7P10P13P14--
Sub-index number21121112332344--
1 United S.56666664754655582
2 Germany56756655664546581
3 Spain56666545754557581
4. France46656555664557580
5. Canada56656655644754579
6. Japan56656554665546579
7 Switzerland46666666664543579
8 United K.36656665654546578
9 Australia46656554645664577
10 Austria56756556754443577
………..….….….….….….….….….….….….….….….….
14 Portugal56666554744544576
………..….….….….….….….….….….….….….….….….
139 Chad54332334222231241
140 Yemen63422343221121238
Publisher’s Note: MDPI stays neutral with regard to jurisdictional claims in published maps and institutional affiliations.

