1. Introduction
With the finishing of construction on the main body of a freeway network, the ability to fully monitor the traffic status of the network has become an urgent need for both travelers and transportation operators alike [
1,
2,
3]. Meanwhile, a system that could fully monitor the traffic status would provide the opportunity for further active traffic control and management. Therefore, smart road, which has the ability to communicate with passing vehicles, provides information, and achieves real-time monitoring, has developed rapidly and drawn considerable attention by the public recently [
4]. Such need and opportunities are pressing for busy freeways installed with only limited monitoring devices. Regarding the duration and costs for the deployment of a monitoring system, other than conventional solutions (e.g., loop detectors and microwave detectors), new technologies, focusing on emerging big data resources and data mining approaches through machine learning, have been introduced in recent decades [
5,
6].
Data, generated by wireless communication networks, also known as cellular data, have been used to identify the characteristics of transportation, such as travel demand and traffic details. Regarding the benefits, broad coverage and high penetration rate of the communication network, especially since the internet has gone mobile, have revealed the pattern of individual human mobility from mobile phone data [
7,
8]. Studies have also indicated that mobile phone location data are a feasible resource for estimating origin-destination flows and travel demand [
9,
10,
11]. These solutions have proved the potential and opportunities for cellular data application on large-scale issues which do not requiring extreme positioning accuracy.
With the promotion of the big data perspective, a data-driven learning application, which can reveal high-dimensional relations and reduce background noise, is proposed to estimate traffic status using the whole set of mobile phone data, rather than HO data. Two features are extracted from cellular activity data to replace the monitoring parameters generated from HO data, and these features are normalized to partially reduce the background noise. Furthermore, a large-scale experiment was conducted on a busy, 250 km expressway in China. The results were validated by ten bi-directional microwave detector stations. To the best of our knowledge, it was the first experiment with such extensive coverage and that many validation points.
The rest of this paper is organized as follows. In
Section 2, a general overview of previous, related studies is provided.
Section 3 introduces the composition of the mobile phone data and the procedure of generating two proposed phone features. In
Section 4, the learning models applied in this study are presented in detail. The following section,
Section 5, presents the experiment and the performance evaluations of this research. Finally,
Section 6 concludes that the learning application, based on cellular activity data, performs well in large-scale traffic status estimation.
2. Literature Review
Unlike GPS data, cellular data usually do not contain precise locations, which is a major obstacle for using it to estimate or predict short-term traffic details. In order to determine a phone in a communication network accurately, researchers introduced the handover (HO) mechanism, also known as handoff, which occurs mostly when a phone has an active call and passes the boundary of two cells [
12]. Through genuine cellular network HO data, Bar-Gera [
13] discussed the possibility of implementing a mobile phone-based system with the function of traffic speeds and travel time estimation. Demissie et al. [
14] studied the relation between traffic volumes and the number of HOs over the hours of a day. Evaluations confirmed the positive results and the promising future of HO-based traffic estimation methods [
13,
15].
However, real communication data always includes a massive number of unexpected and indeterministic errors and interferences, which can affect the performance enormously. Therefore, some researchers tried to fuse HO data with the conventional data of the on-road device, such as loop detectors or microwave detectors, to estimate traffic speed [
16], and analyze the performance of the integrated system [
17]. On the other hand, other researchers have focused on applying methodologies from different perspectives to reduce the impacts of system noise. Cheng et al. [
18] proposed particle filter-based models to cope with system noise and measurement errors. Demissie et al. [
14] utilized a single layer backpropagation artificial neural network (BP-ANN) to estimate three discrete levels of arbitrarily defined traffic counts with regard to the noise and sensitivity of HO data. Beside implementing complex statistical and machine learning models, Gundlegård and Karlsson [
19] showed that multiple road test runs would help to determine the relatively accurate HO location, thereby mapping with the road network. Nevertheless, multiple tests run for each HO point would increase the cost of deployment for the system of a large-scale freeway network.
Besides the problem of noise, the sample size of HO data is another essential attribute that affects the performance of a phone-based system, much the same as other data sources [
20]. Regarding the mechanism of HO data generation, when a phone is on a call and simultaneously passes the boundary of two cells, the HO data is only a small portion of the whole mobile phone dataset. To increase the sample size, Caceres et al. [
21] proposed models to estimate traffic flow using in-motion phone data, which is derived by combining HO data and the data of phones having two consecutive calls in two cells. However, such an increase might not be significant, especially considering the fact that many countries forbid the use of mobile phones while driving, phone conversations made while driving typically do not last long enough to pass through two cells, and the number of HO points adjacent to freeways could be sparse for a large-scale freeway. Literature on applying mobile phone data to estimate traffic measures can be found through references [
22,
23,
24,
25].
3. Cellular Activity Data and Extracted Features
The whole mobile phone dataset includes both network signals, such as location updates (LU) and handover (HO), and records for billing, such as phone call started, phone call ended, text messaging, and data service. Previous studies have usually focused on estimating traffic status using HO data [
13,
14,
18,
20]. In the cellular data of this study, raw HO records were only 12.7% of the total dataset. Intuitively, validated and useful HO records are even smaller after filtering and processing. In order to enlarge the sample size, Caceres et al. [
21] proposed the combination of HO data and the data of phones with two consecutive calls in two cells together as the model input. However, records of phones with active calls occupy 10.1%, which still cannot take the full advantage of the entire cellular data. Regarding the scale issue [
14], that is the relation between traffic and the number of phones, happened at different scales for different locations and for large-scale freeway traffic monitoring, the intuitive idea is to involve as many validated phones as possible into estimating traffic status. Therefore, instead of only involving phones with consecutive calls in two cells, phones that had consecutive records within a relatively short duration in two cells which are close to the target freeway were also counted. In this way, the potential data set was enlarged to almost cover the entire raw cellular activity data. Subsequently, Ding et al. [
25] established a method to extract two phone features, i.e., phone speed (PSP) and phone count (PC).
In this method, the base station, which is the center of each cell in the communication network, is mapped to the freeway based on the projection point and assigned with accumulative mileage computed from the route origin, which allows for a unique mileage for an individual base station. Regarding each raw data record only containing the base station identification, the projection point of the corresponding base station of each record is used to position the phone and is represented as
. The flowchart of the phone speed feature extraction for a certain phone,
, in an interval of
of a certain segment is shown in
Figure 1.
As shown in
Figure 1,
and
represent all raw mobile phone data records of a certain phone,
, during time interval
and
in the target segment, respectively.
The phone was defined as a valid phone if the mileage difference between the first and last records, in chronological order, during interval in , , and of the phone, , was not equal to zero. In addition, the movement direction of the phone could be determined through the sign of . The phone speed of phone was acquired via the computation of the ratio of the absolute value of to the time difference between the first and last records of phone during interval , .
On the other hand, if was equal to zero, the method retrieved the first record of phone in its previous interval, i.e., , and then used the abovementioned algorithm to calculate the phone speed again.
However, if matches none of the two cases mentioned above, the phone was defined as invalid and filtered out.
As indicated by Ding et al. [
25], the moving direction availability is the filter condition for the phones. The phone count can be kept as a second feature if the phone’s moving direction is available for each direction. Finally, the phone speed of each segment
over interval
in a certain direction,
, can be generated by calculating the mean value of the speed features of all valid phones in the corresponding direction and interval, and the phone count of each segment
over interval
,
, can be generated through counting the number of valid phones for each direction.
Due to the relaxed filter restriction, the scale issue, and the system noise, features were also applied with a scaling normalization method to regularize the searching space. The model descried in the next section was applied not only to reveal the pattern of estimating traffic status, but also to further denoise.
4. Learning Models
Based on those two extracted features, learning models were implemented to estimate the traffic status. In recent years, neural networks showed outstanding performance in practical contests [
26]. Regarding the spatiotemporal nature of traffic status among segments, a unique recurrent neural network (RNN) architecture, the long short-term memory (LSTM), was implemented since it has the capability of revealing the optimal time lags automatically. The detailed structure of an LSTM block is shown in
Figure 2.
The LSTM was proposed by Hochreiter and Schmidhuber [
27], and it was designed to avoid the gradient vanishing issue [
28]. An LSTM block consists of a memory cell,
, and three gates: the input gate,
, the output gate,
, and the forget gate,
. The basic computation workflow of a block for interval
t can be expressed in the form as follows:
Here,
denotes element-wise multiplication (Hadamard product),
denotes the input of the block over interval
t,
denotes the weight matrices between corresponding vectors (e.g.,
represents the matrix of weights from the input gate,
, to the input,
, of a memory cell),
represents the vector of bias values (e.g.,
represents the bias at the forget gate,
, of layer
k), and
denotes the output of the LSTM memory block over interval
t. The activation function of all gates is the sigmoid function [
29], and the tanh-function is applied for other activations.
With the trend of the model going “deeper” in the neural network field, studies have confirmed that a deep learning model could give an excellent performance on pattern recognition, classification, and prediction-related topics, though theoretical interpretability is an on-going task. Regarding the high background noise of the raw mobile phone data, and the advantage of figuring out the high dimensional relations among features, a three-level LSTM neural network (LSTM-3) was implemented for this study (
Figure 3).
For each direction of segment
over interval
t, the input of layer
k is denoted as
, while the output is denoted as
. Specifically, the definitions are as follows:
Here, and are the corresponding feature of segment i over interval t. , , and are the weight, the output vector of LSTM blocks, and the bias, respectively. A linear function, , is used to aggregate attributes.
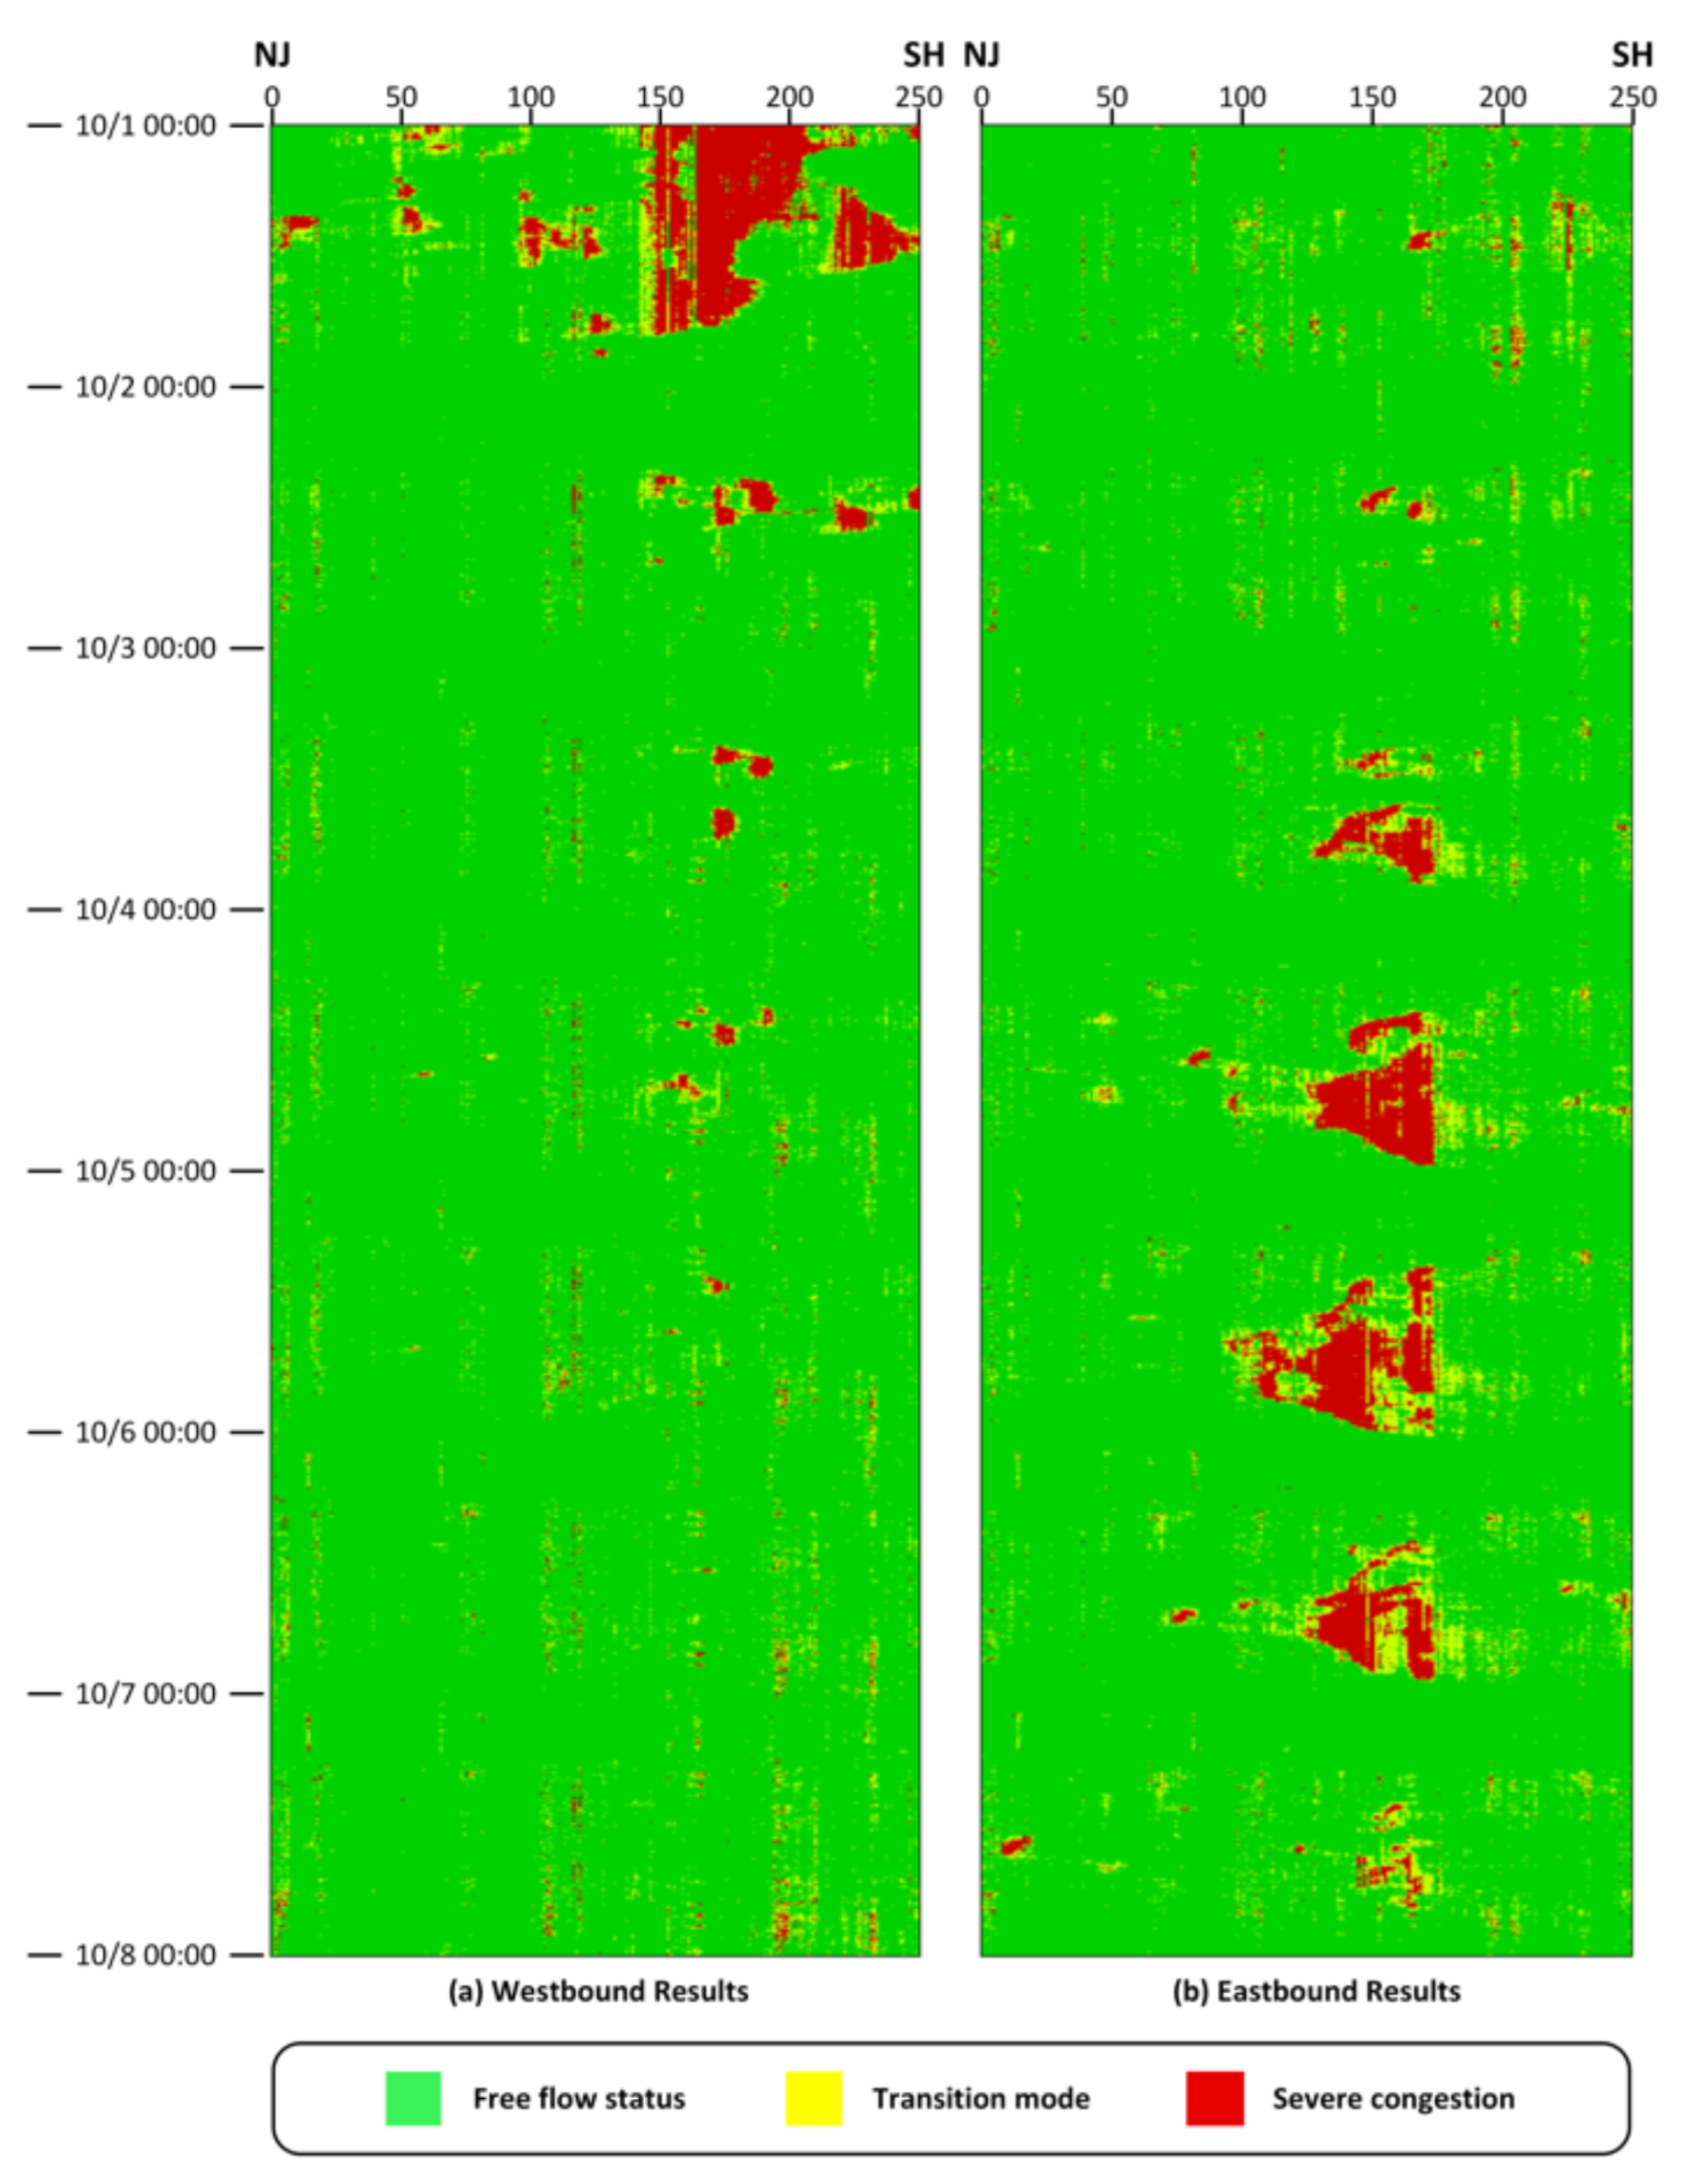
The final output was the traffic status. The traffic status here classified traffic conditions into three levels: free flow (L0), transition mode (L1), and severe congestion (L2). Each level was assigned a unique color (
Table 1). In this study, unlike the work of Demissie et al. [
14], the levels were uniformly divided based on traffic speed limits rather than on volume. This was because the nature of traffic flow, where the low traffic could either refer to free flow status or severe congestion, cannot represent the running conditions from the operational point of view. The speed range of each level was defined arbitrarily by the local traffic operation center.
Furthermore, a single layer feedforward neural network (FNN-1) and a single layer LSTM neural network (LSTM-1) were also applied to compare the classification performance on the time series data of phone features with the LSTM-3 model.
5. Case Study in Jiangsu, China
The testbed of this study is a busy, eight-lane freeway in Jiangsu, China [
30]. It is divided evenly into 250 one-kilometer-long segments.
Figure 4 demonstrates the view of the research area. The data collection, for both cellular activity data and microwave data, was conducted from 00:00 1 October 2014 to 23:59 7 October 2014, covering the whole “National Day Golden Week”. The microwave data were collected from roadside detector stations and aggregated by a local transportation operation center for every 5 min. As the detectors of station No. 4 were not fully functional, only data from the other ten stations were involved in this experiment for both directions. To reduce the impacts of outliers and noise, microwave data were firstly smoothed by the seasonal trend decomposition (STL) procedure [
31], then classified into three levels based on the speed (
Table 1).
Based on the processed microwave data for the ten validation segments of the westbound direction, over the “National Day Golden Week” 19,366 intervals were labeled as L0, 203 intervals as L1, and the remaining 591 intervals as L2. For the eastbound direction, the numbers were 19,146 L0, 429 L1, and 585 L2. The three levels of traffic status were exceptionally unevenly distributed, which fit with expectations. However, this would impact the performance evaluation if only the overall classification accuracy was considered as other studies did [
14], since that estimated all intervals at L0 could already achieve high accuracy. Therefore, two terms, precision and recall, were introduced to evaluate the performance of learners for each traffic state level.
In similar topics, such as pattern recognition and binary classification, precision and recall are widely applied to measure the relevance, particularly for imbalanced classification problems. Precision is the ratio of correctly estimated instances among the retrieved instances, while recall is the fraction of correctly estimated instances over the total amount of actual observed, relevant instances. For a single class, Equations (9) and (10) use true positive (TP, actual true and estimated as true), false positive (FP, actual true and estimated as false), and false negative (FN, actual false and estimated as false) to present the definition of precision and recall.
Table 2 and
Table 3 indicate the confusion matrixes, corresponding precision, recall and overall accuracy for both directions and three learners. After training, all learners could detect three traffic status levels and especially perform well in the detection of free flow status and severe congestions. Compared to the other two levels, all learners did not express promising performance on the transition mode (L1). The potential reasons for this specific phenomenon include:
- 1.
The transition mode is a relatively unstable state and typically only lasts for a short period of time. Therefore, there are not adequate samples to train and validate learning models, especially deep ones;
- 2.
Current validation data were collected from microwave detectors, which report the instantaneous speed for vehicles. For some intervals, the change of levels defined by such speed could be short and intense (jumping L1) even though the aggregation and the denoise processes were applied. However, extracted features were generated by the average space-mean speed of each valid phone, so learners might incorrectly classify the traffic state due to the sensitivity;
- 3.
Though all detectors were fully functional during the research period, no individual microwave detector is identical to another, which means results could vary for different detectors even if monitoring the same traffic condition. It is better to involve a second validation data source to verify the performance and correctness further.
In general, learning models could distinguish traffic states based on extracted features from cellular activity data. Furthermore, based on the overall accuracy, the three-level LSTM model showed the best performance for both directions although the differences were not very significant compared to the ones of the other two learners. Nevertheless, this improvement was hard to achieve due to the complex high-dimensional feature relations. The deep model indeed learned to reveal the relationship between traffic states and extracted features.
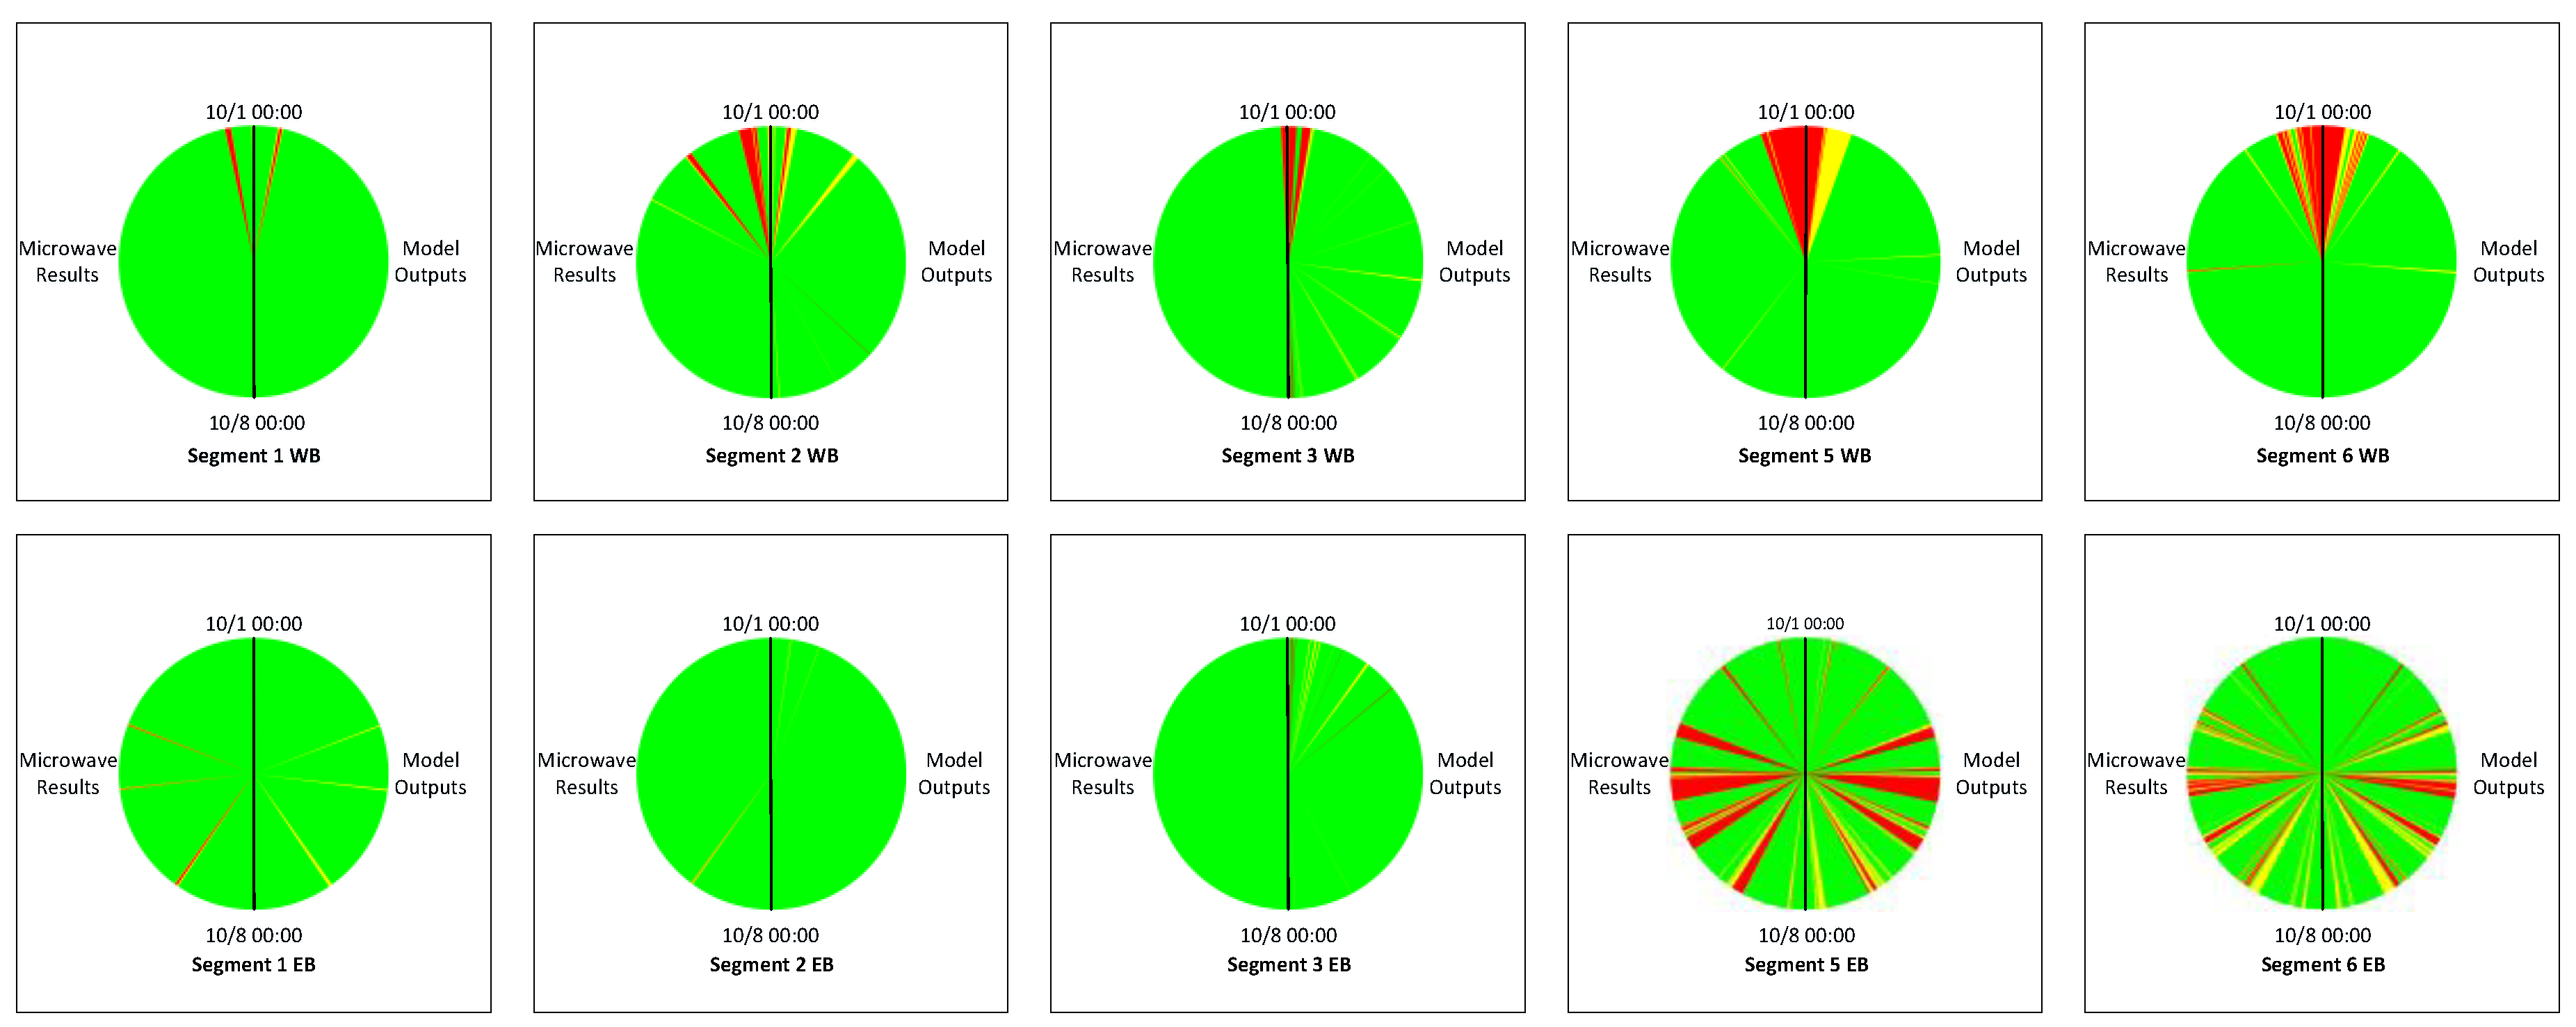
Figure 5 demonstrates the comparisons between levels according to microwave data (after STL procedure) and the LSTM-3 model outputs for validation links with L1 and L2 conditions. As the study covered an entire week, and each interval was 5 min, pie charts were applied to present the results of selected validation links. The left half circle of each chart indicates the traffic status levels based on traffic speed obtained from microwave detectors and the right represents the model outputs.
Intuitively, the pie charts in
Figure 5 are mostly symmetrical. Therefore, the LSTM-3 outputs are essentially matched with the traffic status as defined by the microwave data. There are certain false alarms and detection time latency, which are because of the nature of cellular activity data and the reasons mentioned earlier. Meanwhile,
Figure 6 presents the final results of LSTM-3 covering the entire 250 km large-scale freeway over the research period. The diagram matches the practical understanding of bottlenecks on a freeway and the concept of spatiotemporal congestion propagation. According to the final results, the learning model is a promising method to detect three level traffic states under extreme volumes when only limited roadside equipment is installed.
6. Summary and Future Works
This research presents a data-driven learning-based method to detect three level traffic states using a big data resource, specifically, cellular activity data. Two features, the phone count (PC) and the phone speed (PS), were extracted from the raw cellular activity data and considered as model inputs for learners. Three types of learners, a single layer feedforward neural network (FNN-1), a single layer LSTM network (LSTM-1), and a three-level LSTM (LSTM-3), were employed to indicate and verify the performance of learning models, especially the deep model, on traffic state estimation. The proposed method took advantage of the broad coverage of the wireless communication network and used features, rather than conventional handover and location update records, to monitor traffic states.
The case study of this research took place on a busy, 250 km expressway in China during the “National Day Golden Week” of 2014. The three traffic status levels were defined by the local traffic operation center. On the expressway, there were ten working microwave detector stations, which were selected as validation segments, and the ground truth levels were computed through the data collected by the microwave detectors. Regarding the fact that traffic states are not uniformly distributed, two evaluation parameters, precision and recall, as well as overall accuracy, were involved in measuring the estimation results. According to the overall accuracy, the deep model achieved the best outcomes for both directions. Meanwhile, a detailed spatiotemporal traffic states diagram was demonstrated to perform the final results, which indicates the promising performance and the bright future of the proposed method to monitor traffic details for freeways with limited conventional roadside detectors installed.
Nevertheless, the results were promising, but still have space for future improvements. Additional studies are desperately needed, including examining the impacts of traffic states levels, specifically the different numbers of levels and different ranges for each level. Future research could work on proposing methods to detect the transition mode precisely and in detail. With further enhancements, the traffic monitoring solution based on cellular activity data should be a promising implementation that could cover large-scale freeways and be deployed easily, even with limited numbers of roadside equipment.


