1. Introduction
Omnichannel shopping provides customers with the option to make purchases at any time and place. Recent research [
1] reported that 71% of in-store customers used a smartphone to conduct online research and 56 percent of every dollar spent in-store was influenced by the customers’ use of a digital device prior to purchasing [
2,
3]. In 2019, 62% of U.S. customers engaged equally with online and offline shopping channels to make a purchase [
4].
Omnichannel retailing is important for many [
5], and especially for fashion department stores retailers [
4]. In this study, we defined a fashion department store as one that offers a wide variety of fashion items in different product categories. Fashion department stores are in a volatile position as they face a faster cycle of seasonality than many other retailers because of the ease with which customers can find information online. This means that merchandise must be cleared and refreshed more quickly than ever before. The costs to meet customers’ demands are very high, especially if the retailer continues to maintain physical stores, which makes sustaining the business more challenging than ever. Some U.S. fashion department stores, such as Macy’s, Nordstrom, and Kohl’s, have closed some of their physical stores in recent years [
6].
This research aims to understand omnichannel retailing customers from the perspective of their interactions with fashion department store retailers. Understanding customers’ perspectives can help retailers focus on what customers deem important. Thus, this focus appears likely to improve fashion department stores’ opportunities not only to sustain their businesses but also to excel in the future.
The end goal of all retailers is for the customer to make purchases from their stores. Thus, this research is based on a theoretical model that assumes purchase intentions. This research examines how customers are influenced by the following two things: overall perceived service available through an omnichannel retailer’s channels and perceived transparency and consistency across channels, both of which are mediated by brand attitude. This study aims to address two research questions. (a) What are the relationships between service configuration quality and channel integration quality, specifically perceived fluency, and the customers’ purchase intention in the omnichannel retail fashion department store setting? (b) What is the relationship between behavioral attitudes, specifically customers’ brand attitude, and customers’ purchase intention?
2. Literature Review and Hypotheses Development
2.1. Consumer Behavior Theories Used in Omnichannel Research
Much of the previous research about omnichannel retailing has focused on consumer behavior. The primary theories used in previous research stemmed from the Theory of Reasoned Action (TRA) [
7], which was later developed into the Theory of Planned Behavior (TPB) [
8]. The premise of the TRA is that a person’s overall attitude toward an object is derived from their beliefs and feelings about the object’s various attributes [
7]. Later, Ajzen [
9] extended the TRA’s boundaries, adding the concept of perceived behavioral control as an exogenous variable that has both a direct and an indirect effect on behavior through intentions. Overall, the TPB assumes that behavioral intentions are influenced by three antecedents: attitude toward the behavior, subjective norms, and perceived behavioral control [
10].
2.2. Theories Used in Information Technology Research
As customer perceptions of omnichannel retailing are heavily influenced by technology, which is a necessary component of omnichannel retailing, theories used to research information technology are also relevant. In general, research related to information technology (IT) stems from two major streams: research on user satisfaction [
11] and research on technology acceptance [
12,
13]. According to DeLone and McLean [
11], user satisfaction is defined as the user’s response to information technology usage and how well it meets the user’s expectations. Research on technology acceptance is complementary as it also relates to use—specifically, the user’s perceived usefulness of the technology and perceived ease of technology usage [
12]. Perceived usefulness is defined as the user’s perception of the increase in performance that will be achieved by using a specific technology. Perceived ease of use is defined as the user’s perception of the degree of effort that the user needs to use a specific technology. The combination of these two research streams focuses on the idea of the user’s attitude about an information system or an object-based belief.
In information technology research, the Technology Acceptance Model (TAM) is a commonly used theory, especially in research on online shopping. Fred Davis [
12] developed TAM1 in his doctoral thesis, where he proposed that the use of a system can be explained or predicted by the user’s motivations, which are directly influenced by an external stimulus that consists of the actual system’s features. The TAM has undergone several advancements and introduced new variables since its inception. For example, the TAM3 model [
13] suggested that experience moderates the relationships between (i) perceived ease of use and perceived usefulness, (ii) computer anxiety and perceived ease of use, and (iii) perceived ease of use and behavioral intention [
14].
2.3. Unified Theories of Acceptance and Use of Technology
More recently, a unified theory of acceptance and use of technology (UTAUT) [
13] was introduced as a combination of several theories, including the TRA, TPB, and TAM. The original UTAUT explained intentions to use information systems based on perceptions using the first TAM model. In UTAUT, social influences and facilitating conditions as well as several other moderators were added [
13].
Within this field of research, Wixom and Todd [
15] published a framework that separated object-based beliefs from behavioral beliefs in a model that linked literature on user satisfaction and technology acceptance. Wixom and Todd’s [
15] framework acknowledged the limitations of the TRA [
7], the TPB [
8], and the TAM [
12]. In IT, Wixom and Todd’s [
15] model is widely accepted, as many researchers have used it as a basis for their studies (for example, Sun et al. [
16]). Their model identified the importance of distinguishing between behavioral beliefs and object-based beliefs. In contrast to object-based beliefs, which are based on the user’s perceptions of the functions and features of an IT object, behavioral beliefs are thought to be based on how users evaluate the experience of using an IT object. In the context of omnichannel fashion department store retailing, examples of IT objects are in-store digital, virtual, and augmented reality merchandising and a store’s app to be used on a mobile phone. The key distinction between behavioral beliefs and object-based beliefs here is in the underlying user evaluation of the experience versus the functionality of the IT object [
15]. In particular, previous IT research has established that user behavioral beliefs toward the system may change with more experience with the object [
17].
Later, Shen et al. [
18] adopted the Wixom and Todd [
15] model for use in research on omnichannel retailing, in the context of the restaurant business. Drawing upon the work of Sousa and Voss [
19], the Shen et al. model added the Wixom and Todd model into their framework. Sousa and Voss [
19] introduced two types of channel integration quality: channel service configuration quality and channel integration quality. While Wixom and Todd’s [
15] object-based belief was defined as the available combination of technological features and functionalities’ channel components and their associated delivery channels shaping behavioral beliefs [
19], Shen et al. [
18] defined object-based belief toward service quality as service configuration quality in the omnichannel retailing context.
2.3.1. Service Configuration Quality and Perceived Fluency
In previous IT research, behavioral beliefs refer to the users’ perceptions of the fluency of a channel(s) (or perceived fluency) [
18]. In omnichannel retailing, users’ cognitive perceptions, trust, attitudes, and choice outcome judgments are thought to influence users’ perceived fluency [
20,
21]. Fluency originates from the idea of ease in information processing [
22,
23]. That is, when a customer judges that using a particular channel seems difficult, the customer will likely cease to use that channel. In this context, perceived fluency can be defined as customers’ perception that the experience of obtaining information across the channels is continuous, smooth, and unconstrained [
18].
To maximize sales, omnichannel fashion department store retailers desire that the customers view all their channels as relatively easy to use. In fact, Majrashi and Hamilton [
24] and Shin [
25] extended the concept of perceived fluency to what IT researchers refer to as a cross-platform context. They found that perceived fluency is essential to the continuation of a cross-platform transition and migration, which are important to customer experiences. Sousa and Voss [
19] found that service configuration quality is composed of two dimensions: channel choice breadth and channel service transparency. Channel choice breadth is defined as the extent to which a customer can freely choose and use different channels and information according to their needs and satisfaction. Channel service transparency is defined as the degree of familiarity that is attributed to the features and functionality of a retailer’s available channels. Both definitions assume that the customer is aware of the available channels and each channel’s different attributes.
Overall perceived service can be viewed as the perceived fluency of customers’ experiences while shopping in the omnichannel shopping environment. Shen et al. [
18] found that when a customer perceives a fluent service configuration quality, they have a positive attitude that increases the likelihood of further using an omnichannel retailer’s different channels. Furthermore, previous research has found that service configuration quality affects perceived fluency [
18]; specifically, both channel choice breadth and channel service transparency have a positive influence on user-perceived fluency. Therefore, we hypothesized the following:
Hypothesis 1 (H1a). The channel choice breadth of omnichannel fashion department store retailers has a positive influence on their customers’ perceived fluency.
In addition, Bitner et al. [
26] found that many customers were unaware of the availability of a service provider’s channel variety. Customers who do not know about a provider’s channels have been shown to be an issue [
5,
27] for department store retailers, as these customers represent a lost opportunity for retailers. Given that channel service transparency is directly related to a customer’s familiarity with the attributes of all available channels, Sousa and Voss [
19] argued that the transparency of existing channels could contribute to service configuration quality. Researchers [
18,
28] also found that channel service transparency contributes to service configuration quality, which in turn affects customers’ perceived fluency. Therefore, we hypothesized the following:
Hypothesis 1 (H1b). The channel service transparency of omnichannel fashion department store retailers has a positive influence on their customers’ perceived fluency.
2.3.2. Channel Integration Quality
Channel integration quality is the second dimension of object-based beliefs in the Shen et al. [
18] model. It has been regarded as the key success factor in managing customer relationships across all channels [
29,
30]. Channel integration is a way to streamline the use of multiple forms of interactions with the customer. Channel integration refers to any or all the retailers’ channels, the retailers’ media, the fulfillment mode, the website, and/or the physical stores.
Previous research, for example, conducted by Madaleno et al. [
31], stated that integration across different channels increases customers’ perceived value when purchasing online. Simultaneously, they argued that, without channel integration, multichannel retailing could not evolve to omnichannel retailing.
Previous retail research has defined channel integration quality as composed of two dimensions—process and content consistency across channels [
30,
32]. Process consistency refers to the “degree of consistency of relevant and comparable process attributes across channels” [
29]. Examples of process features in the omnichannel fashion retail environment are websites and/or apps. More importantly, Shen et al. [
18] found that process consistency has a positive influence on customers’ perceived fluency when they use restaurant apps and websites. However, little or no other research has examined the effect of channel content consistency on customers’ perceived fluency in omnichannel fashion retailer settings. Therefore, we hypothesized the following:
Hypothesis 2 (H2a). The consistency of the processes of omnichannel fashion department store retailers has a significant and positive influence on customers’ perceived fluency.
Content consistency refers to the consistency of information features across different channels [
29]. An example of an information feature in the omnichannel fashion retail environment is product descriptions. Meeting both process and content consistency is assumed to achieve channel integration quality [
19,
28,
29]. However, this relationship has not been tested in the omnichannel fashion retailer setting. We therefore propose the following hypothesis:
Hypothesis 2 (H2b). The consistency of the content belonging to an omnichannel fashion department store retailer has a significant and positive influence on customers’ perceived fluency.
2.3.3. Perceived Fluency, Behavioral Attitudes, and Purchase Intention
According to the theory of fluency [
33], when presented with a stimulus, individuals will automatically evaluate the value of that stimulus, which can be translated into a judgment on the ease or difficulty of processing new information [
34]. Therefore, “the power of a brand lies in what customers have learned, felt, seen, and heard about the brand” Keller [
35]. In essence, the strength of a brand depends on what customers have experienced in the past with the brand, such as fluency [
36], which in turn forms the customers’ attitude toward the brand [
37].
In the context of omnichannel fashion retailing, customers’ behavioral attitude can be translated as brand attitude. Attitude is defined as a person’s summary evaluation of someone or something that is reflected in that person’s behavior [
38]. Much research has shown that customers’ brand attitude shapes their purchase intentions [
39,
40]. However, in the omnichannel fashion retailing context, we have yet to find a study that examines the relationship between perceived fluency and brand attitude. Given that this study’s previous hypotheses predicted that service configuration quality and channel integration quality would independently affect customers’ perceived fluency, we also hypothesized the following:
Hypothesis 3 (H3a). Through service configuration quality, omnichannel fashion customers’ perceived fluency positively influences brand attitude.
Hypothesis 3 (H3b). Through channel integration quality, omnichannel fashion customers’ perceived fluency positively influences brand attitude.
Finally, purchase intention can be defined as a customer’s conscious plan to make a future purchase of a product or engage in a service through one of the retailer’s channels [
41]. Many studies have established that customers’ purchase intentions are influenced by many different factors [
42]. Brand attitude is one of the most commonly identified factors. However, little or no research has shown that service configuration quality and channel integration quality independently affect customers’ perceived fluency, and therefore, their purchase intention. Thus, we propose the following hypotheses:
Hypothesis 4 (H4a). Through service configuration quality, the brand attitude of customers of omnichannel fashion retailers mediates the relationship between perceived fluency and purchase intention.
Hypothesis 4 (H4b). Through channel integration quality, the brand attitude of customers of omnichannel fashion retailers mediates the relationship between perceived fluency and purchase intention.
3. Methods
3.1. Online Survey
For this study, we chose an online survey method to reach the general populations that are customers of omnichannel fashion department stores across the United States.
3.2. Measurement Items
The measurement items for channel choice breadth, channel service transparency, channel content consistency, and channel process consistency were adapted from Sousa and Voss [
19], Madaleno et al. [
31], Huré et al. [
43], and Wu and Chang [
44]. The measurement items for channel fluency were adapted from Shen et al. [
18] and Huré et al. [
43]. We added the words retailers and channels (i.e., the store, the website, social media, and mobile app) to the measurement items to add clarity in consideration of the study’s context. For example, in the measurement of the breadth of channel choice, an item was worded, “I can accomplish preferred tasks through one or more of the store’s channels (the store, the website, social media, and mobile app).” The brand attitude measurement was adapted from Eren-Erdogmus et al. [
36] and Wixom and Todd [
15]. Lastly, the measurement for purchase intention was adapted from Ma [
45] and Ajzen and Fishbein [
8], while specifically adding the term “retailer” for clarity. See
Table 1 for the full list of the measurement items. To maintain consistency in the current study, as recommended in previous research [
46], all responses in this study were measured on a 5-point Likert scale, in which 1 represented “strongly disagree” and 5 represented “strongly agree.” The response choices for the measurement items for channel choice breadth, channel service transparency, and perceived fluency were adjusted from a 7-point to a 5-point Likert scale.
3.3. Pretest
A sample of 25 faculty and students (undergraduate and graduate) at a large university in the Southeastern United States pretested the questionnaire. Based on feedback, minor modifications in the wording of some items were made.
3.4. Data Collection
Dynata (formerly Survey Sampling International, Plano, TX, USA) recruited the respondents, based on the eligibility requirements of this study, to participate in the survey. Dynata maintains a demographically diverse web panel of people who opt to take selected surveys. For this study, Dynata panel members were randomly selected for an invitation to participate.
Multiple screening questions were used. One ensured that respondents were 18 years or older. Another screened respondents to select only those who had shopped at and used all of the channels (mobile app, social media, and website) of an omnichannel fashion department store in the United States in the past 12 months. To ensure a common understanding, the names of omnichannel fashion department stores were included in the question. We also used a quota system to ensure a distribution of respondents in each of six different age groups (18–24, 25–34, 35–44, 45–54, 55–64, and 65 and older). To ensure that respondents had a common understanding of the term channel, the survey started with an explanation of the term, namely that physical stores, websites, mobile apps, and social media were all retail channels.
We followed the Structural Equation Modeling (SEM) guidelines of 10 to 15 respondents per measurement item [
47] and set a sample size of 500, based on 31 measurement items. The data collection period was 20 February–16 March 2020. Respondents were asked to complete the survey online using their personal computers, smartphones, or tablets. Dynata paid USD 2.00 per completed survey per respondent. A total of 700 surveys were completed. However, 148 respondents were removed from the data for the following reasons: they were younger than 18 years old (3), they did not meet the study criteria of recent omnichannel fashion department store experience (87), or they provided incomplete data (58). Thus, the final sample size for data analysis was 552.
3.5. Sample Demographic Characteristics
Based on their past shopping experience, the top 5 omnichannel department store named by respondents were Macy’s (24.4%), JC Penney’s (20.3%), Kohl’s (19.5%), Nordstrom (13.4%), and Bloomingdale’s (8.9%). The study participants’ descriptions are presented in
Table 2. The descriptive statistics show that 76% of the respondents were between the ages of 18 and 44, with nearly equal proportions in the three age groups between 18 and 44 years. The sample had an almost equal number of men and women. One-half of the respondents were married. Respondents were equally divided across the six income groups, with the largest proportions earning between USD 70,000 and USD 99,999 (24.3%) and between USD 40,000 and USD 69,999 (18.7%). Our sample’s income statistics are consistent with those reported in Statista by Duffin [
48] (a median household income of USD 63,179), as 52% of our sample had an annual household income greater than USD 60,000. A typical department store shopper is slightly older and generally more affluent than the average shopper [
49].
4. Results
To ensure that there were no significant differences between demographic groups, we performed a one-way analysis of variance for two characteristics of interest, age and gender. We chose age because a diverse range of generations is represented in the current retail market as well as in the sample. We investigated gender because its influence on customer shopping behavior is considered critical in consumer behavior research [
50,
51]. Given the diverse ages represented in the sample, we first analyzed whether there were significant differences by age in perceived fluency, a key variable in our analysis. An ANOVA test with perceived fluency as the dependent variable indicated no statistically significant differences in perceived fluency by age
. There also were no statistically significant differences in perceived fluency by gender
Therefore, we combined all data into one group regardless of age and gender for further analyses.
4.1. Reliability of Construct Items
The Cronbach’s α for all of the scales in the questionnaire showed reliability greater than
, a value considered “adequate,” or better in Saad’s [
52] interpretation of the Cronbach’s α statistic. The Cronbach’s alpha values are reported in
Table 1.
4.2. Confirmatory Factor Analysis
Confirmatory Factor Analysis (CFA) with maximum likelihood estimation was used to verify that the construct items were reliable measures of the study’s constructs. We first tested the model with the following independent variables: channel choice breadth, channel service transparency, content consistency, and process consistency. The results indicated that channel choice breadth did not produce a good fit with the model based on Hu and Bentler’s [
53] cut-off value guidelines. The
of the measurement model was
with
.
We then dropped channel choice breadth as well as H1a and H3a from further analysis. We re-analyzed the model using the remaining three independent variables: channel service transparency, content consistency, and process consistency. The results showed improvement with an acceptable fit of
with
and an overall fit statistic of
. Although some of the inter-factor correlations were quite high (ranging from
to
; see
Table 3), convergent validity was supported as all of the factor loadings were significant (
). The construct reliability for each construct was above the recommended level of
, and the Average Variance Extracted (AVE) for each construct was in accordance with the recommended benchmark of
[
47].
Table 4 reports the standardized factor loadings, construct reliability, and AVE for each construct in the analysis.
4.3. Structural Equation Modeling
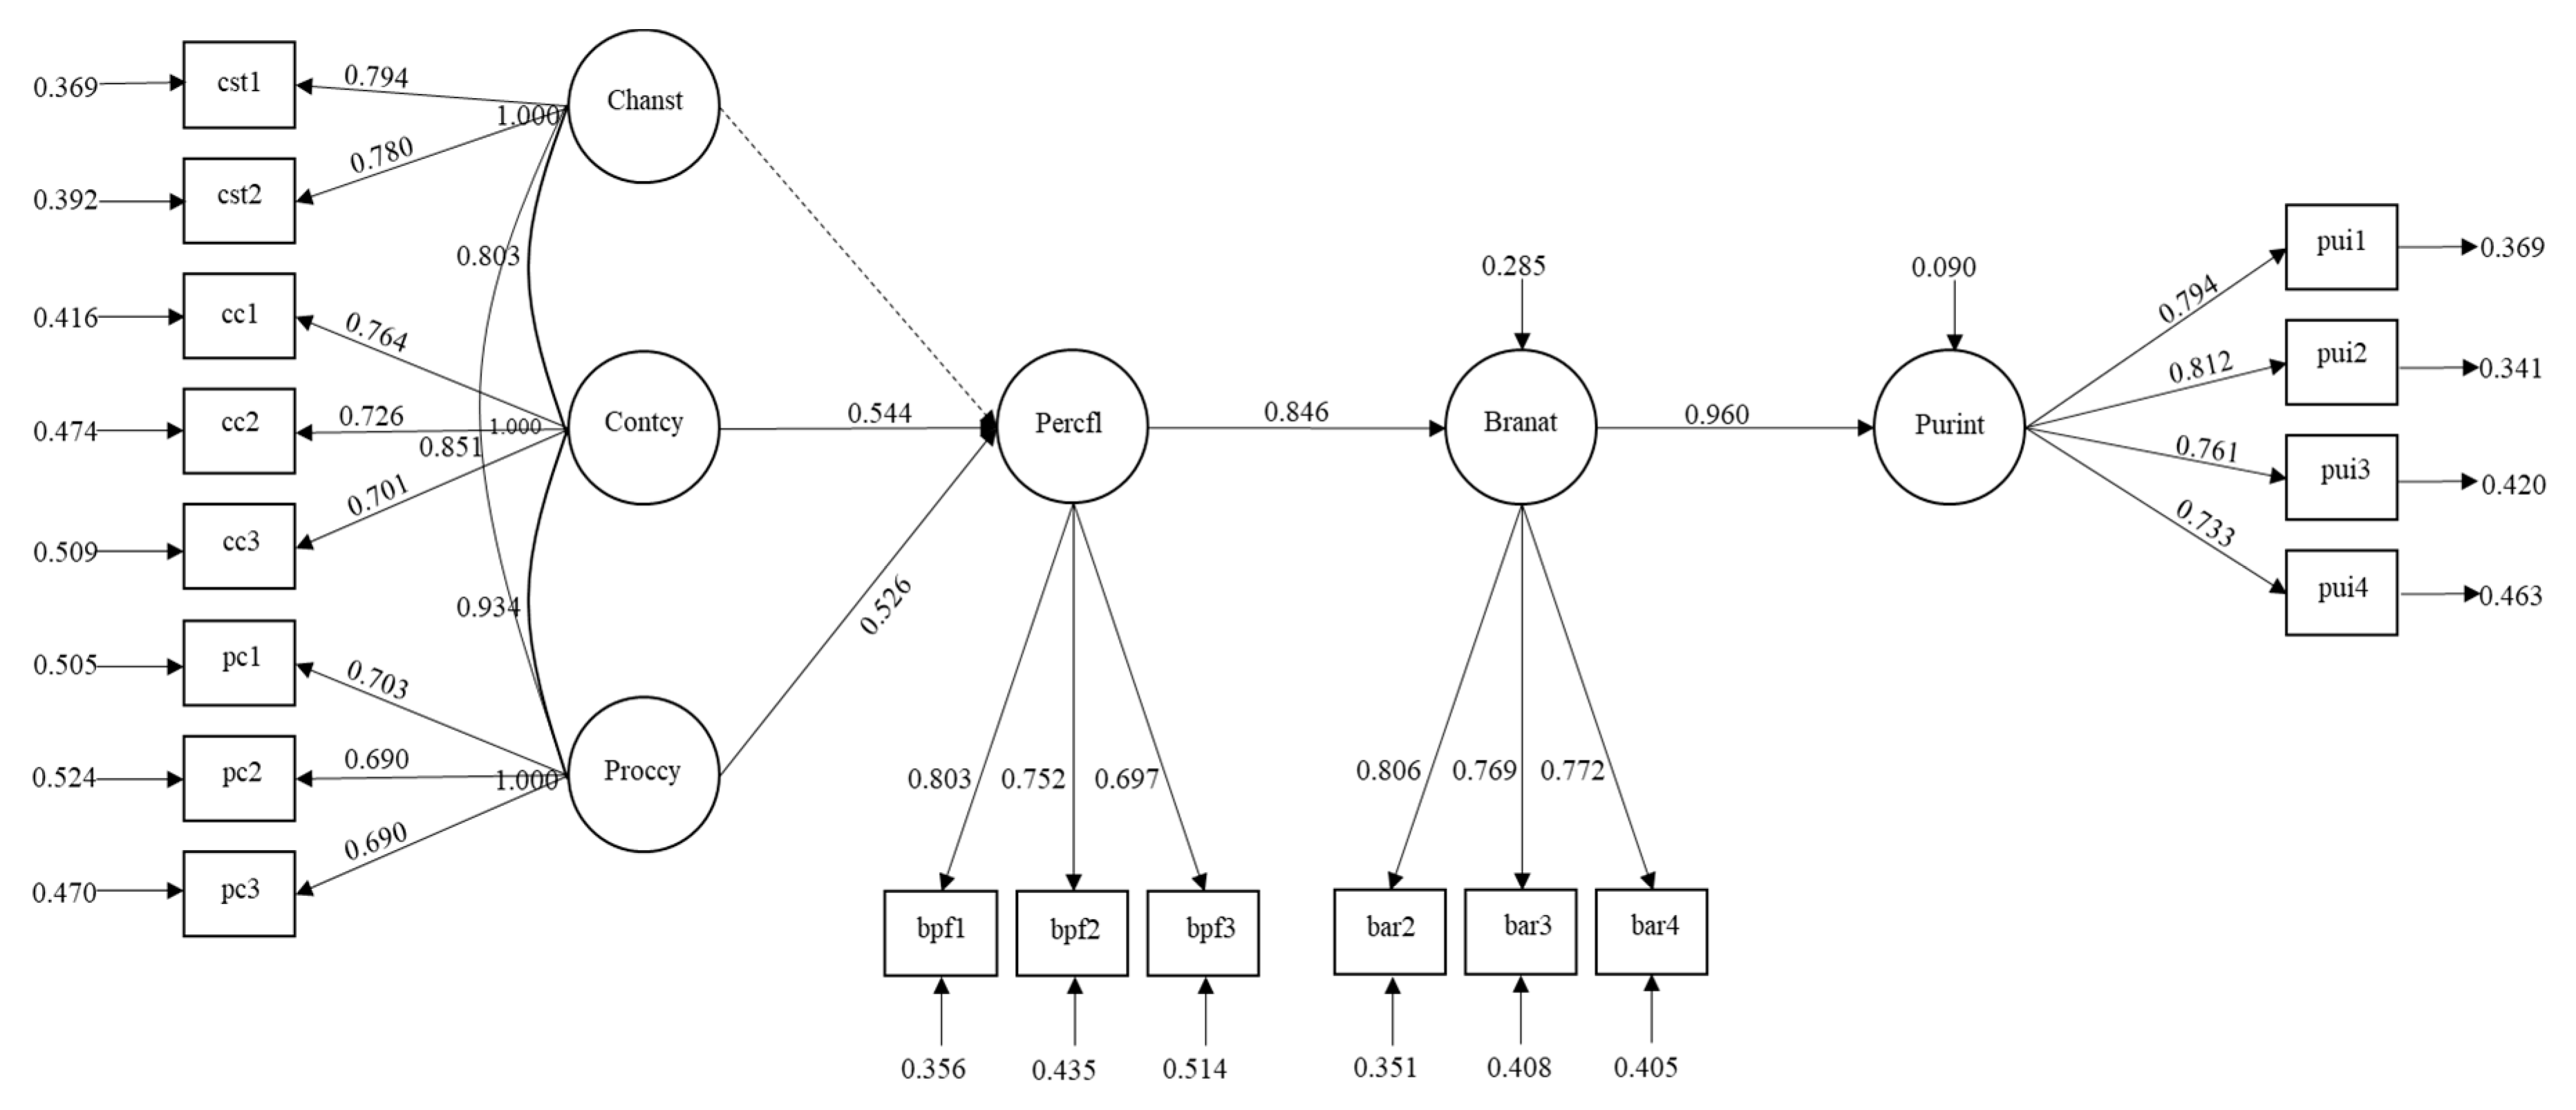
Structural Equation Modeling (SEM) was then conducted to test each of the study’s hypotheses. The results of the SEM analysis of the framework with three independent variables indicated that the model was a good fit (CFI = 0.934, TLI = 0.920, RMSEA = 0.075, SRMR = 0.033).
Figure 1 shows the SEM analysis. The SEM analysis also indicated that the path from channel service transparency (H1b) to perceived fluency was not statistically significant. Thus, H3a (through service configuration quality, omnichannel fashion customers’ perceived fluency positively influences brand attitude) and H4a (through service configuration quality, the brand attitude of the customers of omnichannel fashion retailers mediates the relationship between perceived fluency and purchase intention) were not tested, as there was no support to include either of the service configuration quality constructs in the final model.
The SEM analysis indicated that both H2a and H2b were significant, suggesting that both channel process consistency and channel content consistency have positive and significant influences on perceived channel fluency. The average factor loadings were 0.730 and 0.707, respectively, and
< 0.001. Perceived fluency (H3b) through channel integration quality was also statistically significant and had a positive influence on brand attitude. Finally, brand attitude (H4b) fully mediated the relationship between perceived fluency and purchase intention.
Figure 1 shows each measurement item.
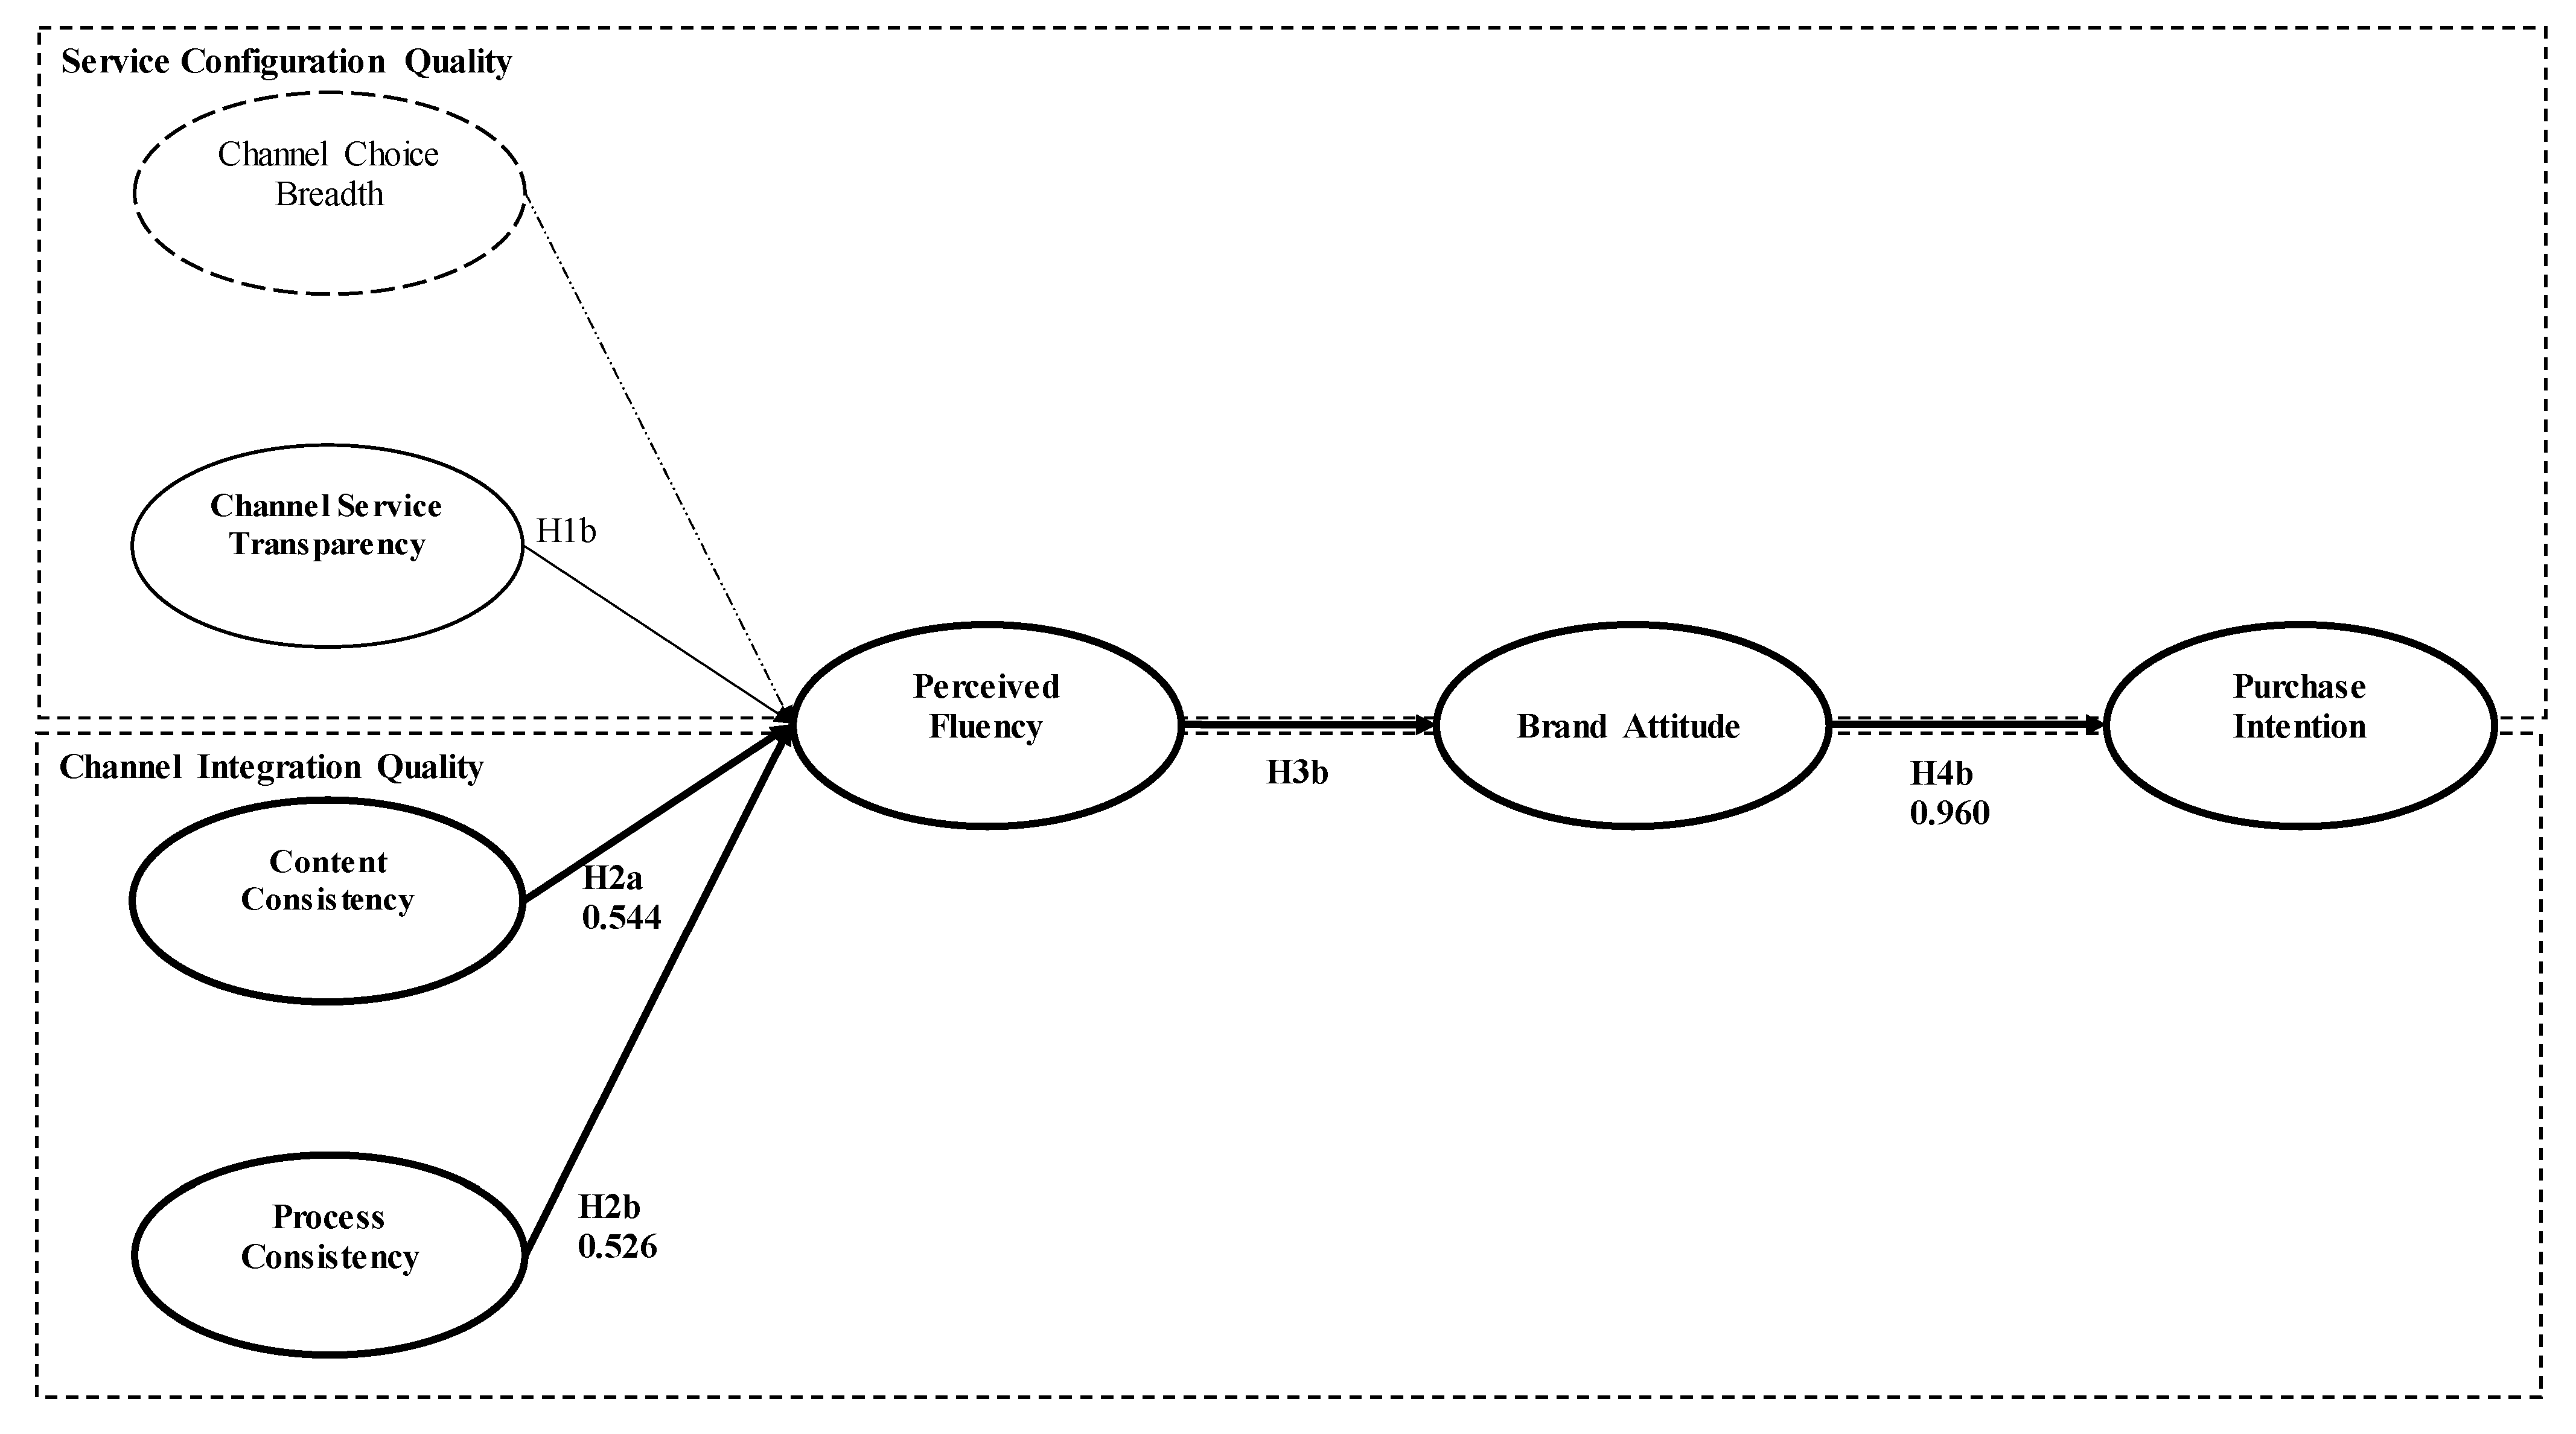
Figure 2 shows the final model.
5. Discussion and Implications
This research aimed to investigate U.S. adult customers’ perspectives based on their interactions with omnichannel fashion department store retailers’ channels. The study results showed that, first, the framework used in Shen et al. [
18] that focused on restaurant services did not directly translate to research about omnichannel fashion retailing. In Shen et al.’s (2018) research, service configuration quality, channel choice breadth, and channel service transparency significantly influenced customers’ perceived fluency. In this research, service configuration quality did not influence the perceived fluency of omnichannel fashion department store customers. Furthermore, the model that included both channel choice breadth and channel service transparency did not have a good fit; dropping channel choice breadth was necessary to improve the model. Customers of omnichannel fashion department stores appear to consider channel integration quality of content and process consistency to be important to their purchase intention, which differs from the results of Shen et al.’s [
18] research. The results fill a literature gap concerning what customers deem important when judging channel fluency as they shop with omnichannel fashion department store retailers. The results also contribute to the literature as there are no similar studies that examine the channels of fashion department stores using a similar framework.
Second, the results verify the theoretical background of the Theory of Reasoned Action [
7] in that customers believe that channel integration quality is important, and that it influences their perceived fluency and purchase intention in the omnichannel fashion retail department store setting. The results of this study also verify those of previous studies on brand attitude [
36,
54,
55], indicating that customer brand attitudes are developed based on previous experience with the brand and therefore influence customers’ purchase intention.
5.1. Implications for Researchers
This study makes several contributions and has important implications. It presented a new theoretical framework that includes brand attitude and purchase intentions and is specific to omnichannel fashion retailing. The findings provide a comprehensive perspective relevant to the fashion department store omnichannel retail environments and identify factors that can influence customers’ decisions to purchase from one or more of an omnichannel retailer’s channels. The results provide an in-depth analysis of each factor that influences customers’ experience in the omnichannel fashion department store setting. This can be seen in the first CFA analysis, which showed that using the four independent variables (channel choice breadth, channel service transparency, process consistency, and content consistency) in the theoretical model did not provide a good fit. Perhaps the concepts of channel choice breadth and channel service transparency are too similar to each other in the fashion department store omnichannel setting. Further research is recommended to better understand these concepts, which are known to be separate constructs in other industry settings.
In contrast to Shen et al. [
18], in this study, channel service transparency does not significantly influence the perceived fluency of omnichannel fashion department store channels. Channel service transparency relates to the customer’s awareness of the available channels and the differences between the attributes across all available channels. The difference in results may be explained in a few ways. First, Shen et al.’s [
18] research focused on services available through a dining service app. Perhaps their framework in this sense was not as compatible with our goal, which was to predict purchase intention in an omnichannel fashion department store, as we expected. Second, although the channels in this study (website, mobile devices, social media, physical stores) were similar to those in the study by Shen et al. [
18], customer interactions with omnichannel dining services and fashion department stores might be very different, and channel service transparency might differ between the two types of customers. Therefore, further research is recommended to investigate channel service transparency and its relationship with perceived fluency in the specific context of omnichannel fashion retailing.
The analyses showed that channel consistency and process consistency, which are building blocks for channel integration quality, have direct and significant influences on perceived fluency. This finding was consistent with Shen et al. [
18], who emphasized the positive association between channel integration quality and perceived fluency in an omnichannel dining service app. Channel integration quality in this research is identified as an object-based belief, whereas perceived fluency is identified as a behavioral belief to show the uniqueness of customers’ experiences when using the channels available in an omnichannel fashion department store. Brand attitude fully mediated the relationship between perceived fluency and purchase intention. This finding is consistent with previous research [
36,
54,
55], indicating that customer brand attitudes are developed based on previous experience with the brand.
5.2. Implications for Industry Professionals
The findings of this study provide sustainable strategic insights to industry practitioners, especially for omnichannel fashion department stores. In the current volatile business environment, understanding customers and being able to reach out to them are key to being successful. In this study, the value of customers having options to use alternative channels and customer awareness of the different shopping channels did not significantly influence perceived fluency. In fashion department store retailing, a customer may already have an expectation to have different channel options from which to choose. Omnichannel fashion department stores customers may not believe there is a difference between channel choice breadth and channel service transparency since, for the customers, the meaning of these two may be similar. Therefore, managers of omnichannel fashion department stores should continue to provide customers with various channels to meet customer expectations. However, managers of omnichannel fashion department stores may not want to invest heavily in messaging channel options as customers’ perceptions of fluency and their brand attitude and purchase intention do not seem to be influenced by it.
Given that content and process consistency across all channels are important influences on customers’ shopping intentions, omnichannel managers of fashion department store retailers should seek to provide consistency across and throughout various channels. For example, return processes should be the same across multiple channels as should the percent discount of sales and the items on sale. The COVID-19 pandemic has led many small and large retailers to re-adjust their strategy to pivot into digital commerce. However, not only is channel digitization needed, but consistency in content and channel processes is also critical, which may be a challenge for many small fashion retailers.
Other results from this study indicate that customers’ brand attitudes have a significant influence on customers’ intention to purchase from an omnichannel fashion department store retailer. Previous research on branding has suggested that customers’ brand attitudes are closely linked to brand image and brand perception [
36,
54,
55]. Customers care about brand image and associate it with good or acceptable product quality. Thus, this research adds credence to the importance of omnichannel fashion department store retailers’ emphasis on building their brand image. Customers having a consistently good experience with a retailer, and more specifically with each of the channels of an omnichannel fashion retailer, helps improve the retailer’s brand image.
This study demonstrates that brand attitude influences purchase intentions. Omnichannel fashion department store retailers can use the opportunities presented in each of their store channels to create a consistent and positive brand image and experiences that improve customers’ brand attitudes. For example, omnichannel fashion department store retailers should focus on creating integrated customer service available through each of the store’s different channels. By creating integrated customer service, omnichannel fashion department store shoppers will find consistency in the customer service content and processes throughout the available channels. This allows customers to interact with the store directly regardless of which channel they choose or how physically distant they are from the store. Customers’ expectations of retailers are high, partly because customers expect consistency across all channels [
18,
56]. Consistent experiences will likely positively influence the customer’s brand attitude toward the omnichannel fashion retailer. Overall, it is suggested to omnichannel managers to first focus on continuing to provide different channels from which the customer can choose. Second, managers should also consider focusing on improving the consistency of the process and content in each channel.
6. Limitations and Future Research
As with any research, there are identifiable limitations in this study. A few limitations relate to the sample. Nonresponse bias might be possible; this can occur when the sample respondents refuse to answer some questions in a study, when the researcher is unable to reach a wider audience, and/or when respondents begin but do not complete a survey. The sample respondents were limited to only customers who had prior experience with omnichannel fashion department stores within the past year. However, it is possible that the respondents in the sample whose most recent experience was months ago had difficulty recalling their specific perceptions of the omnichannel fashion retailers’ channels. The sample selection could also be considered a limitation of this study. Respondents experienced with online surveys may have recognized the purpose of the screening questions and answered them to ensure they would be eligible to complete the survey and receive the compensation. A sample of confirmed omnichannel fashion department store customers provided by a store (or stores) would be ideal for future research.
In addition, this study focused on fashion department stores, and it did not differentiate between high-end, mid-end, and discount omnichannel fashion department store retailers. The results might have been different if the study had focused on a specific segment of omnichannel fashion retailers. Furthermore, we did not include big-box retailers such as Target and Wal-Mart, where customers purchase fashion apparel, albeit of lesser quality and at a lower price compared to department store retailers. Thus, a rigorous study of the different segments of omnichannel fashion department stores is needed to provide more targeted information to use in developing future business strategies. As this study focused on omnichannel fashion department store retailers, the results may not be applicable to other types of industries that utilize the omnichannel strategy. For example, the results may not be applicable to omnichannel grocery stores, banking, or fast-food restaurants. Finally, this study is limited to U.S. fashion department stores and U.S. customers. It may have limited applicability to retailers and customer behaviors in other countries.
A number of suggestions for future research were made in the previous sections. Regarding the theoretical framework, it seems unlikely that the construct that was not supported by the data analysis as fitting the model (channel service transparency) is unimportant to an omnichannel fashion department store retailer’s success. Perhaps the measurements in this study were not appropriate for the current study. Most were adapted from research that was conducted 10 years ago, which focused on multichannel retailing (not omnichannel retailing), and none were specific to omnichannel fashion retailing [
19,
31]. Perhaps new scales are needed that are specific to omnichannel fashion retailing or even specific to the different channels in omnichannel retailing.
Research is needed to produce a better understanding of the seamless experience in omnichannel fashion retailing from the customer’s perspective. Unanswered questions include: What is the seamless experience from the customers’ perspective? How should it be measured? What influences customer perceptions of the seamless experience? How do customers’ perceptions of the seamless experience influence brand attitude and purchase intention? In previous research, Saleh [
57] described the seamless experience as “engaging” customers across channels. A definition of engagement in omnichannel fashion retailing is needed.
Author Contributions
Conceptualization, Analysis, Data Collection, Writing, C.K.; Conceptualization, Data Collection, Writing, B.J.C. All authors have read and agreed to the published version of the manuscript.
Funding
This research received no external funding.
Institutional Review Board Statement
This study was approved by the Institutional Review Board of University of Georgia (approval number: PROJECT00001297).
Informed Consent Statement
Informed consent was obtained from all subjects involved in the study.
Data Availability Statement
Data are not publicly available, though the data may be made available on request from the author.
Conflicts of Interest
The authors declare no conflict of interest.
References
- Chinta, P. How Retailers Can Engage Channel-Hopping Shoppers. 2019. Available online: https://www.thinkwithgoogle.com/intl/en-apac/marketing-strategies/search/how-retailers-can-engage-channel-hopping-shoppers/ (accessed on 2 February 2020).
- Park, S.; Lee, K. Examining the impact of e-commerce growth on the spatial distribution of fashion and beauty stores in Seoul. Sustainability 2021, 13, 5185. [Google Scholar] [CrossRef]
- Yin, J.; Qiu, X. AI technology and online purchase intention: Structural equation model based on perceived value. Sustainability 2021, 13, 5671. [Google Scholar] [CrossRef]
- McKinsey & Company. The State of Fashion 2020: Navigating Uncertainty. 2019. Available online: https://www.mckinsey.com/industries/retail/our-insights/the-state-of-fashion-2020-navigating-uncertainty (accessed on 21 February 2020).
- Kodali, S. The State of Retailing Online 2019: Omnichannel, Marketing, and Personalization. 2019. Available online: https://nrf.com/research/state-retailing-online-2019 (accessed on 17 January 2020).
- Hanbury, M.; Neiman Marcus, J. Crew, and True Religion Are Among the First US Retailers to File for Bankruptcy as the Pandemic Takes its Toll. Here’s the Full List So Far. 2020. Available online: https://www.businessinsider.com/retailers-filing-for-bankruptcy-during-the-pandemic-2020-5 (accessed on 15 May 2020).
- Fishbein, M. A behavior theory approach to the relations between beliefs about an object and the attitude toward the object. In Readings in Attitude Theory and Measurement; Fishbein, M., Ed.; John Wiley & Sons: Hoboken, NJ, USA, 1967; pp. 389–400. [Google Scholar]
- Ajzen, I.; Fishbein, M. Understanding Attitudes and Predicting Social Behavior; Prentice-Hall: Englewood Cliffs, NJ, USA, 1980. [Google Scholar]
- Ajzen, I. From intentions to actions: A theory of planned behavior. In Action-Control: From Cognitions to Behavior; Kuhland, J., Beckman, J., Eds.; Springer: Berlin/Heidelberg, Germany, 1985; pp. 11–39. [Google Scholar]
- Ajzen, I.; Madden, T.J. Prediction of goal-directed behavior: Attitudes, intentions, and perceived behavioral control. J. Exp. Soc. Psychol. 1986, 22, 453–474. [Google Scholar] [CrossRef]
- DeLone, W.H.; McLean, E.R. Information systems success: The quest for the dependent variable. Inf. Syst. Res. 1992, 3, 60–95. [Google Scholar] [CrossRef] [Green Version]
- Davis, F.D. A Technology Acceptance Model for Empirically Testing New End-User Information Systems: Theory and Results. Ph.D. Thesis, Massachusetts Institute of Technology, Cambridge, MA, USA, 1985. [Google Scholar]
- Venkatesh, V.; Morris, M.G.; Davis, G.B.; Davis, F.D. User acceptance of information technology: Toward a unified view. MIS Q. 2003, 27, 425–478. [Google Scholar] [CrossRef] [Green Version]
- Venkatesh, V.; Bala, H. Technology Acceptance Model 3 and a research agenda on interventions. Decis. Sci. 2008, 39, 273–315. [Google Scholar] [CrossRef] [Green Version]
- Wixom, B.H.; Todd, P.A. A theoretical integration of user satisfaction and technology acceptance. Inf. Syst. Res. 2005, 16, 85–102. [Google Scholar] [CrossRef]
- Sun, Y.; Shen, X.-L.; Wang, N. Understanding the role of consistency during web–mobile service transition: Dimensions and boundary conditions. Int. J. Inf. Manag. 2014, 34, 465–473. [Google Scholar] [CrossRef]
- Lazaris, C.; Vrechopoulos, A. Human-computer vs. consumer-store interaction in a multichannel retail environment: Some multidisciplinary research directions. Lect. Notes Comput. Sci. 2014, 8527, 339–349. [Google Scholar]
- Shen, X.L.; Li, Y.J.; Sun, Y.; Wang, N. Channel integration quality, perceived fluency and omnichannel service usage: The moderating roles of internal and external usage experience. Decis. Support Syst. 2018, 109, 61–73. [Google Scholar] [CrossRef]
- Sousa, R.; Voss, C.A. Service quality in multichannel services employing virtual channels. J. Serv. Res. 2006, 8, 356–371. [Google Scholar] [CrossRef]
- Fan, X.; Chai, Z.; Deng, N.; Dong, X. Adoption of augmented reality in online retailing and consumers’ product attitude: A cognitive perspective. J. Retail. Consum. Serv. 2020, 53. [Google Scholar] [CrossRef]
- Im, H.; Lennon, S.J.; Stoel, L. The perceptual fluency effect on pleasurable online shopping experience. J. Res. Interact. Mark. 2010, 4, 280–295. [Google Scholar] [CrossRef]
- Pleyers, G. Shape congruence in product design: Impacts on automatically activated attitudes. J. Retail. Consum. Serv. 2021, 61. [Google Scholar] [CrossRef]
- Reber, R.; Schwarz, N.; Winkielman, P. Processing fluency and aesthetic pleasure: Is beauty in the perceiver’s processing experience? Personal. Soc. Psychol. Rev. 2004, 8, 364–382. [Google Scholar] [CrossRef] [Green Version]
- Majrashi, K.; Hamilton, M. A cross-platform usability measurement model. Lect. Notes Softw. Eng. 2015, 3, 1–12. [Google Scholar] [CrossRef] [Green Version]
- Shin, D.H. Cross-platform users’ experiences toward designing interusable systems. Int. J. Hum. Comput. Interact. 2016, 32, 503–514. [Google Scholar] [CrossRef]
- Bitner, M.J.; Ostrom, A.L.; Meuter, M.L. Implementing successful self-service technologies. Acad. Manag. Exec. 2002, 16, 96–108. [Google Scholar] [CrossRef]
- Deloitte. Deloitte Studies–Global Powers of Retailing 2018. 2018. Available online: https://www2.deloitte.com/content/dam/Deloitte/at/Documents/about-deloitte/global-powers-of-retailing-2018.pdf (accessed on 2 January 2020).
- Quach, S.; Barari, M.; Moudrý, D.V.; Quach, K. Service integration in omnichannel retailing and its impact on customer experience. J. Retail. Consum. Serv. 2020, 102267. [Google Scholar] [CrossRef]
- Lee, Z.W.Y.; Chan, T.K.H.; Chong, A.Y.-L.; Thadani, D.R. Customer engagement through omnichannel retailing: The effects of channel integration quality. Ind. Mark. Manag. 2019, 77, 90–101. [Google Scholar] [CrossRef]
- Payne, A.; Frow, P. The role of multichannel integration in customer relationship management. Ind. Mark. Manag. 2004, 33, 527–538. [Google Scholar] [CrossRef]
- Madaleno, R.; Wilson, H.; Palmer, R. Determinants of customer satisfaction in a multi-channel B2B environment. Total Qual. Manag. Bus. Excell. 2007, 18, 915–925. [Google Scholar] [CrossRef]
- Le, A.N.H.; Nguyen-Le, X.-D. A moderated mediating mechanism of omnichannel customer experiences. Int. J. Retail Distrib. Manag. 2021, 49, 595–615. [Google Scholar] [CrossRef]
- Schwarz, N.; Clore, G.L. Feelings and phenomenal experiences. In Social Psychology: Handbook of Basic Principles; Higgins, E.T., Kruglanski, A.W., Eds.; Guilford Press: New York, NY, USA, 1996; pp. 433–465. [Google Scholar]
- Lee, K.; Choi, J. Image-text inconsistency effect on product evaluation in online retailing. J. Retail. Consum. Serv. 2019, 49, 279–288. [Google Scholar] [CrossRef]
- Keller, K.L. Strategic Brand Management: Building, Measuring, and Managing Brand Equity, 3rd ed.; Prentice Hall: Englewood Cliffs, NJ, USA, 2008. [Google Scholar]
- Eren-Erdogmus, I.; Akgun, I.; Arda, E. Drivers of successful luxury fashion brand extensions: Cases of complement and transfer extensions. J. Fash. Mark. Manag. 2018, 22, 476–493. [Google Scholar] [CrossRef]
- Cohen, J.B.; Areni, C.S. Affect and consumer behavior. In Handbook of Consumer Behavior; Robertson, T.S., Kassarjian, H.H., Eds.; Prentice-Hall: Englewood Cliffs, NJ, USA, 1991; pp. 188–240. [Google Scholar]
- Ajzen, I. Nature and operation of attitudes. Annu. Rev. Psychol. 2001, 52, 27–58. [Google Scholar] [CrossRef] [Green Version]
- De Villiers, M.V.; Chinomona, R.; Chuchu, T. The influence of store environment on brand attitude, brand experience and purchase intention. S. Afr. J. Bus. Manag. 2018, 49, 1–8. [Google Scholar] [CrossRef]
- Menon, B. Influence of customer’s brand attitude on purchase intention of private label fashion brands. Abhigyan 2018, 36, 30–39. [Google Scholar]
- Fishbein, M.; Ajzen, I. Belief, Attitude, Intention, and Behavior: An Introduction to Theory and Research; Addison-Wesley: Boston, MA, USA, 1975. [Google Scholar]
- Yoo, F.; Jung, H.J.; Oh, K.W. Motivators and barriers for buying intention of upcycled fashion products in China. Sustainability 2021, 13, 2584. [Google Scholar] [CrossRef]
- Huré, E.; Picot-Coupey, K.; Ackermann, C.-L. Understanding omni-channel shopping value: A mixed-method study. J. Retail. Consum. Serv. 2017, 39, 314–330. [Google Scholar] [CrossRef]
- Wu, J.F.; Chang, Y.P. Multichannel integration quality, online perceived value and online purchase intention: A perspective of land-based retailers. Internet Res. 2016, 26, 1228–1248. [Google Scholar] [CrossRef]
- Ma, S. Fast or free shipping options in online and omni-channel retail? The mediating role of uncertainty on satisfaction and purchase intentions. Int. J. Logist. Manag. 2017, 28, 1099–1122. [Google Scholar] [CrossRef]
- Casper, W.C.; Edwards, B.D.; Wallace, J.C.; Landis, R.S.; Fife, D.A. Selecting response anchors with equal intervals for summated rating scales. J. Appl. Psychol. 2020, 105, 390–409. [Google Scholar] [CrossRef] [PubMed]
- Hair, J.F.; Tatham, R.L.; Anderson, R.E.; Black, E. Multivariate Data Analysis, 5th ed.; Prentice Hall: Upper Saddle River, NJ, USA, 1998. [Google Scholar]
- Duffin, E.U.S. Household Income Distribution 2018. 2020. Available online: https://www.statista.com/statistics/203183/percentage-distribution-of-household-income-in-the-us/ (accessed on 12 March 2020).
- Kunst, A. Share of People Who Shopped at Any Store Within the Last 12 Months in the United States in 2018, by Age. 2019. Available online: https://www.statista.com/statistics/231320/people-who-bought-at-any-department-store-within-the-last-30-days-usa/ (accessed on 20 November 2020).
- Dai, W.; Arnulf, J.K.; Iao, L.; Wan, P.; Dai, H. Like or Want? Gender Differences in Attitudes toward Online Shopping in China. Psychol. Mark. 2019, 36, 354–362. [Google Scholar] [CrossRef]
- Dennis, C.; Brakus, J.J.; Ferrer, G.G.; McIntyre, C.; Alamanos, E.; King, T. A Cross-National Study of Evolutionary Origins of Gender Shopping Styles: She Gatherer, He Hunter? J. Int. Mark. 2018, 26, 38–53. [Google Scholar] [CrossRef]
- Saad, Y. Iterative methods for sparse linear systems. In Society for Industrial and Applied Mathematics; Reusken, A., Ed.; PWS Pub. Co.: Boston, MA, USA, 2003. [Google Scholar]
- Hu, L.T.; Bentler, P.M. Cutoff criteria for fit indexes in covariance structure analysis: Conventional criteria versus new alternatives. Struct. Equ. Model. 1999, 6, 1–55. [Google Scholar] [CrossRef]
- Aaker, D.A.; Keller, K.L. Consumer evaluations of brand extensions. J. Mark. 1990, 54, 27–41. [Google Scholar] [CrossRef]
- Foroudi, P.; Jin, Z.; Gupta, S.; Foroudi, M.M.; Kitchen, P.J. Perceptional components of brand equity: Configuring the symmetrical and asymmetrical paths to brand loyalty and brand purchase intention. J. Bus. Res. 2018, 89, 462–474. [Google Scholar] [CrossRef] [Green Version]
- Sun, Y.; Yang, C.; Shen, X.-L.; Wang, N. When digitalized customers meet digitalized services: A digitalized social cognitive perspective of omnichannel service usage. Int. J. Inf. Manag. 2020, 54, 102200. [Google Scholar] [CrossRef]
- Saleh, K. Customer Acquisition vs. Retention Costs –Statistics and Trends. 2015. Available online: https://www.invespcro.com/blog/customer-acquisition-retention/ (accessed on 19 November 2019).
| Publisher’s Note: MDPI stays neutral with regard to jurisdictional claims in published maps and institutional affiliations. |
© 2021 by the authors. Licensee MDPI, Basel, Switzerland. This article is an open access article distributed under the terms and conditions of the Creative Commons Attribution (CC BY) license (https://creativecommons.org/licenses/by/4.0/).


