Article

Effects of Biochar on Sediment Transport and Rill Erosion after Two Consecutive Years of Seasonal Freezing and Thawing

1
School of Water Conservancy and Civil Engineering, Northeast Agricultural University, Harbin 150030, China
2
Key Laboratory of Effective Utilization of Agricultural Water Resources of Ministry of Agriculture, Northeast Agricultural University, Harbin 150030, China
3
Heilongjiang Provincial Key Laboratory of Water Resources and Water Conservancy Engineering in Cold Region, Northeast Agricultural University, Harbin 150030, China
*
Authors to whom correspondence should be addressed.
Sustainability 2021, 13(13), 6984; https://doi.org/10.3390/su13136984
Submission received: 15 April 2021 / Revised: 11 June 2021 / Accepted: 17 June 2021 / Published: 22 June 2021

Abstract

:
This research explored the effects of biochar on slope runoff and sediment transport processes and the hydrodynamic mechanism of rill erosion under the seasonal freeze–thaw climate in the black soil area of Northeast China. The four slopes of 1.8, 3.6, 5.4 and 7.2° were set, corn straw biochar was used, and three biochar contents of 0 kg m−2 (B0 treatment), 6 kg m−2 (B6 treatment) and 12 kg m−2 (B12 treatment) were applied. The experimental plot was placed outdoors to simulate the freeze–thaw cycle of sloping farmland under natural conditions. Three artificial simulated rainfall tests were carried out before the end of seasonal freeze–thaw cycles and spring sowing date (May) in 2018 and 2019. The sediment transport process of runoff and the variation of hydrodynamic parameters in rills were analyzed under one and two seasons of freezing and thawing in natural outdoor conditions. The results show that biochar has a positive effect on reducing rainfall runoff and soil loss after one year and two years of seasonal freezing and thawing. The effect of biochar on the sediment concentration of slope runoff increased with increasing application time; in the second year, the B6 and B12 treatments reduced the sediment concentration by 5.5–14.8% and 3.3–13.6%, respectively, compared with the values of the first year. The Reynolds number (Re) in the rill flow after the B6 and B12 treatments decreased with increasing duration, which effectively reduced the turbulence degree of the flow on the rill of the slope. With the increase in duration, the rill critical erosion power increased; in 2018 and 2019, the critical shear force, critical runoff power and critical unit runoff power were 0.403 Pa, 0.098 m s−1, and 0.002 N m−1 and 0.497 Pa, 0.124 m s−1, and 0.003 N m−1, respectively. This result indicates that increasing the duration and number of seasonal freeze–thaws can promote the development of biochar control of the runoff and sediment processes on slope and rill development.

1. Introduction

Soil erosions represent some of the most serious environmental problems in the world [1,2], these losses lead to the degradation of ecosystem function, the decrease of soil productivity, the migration of sediments, and the deposition of rivers [3,4]. Research suggests that soil erosion may also contribute to environmental problems such as global warming through the loss of organic carbon [5,6,7]. Therefore, the prevention of soil erosion is of great significance to the sustainable use of land and the protection of the ecological environment [8].
The black soil area in Northeast China is an important base for commercial food production in China. With the rapid development of the economy and the continuous increasing food demand, the increase in land development and utilization leads to the increase in soil erosion, which has an increasing impact on the environment [9]. To guarantee the sustainable development of fertile land in this region, effective land management measures are needed to maintain the sustainable production of agriculture in this region, and making rational use of organic agricultural wastes and rural wastes to minimize soil erosion on sloping land is an urgent task [10,11].
In recent years, biochar has attracted extensive attention in the field of slowing down land degradation and preventing soil erosion [12,13]. This is because biochar has the advantage of abundant raw materials in agricultural production areas. According to statistics, the total amount of agricultural waste produced in China in 2013 was 1.75 × 10⁹ tons, among which crop straw comprised 9.93 × 10⁸ tons (56.8%) [14]. In contrast to the pollution caused by the treatment of crop straw, the production process of biochar is relatively environmentally friendly, which is a low-cost and widely used method [15].
The unique and large specific surface area and porous structure of biochar reduce soil bulk density, increase porosity [16], positively improve soil hydraulic parameters, and increase soil water holding capacity [12,13], which gives biochar the advantage of influencing slope infiltration, runoff and others to improve farmland degradation [17,18,19,20]. Additionally, Dong et al. [21] found that the properties of biochar were stable in both dry and wet cycles, freeze–thaw cycles and tillage conditions of the field environment and had a significant inhibitory effect on soil erosion. In the application of biochar to control soil erosion, the actual effect is often affected by the soil type and the amount of biochar. For example, Li et al. [22] found that with the increase in biochar application, soil erosion on the slope of loess with a high slope of 27% was actively alleviated. However, Peake et al. [23] determined that a minimum biochar content could maximally improve the soil water saturation. Reddy et al. [24] believed that soil water conductivity and shear strength in-creased with a decrease in applied biochar content. Therefore, biochar reduces soil erosion to different degrees for different types of soil and different slopes [25]. At the same time, biochar has a long duration after being applied to soil, there are research reports that biochar application and cultivation for 105 and 168 days can significantly reduce the loss of slope soil [26,27]. The longer-term research after the application of biochar was reported by Liu [28], after 18 months, compared with the initial stage of application, biochar delayed the time of rainfall runoff, reduced soil loss, and had the trend of reducing water and sediment. In strong climate change, the process of soil erosion may be intensified [29,30]. The report points out that in high-latitude and high-altitude areas, due to the phase change of water during freezing and thawing, soil particles are mechanically damaged [31,32,33], thus weakening the anti-erosion ability of runoff [34,35,36,37]. Previous research results have shown that the combination of biochar and freezing–thawing significantly increased the soil micropore size, soil voids and total porosity and thereby improved the soil water retention capacity during the melting period, and it significantly increased the field capacity and available water content in soil after the freeze–thaw, so as to improve the soil erosion resistance [38]. In addition, some studies have shown that there will be rill erosion in the slope, and the soil erosion rate will increase significantly when the rills appear [39,40]. At present, the research on slope soil erosion shows that rill erosion is one of the main erosion ways, and the rill erosion can account for 50–70% of the total soil erosion [41], even 90% under extreme conditions [42]. After the rill is formed on the slope, the runoff flow changes from surface overflow to linear flow, and the rill depth, runoff velocity and shear force change greatly, which aggravates the soil erosion on the slope. The formation of rill is quite different from the soil properties and geographical properties [43]. However, after the application of biochar in soil, the development of rill on a slope is still an unclear subject. Therefore, it is necessary to better understand the rill erosion development process of regional sloping farmland after biochar application.
Current studies about the influence of biochar on soil erosion mostly apply a certain amount of biochar based on a percentage of weight, with the low application amount being 1–3% and the high application amount being 5–7% (wt%) [22]. According to the authors, in the low biochar application, biochar inhibited soil loss and the total runoff had no obvious trend, while the high biochar application increased the runoff and soil loss. Peng et al. [44] found that biochar could enhance soil erosion resistance in a study of runoff and sediment at slopes of 5–25°, but at slopes of 15–25°, biochar increased the output of total organic carbon (TOC). Therefore, the researchers believed that biochar was more suitable for sloping farmland with slopes less than 15°. A large number of studies have reported the impact of biochar on soil erosion within one month or one year after application [2,7,16]; however, few reports have explored the impact of biochar on soil erosion in the same area for two consecutive years. There is insufficient information available to assess the potential effects, and the two measurements in two different consecutive years of the effects of biochar on soil erosion in this area are limited. Therefore, in this study, after the application of biochar in selected fixed areas in the field, the effects of biochar on slope runoff and sediment transport in two consecutive years are discussed.

2. Materials and Methods

2.1. Test Area Overview

The experimental area is located in Harbin city, Songnen Plain, Northeast China, and is part of the comprehensive experimental field of water conservancy, School of Water Conservancy and Civil Engineering, Northeast Agricultural University, located at 45°44′22′′N, 126°43′6′′E, with an average altitude of 138 m. It has a continental monsoon climate and is in the middle temperate zone, with an annual average temperature of 3.6 °C and a winter average temperature of −14.2 °C. The average annual rainfall is 500–600 mm, and the precipitation in summer accounts for approximately 65% of the total annual precipitation. The rainfall lasts for a short time, mainly from June to August, and the winter is cold and long [45]. The location of the experimental area is shown in Figure 1. The area is mainly plain with a long gentle slope. The cultivated soil layer in the area is mainly black soil, chernozem and meadow soil. The surface layer is 20–30 cm and is a soft black soil layer. The soil layer of 30–60 cm is clayey soil. The cultivated vegetation of dry land is mainly corn and soybean [46].

2.2. Experimental Design

The rainfall was simulated using a rainfall simulation system with downward sprinkling. The artificial simulated rainfall equipment was designed and manufactured by the Harbin Tianyu Automation Instrument Co., Ltd. (Harbin, China). The rainfall simulator included five nozzles, and raindrop size and rainfall intensity could be adjusted by adjusting the nozzle aperture and water pressure, which could be set at any rainfall intensity between 50 and 100 mm h−1. The rainfall height can be adjusted in the range of 2.5–3.5 m, the rainfall uniformity is greater than 85%, the simulated raindrop diameter distribution is approximately 0.15–3 mm, and approximately 80–90% of the raindrop diameters are less than 1.5 mm; additionally, the simulated rainfall intensity is designed as 80 mm h−1 in combination with the intensity of erosion rainstorms in the black soil area in Northeast China.
In this study, 12 fixed runoff test plots were connected with the surface, and the plots were 5 m in length and 2 m in width (No. P1–P12); the slope gradient was adjusted by filling the soil. The adjustable range of the slope gradient was from 0 to 15°. According to the slope range with the most serious increase in soil erosion sensitivity in the Northeast black soil area in the last 30 years [47], the design gradient of this test was 1.8° (P1–P3), 3.6° (P4–P6), 5.4° (P7–P9) and 7.2° (P10–P12). The lower end of the test area was equipped with a collecting port, and runoff samples were collected through the connected bucket. The black soil (US soil taxonomy) used was the 0–20 cm soil in the plow layer of Harbin located in the black soil area of Northeast China. The soil in the experimental plot was loaded according to the soil type of the sloped farmland in the black soil area. The 0–30 cm layer is loam, the particle size group is (>0.02 mm) 46.32%, the silt (0.002–0.02 mm) is 20.41%, the clay (<0.002 mm) is 38.74%, and the average bulk density is approximately 1.15 g cm−3. The 30–60 cm soil layer was loaded with cohesive soil; the mechanical composition as 38.74% sand, 24.69% silt, and 36.57% clay. The average bulk density of the soil was 1.30 g cm−3, which was the same as that of the plow bottom in the Northeast black soil area [45]. Impurities such as gravel and straw were removed from the soil [48].
The biochar used was corn straw biochar purchased from the liaoning jinhefu agricultural development co., LTD (Anshan, China), and the preparation of this biochar involves high-temperature cracking at 450 to 500 °C under oxygen-free or low-oxygen conditions. The basic physical and chemical properties are as follows: particle size of 1.5–2.0 mm; pH value of 9.14; nitrogen content of 1.53%; phosphorus content of 0.78%; potassium content of 1.68%; TOC content of 409.7 g kg−1; and ash content of 31.8% [49].
At the beginning of October 2017, 0 kg m−2 (B0), 6 kg m−2 (B6) and 12 kg m−2 (B12) biochar were applied to the surface of the experimental plot at a depth of 0–30 cm. The biochar was mixed evenly with the arable soil using the traditional agricultural manual mixing method to achieve a uniform color, forming a carbon soil mixed layer (approximately 0–30 cm) [49]. The application of the 6 and 12 kg m−2 biochar treatments accounted for approximately 1.4–3% of the soil mass in the 0–30 cm soil layer, as shown in Table 1.

2.3. Test Procedure

During the freeze–thaw period from October 2017 to April of the next year, test plots were allowed to keep their natural snow cover without human interference. Then the first simulated rainfall experiment was carried out in early May of 2018 (at the end of winter and before sowing in spring). Before the second rainfall test in the May of 2019, the runoff plots will be kept outdoors without human interference. Before two rainfall tests, weed gravel was removed and the slope was leveled evenly. To ensure that the initial water content of the slope in each plot is basically the same during the test, the slope is pre-rained with 80 mm h−1 24 h before the test, and the rainfall is stopped when the slope runoff occurs to ensure that the soil water content of the slope reaches saturation. The artificial rainfall experiment was carried out for 40 min. The experimenters observed the runoff and sediment production process on the slope of the experimental plot during the rainfall period. The runoff and sediment enter the runoff bucket through the test collection port, and the samples are collected once per minute to determine the runoff volume. When observing rill erosion on slope, the length, width, depth and position of rill are measured with steel tape (0.1 cm) every 3–5 min. The measurement results are used to calculate the rill volume and estimate the rill erosion degree. The flow velocity is measured every 3 min in the rill flow using potassium permanganate solution with a concentration of 0.8% (w/w) dye as a tracer, and the flow velocity is determined by the time the tracer color reaches the marked distance (0.5 m) [50]. Each experiment was repeated three times. Each runoff sample was allowed to stand for 12 h, the sediment was separated from the runoff, dried in an oven at 105 °C for 24 h, and weighed by an electronic balance. The soil erosion rate of the experimental plot was calculated.

2.4. Data Analysis

Estimation of average velocity with runoff velocity:
V = k V m
among them, V m m is the flow velocity (m s−1) of the rill inner diameter measured by the dye method (potassium permanganate dye tracer method), V is the average flow velocity (m s−1), and k is the correction coefficient, with a value of 0.75 [50,51].
The Reynolds number ( R e ) and Froude number (Fr) are calculated to reflect the flow state and calculated as follows:
R e = V R v
F r = V g h  
where R is the hydraulic radius (m), v is the kinematic viscosity, h is the measured average water depth (m), V is the average velocity (m s−1), and g is the acceleration of gravity (9.80 m s−2).
The Darcy–Weisbach coefficient (   f   ) was used to characterize the resistance along the path and was calculated by the following formula:
f = 8   g R J V 2  
where f is the resistance coefficient of Darcy–Weisbach, J (m−1) is the surface slope, and R (m) is the hydraulic radius.
Flow shear stress ( τ ) is an important factor in runoff erosion of soil, and the calculation formula is as follows [50,52]:
τ = ρ R J  
where τ   (pa) is the runoff shear stress, and ρ (kg m−3) is the density of runoff.
Runoff power ω (N m−1 s−1) reflects the sediment carrying capacity of runoff in the flow process [50]; the calculation formula is as follows:
ω = τ V  
According to the sediment transport equation, from the point of the mechanics of sediment transport from a power approach, the process of sediment transport is analyzed, the concept of unit water flow power is proposed [53], and the calculation formula is as follows:
φ = d y d t = d x d t d y d x = V J  
where φ (m s−1) is the unit water runoff power.

2.5. Data Analysis

SPSS 22.0 and Origin 2017 software were used for data processing and chart drawing. Analysis of variance (ANOVA) was used to test the difference between the data, and the least significant difference (LSD) method was used to test for significant differences between the different treatments; the significance level was 0.05. After the test data conformed to a normal distribution (p > 0.05), the Pearson correlation coefficient was used to calculate the correlation between the slope water and sediment process parameters and rill erosion characteristic parameters; finally, the correlation matrix was drawn using MATLAB.

3. Results

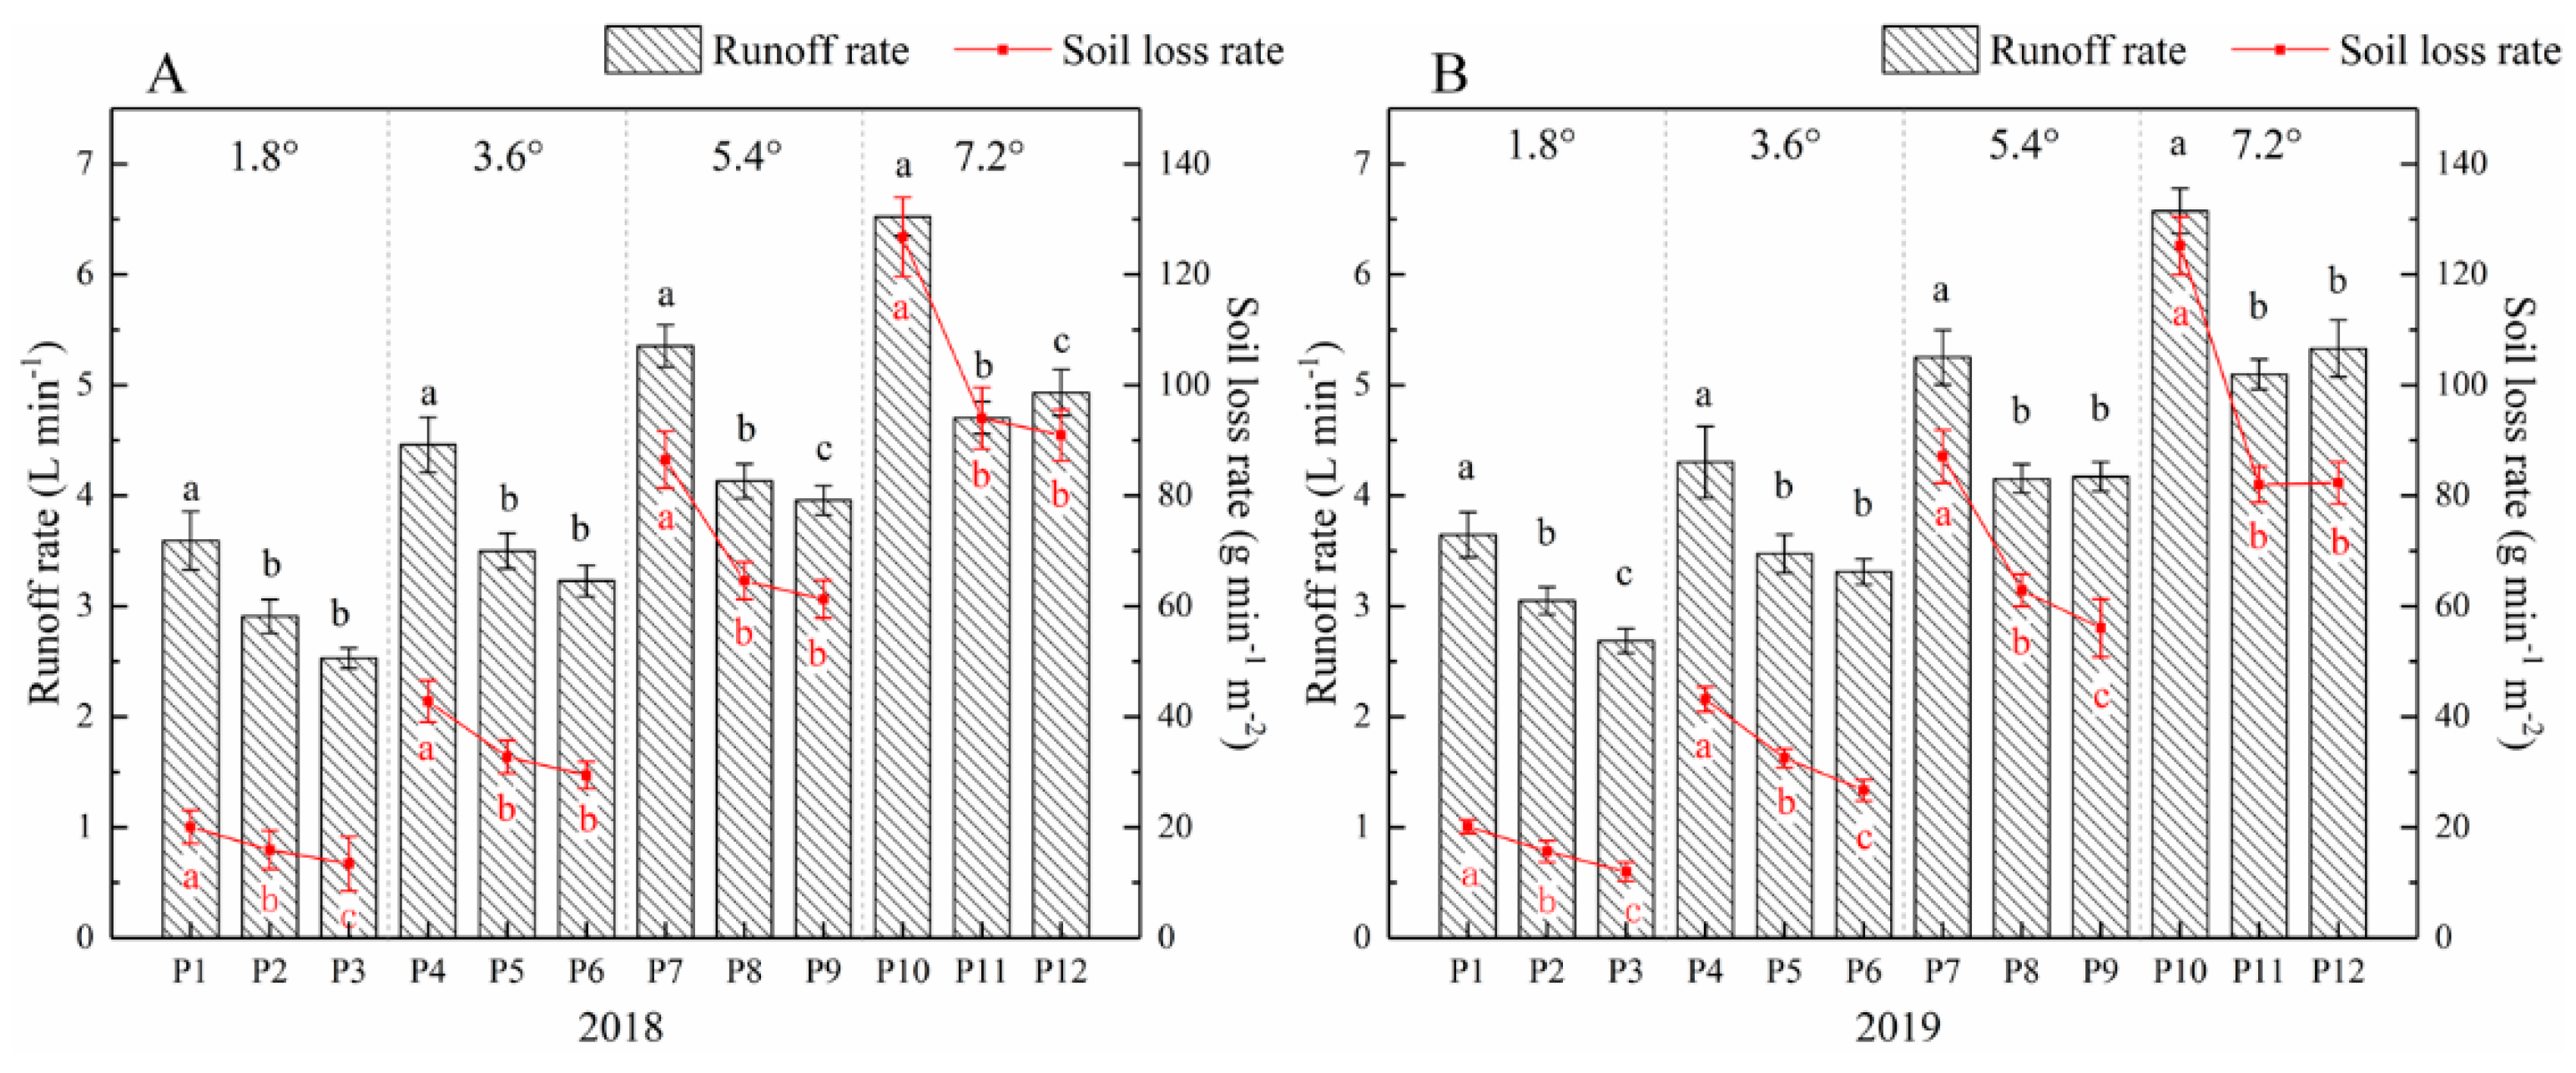
3.1. Effects of Biochar on Slope Runoff and Soil Erosion

We studied the influence of biochar on slope runoff and soil erosion rate. Because the changes in the runoff were in the non-stable stage (0–20 min), the biochar treatments and the B0 group were both unstable, the difference was not significant, and there was no obvious rule; thus, the exploration was insignificant. In the quasi-stable stage of runoff (20–40 min), the B6 and B12 treatments had a significant difference in their impacts on slope flow and sediment process compared to the B0 treatment; therefore, the quasi-stable stage was selected to analyze the impact of biochar on slope runoff and soil loss. The slope runoff rate decrease in 2018 is shown in Figure 2 (2018). The runoff rates of four different slopes treated with B6 decreased by 19.1%, 21.5%, 22.8% and 27.9%, respectively. The treatment with B12 reduced runoff by 29.5%, 27.6%, 26.1% and 24.4%, respectively. The runoff rate of the four slopes treated with B6 was lower than that of the control group B0, and the effect on the runoff rate of the four slopes was greater with increasing slope. However, the influence of the B12 treatment on slope runoff decreased with increasing slope, which was similar to the effect of the B6 treatment on runoff rate and even higher than that of the B6 treatment on the 7.2° slope. The influence on the slope runoff rate in 2019 is shown in Figure 2 (2019). The influence degree of the B6 treatment on the runoff rates of different slopes was slightly lower than that in 2018, and the runoff rate decline ratios were 16.3%, 19.3%, 20.9% and 22.5%, respectively. The change rule was consistent with that in 2018. Compared with B0, the runoff rate of the B12 treatment decreased by 26.3%, 23.0%, 20.6% and 18.9%, respectively, and the impact on runoff rate was less than that in 2018. In a comparison of the four slopes, only the runoff rate after the B12 treatment on the 1.8° slope was lower than that of the B6 treatment. The effects of the two biochar treatments were basically the same on the 3.6 and 5.4° slopes, and when the slope reached 7.2°, the runoff rate of the B12 treatment became higher than that of the B6 treatment. According to the above results, after one year and two years of seasonal freezing–thawing, both biochar content treatments slowed the slope runoff rate. The difference between the B6 treatment and B12 treatment was slightly smaller, and the effect of biochar on runoff in the second year was smaller than that in the first year.
By comparing the change in soil loss rate on the different slopes in the two years, the B6 and B12 treatments both reduced the soil loss rate. In 2018, the soil loss rates on the four slopes decreased by 20.7%, 23.5%, 25.3% and 25.8%, respectively, after the B6 treatment, and the effect of the B6 treatment in terms of reducing the soil loss rate increased with increasing slope. The decrease in the soil loss rate of the B12 treatment decreased with increasing slope, with values of 33.0%, 31.2%, 29.1% and 28.3%, respectively. Although the soil loss rate of the B12 treatment was lower than that of the B6 treatment, the effects of the two kinds of biochar contents on the soil loss rates of the slopes became closer with increasing slope. The soil loss rate reduction caused by the B6 treatment in 2019 was higher than that of the previous year (22.3%, 24.7%, 27.8% and 34.5%, respectively). Compared with the control group, the reduction rates of the B12 treatment were 40.7%, 38.2%, 35.6% and 34.2%, respectively, which were consistent with the trend in 2018. The effect of the B12 treatment on the soil loss rate in 2018 was not significantly different from that of the B6 treatment. In 2019, compared with the B6 treatment, the B12 treatment significantly weakened the rate of soil loss, but the value increased slightly when the slope was 7.2°. In conclusion, the application of biochar reduced the rate of soil loss. Compared with B6, B12 reduced the soil loss rate more.

3.2. Effect of Biochar on Sediment Concentration of Runoff

With the increase in duration and number of seasonal freezing–thawing events, the influence of biochar on runoff and soil loss rate showed different rules. Therefore, the runoff sediment concentration was used to explore the effect of biochar application on the slope flow and sediment process in 2018 and 2019. The change in sediment concentration treated with B6 and B12 within 40 min of the total production flow is shown in Figure 3. In the nonstable stage (0–20 min), the contents of the two biochar treatments showed a large and irregular unstable change compared with the sediment concentration reduced by the B0 treatment. When the runoff process entered the quasi-stable stage (20–40 min), the change in sediment concentration tended to be stable. The average runoff sediment concentration decreased in the quasi-stable stages of B6 and B12, showing great differences in 2018 and 2019. In the first year after the B6 treatment, the reduction rates of sediment concentration in different slopes were 1.2%, 2.2%, 0.9% and −3.2%, respectively. In 2019, the reduction rates of sediment concentration were 6.7%, 5.5%, 8.1% and 14.8%, respectively. The decreased sediment concentration of slope runoff was more obvious; specifically, the change in the 7.2° slope was significantly different from that of the first year, and the decreased sediment concentration was the largest. In 2018, the sediment concentrations of the four slopes treated with B12 decreased by 2.6%, 2.3%, 0.9% and 7.5%, respectively. In 2019, the sediment concentrations decreased by 13.0%, 13.6%, 10.9% and 3.3%, respectively. Compared with the first year, only the 7.2° slope sediment concentration decreased, and the other three slopes had values similar to those of the B6 treatment, all of which increased significantly. In 2018, the effect of B6 and B12 on sediment concentration showed no obvious rule. In 2019, on the slopes of 1.8, 3.6 and 5.4°, the decrease in the sediment concentration treated with B12 was greater than that treated with B6; however, when the slope reached 7.2°, the decrease in the sediment concentration of B6 was greater than that treated with B12. In the second year, the sediment concentration of the B6 treatment decreased by 5.5%, 3.3%, 5.4% and 18.0%, respectively, compared with that of the first year, which indicated that the sediment concentration of the B6 treatment effectively decreased after a long time and more freezing and thawing events. In the second year of the B12 treatment, the sediment concentration decreased by 10.4%, 11.3%, 10.0% and −4.2% compared with the first year, respectively. The decreasing rate of runoff sediment concentration on the 7.2° slope showed a negative growth trend, but the decreasing rate of sediment concentration on the other three slopes was higher than that of the B6 treatment. It can be concluded that the effect of biochar application on runoff sediment concentration in the second year was greater than that in the first year. The greater the slope, the greater was the influence of this condition. Moreover, the combination of the B12 treatment on the 7.2° slope may be the critical combination of slope and biochar content in the process of adjusting slope sediment concentration.
Additionally, during the transition period of the runoff sediment concentration from the unsteady stage to the quasi-stable stage, rill erosion occurred, and we observed the effect of rill on the sediment concentration before and after the occurrence of rill (Figure 3). The results indicated that the occurrence time of rill erosion in 2019 was approximately 4 min later than that in 2018. Rill development continued until the end of runoff, when rill erosion occurred, and the sediment concentration of each treatment tended to be stable. Therefore, rill erosion plays a key role in affecting the change in sediment concentration.

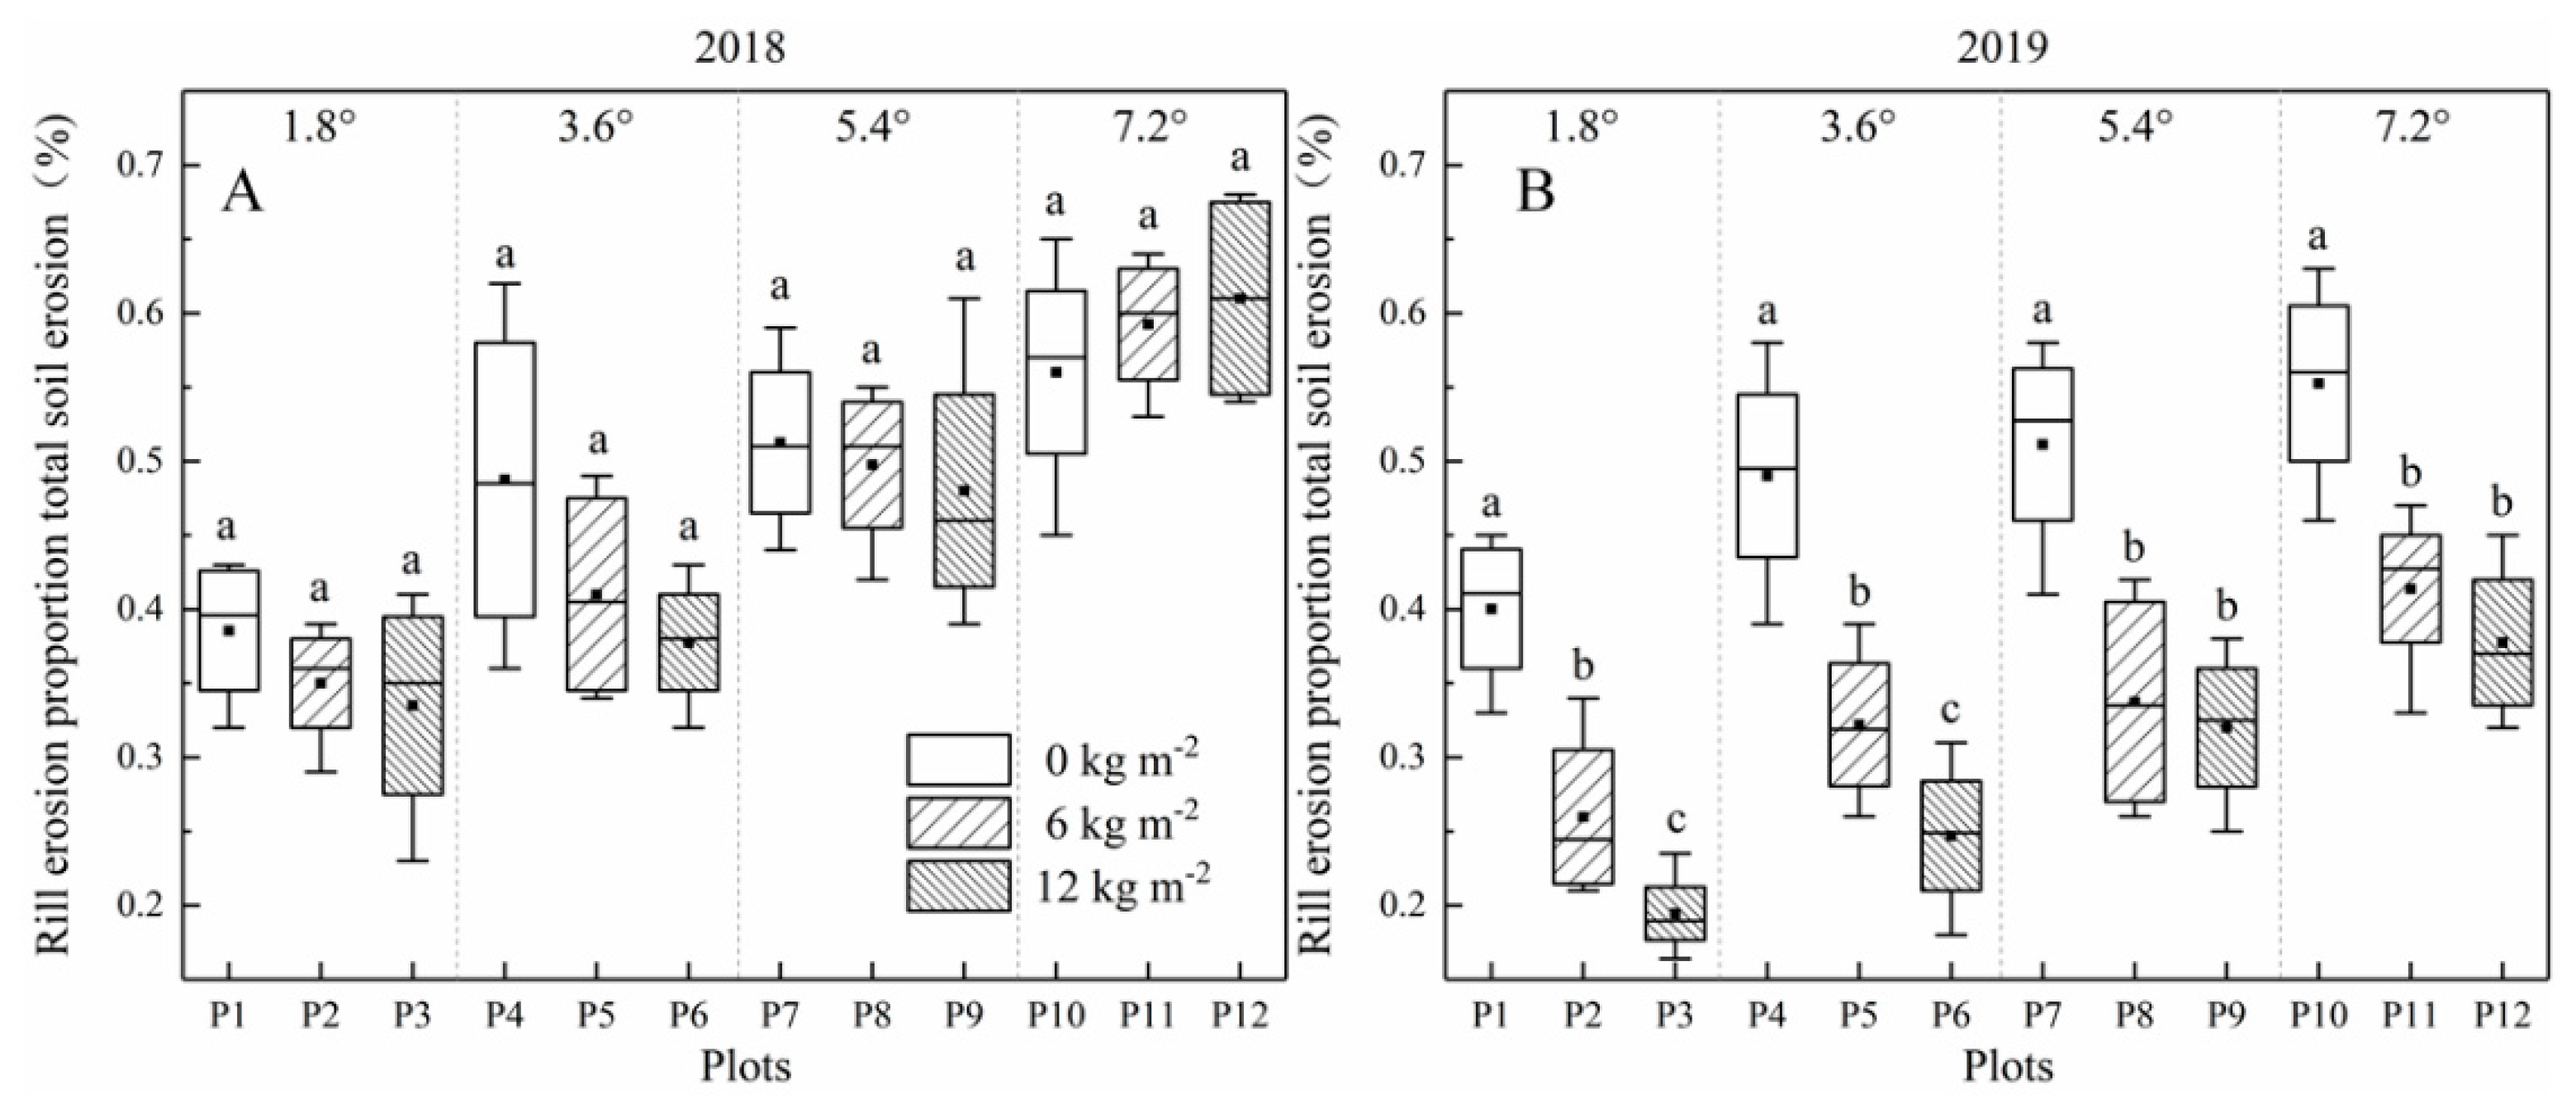
3.3. Effect of Biochar on Rill Erosion

Rill erosion occurs during the transition from the unstable stage to the quasi-stable stage in the process of slope flow and sediment. The proportion of two-year rill erosion is shown in Figure 4. In 2018, compared with B0, the proportion of rill erosion to total soil erosion in the four slopes treated with B6 decreased by 9.2%, 17.4%, 3.9% and −5.8%, respectively. Treatment with B12 decreased total soil erosion by 13.1%, 22.6%, 6.3% and 8.9%, respectively. On the slopes of 1.8, 3.6 and 5.4°, the amount of rill erosion after the B12 treatment was less than that after the B6 treatment, and compared with the control group, the decrease rate reached its maximum at 3.6°. Treatment with B6 and B12 on a 7.2° slope resulted in an increase in rill erosion, and the increase in rill erosion after the B12 treatment was higher than that after the B6 treatment.
After two years of comparison, as shown in Figure 4, the proportion of rill erosion after the B6 and B12 treatments decreased significantly. Compared with B0, the rill erosion on the four slopes under the B6 treatment decreased by 35.1%, 34.3%, 34.0% and 25.1%, respectively, and that under the B12 treatment decreased by 51.4%, 49.6%, 37.4% and 31.7%, respectively. In 2019, the effect of reducing rill erosion with the B12 treatment on four slopes was higher than that of B6. In addition, rill erosion variation had a significant difference at the two biochar content treatments on the 1.8° and 3.6° slopes, but the variations in the 5.4° and 7.2° slopes were not obvious. This result indicated that the high biochar content application had little effect on reducing rill erosion.
By comparing the changes in the proportion of rill erosion after applying biochar in 2018 and 2019, it can be seen that after the application of biochar, the seasonal freezing–thawing in the first year had little impact on rill erosion, and it even increased on the 7.2° slope. In the second year of seasonal freezing–thawing, the biochar treatment had an obvious effect on reducing rill erosion on the sloped surface. With increasing slope, the effect of the B6 and B12 treatments on rill erosion was weakened.

3.4. Effect of Biochar on the Rate of Headward Erosion

In the previous section, we analyzed the influence of biochar on rill erosion on different slope surfaces. The head erosion rates in 2018 and 2019 are shown in Table 2. It can be seen from the table that in 2018 and 2019, the average head erosion rate increases with increasing slope. After the B6 and B12 treatments on the same slope in 2018, the average rate of head erosion was B0 > B6 > B12, but the change range was small. The change increased in 2019, especially on the 7.2° slope, and the variation was the most obvious. Compared with 2018, the average head erosion rate after the B6 treatment in 2019 decreased by 3.8%, 3.0%, 10.7% and 14.9%, respectively; similarly, after the B12 treatment, the average head erosion rate decreased by 6.2%, 0.3%, 7.1%, and 15.1%, respectively. We then observed the variation trend of the maximum and minimum head erosion rates of different biochar content treatments on different slopes in the two years. Similar to the variation rule of the average head erosion rate, with the increase in biochar duration, the range of change was more significant. Moreover, we found that the head erosion rate increased with increasing slope, and the effect of slope on the head erosion rate was more obvious than that after applying biochar.

3.5. Effect of Biochar on Hydraulic Parameters of Rill

The processes of slope flow and sediment were changed by applying biochar on different slopes, and the hydraulic characteristics of runoff in rill also changed. The hydraulic parameters of rill runoff are shown in Table 3. In 2018 and 2019, due to the different biochar content treatments, the flow velocity and Reynolds number changed significantly. In 2018, compared with the control group, the flow velocity of the B6 treatment decreased by 5.6–7.4% on the different slopes. The effect of the B6 treatment on the flow velocity of the four slopes was similar. After the B12 treatment, the flow velocity of the four slopes decreased by 12.1%, 15.4%, 11.2% and 9.4%, respectively. Compared with the B6 treatment, the effect of reducing the flow velocity was enhanced. In 2019, the flow velocity after the B6 treatment decreased by 9.1%, 16.5%, 8.7% and 20.0%, respectively. The decrease rate of flow velocity was significantly higher than that in 2018, and after the B12 treatment, the flow velocity decreased by 20.7%, 23.1%, 19.3% and 30.2%, respectively. The results showed that the flow velocity decreased with increasing biochar content.
Similar to the variation trend of flow velocity, after the B6 and B12 treatments, the slope Reynolds number (Re) decreased with increasing duration. Compared with 2018, the Reynolds number of the four slopes in 2019 after the B6 treatment decreased by 5.8%, 27.3%, 11.7% and 32.3%, respectively, and those after the B12 treatment decreased by 15.8%, 16.1%, 2.2% and 37.3%, respectively. The results showed that the amount of two types of biochar was not significant with the change in slope, but the Reynolds number decreased the most on the 7.2° slope. In 2018 and 2019, the change in flow regime was most obvious after biochar treatment on the 1.8° slope. When biochar was not applied, Re > 500, and the flow regime was transitional flow. After treatment with B6 and B12, Re < 500, and the flow regime was laminar. After the B0, B6 and B12 treatments, on the 3.6, 5.4, and 7.2° slopes, the Reynolds number was greater than 500, indicating that biochar did not change the flow regime in the two years. However, the Re in the four slopes decreased with increasing biochar content. This result indicates that biochar effectively reduced the turbulence of rill flow.
In 2018 and 2019, the Froude number (Fr) of all slopes was between 0.30 and 0.42. This result indicates that the water flow was all subcritical flow. Biochar treatment and time change had little effect on Fr. In 2018, after the B6 treatment, the Darcy–Weisbach resistance coefficient (f) on the 1.8° slope barely changed, the f value of the other three slopes increased, and as the slope increased, the f value increased. The change trend of the f value after the B12 treatment was similar to that of the B6 treatment. In 2019, the increase in the f value after the B12 treatment was higher than that of the B6 treatment on all slopes. Therefore, the influence of biochar on the slope surface rill resistance coefficient was greater with increasing slope, and with increasing duration, the effect was more significant.

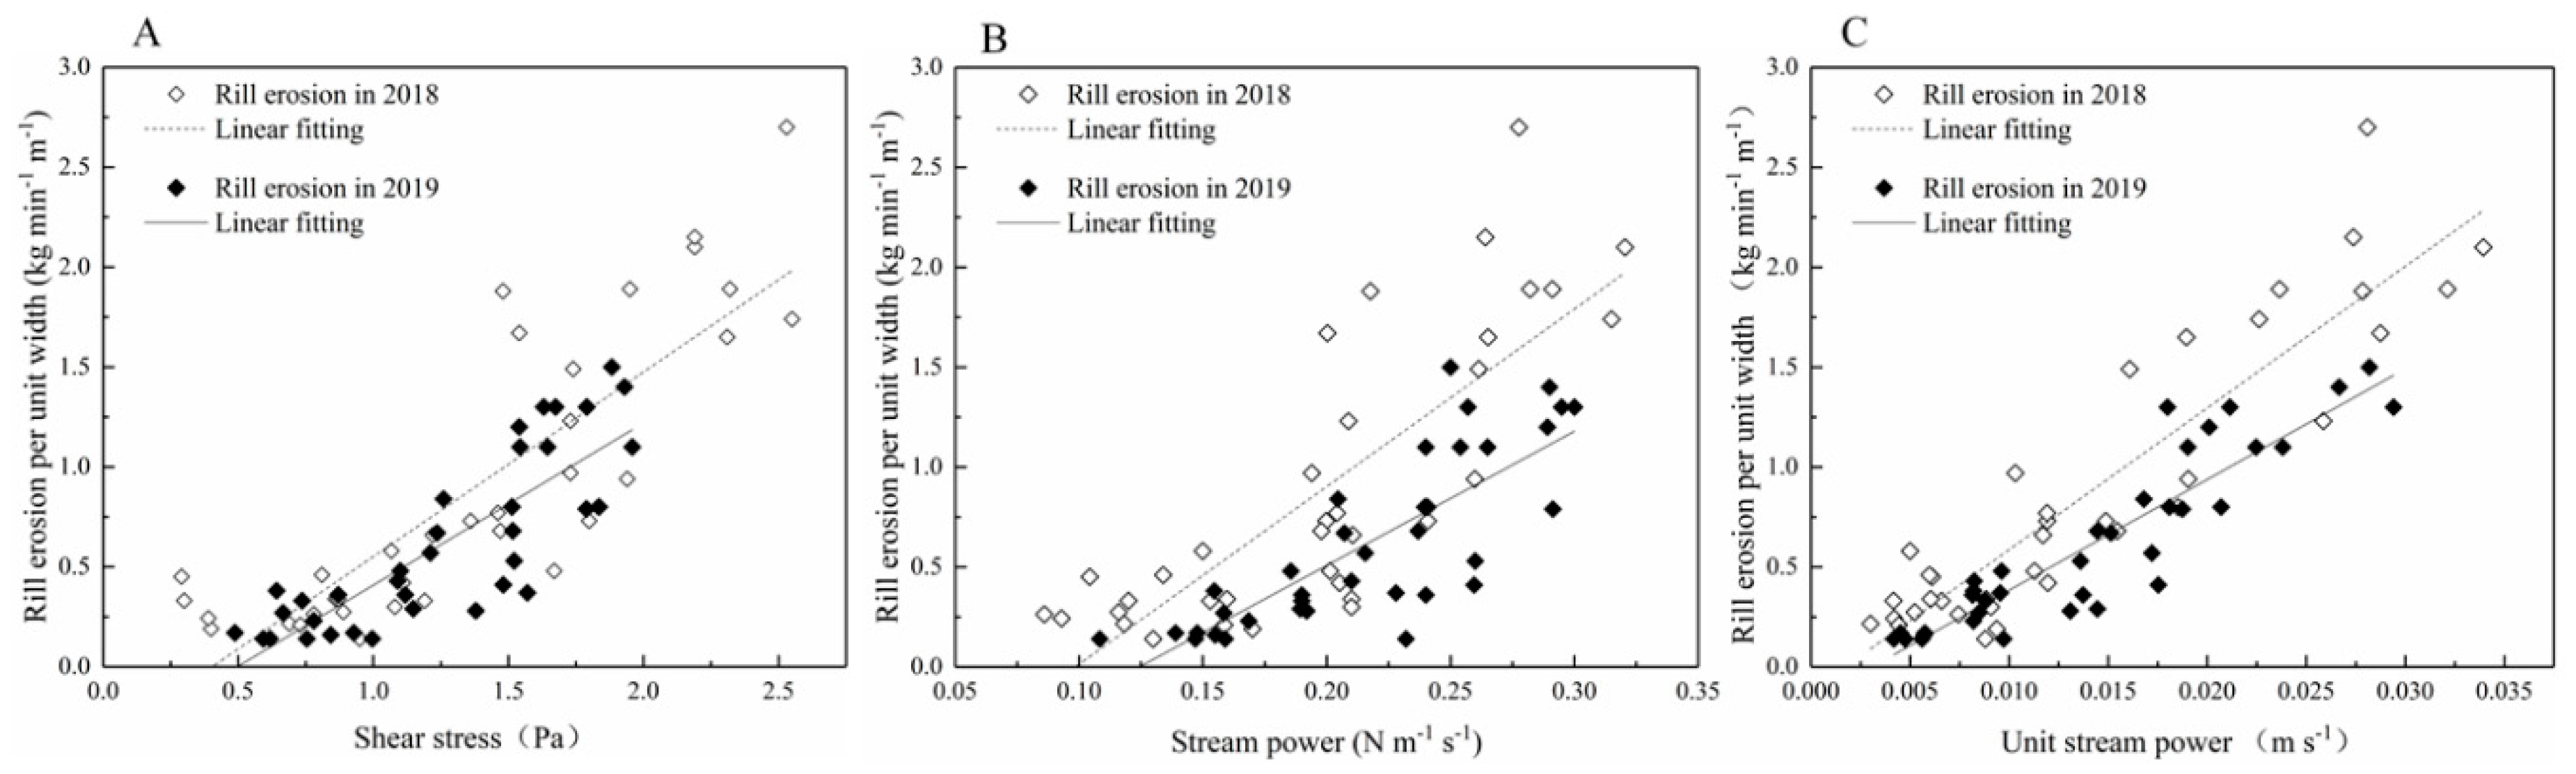
3.6. Effect of Biochar on the Dynamic Mechanism of Rill Erosion

The removal and migration of soil particles is an energy-consuming process. Raindrop impacts on the sloped surface and soil erosion by runoff are the main energy sources of slope soil erosion.
Before the soil particles started to move, the flow force needed to separate the cohesive force of soil particles and the friction between particles is defined as the critical force. Rill erosion occurs when the runoff power is greater than or equal to the critical force. Therefore, it is necessary to analyze the critical hydrodynamic force generated by soil erosion. Based on previous studies [54,55], this study obtained the critical dynamic force by establishing the relationship between rill sediment yield per unit width and hydrodynamic parameters such as shear stress, flow power and flow power per unit. As shown in Figure 5, a linear function is used to describe the relationship between rill erosion per unit width and the above three hydrodynamic parameters. The amount of rill erosion per unit width increased significantly with increasing shear stress, flow power and flow power per unit width. All the above relationships were fitted linearly, and the linear relationship between the unit rill erosion and the above three hydrodynamic parameters in 2018 and 2019 can be expressed as follows (as shown in Figure 5):
2018 : {   D r = 0 . 924   ( τ   -   0 . 403 )   (   R 2 = 0 . 705 ,   n = 36   ) D r = 8 . 888   ( ω   -   0 . 098 )   (   R 2 = 0 . 635 ,   n = 36   ) D r = 70 . 912   ( φ   -   0 . 002 )   (   R 2 = 0 . 829 ,   n = 36   )
2019 : {   D r = 0 . 811   ( τ   -   0 . 497 )   (   R 2 = 0 . 689 ,   n = 36   ) D r = 6 . 623   ( ω   -   0 . 124 )   (   R 2 = 0 . 640 ,   n = 36   ) D r = 59 . 360   ( φ   -   0 . 003 )   (   R 2 = 0 . 830 ,   n = 36   )
where Dr is the rill erosion per unit with time (kg min−1 m−1); τ is the shear stress (Pa); ω is the stream power (N m−1 s−1); and φ is the unit stream power (m s−1).
The critical dynamic parameters can be obtained from the above relationship. When rill erosion does not occur, that is, when Dr = 0, the critical dynamic value can be obtained. According to Equations (8) and (9), the critical shear stress, critical flow power and critical unit flow power in 2018 and 2019 are 0.403 Pa, 0.098 m s−1, 0.002 N m−1 and 0.497 Pa, 0.124 m s−1, and 0.003 N m−1, respectively. Compared with the two-year critical dynamic value, the values in the second year are all larger than those in the first year. Compared with 2018, the critical shear stress, critical flow power and critical flow unit power in 2019 increased by 0.094 Pa, 0.026 m−1 and 0.001 m s−1, respectively. Therefore, it can be concluded that, with the increase in the number of seasonal freezing–thawing events after biochar treatment, the higher the slope critical erosion dynamic value is, the higher the critical dynamic value of stripping and migration of the slope soil will be. The critical dynamics of stripping and migrating of slope soil increased. Due to the limitation of the time of this experiment, we were unable to further explore as the number of freeze–thaw events continued to increase, and we could not investigate the maximum critical erosion force reached by the mixed particles of carbon soil or how long it took to reach the maximum critical erosion force.

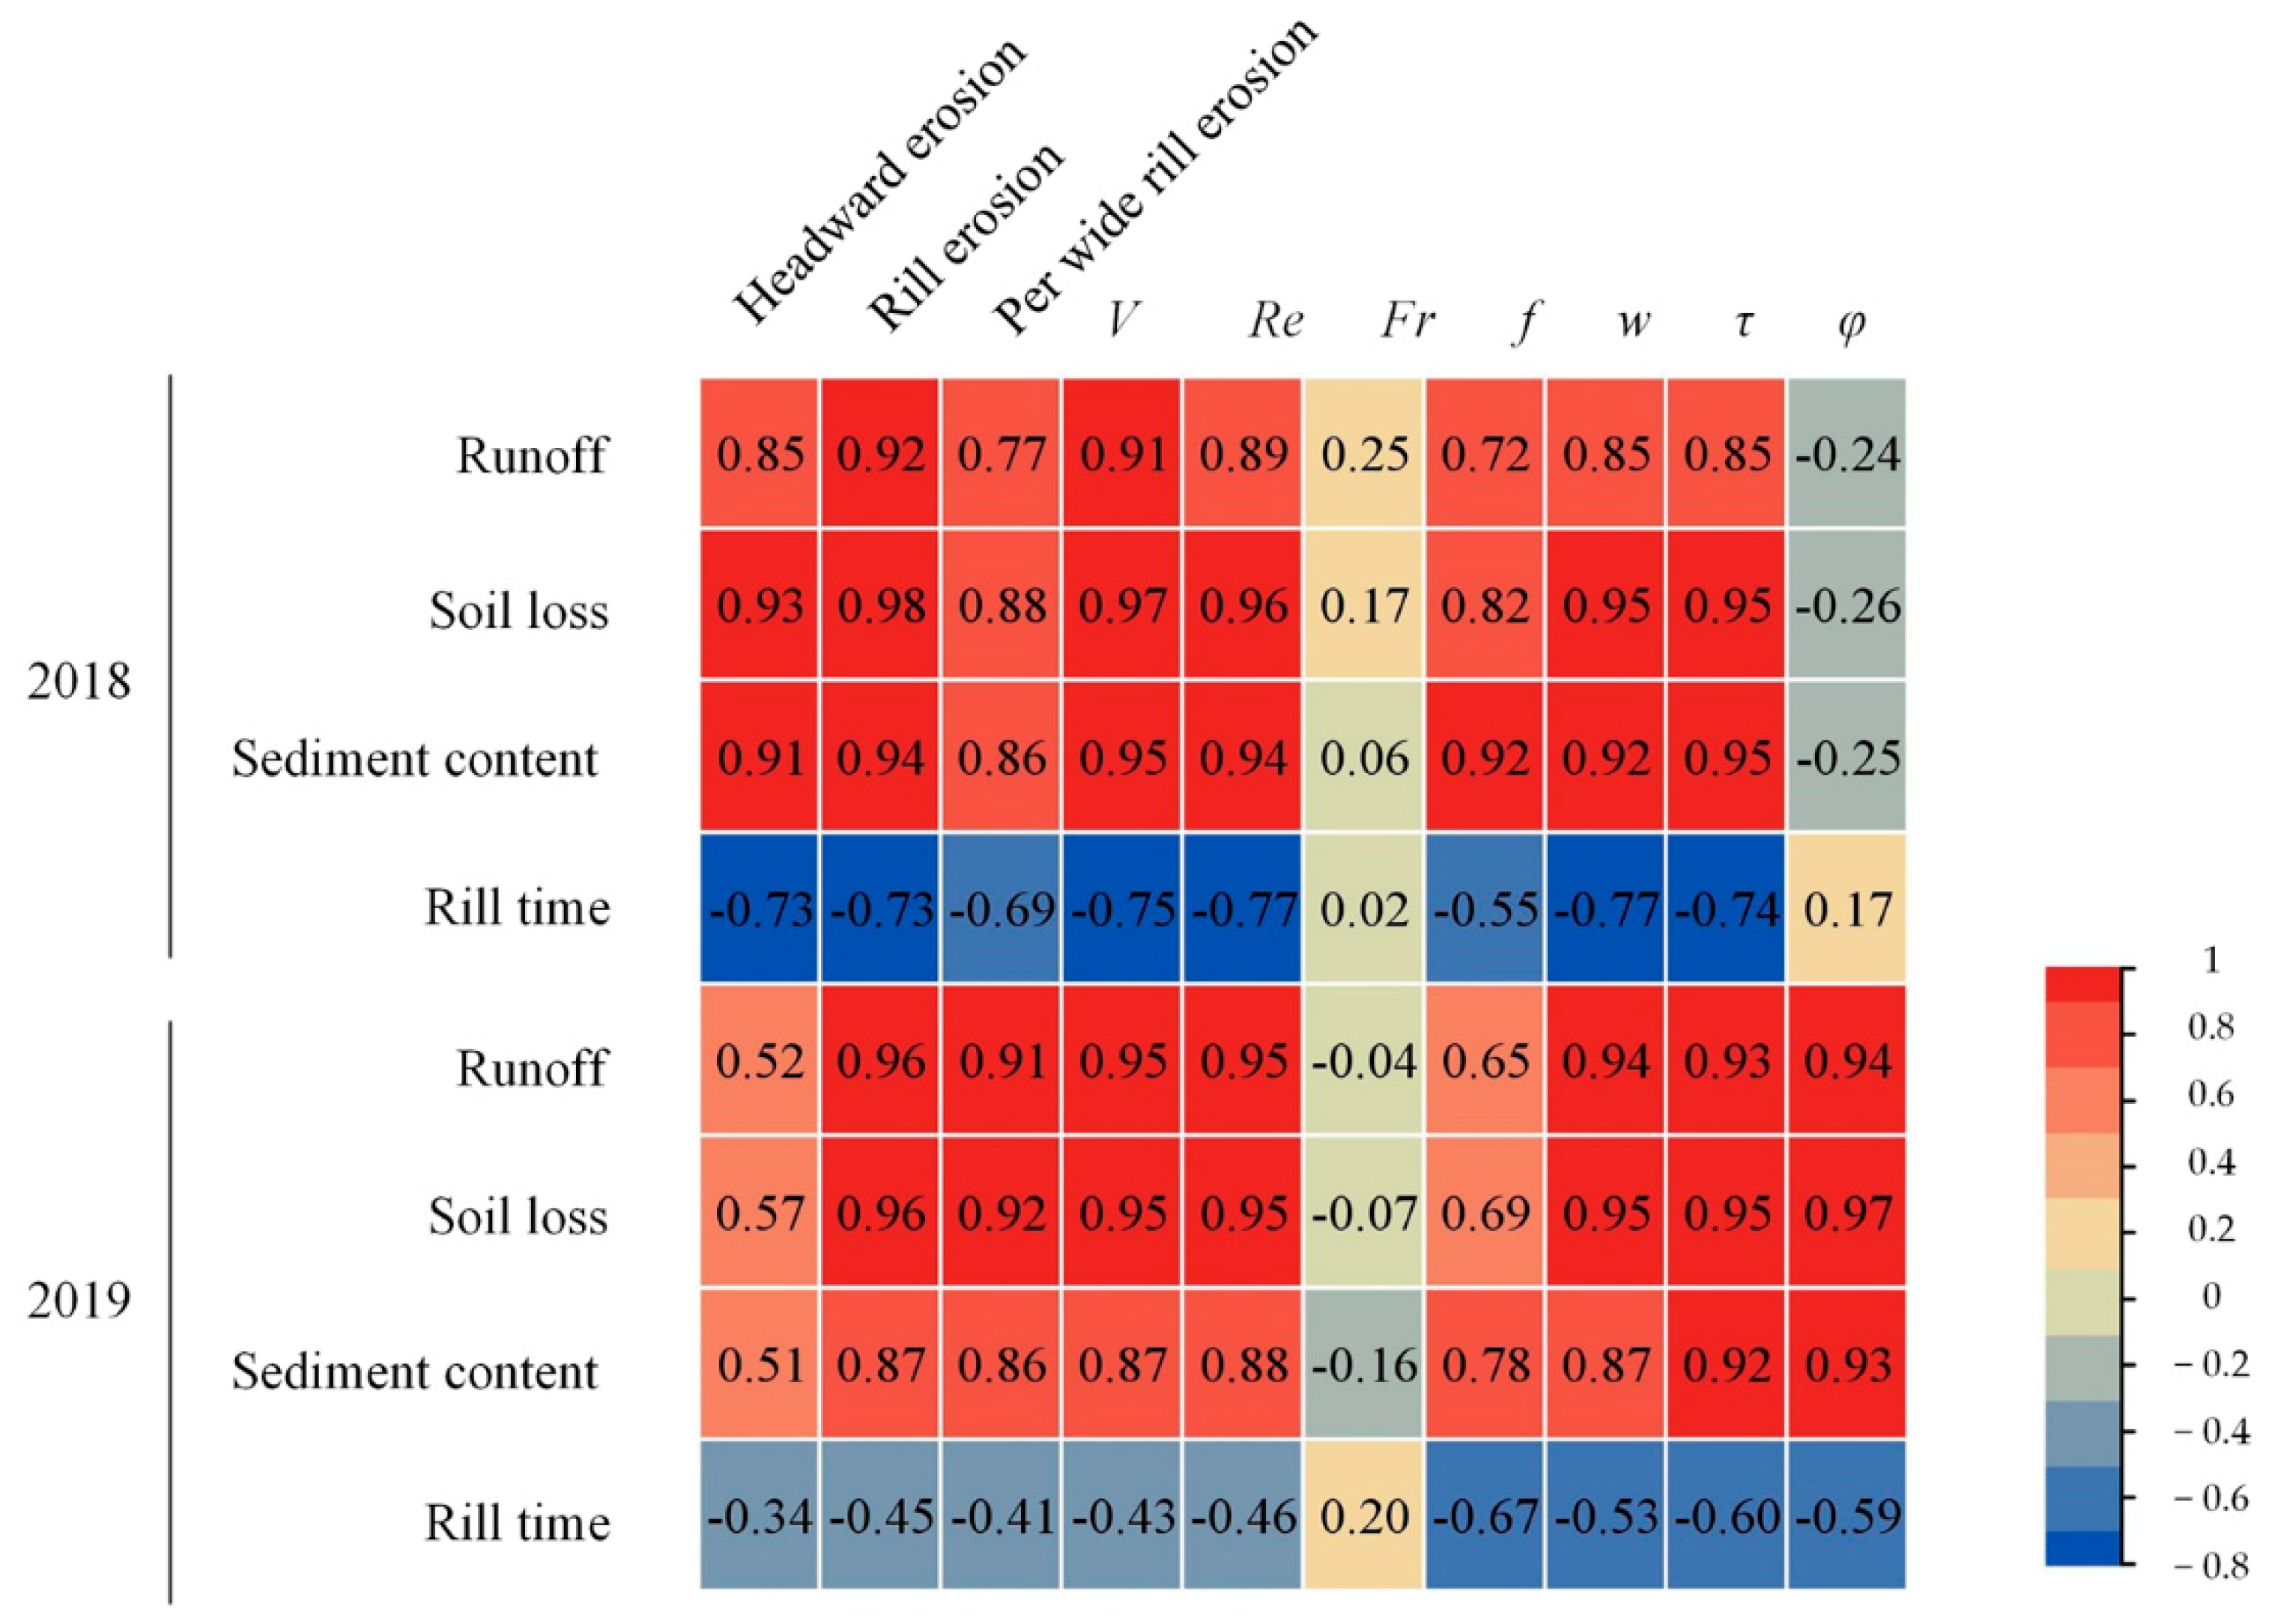
3.7. Correlation Analysis between Characteristic Parameters of Water and Sediment Processes and Rill Erosion in 2018 and 2019

In the above analysis, biochar treatment on sloped land had a great influence on the change in the proportion of rill erosion in 2018 and 2019. To reveal the mechanism of action of slope rill erosion on flow and sediment processes, correlation analysis between the slope flow and sediment process characteristic parameters and the rill hydraulic and dynamic parameters was conducted for two years, and the results are shown in Figure 6.
As seen from Figure 6, in 2018, the flow and sediment process parameters (runoff, soil loss, sediment content and rill time) had no significant correlation with Fr and φ, while they were positively correlated with other parameters in the rill erosion hydraulic and dynamic parameters (p < 0.01). The correlation between flow and sediment process parameters and rill erosion parameters in 2019 was similar to that in the first year. However, the correlation between the flow and sediment parameters with the head erosion rate and f was significantly changed compared with the first year. The correlation between the Fr value and the slope flow and sediment process parameters was weak in the two years. By comparing the relationship between rill erosion duration and rill erosion parameters in 2018 and 2019, the rill hydraulic and dynamic parameters except for Fr and φ were significantly negatively correlated with rill erosion time, and the correlation level had a great difference in the two years. The φ and slope flow and sediment process parameters changed from having a negative correlation to a significant positive correlation, and the correlation with rill duration changed from being weakly positive to significantly negative.
The results showed that there was a significant correlation between slope flow and sediment development process and rill erosion within two years after biochar treatment. The correlation difference between rill erosion and slope flow and sediment process in 2018 and 2019 indicated that the duration and the number of seasonal freezing–thawing events were important factors affecting the impact of biochar slope flow and sediment processes.

4. Discussion

In many cases of biochar application in black soil area, it is generally considered that a biochar soil mixed layer is formed on the soil surface, which changes the soil structure, increases the storage capacity of upper soil and significantly improves the water holding capacity of lower soil [56]. This study aimed to further explore the effect of biochar on runoff and sediment transport processes and rill erosion characteristic parameters.

4.1. The Effect of Biochar and Freeze–Thaw on the Process of Slope Water and Sediment

According to Section 3.1 and Section 3.2, biochar has a positive effect on water and sediment reduction after one and two years of seasonal freezing and thawing. Under the same rainfall conditions, both the B6 and B12 treatments reduced the runoff rate on the four slope surfaces. Comparing the runoff rate of two years after applying biochar, the test results showed that the soil loss on slopes treated by the two biochar treatments in 2019 decreased by 12.8% and 0.6%, respectively, compared with those in 2018, indicating that application time and freezing–thawing times are important conditions that influence the effect of biochar on soil loss. Li et al. [7] studied the application of biochar in Central China and found that the early application of biochar could lead to relatively loose soil. The biochar-soil mixing intensity was weak and may require a longer duration or no-till to further improve the biochar and coherence of soil particles. Therefore, many studies on the effect of biochar on slope soil erosion are conducted after biochar application in soil for a period of time. For example, Jian et al. conducted a simulated rainfall test after 105 days of cultivation with biochar addition, and the amount of soil erosion decreased with the increase of biochar content [26]. Hseu et al. conducted an artificial simulated rainfall test after 168 days of cultivation with biochar addition; soil erosion was reduced by 35–90% [27]. The results showed that soil erosion decreased significantly after biochar was cultured in most soil environments for a period of time. In the study of applying biochar to culture in soil for a longer time, three sampling tests in two consecutive years showed that biochar could promote the stability of soil aggregates in two years [28]. In the initial stage of biochar application, the surface runoff increased slightly, while in the second rainfall test, biochar had a better effect of reducing runoff and sediment, which was similar to the results of this study. After the application of biochar, the soil erosion resistance gradually increased over a period of time. After a long development time, the application of biochar will inevitably be affected by local climate conditions; therefore, climate is an important condition that affects whether biochar will improve soil [20,38]. Fu et al. [38] found that seasonal freezing–thawing events in Northeast China promoted the structure of biochar–soil mixtures. The research results showed that the freezing–thawing action caused biochar–soil mixed grain to form a larger total porosity, and the freeze–thaw effects changed the soil water redistribution. The thawing stage increased the water content of the mixed body of biochar and soil with the addition of snowmelt water on the surface and promoted the combination of biochar and small soil particles to form larger aggregates [57,58]; additionally, the increase in the number of freezing and thawing events and the application time made the process change more fully. Therefore, the increase in duration and freeze–thaw times had a significant role in promoting biochar to reduce soil erosion.

4.2. Effect of Biochar on Rill Erosion Characteristics

Soil erosion is caused by several processes, among which rill water plays an important role in soil erosion [54]. At the initial stage of runoff generation, the infiltration rate is relatively high, and the slope does not form a closed soil surface; thus, the runoff rate is relatively low. However, with the crusting of the soil surface and the increase in surface runoff, rill erosion gradually forms and dominates the soil erosion process [10,50]. Therefore, the study of rill erosion is of great significance for the prevention and control of soil erosion. As shown in Figure 4, the proportion of rill erosion on slopes to total erosion increases with increasing slope, which is similar to the research results of Zheng et al. [59], who indicated that the contribution rate of rill erosion to soil erosion on a slope can reach 74.2%. However, the slopes discussed in this study are relatively small, with rill erosion taking up a maximum of 61.0%. After applying biochar, the proportion of slope rill erosion decreased. Biochar can increase the coulomb force and van der Waals force between soil particles, stabilize soil aggregates, weaken the separation of soil particles and reduce rill erosion [60,61]. From Figure 4, we find that in the first year of freezing–thawing, the amount of rill erosion on the slope after biochar treatment was slightly lower than that of the control group, but the difference was not significant, and even the amount of rill erosion after biochar application on the 7.2° slope was higher than that of the control group. After two years of seasonal freezing–thawing, rill erosion decreased with increasing biochar content. A similar phenomenon was found in the study of Fu et al. [49]; biochar and soil particles could not reach the ideal stability level due to one seasonal freeze–thaw action and a short duration. Therefore, seasonal freezing-thawing events can promote biochar to improve soil particle stability.
The headward erosion rate is an important parameter of rill erosion [62]. Although the maximum and minimum headward erosion rates have certain randomness and contingency, the extreme values also have inevitability because they are a representation of extreme changes in rill erosion, which is similar to the results of Leonard and Richard [63], the average headward erosion rate tending to be similar to that of the rill erosion.

4.3. Effects of Biochar on Hydraulic and Dynamic Parameters of Rill Erosion

There are many studies on the hydraulic and dynamic parameters of rill erosion caused by concentrated runoff [64,65], however, the application of biochar changes the development process of sloped rill, which increases the soil surface roughness, thus changing the runoff velocity (Table 3). Therefore, to explore the influence of biochar on the slope rill erosion mechanism, it is necessary to analyze the hydraulic and dynamic parameters of runoff in rill after applying biochar.
There are three flow regimes of rill flow: laminar flow (Re < 500), transitional flow (Re = 500–2000) and turbulent flow (Re > 2000) [55]. In this study, the variation range of the Reynolds number of slope runoff after biochar application is 300–2600, which is similar to the range of rill Reynolds numbers reported by Nearing et al. [66] and Shen et al. [10]. When biochar particles are mixed in the soil surface, the higher soil surface roughness interferes with the lateral movement of runoff and separates soil particles, resulting in an increase in the Darcy–Weisbach coefficient [4].
The researchers believe that hydrodynamic parameters can better describe the dynamic mechanism of rill erosion [54,55]. In this study, the critical shear force, critical runoff power and critical unit runoff power in the second year increased by 23.3%, 26.5% and 33.3%, respectively, compared with the first year. This result shows that in the second year the critical energy required for rill erosion increases, and the possibility of rill erosion is reduced. In addition, this study and the one by Sadeghi et al. [20] highlight the presence of some black biochar particles in runoff in their respective experiments, which means that runoff will lead to the loss of biochar; thus, it may be necessary to combine this approach with other management measures to avoid the floating of biochar after rainfall. In conclusion, research on biochar is still in its infancy, and most experiments related to soil erosion and biochar effects are conducted in laboratory experiments or under short-term controlled conditions. Therefore, more research or long-term field trials combined with soil, climate and land management factors are needed to better predict the impact of biochar applications on soil erosion.

5. Conclusions

During the two years of continuous research, biochar was able to reduce soil erosion, and the effect of reducing soil erosion gradually increased within two years after biochar application. Biochar can slow down the development process of rill erosion, and the critical shear force, critical runoff power and critical unit runoff power of rill erosion occurs in the second year, were increased by 0.094 Pa, 0.026 m s−1 and 0.001 N m−1, respectively. In a word, under the condition of seasonal freeze–thaw time in Northeast China, the effect of biochar on soil erosion on the slope is enhanced year by year in two years. In order to widely use biochar, it is necessary to understand the matching of various types of biochar and soil in long-term experiments in the complex dynamic process of different climatic conditions, soil properties and agricultural production activities.

Author Contributions

Conceptualization, Q.F. and T.L.; methodology, D.L.; software, Q.F.; validation, T.L. and P.Y.; formal analysis, R.H.; investigation, H.Z.; resources, Q.F.; data curation, T.L., S.X., P.X. and Y.Z.; writing—original draft preparation, P.Y.; writing—review and editing, P.Y.; visualization, H.Z.; supervision, T.L.; project administration, R.H.; funding acquisition, Q.F. All authors have read and agreed to the published version of the manuscript.

Funding

We acknowledge that this research was supported by the National Science Fund for Distinguished Young Scholars (51825901), Joint fund of the National Natural Science Foundation of China (U20A20318), the Heilongjiang Provincial Science Fund for Distinguished Young Scholars (YQ2020E002),” Young Talents” Project of Northeast Agricultural University (18QC28), China Postdoctoral Science Foundation (2019M651247), Postdoctoral Science Foundation of Heilongjiang Province (LBH-Z19003).

Institutional Review Board Statement

Not applicable.

Informed Consent Statement

Not applicable.

Data Availability Statement

Data are contained within the article.

Acknowledgments

Thanks to the hard-working editors and valuable comments from reviewers.

Conflicts of Interest

The authors declare no conflict of interest.

References

  1. Adimassu, Z.; Mekonnen, K.; Yirga, C.; Kessler, A. Effect of soil bunds on runoff, soil and nutrient losses, and crop yield in the central highlands of Ethiopia. Land Degrad. Dev. 2012, 25, 554–564. [Google Scholar] [CrossRef]
  2. Doan, T.T.; Henry-Des-Tureaux, T.; Rumpel, C.; Janeau, J.L.; Jouquet, P. Impact of compost, vermicompost and biochar on soil fertility, maize yield and soil erosion in Northern Vietnam: A three year mesocosm experiment. Sci. Total. Environ. 2015, 514, 147–154. [Google Scholar] [CrossRef]
  3. Zhuang, Y.; Du, C.; Zhang, L.; Du, Y.; Li, S. Research trends and hotspots in soil erosion from 1932 to 2013: A literature review. Science 2015, 105, 743–758. [Google Scholar] [CrossRef]
  4. Abrol, V.; Ben-Hur, M.; Verheijen, F.; Keizer, J.J.; Martins, M.A.S.; Tenaw, H.; Tchehansky, L.; Graber, E.R. Biochar effects on soil water infiltration and erosion under seal formation conditions: Rainfall simulation experiment. J. Soils Sedim. 2016, 16, 2709–2719. [Google Scholar] [CrossRef]
  5. Lal, R. Soil Carbon Sequestration Impacts on Global Climate Change and Food Security. Science 2004, 304, 1623–1627. [Google Scholar] [CrossRef] [PubMed] [Green Version]
  6. Nearing, M.A.; Pruski, F.F.; O’Neal, M.R. Expected climate change impacts on soil erosion rates: A review. J. Soil Water Conserv. 2004, 59, 43–50. [Google Scholar]
  7. Li, Z.G.; Gu, C.M.; Zhang, R.H.; Ibrahim, M.; Zhang, G.S.; Wang, L.; Chen, F.; Liu, Y. The benefic effect induced by biochar on soil erosion and nutrient loss of slopping land under natural rainfall conditions in central China. Agric. Water Manag. 2017, 185, 145–150. [Google Scholar] [CrossRef]
  8. Li, Z.; Liu, C.; Dong, Y.; Chang, X.; Nie, X.; Liu, L.; Xiao, H.; Lu, Y.; Zeng, G. Response of soil organic carbon and nitrogen stocks to soil erosion and land use types in the Loess hilly–gully region of China. Soil Tillage Res. 2017, 166, 1–9. [Google Scholar] [CrossRef]
  9. Liu, Y.; Tao, Y.; Wan, K.; Zhang, G.; Liu, D.; Xiong, G.; Chen, F. Runoff and nutrient losses in citrus orchards on sloping land subjected to different surface mulching practices in the Danjiangkou Reservoir area of China. Agric. Water Manag. 2012, 110, 34–40. [Google Scholar] [CrossRef]
  10. Shen, H.; Zheng, F.; Wen, L.; Han, Y.; Hu, W. Impacts of rainfall intensity and slope gradient on rill erosion processes at loessial hillslope. Soil Tillage Res. 2016, 155, 429–436. [Google Scholar] [CrossRef]
  11. Shen, C.; Wang, Y.; Zhao, L.; Xu, X.; Yang, X.; Liu, X. Characteristics of Material Migration During Soil Erosion in Sloped Farmland in the Black Soil Region of Northeast China. Trop. Conserv. Sci. 2019, 12, 1–11. [Google Scholar] [CrossRef] [Green Version]
  12. Butnan, S.; Deenik, J.L.; Toomsan, B.; Antal, M.J.; Vityakon, P. Biochar characteristics and application rates affecting corn growth and properties of soils contrasting in texture and mineralogy. Geoderma 2015, 237–238, 105–116. [Google Scholar] [CrossRef]
  13. El-Naggar, A.; Lee, S.S.; Awad, Y.; Yang, X.; Ryu, C.; Rizwan, M.; Rinklebe, J.; Tsang, D.; Ok, Y.S. Influence of soil properties and feedstocks on biochar potential for carbon mineralization and improvement of infertile soils. Geoderma 2018, 332, 100–108. [Google Scholar] [CrossRef]
  14. Liu, C.; Chen, L.; Ding, D.; Cai, T. From rice straw to magnetically recoverable nitrogen doped biochar: Efficient activation of peroxymonosulfate for the degradation of metolachlor. Appl. Catal. B: Environ. 2019, 254, 312–320. [Google Scholar] [CrossRef]
  15. Wang, J.L.; Wang, S.Z. Preparation, modification and environmental application of biochar: A review. J. Clean. Prod. 2019, 227, 1002–1022. [Google Scholar] [CrossRef]
  16. Atkinson, C.J.; Fitzgerald, J.D.; Hipps, N.A. Potential mechanisms for achieving agricultural benefits from biochar application to temperate soils: A review. Plant Soil 2010, 337, 1–18. [Google Scholar] [CrossRef]
  17. Ouyang, L.; Wang, F.; Tang, J.; Yu, L.; Zhang, R. Effects of biochar amendment on soil aggregates and hydraulic properties. J. Soil Sci. Plant. Nutr. 2013, 13, 991–1002. [Google Scholar] [CrossRef] [Green Version]
  18. Huang, Y.M.; Liu, D.; An, S.S. Effects of slope aspect on soil nitrogen and microbial properties in the Chinese Loess region. Catena 2015, 125, 135–145. [Google Scholar] [CrossRef]
  19. Hazbavi, Z.; Sadeghi, S.H.; Kiani-Harchegani, M. Application of Biochar on temporal variability of runoff volume and coefficient. In Proceedings of the Third WASWAC Conference, Belgrade, Serbia, 22–26 August 2016; pp. 186–187. [Google Scholar]
  20. Sadeghi, S.H.; Hazbavi, Z.; Harchegani, M.K. Controllability of runoff and soil lossfrom small plots treated by vinasse-produced biochar. Sci. Total Environ. 2016, 541, 483–490. [Google Scholar] [CrossRef] [PubMed]
  21. Dong, X.; Li, G.; Lin, Q.; Zhao, X. Quantity and quality changes of biochar aged for 5 years in soil under field conditions. Catena 2017, 159, 136–143. [Google Scholar] [CrossRef]
  22. Li, Y.; Zhang, F.; Yang, M.; Zhang, J.; Xie, Y. Impacts of biochar application rates and particle sizes on runoff and soil loss in small cultivated loess plots under simulated rainfall. Sci. Total. Environ. 2019, 649, 1403–1413. [Google Scholar] [CrossRef] [PubMed]
  23. Peake, L.R.; Reid, B.J.; Tang, X. Quantifying the influence of biochar on the physical and hydrological properties of dissimilar soils. Geoderma 2014, 235-236, 182–190. [Google Scholar] [CrossRef]
  24. Reddy, K.; Yaghoubi, P.; Yukselen-Aksoy, Y. Effects of biochar amendment on geotechnical properties of landfill cover soil. Waste Manag. Res. 2015, 33, 524–532. [Google Scholar] [CrossRef]
  25. Wu, Y.Y.; Yang, M.Y.; Zhang, F.B.; Zhang, J.Q.; Zhao, T.Y.; Liu, M. Effect of biochar application on erodibility of plow layer soil on loess slopes. Acta Pedol. Sin. 2016, 53, 81–92. [Google Scholar] [CrossRef]
  26. Jien, S.H.; Wang, C.S. Effects of biochar on soil properties and erosion potential in a highly weathered soil. Catena 2013, 110, 225–233. [Google Scholar] [CrossRef] [Green Version]
  27. Hseu, Z.Y.; Jien, S.H.; Chien, W.H.; Liou, R.C. Impacts of Biochar on Physical Properties and Erosion Potential of a Mudstone Slopeland Soil. Sci. World J. 2014, 2014, 602197. [Google Scholar] [CrossRef]
  28. Liu, X.H. Effects of Biochar Application on Soil Improvement on the Loess Plateau. Ph.D. Thesis, The University of Chinese Academy of Sciences (Research Center of Soil and water conservation and Ecological Environment), Shaanxi, China, June 2013. [Google Scholar]
  29. Hu, G.; Wu, Y.; Liu, B.; Zhang, Y.; You, Z.; Yu, Z. The characteristics of gully erosion over rolling hilly black soil areas of Northeast China. J. Geogr. Sci. 2009, 19, 309–320. [Google Scholar] [CrossRef]
  30. Mullan, D. Soil erosion under the impacts of future climate change: Assessing the statistical significance of future changes and the potential on-site and off-site problems. Catena 2013, 109, 234–246. [Google Scholar] [CrossRef]
  31. Ollesch, G.; Kistner, I.; Meissner, R.; Lindenschmidt, K.E. Modelling of snowmelt erosion and sediment yield in a small low-mountain catchment in Germany. Catena 2006, 68, 161–176. [Google Scholar] [CrossRef]
  32. Su, J.; van Bochove, E.; Thériault, G.; Novotna, B.; Khaldoune, J.; Denault, J.; Zhou, J.; Nolin, M.; Hu, C.; Bernier, M.; et al. Effects of snowmelt on phosphorus and sediment losses from agricultural watersheds in Eastern Canada. Agric. Water Manag. 2011, 98, 867–876. [Google Scholar] [CrossRef]
  33. Nunes, J.P.; Seixas, J.; Keizer, J.J. Modeling the response of within-storm runoff and erosion dynamics to climate change in two Mediterranean watersheds: A multi-model, multi-scale approach to scenario design and analysis. Catena 2013, 102, 27–39. [Google Scholar] [CrossRef]
  34. Zhao, Y.; Wang, E.; Cruse, R.M.; Chen, X. Characterization of seasonal freeze-thaw and potential impacts on soil erosion in northeast China. Can. J. Soil Sci. 2012, 92, 567–571. [Google Scholar] [CrossRef]
  35. Cerdà, A.; Keesstra, S.; Rodrigo-Comino, J.; Novara, A.; Pereira, P.; Brevik, E.; Giménez-Morera, A.; Fernández-Raga, M.; Pulido, M.; di Prima, S.; et al. Runoff initiation, soil detachment and connectivity are enhanced as a consequence of vineyards plantations. J. Environ. Manag. 2017, 202, 268–275. [Google Scholar] [CrossRef] [Green Version]
  36. Gao, H.; Shao, M. Effects of temperature changes on soil hydraulic properties. Soil Tillage Res. 2015, 153, 145–154. [Google Scholar] [CrossRef]
  37. Gholami, L.; Sadeghi, S.H.; Homaee, M. Straw Mulching Effect on Splash Erosion, Runoff, and Sediment Yield from Eroded Plots. Soil Sci. Soc. Am. J. 2013, 77, 268–278. [Google Scholar] [CrossRef]
  38. Fu, Q.; Zhao, H.; Li, T.; Hou, R.; Liu, D.; Ji, Y.; Zhou, Z.; Yang, L. Effects of biochar addition on soil hydraulic properties before and after freezing-thawing. Catena 2019, 176, 112–124. [Google Scholar] [CrossRef]
  39. Bryan, R.; Rockwell, D. Water table control on rill initiation and implications for erosional response. Geomorphology 1998, 23, 151–169. [Google Scholar] [CrossRef]
  40. Di Stefano, C.; Ferro, V.; Pampalone, V.; Sanzone, F. Field investigation of rill and ephemeral gully erosion in the Sparacia experimental area, South Italy. Catena 2013, 101, 226–234. [Google Scholar] [CrossRef]
  41. Wang, W.L.; Lei, A.L.; Li, Z.B.; Tang, K.L. Study on dynamic mechanism of rills, shallow furrows and gully in the soil erosion chain. Adv. Water Sci. 2003, 14, 471–475. [Google Scholar] [CrossRef]
  42. Zheng, L.Y.; Li, Z.B.; Li, P.; Song, W.; Liu, P.L. Slope erosion process tracing in simulated raining with rare earth elements. Trans. Chin. Soc. Agri. Eng. 2010, 26, 87–91. [Google Scholar] [CrossRef]
  43. He, J.J.; Gong, L.H.; Li, X.J.; Cai, Q.G. Effects of rill development on runoff and sediment yielding processes. Adv. Water Sci. 2014, 25, 90–97. [Google Scholar] [CrossRef]
  44. Peng, X.; Tong, X.; Hao, L.; Wu, F. Applicability of biochar for limiting interrill erosion and organic carbon export of sloping cropland in a semi-arid area of China. Agric. Ecosyst. Environ. 2019, 280, 68–76. [Google Scholar] [CrossRef]
  45. Hou, R.; Li, T.; Fu, Q.; Liu, D.; Cui, S.; Zhou, Z.; Yan, P.; Yan, J. Effect of snow-straw collocation on the complexity of soil water and heat variation in the Songnen Plain, China. Catena 2019, 172, 190–202. [Google Scholar] [CrossRef]
  46. Wu, Y.; Liu, H.; Yang, A.Z.; Zhao, Y.S. Influences of Biochar Supply on Water and Soil Erosion in Slopping Farmland of Black Soil Region. Trans. Chin. Soc. Agr. Mach. 2018, 49, 294–301. (In Chinese) [Google Scholar] [CrossRef]
  47. Lu, Z.; Lei, G.P.; Wang, J.W.; Guo, J.P.; Ma, X.P.; Yang, H. Spatial-temporal variation characteristics of soil and water loss sensitivity in typical black soil regions in Northeast China in the past 30 years. J. Nat. Disasters 2019, 28, 186–195. (In Chinese) [Google Scholar] [CrossRef]
  48. Huang, C.H. Sediment Regimes under Different Slope and Surface Hydrologic Conditions. Soil Sci. Soc. Am. J. 1998, 62, 423–430. [Google Scholar] [CrossRef]
  49. Fu, Q.; Zhao, H.; Li, H.; Li, T.; Hou, R.; Liu, D.; Ji, Y.; Gao, Y.; Yu, P. Effects of biochar application during different periods on soil structures and water retention in seasonally frozen soil areas. Sci. Total. Environ. 2019, 694, 133732. [Google Scholar] [CrossRef] [PubMed]
  50. An, J.; Zheng, F.; Lu, J.; Li, G. Investigating the Role of Raindrop Impact on Hydrodynamic Mechanism of Soil Erosion Under Simulated Rainfall Conditions. Soil Sci. 2012, 177, 517–526. [Google Scholar] [CrossRef]
  51. Li, G.; Abrahams, A.D.; Atkinson, J.F. Correction factors in the determination of mean velocity of overland flow. Earth Surf. Process. Landf. 1996, 21, 509–515. [Google Scholar] [CrossRef]
  52. Foster, G.R.; Huggins, L.F.; Meyer, L.D. A Laboratory Study of Rill Hydraulics: II. Shear Stress Relationships. Trans. ASAE 1984, 27, 797–804. [Google Scholar] [CrossRef]
  53. Yang, C.T. Sediment Transport: Theory and Practice; McGraw Hill: New York, NY, USA, 1996; pp. 1–396. [Google Scholar]
  54. Polyakov, V.; Nearing, M. Sediment transport in rill flow under deposition and detachment conditions. Catena 2003, 51, 33–43. [Google Scholar] [CrossRef] [Green Version]
  55. Reichert, J.M.; Norton, L.D. Rill and interrill erodibility and sediment characteristics of clayey Australian Vertosols and a Ferrosol. Soil Res. 2013, 51, 1–9. [Google Scholar] [CrossRef]
  56. Wu, Y.; Ouyang, W.; Hao, Z.; Lin, C.; Liu, H.; Wang, Y. Assessment of soil erosion characteristics in response to temperature and precipitation in a freeze-thaw watershed. Geoderma 2018, 328, 56–65. [Google Scholar] [CrossRef]
  57. Lu, J.; Zhang, M.; Zhang, X.; Pei, W.; Bi, J. Experimental study on the freezing–thawing deformation of a silty clay. Cold Reg. Sci. Technol. 2018, 151, 19–27. [Google Scholar] [CrossRef]
  58. Głąba, T.; Palmowska, J.; Zaleski, T.; Gondekc, K. Effect of biochar application on soil hydrological properties and physical quality of sandy soil. Geoderma 2016, 281, 11–20. [Google Scholar] [CrossRef]
  59. Zheng, F.L.; Tang, K.L.; Zhou, P.H. Approach to the genesis and development of rill erosion on slope land and the way to control. J. Soil Water Conserv. 1987, 1, 36–48. (In Chinese) [Google Scholar]
  60. Lee, S.S.; Gantzer, C.J.; Thompson, A.L.; Anderson, S.H.; Ketcham, R. Using High-Resolution Computed Tomography Analysis to Characterize Soil-Surface Seals. Soil Sci. Soc. Am. J. 2008, 72, 1478–1485. [Google Scholar] [CrossRef]
  61. Lee, S.S.; Shah, H.S.; Awad, Y.; Kumar, S.; Ok, Y.S. Synergy effects of biochar and polyacrylamide on plants growth and soil erosion control. Environ. Earth Sci. 2015, 74, 2463–2473. [Google Scholar] [CrossRef]
  62. Han, P.; Ni, J.R.; Li, T.H. Headcut and Bank Landslip in Rill Evolution. J. Basic Sci. Eng. 2002, 10, 115–125. (In Chinese) [Google Scholar] [CrossRef]
  63. Léonard, J.; Richard, G. Estimation of runoff critical shear stress for soil erosion from soil shear strength. Catena 2004, 57, 233–249. [Google Scholar] [CrossRef]
  64. Wirtz, S.; Seeger, M.; Ries, J. Field experiments for understanding and quantification of rill erosion processes. Catena 2012, 91, 21–34. [Google Scholar] [CrossRef]
  65. Romero, C.C.; Stroosnijder, L.; Baigorria, G.A. Interrill and rill erodibility in the northern Andean Highlands. Catena 2007, 70, 105–113. [Google Scholar] [CrossRef]
  66. Nearing, M.A.; Norton, L.D.; Bulgakov, D.A.; Larionov, G.A.; West, L.T.; Dontsova, K.M. Hydraulics and erosion in eroding rills. Water Resour. Res. 1997, 33, 865–876. [Google Scholar] [CrossRef]
Figure 1. Geographical location and schematic diagram of experimental plots. Note: (a) Test location; (b) sketch map of experimental plots; (c) live picture of experimental plots(d) pictures of slope after simulated rainfall.
Sustainability 13 06984 g001
Figure 2. Runoff rate and soil loss rate in the quasi-stable stage (20–40 min). Note: a, b, c: the different letters represent significant differences. (A) shows the runoff and soil loss rate during stable 20 min in 2018, and (B) shows the runoff and soil loss rate during the quasi-stable period (20–40 min) in 2019.
Sustainability 13 06984 g002
Figure 3. The runoff sediment concentration decreased in the B6 and B12 treatments compared to the control. Note: The red box interval in the figure is the time period when rill erosion occurs. (A,B) shows that biochar treatment reduced runoff sediment content (0–40min) in 2018 and 2019. (C,D) shows the average value of sediment content in runoff reduced by biochar in the quasi-stable stage (20–40min) of runoff in 2018 and 2019.
Sustainability 13 06984 g003
Figure 4. Soil loss rate of the four slopes from 0–40 min under the three treatment conditions. The proportion of rill erosion in 2018 and 2019. Note: n = 3, according to ANOVA, different letters (a, b, c) indicate significant differences at p < 0.05. (A) shows the proportion of rill erosion to total erosion in 2018. (B) shows the proportion of rill erosion to total erosion in 2019.
Sustainability 13 06984 g004
Figure 5. Relationship between unit width rill erosion and shear stress, flow power and unit flow power in 2018 and 2019. Note: (A) shows the flow shear stress in rills in 2018 and 2019, (B) shows the stream power of rill flow in 2018 and 2019, (C) shows the unit stream power of rill flow in 2018 and 2019.
Sustainability 13 06984 g005
Figure 6. Correlation matrix of runoff and sediment process parameters with rill hydrodynamic characteristics and hydrodynamic mechanism in 2018 and 2019. Note: R is the correlation coefficient, when 0.3 < |R| ≤ 0.7, it is correlated at the level of p < 0.05, and when 0.7 < |R| ≤ 0.7, it is correlated at the level of p < 0.01.
Sustainability 13 06984 g006
Table 1. Slope and biochar content of 12 experimental plots.
Biochar Content
(kg m−2)
Slope (°)
1.83.65.47.2
0P1P4P7P10
6P2P5P8P11
12P3P6P9P12
Table 2. Headward erosion rate.
Slope
(°)
Biochar
(kg m−2)
Rill Headward Erosion Rate (cm min−1)
20182019
MaxMinMeanMaxMinMean
1.804.53 ± 1.87 a1.43 ± 0.65 a2.73 ± 0.45 a4.75 ± 1.52 a1.53 ± 0.78 a2.80 ± 0.33 a
64.38 ± 1.33 a1.31 ± 0.73 a2.64 ± 0.34 a4.43 ± 0.82 a1.43 ± 0.43 a2.54 ± 0.71 a
124.11 ± 1.08 a1.27 ± 0.58 a2.58 ± 0.47 a3.87 ± 0.68 a1.27 ± 0.37 a2.42 ± 0.25 a
3.607.04 ± 1.41 a1.59 ± 0.64 a3.41 ± 0.23 a7.13 ± 1.57 a1.64 ± 0.51 a3.57 ± 1.01 a
67.35 ± 1.57 a1.66 ± 0.61 a3.32 ± 0.36 a6.93 ± 2.48 a1.57 ± 0.78 a3.22 ± 0.74 a
127.44 ± 1.34 a1.73 ± 0.76 a3.18 ± 1.34 a6.88 ± 1.58 a1.33 ± 0.42 a3.17 ± 0.84 a
5.408.48 ± 1.58 a2.14 ± 0.52 a4.04 ± 0.86 a8.41 ± 1.47 a2.38 ± 0.45 a4.25 ± 1.42 a
68.29 ± 1.92 a2.33 ± 0.49 a4.02 ± 0.52 a7.95 ± 2.62 a1.79 ± 0.39 a3.59 ± 0.77 b
128.18 ± 1.39 a2.61 ± 0.83 a3.81 ± 0.49 a7.56 ± 1.24 a1.43 ± 0.60 b3.54 ± 0.39 b
7.2015.37 ± 2.21 a2.71 ± 0.59 a5.57 ± 0.92 a14.95 ± 3.44 a2.63 ± 0.45 a5.66 ± 1.72 a
614.96 ± 1.92 a2.89 ± 0.62 a5.38 ± 1.43 a12.11 ± 2.34 a1.94 ± 0.57 b4.58 ± 2.52 b
1214.78 ± 1.89 a3.06 ± 0.49 a4.82 ± 1.46 b10.58 ± 2.87 b1.73 ± 0.69 b4.09 ± 2.17 b
Note: n = 3, the result shows the mean ± standard deviation; according to ANOVA, different letters (a, b, c) indicate significant differences at p < 0.05.
Table 3. Hydraulic parameters of slope rill flow in 2018 and 2019.
Slope
(°)
Biochar
kg m−2
20182019
V (cm s−1) R e Fr f V (cm s−1) Re Fr f
1.8011.5 ± 0.8 a553.4 ± 61.8 a0.33 ± 0.02 a1.2 ± 0.22 a11.6 ± 1.05 a548.1 ± 163.9 a0.42 ± 0.02 a1.1 ± 0.26 a
610.7 ± 1.4 ab429.2 ± 85.0 b0.34 ± 0.02 a1.1 ± 0.32 a10.5 ± 1.22 ab404.2 ± 124.5 ab0.39 ± 0.01 a1.1 ± 0.34 a
1210.1 ± 1.2 b359.6 ± 69.8 c0.34 ± 0.03 a1.1 ± 0.17 a9.2 ± 0.85 b303.0 ± 113.3 b0.35 ± 0.07 a1.3 ± 0.41 a
3.6013.1 ± 1.6 a875.6 ± 133.5 a0.33 ± 0.04 a2.5 ± 0.36 a13.3 ± 0.50 a929.0 ± 98.8 a0.37 ± 0.03 a2.5 ± 0.38 a
612.4 ± 1.3 a793.3 ± 137.8 b0.33 ± 0.03 a2.7 ± 0.29 a11.1 ± 1.13 b577.1 ± 84.9 b0.36 ± 0.04 a2.7 ± 0.41 a
1211.1 ± 1.2 b586.1 ± 121.4 c0.32 ± 0.05 a2.8 ± 0.46 a10.2 ± 1.23 c491.9 ± 87.0 b0.33 ± 0.04 a3.0 ± 0.62 a
5.4016.3 ± 0.8 a1474.9 ± 157.8 a0.37 ± 0.03 a3.3 ± 0.28 a16.3 ± 0.87 a1467.1 ± 215.9 a0.38 ± 0.03 a3.3 ± 0.42 a
615.4 ± 0.9 b1341.2 ± 166.4 b0.34 ± 0.04 b3.5 ± 0.33 b14.9 ± 0.96 b1183.8 ± 235.2 a0.36 ± 0.05 a3.5 ± 0.45 a
1214.5 ± 1.6 c1083.7 ± 151.0 c0.34 ± 0.03 b3.5 ± 0.76 ab13.1 ± 1.09 c1059.4 ± 194.1 a0.32 ± 0.05 a4.6 ± 1.01 a
7.2020.6 ± 1.2 a2516.9 ± 132.5 a0.36 ± 0.04 a3.6 ± 0.37 a20.8 ± 1.02 a2482.5 ± 193.7 a0.38 ± 0.03 a3.6 ± 0.58 a
619.0 ± 1.3 b2269.7 ± 191.8 ab0.31 ± 0.05 b4.3 ± 0.23 b16.6 ± 0.99 b1537.7 ± 370.7 b0.37 ± 0.04 a4.3 ± 0.43 a
1218.6 ± 1.4 b2169.4 ± 252.4 b0.30 ± 0.03 b4.4 ± 0.27 b14.5 ± 1.05 c1359.5 ± 247.0 b0.31 ± 0.03 a5.7 ± 0.67 b
Note: n = 3, the result shows the mean ± standard deviation; according to ANOVA, different letters (a, b, c) indicate significant differences at p < 0.05.
Publisher’s Note: MDPI stays neutral with regard to jurisdictional claims in published maps and institutional affiliations.

